# Binalyze Knowledge Base
> Our mission is to deliver solutions that reduce incident response investigation times through unparalleled forensic-level visibility, automation, speed, and collaboration at scale.
---
# Home
> Source: https://kb.binalyze.ai/air/home/index.html
## Welcome to AIR's Documentation
This Knowledge Base will guide you through all the features of AIR.
[What is AIR?](what-is-the-platform)
[Terminology](terminology)
[Architecture](architecture/)
[Network Communication](network)
[Cloud Forensics](cloud-forensics)
---
# What is AIR?
> Source: https://kb.binalyze.ai/air/home/what-is-the-platform.html
AIR is an Automated Investigation and Response platform that delivers deep forensic visibility and end-to-end investigation capabilities at speed.
AIR combines the rapid remote acquisition of 759 evidence types with intelligent, efficiency-driven automation to drastically reduce investigation time, simplify workflows, and empower SOC and incident responders with accurate, collaborative insights, thereby boosting long-term cyber resilience.
AIR further accelerates investigations through **DRONE**—a powerful suite of integrated analyzers that automatically assess live assets and collected evidence. DRONE's findings across multiple assets are consolidated and visualized in a single pane of glass: the **AIR Investigation Hub**.
AIR will perform **simultaneous hunt and triage on thousands of assets using YARA, Sigma, and osquery rules**.
AIR protects employee privacy with targeted collections when required. It also captures the 'forensic state' of multiple assets and presents this information in an Investigation Hub.
The **Investigation Hub** serves as an all-encompassing, user-friendly DFIR intelligence resource. This unifying Investigation Hub consolidates Acquisition and Hunt/Triage data from all assets, presenting it in an easily digestible format. It also integrates DRONE analyzer findings through intuitive graphical visualizations, thereby identifying the most critical machines that warrant further immediate, focused investigation or remediation. The **Investigation Hub** streamlines the investigative process by:
* Providing actionable findings to prioritize and guide investigators,
* Offering comprehensive listings of all evidential artifacts,
* Including a range of advanced filtering options, and
* Featuring a powerful global search capability.
The AIR platform integrates with your existing SIEM, SOAR solutions, and many EDR products. This is done via Webhooks and an open API that empowers analysts to automate the response phase of IR.
So, all forensic collections can be scheduled, automated, remote, and scalable.
With evidence hashing, AES256 encryption, and RFC3161 time-stamping, the **Chain of Custody** for evidence handling by AIR is completely secure.
Other key features include our patent-pending **Baseline Comparison technology**. This allows you to be more proactive and focused in the way you target your efforts. Here, you can compare acquisitions against one another and easily identify additions, changes, and deletions to key system areas often exploited by attackers.
AIR helps you cut through the noise of security data with live YARA, Sigma, and osquery scanning combined with rapid keyword searching, automated post-acquisition analysis, and Event Scoring.
These features all combine to enable **most digital forensics investigations to be concluded in less than 4 hours** - which is a dramatic improvement over what is commonly achieved today with other solutions.
---
# Terminology
> Source: https://kb.binalyze.ai/air/home/terminology.html
## Acquisition Profile
A collection of evidence types, application artifacts, network captures, and custom content items grouped into reusable sets known as Acquisition Profiles. While several profiles are provided out-of-the-box, users can also create and customize their own, adding them to the Acquisition Profile Library, accessible via the Main Menu.
## AIR Console
The AIR Console is a web-based management interface that enables users to efficiently manage assets, assign tasks, and oversee the entire investigation lifecycle. From evidence acquisition to in-depth analysis, report generation, and case management, all activities are streamlined through the Investigation Hub. Users can also personalize their experience by switching between light and dark modes via the main menu, enhancing usability and visual comfort.
## Asset and Asset Status
In AIR, **an asset** is defined as any entity—whether a device, system, cloud account, or forensic image—on which AIR can perform evidence collection, task execution, and forensic analysis. Assets are the foundational elements crucial for responding to and hunting cyber threats.
### Asset Categories
The Asset section in AIR organizes assets into three distinct categories, each with its own tree view, filters, and tailored data grid columns:
**Devices**
Physical or virtual machines with deployed responders. This category includes:
* **Computers** — Traditional endpoints such as workstations and servers running Windows, macOS, Linux, Chrome, IBM AIX, or ESXi
* **Cloud Devices** — Virtual machines hosted on cloud platforms (Amazon AWS, Microsoft Azure, Google Cloud Platform) with deployed responders
Devices represent live systems with active responder communication, ready to receive tasking assignments.
**Disk Images**
Imported forensic images (RAW, E01, VMDK, VHD/X) mounted for analysis via the File Explorer. Disk images represent evidence sets captured from systems—either by AIR or third-party tools—that can be browsed, searched, and analyzed without requiring a live connection.
**Cloud**
Cloud accounts and tenants integrated for cloud evidence gathering, such as Microsoft 365 or Google Workspace. Unlike Cloud Devices (which are VMs with responders), the Cloud category represents account-level access for collecting cloud-native evidence like emails, files, and audit logs.
### Asset Status
An Asset can be in one of 3 states:
1. **Managed**: The asset's responder has been successfully deployed to the device and is ready to collect tasking assignments from the console.
2. **Unmanaged**: An asset is categorized as Unmanaged under two specific conditions:
* **Discovery without Deployment**: The asset is identified through Active Directory or Cloud Account scans, but does not have the AIR responder installed.
* **Unreachable with No Data**: The asset has been disconnected from the AIR console for over 30 days (Unreachable), and no forensic data from that asset is stored in the AIR console.
3. **Off-Network:** An asset is classified as Off-Network under two specific scenarios:
* **Data Supplied**: The asset has previously provided data through methods such as an **Off-Network Acquisition or a Hunt/Triage task**.
* **Unreachable with Stored Data**: The asset holds forensic data within the console but is currently inaccessible for further data collection or task assignments.
For both scenarios, investigation of the existing data is possible, and additional data can be manually imported as required.
The Assets Summary window on the home page can also report the asset as:
1. **Unreachable:** The asset's responder is currently unreachable. If an Asset's Responder fails to connect to the AIR console for over 30 days, its status changes to "unreachable." Until then, its status will be managed as online or offline.
2. **Update Required:** The responder on the asset requires an update to function correctly.
3. **Update Advised:** The responder is still functional, but for full functionality, an update is recommended.
4. **Isolated:** The asset is currently isolated from the network, except for communication with the AIR console.
## **Asset Management - Using Persistent Saved Filters**
**Persistent Saved Filters** enable users to create and store custom asset filters, making it easier to locate and manage assets without having to reapply filter conditions in each session.
## A Case
In AIR, a Case — can often be thought of simply as an 'investigation' — as it is where all related activity and evidence are grouped together. By collecting acquisitions, DRONE findings, timelines, interACT sessions and hunt results within a single case, AIR automatically builds a unified view of all of that activity in the Investigation Hub. This case-based approach gives investigators a clear, consolidated picture of their entire investigation in one place — the single pane of glass.
## Evidence Item
In AIR, evidence refers to any data collected from an asset during acquisition or triage that supports forensic investigation and incident response. This may include system metadata, logs, configuration information, user-activity traces, or other information useful in reconstructing events.
AIR organizes all collectible data into evidence items, each of which belongs to one of the defined evidence categories in the acquisition profile. An evidence item represents a specific data source with a clear description of what it contains and why it is relevant for investigation.
The current evidence categories are:
**1. System** - Core operating system information, including system configuration, environment details, and fundamental OS state.
**2. Memory** - Volatile memory sources such as RAM snapshots, memory sections, and other data that reflect live system state at the time of acquisition.
**3. Network** - Network-related evidence including connections, configurations, interface details, and network activity indicators.
**4. Event Logs** - Structured logs generated by the operating system that record authentication events, system changes, service activity, and other audit information.
**5. Disk & File System** - File system metadata, mount points, directory information, file activity indicators, and other disk-level sources that reflect how data is organized and accessed.
**6. Applications** - Evidence produced by installed or active applications, including logs, caches, configuration files, usage traces, and other application-specific data sources.
**7. Custom Content** - Items defined directly by the user based on file paths or directories of interest. This allows investigators to collect additional files or folders that fall outside the standard evidence set.
**8. osquery** - Items collected by executing osquery queries on the asset. These provide structured, table-driven insights into system and application state using the osquery framework.
## Evidence Repository
A remote location for saving evidence collected as a result of an AIR tasking. These include:
1. SMB
2. SFTP
3. FTPS
4. Amazon S3
5. Azure Blob
6. Network Shares
To create a New Repository, go to Settings in the Main Menu and select Evidence Repositories from the secondary Menu. From the window 'New Repository' complete the mandatory fields and select the type of repository you wish to add.
Read more details about [Evidence Repositories here.](../features/evidence-repositories/)
## Organizations
In AIR, an **organization** is a structural entity that allows for the separation of assets, users, and cases within a multi-tenant environment. The multi-tenancy capability of AIR enables a single console to manage multiple organizations, each with its own isolated environment. Here's how it works:
1. **Asset Management**: An asset (e.g., a device or endpoint) can belong to only one organization, ensuring clear boundaries between different organizational environments. However, within that organization, the same asset can be assigned to multiple cases.
2. **Case Management**: Cases could perhaps also be called 'investigations' or 'incidents', and they are also aligned to a specific organization. Access to cases can be restricted based on user privileges within that organization.
3. **Global and Organization-Specific Settings**: Certain settings, such as policies and evidence repositories, can be configured globally across all organizations or individually for each organization. This flexibility allows administrators to enforce global standards while still providing the ability to customize configurations at the organizational level when required.
4. **Policies and Evidence Repositories**: Policies can be applied either globally or on an organization-by-organization basis. For example, evidence repositories, which store collected data, can be aligned to all organizations (global) or set up uniquely for each organization, allowing for localized data control.
This multi-tenant architecture in AIR enables organizations to operate independently within the same platform, benefiting from both shared resources and isolated environments, depending on their specific needs.
## **Real-Time User Online Status Indicators**
Terminology: Real-Time User Online Status Indicators
User real-time status is shown throughout the AIR via colored dots—green for online, gray for offline—helping teams coordinate more effectively across the platform.
This live collaboration capability extends to the Investigation Hub where investigators can see real-time user presence, track comment updates, and observe evidence flag changes as they happen. These live updates allow multiple investigators to work simultaneously on the same evidence without needing to refresh the view. Every action—whether adding notes, updating findings, or adjusting flags—appears instantly for all connected users, creating a fully synchronized collaborative workspace within the Investigation Hub.
Terminology: Real time user presence in the Investigation Hub
In the Investigation Hub screenshot above, you can see that three users are currently active in this case. Their profile icons indicate not only who is present, but also where each person is working in real time. In this example, one user is viewing the Findings page, another is focused on the System Info evidence, and a third is examining the Amcache File evidence. This provides instant visibility into team activity and helps avoid duplication of effort during collaborative investigations.
## Responder
The AIR **responder** is a compact, cross-platform, zero-dependency, and zero-configuration package that functions as a virtual incident responder, delivering Level 3–4 SOC expertise directly to your assets.
Unlike 'agents' that constantly monitor systems and consume significant resources, AIR responders only activate to perform precise, user-defined DFIR tasks on demand. This approach enables the deployment of thousands of virtual responders across your IT ecosystem, ready to execute proactive and reactive incident response activities, such as evidence collection, threat hunting, and forensic-level analysis, as needed.
Binalyze's approach prioritizes efficient security enhancement, marrying minimal asset impact with maximum readiness and incident response capability.
Read more here: [Responder Deployment](#)
## Task
Operations are assigned to the assets by the AIR console, either manually or automatically via a trigger. A task can be assigned to multiple assets, and this is managed through 'task assignments.' Each individual assignment, known as a 'task assignment,' creates a one-to-one correspondence between the task assigned by the console and the specific asset on which the task assignment is executed, ensuring precise management and tracking across all assigned tasks.
Tasks could be either:
1. Manual: Assigned manually by users,
2. Scheduled: Created by users to start at a future date. Scheduled tasks can be either one-time or recurring (daily, weekly, or monthly).
3. Triggered: Assigned to the assets as a response to a trigger request, which is sent by a SIEM/SOAR/EDR solution.
## Triggers (Webhooks)
Triggers are the primary extensibility mechanism for AIR to receive alerts from other security suites, such as SIEM, SOAR, and EDRs.
A trigger is the combination of a parser, an acquisition profile, and a destination for saving the collected evidence (either local or remote).
AIR takes this to the next level by allowing the trigger to further automate the post-acquisition analysis by leveraging DRONE and MITRE\&CK scanners. In effect, the alert from your security tools can launch AIR into the collection of relevant forensic data, facilitate the analysis of that data, and deliver any DFIR findings into the Intelligence Hub with no analyst intervention required.
## Hunt/Triage
Hunt/Triage in AIR refers to searching for indicators of compromise, such as file hashes, processes, or malicious domains, across assets at scale. AIR provides built-in YARA, Sigma, and osquery capabilities, enabling analysts to detect anomalies in live systems, memory, and logs. Users can write their own rules or import large rule sets for rapid deployment, all of which are centrally stored and managed in the AIR Libraries to ensure consistency and collaboration across investigations.
## Modal
A **modal** is a user interface element that appears as an overlay on top of the main AIR Console interface. Modals temporarily focus user attention on a specific task or workflow, requiring interaction before returning to the main view.
In AIR, modals typically present step-by-step wizards that guide users through multi-stage processes such as:
- **Task creation** — configuring acquisition, imaging, or hunt/triage tasks
- **Scheduled task setup** — defining when and how often tasks should run
- **Responder deployment** — selecting deployment method and configuration options
- **Report generation** — customizing and exporting investigation reports
Modals ensure that complex workflows are completed in a structured sequence, reducing errors and simplifying the user experience.
---
# Components
> Source: https://kb.binalyze.ai/air/home/architecture/index.html
## Components
AIR is an on-premise or cloud-based, client-server solution that allows you to remotely perform various tasks on assets such as collecting forensic evidence and performing threat hunts with YARA, Sigma, or osquery.
### 1. Management Console
Management Console is a web-based application that can be viewed from any device with an up-to-date browser.
### 2. AIR Responders
Assets are connected to the management console via a lightweight "passive" responder that can be deployed manually or via other mechanisms such as SCCM.
#### 2.1. Passive Responder Explained
AIR responders;
* **DO NOT** scan anything on the asset that may cause slowdowns (e.g. your Antivirus),
* **DO NOT** block anything on the asset that may cause false positives (e.g. your DLP),
* **DO NOT** create any alerts that may cause "alert fatigue".
### 3. Communication with the Binalyze Domain
This domain is used by AIR Server instances to update artefacts like MITRE Attack Rules , docker compose files, update scripts, offline installer packages.
This domain is a container registry for AIR Server instances to update server components like the application server images, database images, caching server images etc.
:::caution
**A note on Cloud Infrastructure**
All of the web services and API backends listed above are hosted on Microsoft Azure preferably in East/West US Datacenters and protected by Cloudflare.
:::
## What data is sent or received by Binalyze domains
| Domain | Data Sent To Domain | Data Received From Domain |
| ------------------------------------------------------------- | -------------------------------------------------------------------------------------------------------------------------------------------------------------------------------------------------------------------------------------------------------------------------------------------------------------------------------------------------------------------------------------------------------------------------------------------------------------------------------------------------------------------------------------------------------------------------------------------------------- | -------------------------------------------------------------------- |
| [https://binalyze.com](https://binalyze.com/) | N/A | Version Information |
| [https://license.binalyze.com](https://license.binalyze.com/) | License Key | License Status Details |
| [https://api.binalyze.com](https://api.binalyze.com/) |
|
| [https://cr.binalyze.com](https://cr.binalyze.com/) | N/A | Binary Packages |
---
# AIR Responder Architecture; overview and performance analysis
> Source: https://kb.binalyze.ai/air/home/architecture/responder-architecture-overview-and-performance-analysis.html
### What is an AIR responder?
The AIR Responder is a compact, cross-platform, zero-dependency package that functions as a virtual incident responder, delivering Level 3–4 SOC investigative capability directly to your assets.
Responders interface with the AIR Console to execute precise, user-defined tasks while consuming minimal system resources. This design enables comprehensive investigative coverage without the overhead of continuous telemetry collection or real-time monitoring, improving both cyber resilience and operational efficiency.
The AIR responder maintains regular communication with the AIR Console using HTTP polling, which we commonly refer to as a "visit."
During each visit, the responder checks in with the AIR Console to:
* confirm that it is online and available
* retrieve any pending task assignments
* report task status or results
#### Visit interval
Responders communicate with the AIR Console at regular intervals. **Visit intervals are scaled dynamically** for large-scale deployments: the effective interval depends on the organization’s **total number of managed assets** and whether the console is **SaaS or on-premises**, using **environment-specific defaults**, a **scaling adjustment** above a fixed threshold, and **minimum and maximum bounds** so polling stays predictable and sustainable. Each **responder** uses the interval **calculated** for that combination—no per-asset manual tuning is required as the managed fleet grows or shrinks.
**Default visit interval** (organizations at or below the scaling threshold use this interval)
* SaaS deployments: 2 minutes
* On-prem deployments: 1 minute
**Scaling behavior**
When the number of **managed assets** exceeds **1,000**, the visit interval **increases** from the default according to the formula below. The result is **capped** so it never falls below the minimum or above the maximum for that environment.
**Scaling formula**
`interval = DEFAULT + (assets - 1000) × 3.33 ms`
Where **DEFAULT** is the base visit interval for the environment:
* 1 minute (on-prem)
* 2 minutes (SaaS)
**Bounds**
| Environment | Minimum interval | Maximum interval |
| ----------- | ---------------- | ---------------- |
| On-prem | 1 minute | 10 minutes |
| SaaS | 2 minutes | 20 minutes |
:::tip
**Example:** With **10,000 managed assets**, the visit interval is about **1 minute 30 seconds** (on-prem) or **2 minutes 30 seconds** (SaaS): the formula adds (10,000 − 1,000) × 3.33 ms ≈ 30 seconds to the default interval in each case (before any cap).
:::
This polling mechanism ensures that responders remain lightweight while still enabling rapid task execution across environments of any scale.
If the responder does not make a visit at the required interval, it will be shown as offline in the AIR console.
If the responder does not make a visit for 30 days, it will be marked as unreachable. This status will be resolved immediately once the asset is back online.
If the responder does not collect a task assignment within 30 days of its creation, it will expire and will not be actioned even when the asset reconnects and the responder visits next.
### How does the AIR responder work?
Simply put, when the AIR responder collects a task assignment from the AIR console, it carries out the task and provides a report back to the AIR console upon completion. On the other hand, when the AIR responder is in an idle state, it periodically (as discussed above) sends visit requests to the AIR console to check if any new tasks have been assigned to it. During these visit requests, the AIR responder only checks for task assignments and does not perform any other operations.
The AIR responder is capable of executing various tasks when assigned by the AIR Console. These tasks include:
* Acquisition
* Hunt/Triage scanning (YARA, Sigma, osquery, MITRE ATT\&CK)
* Isolation
* interACT sessions
* Auto Tagging
* Disk/Volume Imaging
* Investigation (Timeline)
* Baseline
* Log Retrieval
* Certificate Authority Update
* Migration
* Reboot
* Shutdown
* Update
* Uninstall
:::note
**Windows Safe Mode:** Windows restricts drivers and services in Safe Mode, which can affect console connectivity and remote tasking—similar to other forensic tools. You can still run the AIR Responder in Safe Mode when the environment is prepared correctly (for example **Safe Mode with Networking** and the registry entries that register the Responder service). See [Responder in Windows Safe Mode](../../setup/responder-deployment/responder-in-windows-safe-mode.md) for prerequisites and behavior with and without networking.
:::
Both the Acquisition and Disk Image tasks support uploading collected evidence to external repositories, including Amazon S3, Azure Blob Storage, Google Cloud Storage, FTPS, SFTP, and SMB. These tasks enable the AIR responder to securely transfer the acquired evidence or disk images to the designated repositories for storage and further analysis.
By utilizing the supported protocols and repositories, the AIR responder ensures that the collected evidence or disk images are transmitted and stored securely in the designated locations. This enables efficient storage, accessibility, and collaboration, facilitating the management and analysis of acquired data in a secure and scalable manner.
AIR has an option for Windows, macOS, and Linux AIR responders to transmit evidential collections directly to external evidence repositories, thereby efficiently minimizing the utilization of local disk space:
AIR Responder Architecture; overview and performance analysis: Tool Tip explaining Direct Collection for Evidence Repositories
### How is the AIR responder secured?
The AIR responder maintains robust security by implementing a range of measures, including:
**Encrypted Traffic:** The traffic between the AIR responder and the AIR Console, as well as between the AIR responder and any evidence repositories, is encrypted using TLS 1.2 and, if available on the server, TLS 1.3. If neither of these two TLS protocols is available, the connection will not be established. This ensures that data in transit is protected against interception and unauthorized access.
**Communication:** The AIR Console does not initiate the sending of task assignments to the AIR responder; rather, it is the AIR responder that initiates the interaction by asking the AIR Console if it has any tasking assignments ready for it to run. This approach significantly reduces the risk of various security attacks, as it controls the communication flow and reduces the AIR responder's exposure to external threats.
**Privileged Account Usage:** On macOS and Linux, the AIR responder uses the root account, while on Windows, it uses the system account. This level of access control makes it difficult for other users to tamper with the application, thereby enhancing its security.
**Regular Internal Penetration Testing:** Before every release, our internal penetration testing team conducts thorough penetration testing. This proactive approach helps identify and mitigate potential vulnerabilities.
**Secure Libraries and Third-Party Applications:** We consistently use updated and vulnerability-free libraries and third-party applications. This precaution in maintaining up-to-date software components protects against known security vulnerabilities.
**Supply Chain Attack Prevention:** Measures are in place to protect against supply chain attacks, and our DevOps team continuously improves these. This is crucial to prevent threats that could compromise the software development and deployment process.
**Continuous Source Code Scanning:** The source code is regularly scanned by security tools to identify potential vulnerabilities. This constant monitoring enables the quick identification and resolution of any security issues that arise in the codebase.
**Digital Signing:** The use of digital signatures adds a layer of security, ensuring the authenticity and integrity of our software. This helps prevent tampering and verifies that the software has not been altered after it was signed.
**Blackbox Analysis:** The binary undergoes Blackbox analysis, a method of testing the software’s external functioning without delving into its internal structure. This type of analysis has been performed on the AIR responder. It helps in identifying security vulnerabilities from an outsider’s perspective, providing a critical view of the system's external defenses.
**Graybox Analysis:** For the AIR responder project, Graybox analysis has been conducted. This testing method combines both the internal and external examination of the software, providing a more comprehensive security overview.
### Are databases used by the AIR responder?
Functioning like a server application, the AIR responder does not use databases. Instead, it operates by saving reports as individual files using SQLite. These reports are subsequently forwarded to the AIR Console. This approach simplifies the data handling process, enabling the efficient and secure storage and transfer of information.
### What is the Binalyze AIR design process?
We continuously advance our development process by implementing the SCRUM methodology, complemented by unit and integration testing. The use of both unit and integration testing is crucial for maintaining high-quality standards and ensuring that each component of our product functions seamlessly individually and as part of the whole system.
### Resource monitoring for the AIR responder
After the initial installation, it is normal to observe a small amount of memory being allocated, typically around 30MB to 40MB, with no significant CPU or disk usage during idle states. This behavior is expected and can be attributed to the necessary resources required for the AIR responder to function correctly.
During idle states, the AIR responder remains in standby mode, pending its next call to the Console to collect any new tasking assignments. The allocated memory is utilized to maintain the AIR responder's core functionality and to ensure prompt responsiveness when new tasks are assigned.
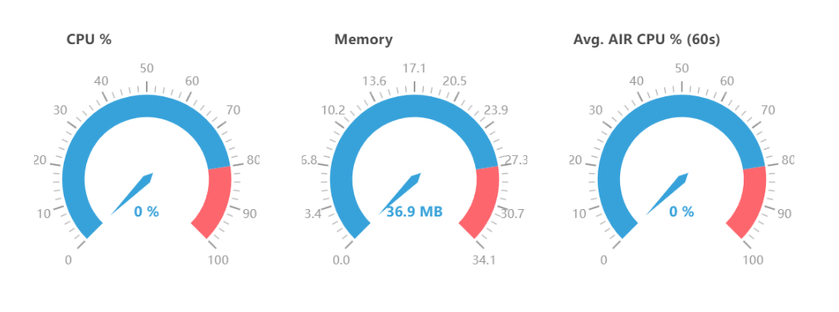
When the AIR responder receives an acquisition task, the evidence collection process is carried out by a subprocess called Tactical (or Incident Response Evidence Collector on Windows). During the acquisition process, it is normal to observe increased CPU and memory usage as the Tactical sub-process actively collects and processes the evidence.
The increase in CPU and memory usage is a result of the intensive data gathering and analysis performed by the Tactical sub-process. It utilizes system resources to capture and process the required evidence efficiently, ensuring the integrity and completeness of the collected data.
The extent of CPU and memory usage during the acquisition task may vary depending on factors such as the size and complexity of the evidence being collected. Once the acquisition is completed, the CPU and memory usage will typically return to normal levels, reflecting the completion of the resource-intensive task.
:::note
**If you prefer to limit CPU usage during acquisition or hunt and triage tasks, you have the option to set a CPU policy that restricts maximum CPU usage to a specified percentage. This setting, adjustable in the AIR Console before execution, allows you to limit CPU usage. Setting a lower percentage may extend task completion times.**
:::
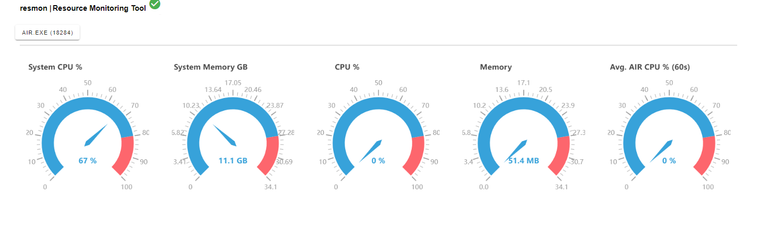
A **Hunt/Triage task** does not involve running the Tactical sub-process for evidence collection. Instead, the Hunt/Triage task is executed within the AIR responder, utilizing its internal capabilities to analyze and evaluate the collected data.
Although the CPU usage for a Hunt/Triage task is typically low, it is still possible to set a CPU policy for the task.
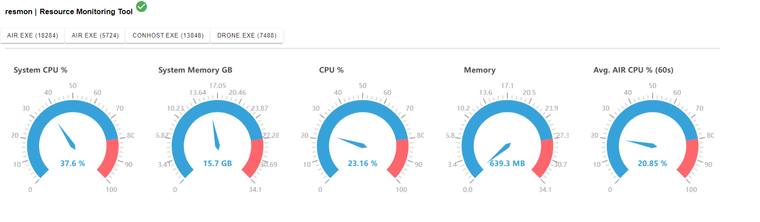
The log file of the running AIR responder provides valuable information about CPU usage, memory usage, and other system resources. Here is an example of the log entries about system and service resources:
1. `INFO 2024-01-04 18:45:25+03:00 2.31.2 triage: resmon: SysStats{GoHeapAlloc: 2.3 MB, GoHeapSys: 12 MB, NumGoroutines: 27, NumCPU: 16} file:pkg/resmon/handlers.go:16 func:resmon.(*LoggingStatsHandler).HandleSysStats`
2. `INFO 2024-01-04 18:45:26+03:00 2.31.2 triage: resmon: PidStats{PID: 9460, Name: AIR.exe, CPU: 14.7%, AvgCPU: 25.9%, Mem: 56 MB, NumFDs: 341, NumCPU: 16} file:pkg/resmon/handlers.go:21 func:resmon.(*LoggingStatsHandler).HandlePidStats`
The log file for the AIR responder can be found at the following location:
`C:\Program Files (x86)\Binalyze\AIR\agent\AIR.log.txt`
You can navigate this path on your system to access the log file and view the relevant information about CPU usage, memory usage, and other resources as logged by the AIR responder during its operation.
:::note
**These usages were observed on a system equipped with an Intel Core i7-10875H running at 2.30GHz (with 16 processors) and 32GB of memory (Windows 10 Pro).**
:::
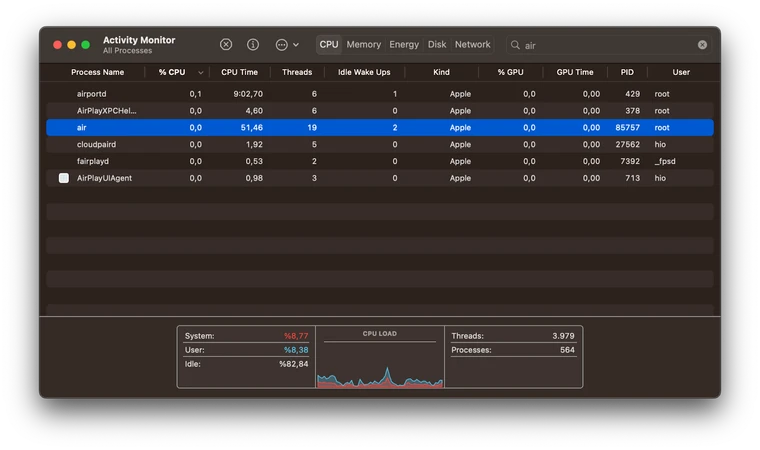
Similar scenarios can be observed on macOS with the built-in Activity Monitor application. To access detailed process information, simply click on the (i) button within the Activity Monitor.
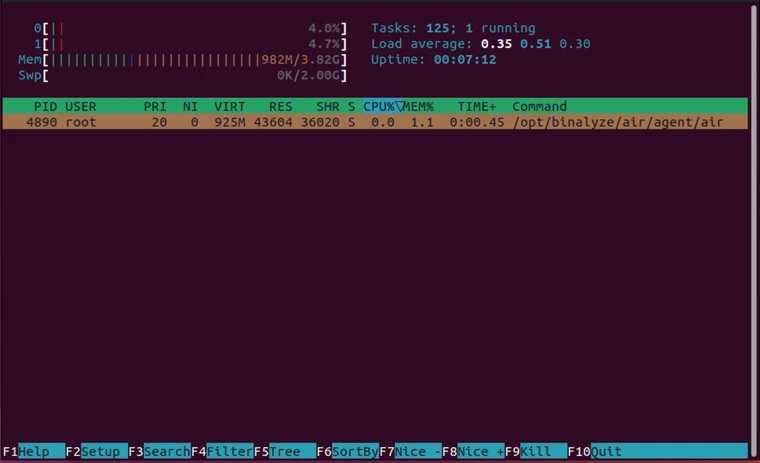
On Linux, an alternative option for resource monitoring is to use `htop` instead of the built-in app top. The `htop` option offers enhanced capabilities and can be installed by following these steps:
1. Open the terminal.
2. Run the command: sudo apt-get install `htop` (for Ubuntu/Debian-based distributions) or sudo yum install `htop` (for CentOS/Fedora-based distributions).
3. Once installed, type `htop` in the terminal and press Enter to launch the application.
Using `htop` provides a more comprehensive and user-friendly interface for monitoring system resources on Linux.
#### **Resource Monitoring with** `resmon`
There is also a CLI tool named `resmon` specifically developed for internal usage. It can be used to gather resource usage data related to the AIR responder and its subprocesses, storing them in a local database.
By default, `resmon` will monitor the AIR responder if no flags are given. However, you can monitor other processes by providing a PID flag or a process name flag. For more detailed information on its usage, a usage document for `resmon` can be provided upon request.
The information collected by `resmon` is stored in a local database, which includes numerous entries for the monitored process and its subprocesses. Due to the abundance of entries with comprehensive details, reading and interpreting the data can be a challenging task.
To address this, a script has been developed alongside `resmon` to visualize these outputs. It displays the CPU and memory usage of the processes (including subprocesses) monitored by `resmon` in a graphical format.
In the following section, we will share the `resmon` results as it monitored various task assignments being executed by the AIR responder. Throughout the tasks, `resmon` will continuously monitor the AIR responder and its subprocesses, generating a comprehensive local database that captures the output of resource monitoring.
For easy visualization, we will utilize a feature of a `resmon` designed to focus on visualizing its output by presenting the CPU and memory usage in intuitive graphical representations. These visualizations offer valuable insights into the resource utilization of the AIR responder and its subprocesses throughout each tasking assignment, from start to finish.
:::note
**The following scenarios were observed on a system equipped with an Intel Core i7-10875H running at 2.30GHz (with 16 processors) and 32GB of memory (Windows 10 Pro).**
:::
**Analysis of an Acquisition Task**
Below, you will find two graphs illustrating the CPU and Memory usage of the AIR responder. These graphs represent the resource utilization from the moment an acquisition task is started through to its completion.
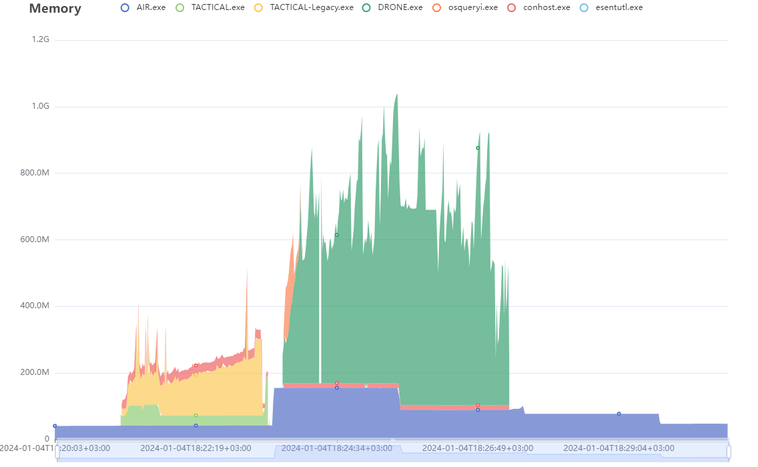
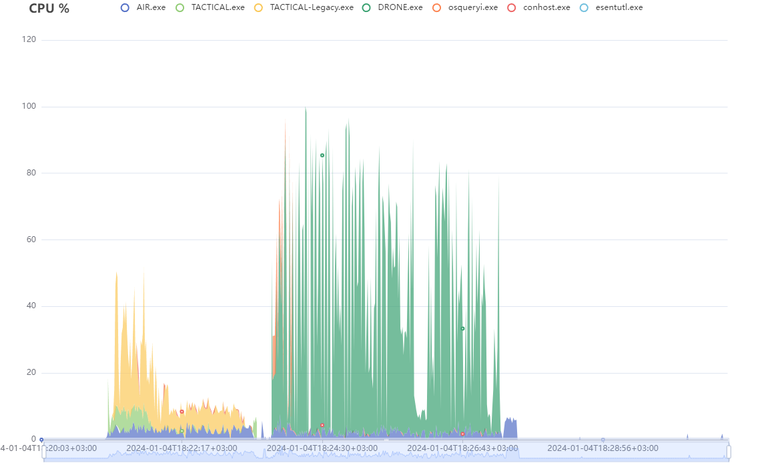
Duration
Report Size (Zipped)
Database Size
Event Record Count
Drone
Total Disk Space
Used Disk Space
Report Path
06m29s
199KB
38KB
10091
Enabled
512 GB
176 GB
├──  C
│   ├── Binalyze
│   │   ├── AIR
|   |   |   ├── Cases
|   |   |   |   ├── 20240104182105-DESKTOP-2LUEDF0.zip
**Analysis of an Acquisition Task (with CPU limit of 50%)**
In this scenario, we will examine the CPU and Memory usage of the AIR responder while running tasks received from the AIR Console, with a specific condition: the CPU usage of the AIR responder is limited to 50%.
:::note
**This limitation is possible due to the AIR responder's capability to control and restrict its CPU utilization during task execution.**
:::
The visualized graphs provided below depict the resource utilization, explicitly focusing on the CPU and Memory usage of the AIR responder. These graphs illustrate the performance of the AIR responder, highlighting its ability to effectively manage CPU allocation while executing tasks received from the AIR Console.
:::danger
**The script can occasionally display temporary CPU usage spikes that surpass the process's CPU limit as a result of aggregating subprocesses.**
:::
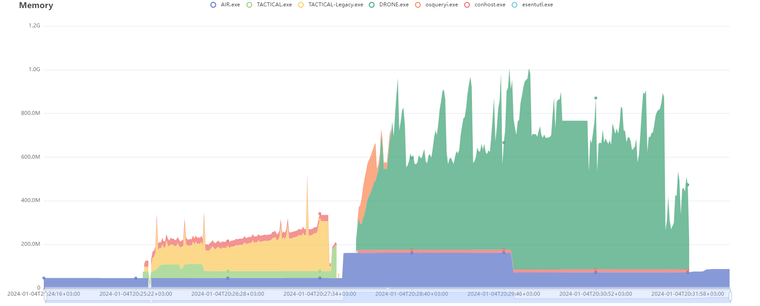
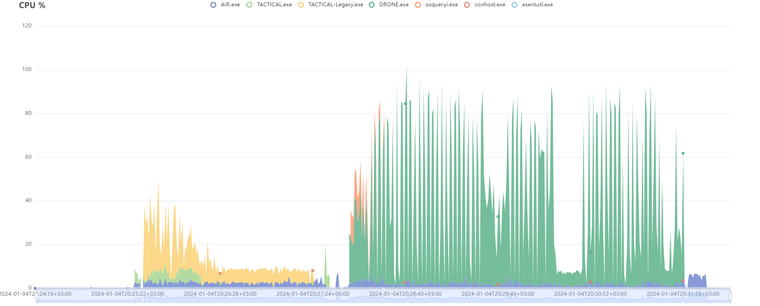
Duration
Report Size (Zipped)
Database Size
Event Record Count
Drone
Total Disk Space
Used Disk Space
Report Path
06m48s
200KB
39KB
10102
Enabled
512 GB
176 GB
├──  C
│   ├── Binalyze
│   │   ├── AIR
|   |   |   ├── Cases
|   |   |   |   ├── 20240104202526-DESKTOP-2LUEDF0.zip
**Analysis of a Hunt/Triage Task**
Let's examine the resource usage of the AIR responder when a Hunt/Triage task is received from the AIR Console.
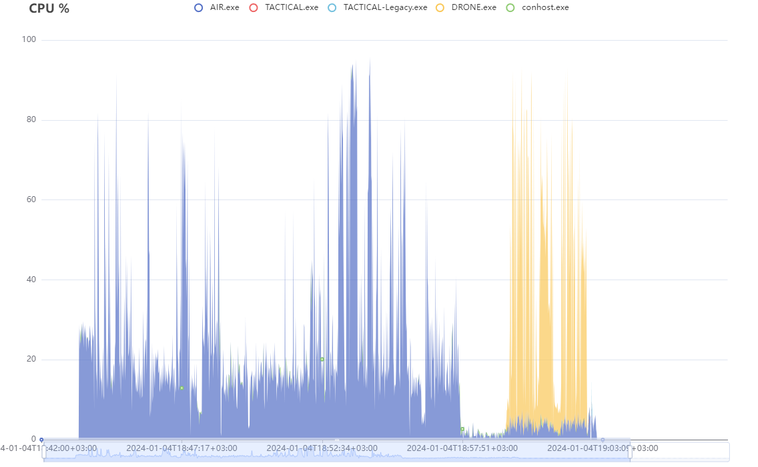
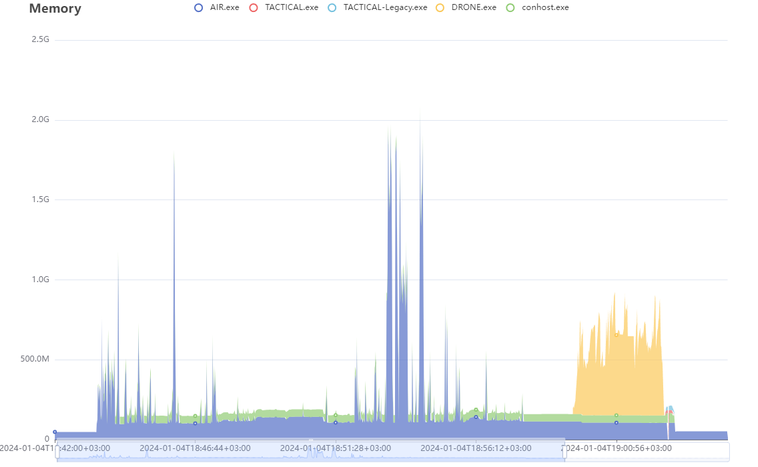
| **Duration** | **Hunt/Triage Rule Type** | **Total Disk Space** | **Used Disk Space** | **CPU Limit** |
| ------------ | -------------------- | -------------------- | ------------------- | ------------- |
| 19m33s | YARA | 512 GB | 176 GB | 100% |
**Analysis of a Hunt/Triage Task (with CPU limit of 50%)**
Similar to an acquisition task, a Hunt/Triage task can also be configured with a CPU limit for executing the AIR responder. The following graphs illustrate the resource usage of a Hunt/Triage task running with a CPU limit of 50%.
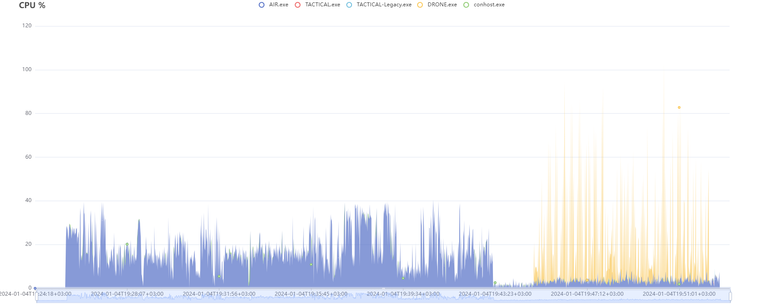
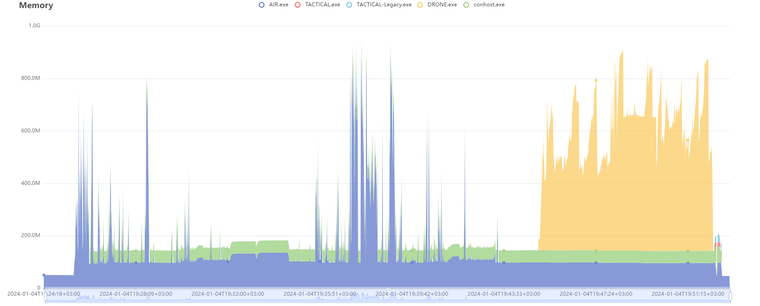
| **Duration** | **Hunt/Triage Rule Type** | **Total Disk Space** | **Used Disk Space** | **CPU Limit** |
| ------------ | -------------------- | -------------------- | ------------------- | ------------- |
| 27m09s | YARA | 512 GB | 176 GB | 50% |
---
# AIR Task Flow and Management
> Source: https://kb.binalyze.ai/air/home/architecture/task-flow-and-management.html
## Introduction
In today's dynamic digital environment, managing tasks efficiently within a software system is crucial for reliability, flexibility, and optimal performance. This guide explores a sophisticated task management system designed to handle a wide range of operational scenarios, focusing on task retrieval, execution, prioritization, and system resilience against failures and network disruptions.
Architecture: AIR Task Flow and Management
### Task Retrieval and Execution
#### The Role of the AIR Console
The AIR platform features an intuitive web-based console designed to orchestrate and dispatch tasks to designated remote AIR responders effectively. Serving as the nerve center for task allocation, this console guarantees that each task is accurately assigned for execution, optimizing operational efficiency. Within this ecosystem, assigning a specific task to a particular asset is termed a 'task assignment,' ensuring a clear, one-to-one correspondence between tasks and assets for precise management and tracking.
#### Mechanisms for Task Checking
To accommodate diverse operational needs and customer network policies, the system employs two primary mechanisms for task checking:
1. Regular Interval Checks: Tasks are checked on each **responder visit** (HTTP(S) polling to the Console). Visit intervals are **not fixed**: they **scale dynamically** with deployment type (SaaS vs on-prem) and organization size (managed asset count), within defined bounds—see [**Visit interval**](responder-architecture-overview-and-performance-analysis.md#visit-interval) in the responder architecture overview.
2. The NATS Protocol: For immediate task fetching or near real-time communications with assets, the system incorporates a specialized protocol named "NATS." This protocol is designed to bypass the standard checking intervals, allowing for urgent tasks to be retrieved and executed with minimal delay
:::tip
AIR does not use TLS for NATS traffic because no sensitive data is transmitted over it. NATS is only used to send a lightweight “ping” message when the AIR Console assigns a task to a Responder. After receiving this signal, the Responder immediately connects back to the AIR Console over HTTPS (port 443) to securely download the full task details
:::
**Task Checking Intervals**
Task-checking via HTTP(S) visits uses **dynamically scaled** intervals (from environment defaults up to a **maximum** of 10 minutes on-prem or 20 minutes in SaaS at very large scale), as described in the responder architecture documentation. **NATS** (when available) can prompt a responder to fetch a new assignment immediately, independent of the current visit schedule.
### Task Prioritization and Execution Order
#### Prioritization of Critical Tasks
Certain tasks, such as "cancel tasks," receive priority in the execution queue. This prioritization is crucial to prevent delays in the cancellation process, ensuring tasks are halted promptly when required.
#### Execution Order and FIFO Queue Model
The system employs a first-in, first-out (FIFO) queue model for task execution. This model ensures that tasks are processed in the order received, with special consideration given to tasks that might block or delay subsequent operations unnecessarily.
### Handling of Failed Tasks and Network Disruptions
#### Tasking Assignment interruptions
If a Tasking Assignment has been collected by the Responder but is interrupted before the completion of collection, triage, or analysis, the task will not resume where it left off. Instead, this interruption will result in a task failure. Such failures are automatically recorded within the console's tasking details.
When this occurs, the status of the task in the AIR console will reflect the failure, and it will be necessary to manually restart or initiate a new task to ensure that the intended data collection and analysis are completed. This approach ensures clarity and accuracy in managing task assignments, even in cases of unexpected interruptions.
#### Retry Mechanisms for File Uploads
For tasks that require file uploads, such as uploading to an evidence repository, the system includes built-in retry mechanisms. These mechanisms are activated to re-attempt uploads if network issues interrupt the process. The number of retries and the specific procedures for handling these retries vary depending on the task type and the destination of the file.
Additionally, if "direct collection" is enabled for an acquisition task and a failure occurs, the user must restart the acquisition process from the beginning. This ensures that all necessary data is properly collected without partial or corrupt files.
### Data Purging and Task Cancellation
A specialized "purge local" task type exists for efficiently cleaning up local data related to completed or failed tasks. This function is crucial for maintaining optimal disk space utilization and efficient system resource allocation.
### System Flexibility and Customer Policies
This guide emphasizes the importance of a flexible system that can adapt to diverse customer policies, including specific network configurations and security requirements. The choice of protocols and mechanisms for task management is influenced by these diverse operational needs.
### Documentation and System Improvements
Continuous improvement is a cornerstone of system development. The commitment to updating documentation reflects ongoing efforts to refine task management processes and system functionalities based on operational insights and technical advancements.
### Technical Implementation Details
The guide offers an in-depth examination of the system's technical underpinnings, including the utilization of the "NATS" protocol, dynamic adjustment of task-checking intervals, and the logic behind task prioritization and queue management. These details offer a comprehensive understanding of the system's operational logic and its capability to handle various scenarios efficiently.
### Conclusion
Efficient task management is pivotal in ensuring the reliability and performance of software systems. Through innovative mechanisms, such as the air console and NATS protocol, alongside dynamic task-checking intervals and a robust FIFO queue model, the system outlined in this guide represents a state-of-the-art solution for managing tasks in complex software environments. The emphasis on flexibility, resilience, and continuous improvement underscores the system's readiness to meet the evolving demands of modern digital operations.
---
# AIR Responder Processes and Services by Task Type
> Source: https://kb.binalyze.ai/air/home/architecture/responder-processes-and-services-by-task-type.html
## Overview
This page documents which processes and executables the AIR Responder runs on target endpoints during different task types. It is intended for teams who want to configure monitoring and alerting in their infrastructure monitoring tools — such as SIEM, EDR, or system monitoring platforms — to track AIR task execution patterns.
Use this reference to understand:
- Which processes run on target systems when a AIR task is initiated
- The operating system-level services and processes triggered by task execution
- The operational patterns these processes create while a task runs
## General Architecture
When a AIR task — Acquisition, Hunt/Triage, Full Text Search, Disk Image, or interACT — is initiated, the task is executed by the pre-installed AIR Responder service on the target endpoint.
:::note
No new or persistent services are added to the operating system during task execution. All operations are performed by temporary child processes spawned by the existing Responder service, and these processes terminate automatically when the task completes.
:::
## Main Services and Executables
The Responder installs a single service and a main executable per platform. Task execution is driven by this service and its child processes.
### Windows
- **Service name:** `Binalyze AIR Agent Service`
- **Main executable:** `AIR.exe`
### Linux
- **Service name:** `Binalyze.AIR.Agent`
- **Main executable:** `air`
### macOS
- **Service name:** `com.binalyze.air-agent`
- **Main executable:** `air`
## Processes by Task Type
The tables below list the processes spawned for each task type. Executable names are shown as `Windows` / `Linux · macOS` where they differ. All listed processes run as child processes of the AIR Responder and terminate when the task completes.
### Acquisition Tasks
| Process | Role |
|---------|------|
| `AIR.exe` / `air` | Main responder process |
| `TACTICAL.exe` / `tactical` | Evidence collection engine |
| `TACTICAL-Legacy.exe` | Legacy evidence collection engine (Windows only; runs when needed for specific evidence types) |
| `osqueryi.exe` / `osqueryi` | Runs only when osquery queries are defined |
| `DRONE.exe` / `drone` | Runs only when DRONE or MITRE ATT&CK Analyzer analysis is enabled |
### Hunt/Triage Tasks
| Process | Role |
|---------|------|
| `AIR.exe` / `air` | Main responder process |
| `AIR.exe` / `air` (isolated child process) | Dedicated child process used for scanning |
| YARA engine | Not a separate executable; runs as part of the scanning process |
| `osqueryi.exe` / `osqueryi` | osquery query execution |
| `DRONE.exe` / `drone` | Runs when the MITRE ATT&CK Analyzer is enabled or SIGMA scanning is performed |
### Disk Image Tasks
| Process | Role |
|---------|------|
| `AIR.exe` / `air` | Main responder process |
### Full Text Search Tasks
| Process | Role |
|---------|------|
| `AIR.exe` / `air` | Main responder process |
| `magellan.exe` / `magellan` | Full-text search engine; runs for the duration of the task, and temporary working files are cleaned up after the task completes |
### interACT Tasks
| Process | Role |
|---------|------|
| `AIR.exe` / `air` | Main responder process |
| `AIR.exe interact` / `air interact` | Separate child process for interactive sessions |
| `curl` | Spawned depending on operator commands |
| `osqueryi.exe` / `osqueryi` | Spawned depending on operator commands |
## Watchdog Process
The Responder includes a separate **watchdog** component (`WATCHDOG.exe` / `watchdog`) that is installed with the agent and runs periodically as part of the Responder's lifecycle.
The watchdog is **not** a process dynamically spawned during task execution. Instead, it is a continuous lifecycle component of the Responder that monitors the agent's health and integrity. For details on how the watchdog protects the Responder, see [Responder Tamper Detection](../../setup/responder-deployment/responder-tamper-detection.md).
## Important Notes
- All helper processes created during task execution run as child processes of the AIR Responder and terminate automatically when the task completes.
- No task type adds new or persistent services to the operating system.
- All processes are temporary and are cleaned up upon task completion.
- Each endpoint can run only one acquisition or disk image task at a time; other tasks queue automatically.
---
# Network Communication
> Source: https://kb.binalyze.ai/air/home/network.html
### **How Do Assets Communicate with the Console?**
All routine communication between assets and the AIR console is **initiated by the assets**—they do not receive incoming requests from external sources. Communication occurs through various protocols and channels:
### **Primary Communication Channels**
* **HTTPS (TCP 443)** – The main communication channel from assets to the console (e.g., `yourcompany.binalyze.io`).
* **WebSocket over HTTPS (TCP 443)** – Used for **interACT** features.
* **NATS (TCP 4222) (Optional)** – Supports real-time task pushes to assets. If this port is unavailable, AIR defaults to HTTP(S) polling for task retrieval.
* **DNS (UDP/TCP 53)** – Required for name resolution services.
### **External Communication**
* **HTTPS to `responder.cdn.binalyze.com`** – Used for **responder updates** and installation packages. If the CDN is unavailable, the AIR console acts as a fallback source.
### **Evidence Repository Communication (When Configured)**
* **Cloud Storage:** HTTPS communication to services like **Amazon S3 and Azure**.
* **Traditional Storage:** Supported via **SFTP, FTPS, or SMB**.
### **Proxy Support**
If a **proxy** is configured in your environment, assets can communicate using:
* **HTTP**
* **HTTPS**
* **SOCKS5**
## **Firewall Rules**
* The **console installer** automatically **adds inbound allow rules** for the required ports in the **Windows Firewall**.
* The **responder installer does not** modify firewall settings. You must ensure that enterprise firewall policies **allow assets to communicate with the console** over the required ports.
***
### **How Does the AIR UI Connect?**
The AIR user interface (UI) requires access to the following domains:
* [https://binalyze.com](https://binalyze.com)
* [https://cdn.binalyze.com](https://cdn.binalyze.com)
* [https://one.binalyze.com](https://one.binalyze.com)
* [https://kb.binalyze.com](https://kb.binalyze.com)
* [https://www.googletagmanager.com](https://www.googletagmanager.com)
## Domain Functions:
This domain is used by AIR Server instances to update artefacts like MITRE Attack Rules , docker compose files, update scripts, offline installer packages.
This domain is a container registry for AIR Server instances to update server components like the application server images, database images, caching server images, etc.
---
# Cloud Forensics
> Source: https://kb.binalyze.ai/air/home/cloud-forensics.html
Investigators and analysts can use the AIR platform to conduct investigations on machines located in **cloud platforms**. Our platform supports cloud-based virtual machines, as well as on-premise and off-network devices. Investigators and analysts can install responders on virtual machines located on the cloud infrastructure for investigations and analysis. **Amazon Web Services, Microsoft Azure, and Google Cloud Platform are all supported.**
We understand the unique challenges of investigating cloud-based attacks, such as **Business Email Compromise (BEC)**. That’s why we have introduced the Tornado preview version, a standalone desktop application designed to simplify evidence collection from Google Workspace and Microsoft Office 365. **Learn all about Tornado** [**here**](../features/tornado-preview-version/)**.**
Investigators and analysts can easily and quickly deploy responders to their cloud assets and immediately initiate investigations, compromise assessments, and threat-hunting activities. By leveraging the automation advantages of cloud platforms, users can easily deploy multiple responders using a single authorized cloud platform account.
After adding the authorized account to the Console, it enumerates the cloud platform to discover and list assets. Then, investigators and analysts can deploy responders to individual or multiple cloud assets with one click.
## Add Authorized User
Since different cloud platforms utilize distinct identity and access management infrastructures and employ different working mechanisms, their requirements may vary; however, ultimately, all we need is an authorized account with list and control permissions on cloud assets.
Investigators and analysts can add a cloud account to the Console using one of two methods:
**Method 1: From the Devices section**
1. From the Main Menu, select **Assets**, then select **Devices** from the Secondary Menu
2. Click **+ Add New** and select **Cloud Account**
3. Click the **Add Account** button for the cloud platform you want to add
**Method 2: From the Cloud section**
1. From the Main Menu, select **Assets**, then select **Cloud** from the Secondary Menu
2. Click **+ Add New** (or **Add your first Cloud Account** if no accounts exist)
3. Click the **Add Account** button for the cloud platform you want to add
The configurations that need to be performed according to the cloud platforms are listed below.
### Amazon Web Services Compute EC2
Either of the two methods mentioned above will redirect investigators and analysts to similar pages, allowing them to enter their account details. They can either enter their existing account details, which are given below, or use the cloud formation link provided by AIR to create a new account with enough permissions.
:::note
**Account Name:** Optional field.
**Access key ID:** Mandatory field and it must be filled with the value provided by AWS
**Secret access key:** Mandatory field and it must be filled with the value provided by AWS
**Organization:** Mandatory field and it must be selected from the Organization created on the AIR console. Every cloud account can be assigned to only one organization.
:::
The cloud account needs permissions to deploy the virtual machine AIR responder. Instead of attaching multiple AWS managed policies (for example `AmazonEC2ReadOnlyAccess`, `CloudWatchAgentServerPolicy`, `AmazonSSMManagedInstanceCore`, `AmazonSSMDirectoryServiceAccess`, `AmazonSSMMaintenanceWindowRole`, `AmazonSSMReadOnlyAccess`, or ad-hoc actions such as `ssm:CancelCommand`), **create a custom IAM policy** that contains only the minimum actions required, as shown below.
```json title="Minimum IAM policy (custom)"
{
"Version": "2012-10-17",
"Statement": [
{
"Sid": "BinalyzeAIR",
"Effect": "Allow",
"Action": [
"ec2:DescribeRegions",
"ec2:DescribeInstances",
"ssm:DescribeInstanceInformation",
"ssm:SendCommand",
"ssm:GetCommandInvocation",
"ssm:CancelCommand"
],
"Resource": "*"
}
]
}
```
The creation of an AWS Account with sufficient permissions flow is explained below.
1. Click on the URL and Create an Account
2. Open AWS Console -> IAM -> Users
3. Select the User -> Security Credentials -> Create Access Key
4. Fill out the Account Details Form
### Microsoft Azure Virtual Machines
Either two different ways mentioned above will redirect investigators and analysts to similar pages allowing them to enter account details. They can either enter their existing account details, which are given below or create a new account with enough permissions.
:::note
**Account Name:** Optional field.
**Application (client) ID:** Mandatory field and it must be filled with the value provided by Azure
**Subscription ID:** Mandatory field and it must be filled with the value provided by Azure
**Tenant ID:** Mandatory field and it must be filled with the value provided by Azure
**Key (Client Secret):** Mandatory field and it must be filled with the value provided by Azure
**Organization:** Mandatory field and it must be selected from the Organization created on the AIR console. Every cloud account can be assigned to only one organization.
:::
Cloud accounts need the following permissions to deploy the virtual machine responder.
:::note
**Reader** VirtualMachine Contributor
:::
The creation of an Azure Account with sufficient permissions flow is explained below.
1. Azure portal -> App Registrations -> New Registration
2. Assign required roles to the new app registration for the subscription
3. App Registrations -> Open the created App Registration
4. Certificates & Secrets -> Create a new client secret
5. Fill out the Account Details Form
### Google Cloud Platform
:::note
Google Cloud Platform support is available in AIR version 5.10+.
:::
GCP integration enables investigators and analysts to discover, synchronize, and deploy responders to Google Compute Engine VM instances. The integration uses GCP service accounts for authentication and requires a Google Cloud Storage (GCS) bucket for deployment scripts.
#### Adding a GCP Account
Navigate to **Integrations** → **Google Cloud Platform** → **Add Account**, or from **Assets** → **Cloud Devices** → **Google Cloud Platform** → **Add Account**.
Cloud Forensics: Adding a GCP Account
:::note
**Account Name:** Optional field.
**Project ID:** Mandatory field. Your GCP project identifier.
**Service Account Email:** Mandatory field. The email address of the service account.
**Private Key:** Mandatory field. The private key from your service account JSON file.
**Organization:** Mandatory field. Must be selected from Organizations created in the AIR Console.
**Bucket Name:** Required for Responder deployment. The name of your GCS bucket (see below).
:::
You can enter credentials manually or use **Import JSON** to upload the service account key file downloaded from GCP.
#### Creating a Service Account in GCP
1. In the GCP Console, navigate to **☰ → IAM & Admin → Service Accounts**
2. Click **Create Service Account**
3. Assign the following IAM roles:
:::note
**Required IAM Roles:**
- **Compute Viewer** — Read-only access to instances, disks, and zones
- **Storage Object Admin** — Upload and manage deployment scripts in GCS
- **Patch Job Executor** — Create and monitor OS Config patch jobs
- **Logs Viewer** — Read Cloud Logging entries for deployment status
:::
4. After creating the service account, go to **Keys** → **Add Key** → **Create new key** → Select **JSON**
5. The key file downloads automatically — use this to import credentials into AIR
#### Required GCP APIs
Ensure the following APIs are enabled in your GCP project:
| API | Purpose |
|-----|---------|
| **Compute Engine API** | Listing and reading VM instances |
| **OS Config API** | Creating and monitoring patch jobs for deployment |
| **Cloud Storage API** | Storing deployment scripts |
| **Cloud Logging API** | Reading deployment logs and status |
| **Cloud Resource Manager API** | Verifying credentials and project access |
:::caution
If the Cloud Resource Manager API is not enabled, you will receive an error when adding the account. Search for and enable this API in your GCP Console before retrying.
:::
#### Why a GCS Bucket is Required
Unlike AWS (SSM Run Command) and Azure (Run Command), GCP does not have a direct command execution API. Instead, GCP uses the **OS Config Agent** and **Patch Job** mechanism:
1. The deployment script is uploaded to your GCS bucket
2. A Patch Job is created via the OS Config API
3. The OS Config Agent on the VM downloads and executes the script
4. Results are written to Cloud Logging
If you attempt to deploy a Responder without configuring a bucket, you will see the following warning:
Cloud Forensics: GCS bucket required for Responder deployment
**To create a bucket:**
1. In GCP Console, go to **Cloud Storage** → **Buckets** → **Create**
2. Create a bucket in your preferred region
3. Return to AIR, edit your GCP account, and enter the bucket name
#### Deploying Responders to GCP Assets
Once your account and bucket are configured:
1. Navigate to **Assets** and locate your GCP instances
2. Select one or more assets
3. Click **More Actions** → **Deploy Responder**
:::note
**Best Practice:** When deploying to a large number of GCP assets, process them in batches of 50 at a time. Deploying to hundreds of assets simultaneously may trigger GCP API rate limiting.
:::
:::note
**Technical Deep Dive:** For detailed information about how GCP deployment works under the hood (script generation, patch job execution, and status monitoring), see [GCP Responder Deployment: Technical Details](gcp-deployment-technical-details).
:::
## Synchronization and Enumeration
The Console immediately starts to enumerate the cloud platform and retrieves the assets list and asset details after the cloud account is added. It discovers the assets depending on the permissions and authorizations of the cloud accounts. All discovered cloud VMs will be shown under **Devices → Cloud Devices** (e.g., Amazon AWS, Microsoft Azure, Google Cloud Platform) in the associated organization.
The assets and their details are displayed in the data grid when you select a cloud platform from the Secondary Menu. Assets with deployed AIR responders are shown in blue, while assets without responders are shown in grey.
:::note
If investigators or analysts do not sync the cloud account manually, AIR Console automatically syncs in 30 minutes and updates the asset list.
:::
## Responder Deployment
All deployment actions are considered tasks by the AIR Console and listed under the Tasks as responder Deployment tasks. Therefore, all responder **deployment actions** and their **status** can be seen on the **Tasks list**.
The primary advantage of responder deployment in a cloud platform is **automation**. Analysts and investigators don't need to choose the operating systems and their versions. They only assign deployment tasks to the associated devices, and all deployment processes are performed quicker and easier automatically.
Investigators and analysts can deploy responders to cloud assets:
1. From the Main Menu, select **Assets**, then expand **Devices → Cloud Devices** and select your cloud platform (e.g., Amazon AWS). All cloud VMs are listed in the data grid where you can search, filter, and view asset details.
2. Responders can be deployed individually, via multiple selection, or to all assets at once:
* **Individual deploy**: Click an asset to open its details, then click the **Deploy** button
* **Multiple selections**: Select assets using the checkboxes, then click **Actions → Deploy Responder**
* **Deploy to All Assets**: Click the three-dot menu next to the cloud platform name (e.g., Amazon AWS) and select **Deploy Responder**
---
# GCP Responder Deployment: Technical Details
> Source: https://kb.binalyze.ai/air/home/gcp-deployment-technical-details.html
This page provides in-depth technical information about how AIR deploys Responders to Google Cloud Platform assets. For basic GCP setup and configuration, see [Cloud Forensics](cloud-forensics.md#google-cloud-platform).
## Script Generation and Storage
When you deploy a Responder to a GCP asset, AIR generates a unique deployment script and stores it in your GCS bucket. The script filename is generated using a SHA-256 hash (truncated to 16 characters) of key deployment parameters:
- Console address and version
- Responder package version
- Organization ID and deployment token
- Relay server details (if configured)
- Connection route information (if applicable)
**GCS path format:**
```
gs:///air-responder-deploy-scripts/.ps1 (Windows)
gs:///air-responder-deploy-scripts/.sh (Linux)
```
If a script with identical parameters already exists, it is reused rather than re-uploaded.
## Patch Job Execution
The deployment uses GCP OS Config to execute the script on the target VM:
1. **ExecStep Configuration** — References the GCS object with bucket name, object path, and generation number
2. **Interpreter Selection** — PowerShell for Windows, Shell for Linux
3. **Patch Job Creation** — A patch job is created targeting the specific VM instance
**Patch job naming:**
- Display name: `binalyze-air-responder-deploy-`
- Description: `AIR Responder deployment on `
The patch job is configured with `rebootConfig: NEVER` to prevent automatic reboots after deployment.
## Status Monitoring
AIR monitors the patch job via the OS Config API, tracking:
- Job status (started, patching, succeeded, failed)
- Error messages
- Progress percentage
Deployment logs are retrieved from Cloud Logging to surface command output and error details.
## Prerequisites Checklist
| Component | Requirement |
|-----------|-------------|
| **OS Config Agent** | Must be installed and running on target VMs |
| **GCS Bucket** | Must exist and be accessible by service account |
| **IAM Roles** | Service account needs Storage Object Admin on bucket |
| **Network** | VMs must reach GCS and OS Config API endpoints |
---
# Setup
> Source: https://kb.binalyze.ai/air/setup/index.html
---
# Relay Server
> Source: https://kb.binalyze.ai/air/setup/relay-server/index.html
## RelayPro
[RelayPro](relay-server-pro)
## Legacy Relay Server (Deprecated)
:::caution
The legacy Relay Server is deprecated and will be phased out. Use RelayPro for new deployments.
:::
[What is Relay Server?](what-is-relay-server)
[Requirements for installation](requirements-for-installation)
[How to install a Relay Server on different Linux platforms](how-to-install-a-relay-server-on-different-linux-platforms)
[How to change IP address of Relay Server](how-to-change-ip-address-of-relay-server)
[How to install a Responder with Relay Server support](how-to-install-a-responder-with-relay-server-support)
[Proxy Configurations (Legacy)](proxy-configurations/)
[Service Management for Relay Server](service-management-for-relay-server)
[Whitelisting for Relay Server](whitelisting-for-relay-server)
[Retrieving metrics from Relay Server](retrieving-metrics-from-relay-server)
[Updating and Uninstalling Relay Server](updating-and-uninstalling-relay-server)
[Troubleshooting](troubleshooting)
---
# RelayPro
> Source: https://kb.binalyze.ai/air/setup/relay-server/relay-server-pro.html
:::note
RelayPro is available starting with **AIR version 5.4** and represents the next generation of secure relay communications for Binalyze AIR.
:::
## Overview
The RelayPro relay server is a specialized, authenticated proxy server designed to provide secure connections between AIR Responders and the AIR console. It acts as an intermediary relay that validates every Responder connection and securely forwards traffic to the AIR console. RelayPro is purpose-built for AIR and is not intended for general proxy use cases.
Unlike the deprecated Relay Server, RelayPro does **not** require a Responder to be installed on the same machine. This separation reduces the overall attack surface and aligns with modern zero-trust and least-privilege design principles.
:::caution
The legacy Relay Server will be deprecated in a future release (planned for early 2026). Both RelayPro and the legacy Relay Server will run in parallel during the transition period.
:::
## How it Works
All Responder connections use HTTPS for secure communication and must complete a two-step authentication flow:
1. **Initial authentication** — the Responder authenticates with RelayPro using JWT credentials.
2. **Secure forwarding** — RelayPro validates the token and forwards authorized requests to the AIR console only when the target address and port are allowed.
This flow ensures only authorized Responders can establish connections to the AIR console.
### Security Features
- **Unique authentication** — each Responder receives its own time-limited JWT tokens
- **Enhanced encryption** — token encryption keys are derived uniquely per Responder
- **Zero persistence** — encryption keys are not shared between Responders or stored permanently
- **Resilient design** — if RelayPro restarts, existing valid tokens remain functional
- **Modern JSON logging** — logs are stored locally on the RelayPro server (not retrievable remotely)
## Network Ports
RelayPro uses the same network ports as Responders connecting directly to the AIR console:
- **443 (HTTPS)** — required
- **80 (HTTP)** — optional, used only for HTTP reachability tests when HTTPS is unavailable
- **4222 (NATS)** — optional, used when NATS is enabled in the AIR console
## Key Differences from the Legacy Relay Server
- **Independent deployment** — no Responder required on the RelayPro host
- **Enhanced security** — HTTPS + JWT authentication instead of SOCKS5 without authentication
- **Manual management** — installation/upgrade/uninstallation are attended by admins
- **Logging changes** — local-only JSON logs; remote log fetch is not supported
- **Configuration flexibility** — more adjustable configuration options
## Download and Install
### Download the Package
1. In the AIR console, go to **Organization Settings** → **Relay Server**.
2. Select **New Relay**.
3. Choose **New RelayPro**.
4. Download the package for your platform/architecture.
RelayPro is available as **.deb** and **.rpm** packages.
RelayPro: Create a new RelayPro from Organization Settings
RelayPro: Download the RelayPro package and review prerequisites
### Prerequisites
- Linux only (currently supported)
- **Architecture:** amd64 (x86_64) or arm64 (aarch64)
- **Linux Kernel:** 3.9 or later
- **systemd:** 231 or later
- **Responder version:** 2.79 or later
Standard, up-to-date Linux distributions typically meet these requirements.
### Installation Commands
RelayPro uses environment variables during installation to register with the AIR console. **Always set them first and use `sudo -E`** to preserve the environment.
```bash
export AIR_CONSOLE_ADDRESS=your-console-address
export AIR_ORGANIZATION_ID=your-organization-id
export AIR_DEPLOYMENT_TOKEN=your-deployment-token
```
For **.deb** packages:
```bash
sudo -E dpkg -i ./binalyze-air-relaypro__.deb
```
For **.rpm** packages:
```bash
sudo -E dnf install -y ./binalyze-air-relaypro__.rpm
```
Example:
```bash
export AIR_CONSOLE_ADDRESS=192.168.1.100
export AIR_ORGANIZATION_ID=0
export AIR_DEPLOYMENT_TOKEN=1234567890abcdef
sudo -E dpkg -i ./binalyze-air-relaypro_1.0.0_amd64.deb
```
RelayPro: Example RelayPro installation on Linux
### Package Details
- **Package name:** `binalyze-air-relaypro`
- **Service name:** `binalyze-air-relaypro.service` (systemd)
- **Installation directory:** `/opt/binalyze/air/relaypro`
The installation directory includes the RelayPro binary, logs, and a configuration file. Logging is enabled by default and is fully configurable.
## Registration and Status
After installation and service start, RelayPro registers with the AIR console. On success, it updates `/opt/binalyze/air/relaypro/config.yml` with:
- `relayId`
- `registeredTo`
- `securityToken`
:::caution
If the environment variables are incorrect, registration will fail. RelayPro will keep retrying registration and **will not activate its proxy modules** until registration succeeds.
:::
You can verify status in:
- **Config file:** `/opt/binalyze/air/relaypro/config.yml`
- **AIR console:** **Organization Settings** → **Relay Server**
RelayPro: RelayPro registered and visible in the Relay Server list
## Relay URL (Mandatory)
:::caution
You **must** set the **Relay URL** to finalize RelayPro registration. Until the Relay URL is set, the RelayPro will **not** appear as an available connection route for Responders, and it will not be selectable during asset installer generation.
:::
1. Go to **Organization Settings** → **Relay Server**.
2. Click the RelayPro **Name** to open its details.
3. Enter the **Relay URL** and save.
The Relay URL **must include the port**, for example:
```
https://relaypro.example.com:9443
```
If you use an intermediate proxy or load balancer, set the Relay URL to the **first hop** your Responders connect to:
```
https://intermediate-proxy.example.com:443
```
The Relay URL is the **advertised URL** of RelayPro and is what Responders will use to connect.
## Assign Responders and Connection Route
When a RelayPro is registered and its Relay URL is set, it becomes available in **Connection Route** settings.
RelayPro: Edit Connection Route from the Assets list
RelayPro: Open the Connection Route selector from the Asset Info page
RelayPro: Select RelayPro as the connection route
If a Responder is switched to **Direct Connection to the AIR console** after previously using RelayPro:
- The Responder will attempt direct connection first.
- If direct connection fails, it will continue to use RelayPro while periodically re-checking direct availability.
- Once direct connection succeeds, the Responder stops using RelayPro.
## Service Management
RelayPro runs as a systemd service and operates as a non-root user `air-relaypro`. The user and group are created automatically during installation.
```bash
sudo systemctl stop binalyze-air-relaypro
sudo systemctl start binalyze-air-relaypro
sudo systemctl restart binalyze-air-relaypro
sudo systemctl status binalyze-air-relaypro
sudo systemctl reload binalyze-air-relaypro
```
:::caution
Restarting the service drops existing connections. Avoid frequent restarts to maintain stable Responder connectivity.
:::
If you uninstall RelayPro, remove the `air-relaypro` user and group manually afterward.
## Configuration
RelayPro configuration is stored in:
```
/opt/binalyze/air/relaypro/config.yml
```
Normally, you should not edit this file manually. Common reasons to update it include:
- Changing HTTPS proxy listener address/port
- Adjusting log file locations or rotation settings
- Changing CA certificate file or private file locations
- Manually configuring console addresses for migration
### Core Configuration Fields
| Field | Type | Required | Description |
| --- | --- | --- | --- |
| `consoleAddress` | string | Yes | Address of the AIR console |
| `registeredTo` | string | Yes | Console address this RelayPro is registered to |
| `organizationId` | integer | Yes | Organization ID provided during installation |
### Optional or Temporary Configuration Fields
| Field | Type | Required | Description |
| --- | --- | --- | --- |
| `relayProId` | string | Yes | Unique RelayPro instance ID (generated if missing) |
| `relayId` | integer | Yes | Relay ID provided by the AIR console during registration |
| `securityToken` | string | Yes | Token used to authenticate RelayPro requests |
| `consoleCACert` | string | Yes | CA certificate in x509 PEM format |
| `proxyEnabled` | bool | Yes | Use system proxy to connect and forward traffic |
| `debugLogging` | bool | Yes | Enable debug logging |
| `deploymentToken` | string | No | Token used during registration (cleared after) |
| `serverName` | string | No | Server name for auto-generated TLS certificates |
| `privateFolder` | string | No | Path to private data folder |
| `passwordFile` | string | No | Password file for testing-only authentication |
| `clientAuthToken` | object | No | JWT token duration settings |
| `httpsProxy` | object | No | HTTPS proxy listener configuration |
| `migration` | object | No | Console migration information |
| `logger` | object | No | Logger configuration |
### Example Configuration
```yaml
## Core connection settings
consoleAddress: "console.binalyze.com"
registeredTo: "console.binalyze.com"
organizationId: 1
relayProId: "e915b65b-ad83-4e81-991b-f236c1f90ad2"
relayId: 3
securityToken: "6a635b1d-398e-4a38-a908-4c53d75a641a"
consoleCACert: "-----BEGIN CERTIFICATE-----..."
## Optional proxy and debug logging settings
# proxyEnabled: true
# debugLogging: false
## Optional settings
# privateFolder: "/var/lib/relaypro/private"
# passwordFile: "/var/lib/relaypro/private/password.txt"
## Optional HTTPS proxy configuration
# httpsProxy:
# listen: "0.0.0.0:8080"
## Optional migration settings
# migration:
# consoleAddress: "new-console.binalyze.com"
# validUntilAt: "2026-12-31T23:59:59Z"
## Optional logger configuration
# logger:
# fileName: "relaypro.log.txt"
# maxSize: "5GiB"
# maxAge: "1week"
# maxBackups: 10
# noCompress: false
```
### Logger Configuration (Environment Variable)
RelayPro merges logger configuration from the config file and the environment variable. The environment variable has higher priority.
```
RELAYPRO_LOGGER_CONF=fileName=relaypro.log.txt,maxSize=5GiB,maxAge=1week,maxBackups=10,noCompress=false
```
### Reload vs Restart
Changes requiring **service restart**:
- `privateFolder`
- `serverName`
- `httpsProxy`
- `logger`
Changes applied on **reload**:
- `consoleAddress`
- `registeredTo`
- `relayProId`
- `securityToken`
- `relayId`
- `debugLogging`
- `proxyEnabled`
- `consoleCACert`
- `clientAuthToken`
- `migration`
## HTTPS Proxy Listener
RelayPro includes a built-in HTTPS proxy server. It is enabled by default and listens on `0.0.0.0:9443`.
Example configuration:
```yaml
httpsProxy:
listen: "0.0.0.0:8443"
```
Set the **Relay URL** in the AIR console to match the advertised address and port:
```
https://relaypro.example.com:9443
```
If you use an intermediate proxy or load balancer, set the Relay URL to that external endpoint:
```
https://intermediate-proxy.example.com:443
```
### HTTPS and HTTP Listener Environment Variables
- `RELAYPRO_HTTPS_LISTEN` — configure the HTTPS listener
- `RELAYPRO_HTTP_LISTEN` — enable an HTTP listener (disabled by default)
:::caution
If you enable the HTTP listener, you are responsible for ensuring it is not exposed to the public internet and is protected by your internal network controls.
:::
## Password File (Testing Only)
Password-based authentication is intended for testing. After testing, remove the password file from config/env and reload.
Example password file:
```
username1:password1
username2:password2
```
Example test request:
```bash
https_proxy=https://127.0.0.1:9443 \
curl --proxy-user username1:password1 \
--proxy-insecure -k https://your-air-console.binalyze.com/api/app/check
```
You can set a password file via `RELAYPRO_PASSWORD_FILE` without editing the config file.
## CA Bundle File
RelayPro generates a **CA bundle** at startup if one does not exist. This bundle is used to:
- Generate TLS certificates for clients
- Derive encryption keys for JWT token protection
If the CA bundle changes, Responders will re-authenticate and update their certificates, which invalidates existing JWT token encryption. **Back up the CA bundle** and keep it safe.
Multiple RelayPro instances can share the same CA bundle for clustering scenarios.
You can specify the CA bundle path via:
```
RELAYPRO_CA_BUNDLE_FILE
```
RelayPro supports PEM-encoded certificates with RSA private keys (PKCS#1 only).
## Environment Variables
Recommended location for environment variables:
```
/etc/environment.d/binalyze-air-relaypro.conf
```
RelayPro supports standard proxy variables for RelayPro → AIR console connections:
- `HTTPS_PROXY`
- `HTTP_PROXY`
- `NO_PROXY`
Lowercase variants are also supported. RelayPro uses the CONNECT method when communicating via a proxy.
## Upgrade
RelayPro has an independent release cycle (separate from Responder versioning). Upgrade only when notified by AIR release notes.
To upgrade:
1. Download the latest RelayPro package for your platform.
2. Install it using the same package manager.
During an upgrade:
- A temporary RelayPro process starts
- The old process drains existing connections
- The new process takes over
- The temporary process stops after connections close
If anything goes wrong during the update, interrupt it and restart the update process. If the issue persists, stop the RelayPro service and retry the update.
Check status and logs during the upgrade:
```bash
sudo systemctl status binalyze-air-relaypro
```
Enable debug logging during upgrade and disable it afterward. No system reboot is required.
## Uninstall
Before uninstalling, remove the RelayPro from the AIR console:
**Organization Settings** → **Relay Server** → Remove RelayPro
Then uninstall:
```bash
# For deb packages
sudo apt-get remove binalyze-air-relaypro
# For rpm packages
sudo dnf erase binalyze-air-relaypro
```
Cleanup remaining files and users:
```bash
sudo rm -rf /opt/binalyze/air/relaypro
sudo rm -rf /etc/environment.d/binalyze-air-relaypro.conf
sudo userdel -r air-relaypro
sudo groupdel air-relaypro
```
## Migration from Legacy Relay Server
When migrating, plan a staged rollout:
1. Identify target Responders.
2. Verify compatibility — Responders should run **v2.74.1 or later** for RelayPro compatibility.
3. Install RelayPro.
4. Configure RelayPro.
5. In the AIR console, go to **Organization Settings** → **Relay Server**, and **set the Relay URL**.
6. Assign one or more Responders to RelayPro.
7. Verify connectivity (may take several minutes).
8. Optional: install a new Responder via **New Asset** → **Choose a Connection Route** to validate.
9. Migrate remaining Responders.
10. Keep the legacy Relay Server available for rollback if needed.
11. If issues occur, contact Support and revert if required.
RelayPro is a distinct product and can be installed on the same machine as the legacy Relay Server.
---
# Proxy configurations
> Source: https://kb.binalyze.ai/air/setup/relay-server/proxy-configurations/index.html
Like the responder, the Relay Server has the capability to proxy connections through a proxy server when communicating with responders or the AIR console. This provides flexibility in terms of configuring proxies for the responder, which connects through a Relay Server, or setting a proxy specifically for the Relay Server. Additionally, it is also possible to set proxies for both the responder and the Relay Server simultaneously. The diagram below illustrates all the possibilities for proxying the Relay Server and the responder.
AIR Relay Server: Proxy Configurations
[Adding proxy to Relay Server](adding-proxy-to-relay-server)
Responder proxy configuration has been moved to **Setup > Responder > Proxy Configurations**. See [Adding proxy to Responder](../../responder-deployment/proxy-configurations/adding-proxy-to-responder).
---
# Adding proxy to Relay Server
> Source: https://kb.binalyze.ai/air/setup/relay-server/proxy-configurations/adding-proxy-to-relay-server.html
To add the proxy configuration to Relay Server, you can modify the `/etc/profile` file by following these steps:
1. Open a terminal or command line session.
2. Open the `/etc/profile` file in your favorite editor with administrative privileges:
```
sudo vim /etc/profile
```
3. Scroll to the end of the file and add the following lines:
```
export AIR_HTTP_PROXY=proxy.example.com:3128
export AIR_HTTPS_PROXY=proxy.example.com:4128
export AIR_NO_PROXY=localhost,127.0.0.0/8,::1
```
Alternatively, you can use the following method to set proxy settings, but be aware that it will impact the proxy behavior of other programs.
```
export HTTP_PROXY=proxy.example.com:3128
export HTTPS_PROXY=proxy.example.com:4128
export NO_PROXY=localhost,127.0.0.0/8,::1
```
Save the changes and exit the text editor.
4. To apply the changes, restart your system:
```
sudo reboot
```
By adding these lines to the `/etc/profile` file, the specified proxy settings will be exported as environment variables.
---
# What is Relay Server?
> Source: https://kb.binalyze.ai/air/setup/relay-server/what-is-relay-server.html
AIR Relay Server is a specialized SOCKS5 proxy server specifically designed to facilitate communication between AIR responders and the AIR console. Its primary function is to act as an intermediary, enabling the seamless proxying of connections between the responders and the console.
With Relay Server, you can enhance the security of both responders and the console by only granting access via the Relay Server, eliminating the requirement for direct access to the AIR console from the responder environment.
This indirect access approach adds an extra layer of protection to the overall system architecture.
:::note
**The Relay Server functionality in an AIR deployment is not automatically available for all users. This feature's availability is contingent upon specific license configurations.**
**Users considering the installation and configuration of a Relay Server should liaise with their Binalyze installation advisor as part of the setup process.**
:::
**Considerations for Relay Server Setup:**
* **Public IP Requirement:**
* The need for a public IP address for the Relay Server depends on its intended use and positioning.
* If the Relay Server is set up for internet-facing properties, a public IP address or a Fully Qualified Domain Name (FQDN) might be required.
* For a Relay Server intended for internal network entities, a public IP address is not necessary.
* **Use Case for Managed Security Service Providers (MSSPs):**
* In scenarios where the Relay Server is used by MSSPs for external entities, it is likely that a public IP or FQDN will be needed.
---
# Requirements for installation
> Source: https://kb.binalyze.ai/air/setup/relay-server/requirements-for-installation.html
To ensure a successful installation of Relay Server, it is necessary to have a Linux operating system based on either Debian or Redhat, with a minimum kernel version of 3.9.0. This requirement guarantees compatibility and optimal performance.
:::caution
**The Relay Server functionality in an AIR deployment is not automatically available for all users. This feature's availability is contingent upon specific license configurations.**
**Users considering the installation and configuration of a Relay Server should liaise with their Binalyze installation advisor as part of the setup process.**
:::
Currently, the supported versions for Relay Server are as follows:
* Debian 7 and above
* RHEL (Red Hat Enterprise Linux) 7 and above
* CentOS 7 and above
* Fedora 21 and above
* Ubuntu 14.04 and above
* Pardus 17 and above
Please note that this list may be subject to updates, and you can always refer to the download page and click on "See Supported Versions" for the most up-to-date information on supported systems.
:::note
Currently, the recommended system requirements for running Relay Server are 4GB of RAM and 4 CPU cores. However, it's important to note that these requirements may be subject to change based on the results of a performance test conducted specifically for Relay Server.
:::
Additionally, for Relay Server to function properly, a responder must be installed and registered. The responder acts as the intermediary between the Relay Server and the AIR console, which serves as the management interface for controlling Relay Server's operations. The seamless interaction between the responder and AIR console facilitates efficient management of the Relay Server's functionalities.
:::note
The Relay Server listens to default SOCKS5 port **1080** and creates connections to the target server (e.g. AIR console). Port 1080 should be available for listening; otherwise, the relay server does not work as expected. As of now, the AIR responder connects to 80 (HTTP), 443 (HTTPS), and 4222 (NATS) ports of the AIR console, so as a result, the Relay Server as a proxy server can connect to the 80, 443, and 4222 ports of the target server. You should keep in mind that any implementation change in the future, like allowing evidence repository connections over the relay server, results in connecting to the appropriate port of the target server.
Note that, the AIR responder will try to connect to port 1080 of the Relay Server to communicate with the AIR console. If the connection cannot be established, the AIR responder falls back to a direct connection to the AIR console.
:::
:::danger
As of now, the Relay Server’s default listening port, 1080, cannot be changed and the AIR responders will always try to connect to port 1080 if they are configured to use a relay server.
:::
---
# How to install a Relay Server on different Linux platforms
> Source: https://kb.binalyze.ai/air/setup/relay-server/how-to-install-a-relay-server-on-different-linux-platforms.html
**To ensure proper installation of the Relay Server, the responder must be installed and registered within the same organization and on the same system. If you plan to install the responder beforehand, you should select a direct connection as the Relay Server will be located on the same system.**
From the "Organizations" page, when you create a new organization or select an existing one, it will bring you to a page where you can deploy a new Relay Server.
How to install a Relay Server on different Linux platforms: Oranization Detail
By clicking "New Relay", a deployment page brings up for the Relay Server:
How to install a Relay Server on different Linux platforms: Linux Debian
As you can see, there are packages available based on Debian or Redhat distributions. You can select either the 64-bit or ARM64 version by clicking the arrow next to the "Download" button.
Once the package is downloaded, you will need to configure the environment settings for the Relay Server to register with the AIR console. To simplify this process, you can easily copy the necessary commands by clicking the "copy" button located in the right corner of the command.
```
export AIR_DEPLOYMENT_TOKEN=dce4e59125c545a2
sudo -E dpkg -i ./binalyze-air-relay-server_2.22.0_*.deb
```
After copying the commands, open a terminal and navigate to the directory where you have downloaded the package. If the directory is "Downloads" in your home folder, you can go to that folder by executing the following commands in the terminal:
```
$ cd ~/Downloads
```
```
$ export AIR_DEPLOYMENT_TOKEN=dce4e59125c545a2
```
```
$ sudo -E dpkg -i ./binalyze-air-relay-server_2.22.0_arm64.deb
(Reading database ... 244560 files and directories currently installed.) Preparing to unpack binalyze-air-relay-server_2.22.0_arm64.deb ...
Trying to send SIGHUP to processes
Trying to lock for single instance
Locked for single instance remove service in progress
remove service OK
Unpacking binalyze-air-relay-server (2.22.0) over (2.22.0) ... Setting up binalyze-air-relay-server (2.22.0) ...
Failed to acquire lock. An instance of the AIR responder is running. Trying to stop the service...
Checking lock if it is still held...
Lock is held. AIR responder is not running
AIR responder service started
Completed
Relay service is configured successfully
AIR Relay successfully read and set environment variables.
Trying to lock for single instance
Locked for single instance
add service in progress
add service OK
AIR Relay is installed.
```
As part of the Relay Server installation process, it performs a check to verify the availability of the responder. Additionally, it configures the responder to manage the newly installed Relay Server.
Upon successful installation, you will be able to view your newly deployed Relay Server on the "Organization Detail" page.
How to install a Relay Server on different Linux platforms: Successful installation
---
# How to change IP address of Relay Server
> Source: https://kb.binalyze.ai/air/setup/relay-server/how-to-change-ip-address-of-relay-server.html
Before deploying a new asset through Relay Server, you need to choose the IP address of the Relay Server to which the endpoints will connect. This chosen IP address will serve as the connection route for the assets that will be routed through this Relay Server.
You can change the address of the Relay Server by accessing the "Relay Server Details" section, which can be found in the "Organization Detail" page.
How to change IP address of Relay Server: Relay Server Details
---
# How to install a Responder with Relay Server support
> Source: https://kb.binalyze.ai/air/setup/relay-server/how-to-install-a-responder-with-relay-server-support.html
When deploying a new responder to an asset, you will encounter a configuration option that allows you to choose a connection route. This allows you to deploy a responder that either directly connects to the AIR console or utilizes a connection route via a Relay Server.
By selecting the "Relay Server Connection" radio button, you will be presented with a list of registered Relay Servers associated with this organization. From this list, select one option and proceed with the configuration.
The subsequent steps remain the same as when deploying a new responder, regardless of the connection route chosen (Relay Server). Once you have successfully installed a new asset using the Relay Server connection, you will observe the newly deployed asset associated with the Relay Server on the "Organization Detail" page.
How to install a Responder with Relay Server support: Organization Detail
After selecting the installed Relay Server from the list on the "Organization Detail" page, you can access your associated assets by clicking on the "Assets" tab. Additionally, you can view comprehensive details of your Relay Server on this page by clicking on the "Information" tab.
How to install a Responder with Relay Server support: Relay Server Details
#### Updating the Connection Route address
Furthermore, you can view and manage assets that are connected through this Relay Server. To modify the connection routing of your assets, navigate to the "Assets" tab. Simply select the asset that you would like to view or edit.
Within the "Connection Route" setting, you have the option to choose between a direct connection to the AIR console or selecting another Relay Server for your asset to connect to. This action will bring up the same settings page for connection routing that you encountered when deploying a new asset.
#### Updating Connection Route addresses for multiple assets
To update the connection route addresses for multiple assets in the same organization, follow these steps:
1. Go to the organization's page (the organization where you want to update the assets) or the Assets page.
2. Selected the desired assets within the same organization.
3. Edit the connection route by selecting the icon at the end of the connection route row.
4. Modify the connection route addresses or choose a Direct connection.
By following these steps, you can easily update the connection route addresses for multiple assets in the same organization.
How to install a Responder with Relay Server support: Connection Route
#### Updating the responder’s connection route address using the command line
:::note
Even if you manually update your connection route, during the next visit to the AIR console from the responder, the responder will retrieve and set the old connection route address. This occurs because the AIR console is unaware of the address you have set. To avoid this, any changes to the connection route must be made directly from the AIR console. The configure command mentioned below is primarily utilized for troubleshooting and testing the connection to the Relay Server.
:::
To manually update the connection route of your responder, you can run the responder with the "configure" flag. Follow these steps:
1. Open a Terminal.
2. Navigate to the directory where the responder is located.
3. Run the configure command as shown below:
```
$ cd /opt/binalyze/air/responder
```
```
$ sudo ./air configure relay --address 192.168.1.XX
Failed to acquire lock. An instance of the AIR responder is running. Trying to stop the service...
Checking lock if it is still held...
Lock is held. AIR responder is not running
AIR responder service started
Completed
```
```
$ cat config.yml | grep ConnectionRouteAddress
ConnectionRouteAddress: 192.168.1.XX
```
Upon running the configuration command, the responder service will automatically restart with the updated configuration, including the new connection route that has been set. This ensures that the responder incorporates the changes and operates according to the new configuration.
---
# Service Management for Relay Server
> Source: https://kb.binalyze.ai/air/setup/relay-server/service-management-for-relay-server.html
As Relay Server operates as a service/daemon managed by systemd, you can utilize the following `systemctl` commands to start, stop, restart and reload the service:
To start the service:
```
sudo systemctl start Binalyze.AIR.Relay.service
```
To stop the service:
```
sudo systemctl stop Binalyze.AIR.Relay.service
```
To restart the service:
```
sudo systemctl restart Binalyze.AIR.Relay.service
```
:::note
Stopping and restarting the Relay Server may require several minutes due to its behavior of gracefully shutting down. The Relay Server waits for connected endpoints to disconnect before shutting down to ensure a proper shutdown process.
During this waiting period, the Relay Server allows sufficient time for all endpoints to disconnect, ensuring that any ongoing communications are completed. Once all the endpoints have disconnected from the Relay Server, it proceeds with the shutdown process.
This careful handling of the shutdown process helps maintain the integrity of the ongoing communications and ensures that all necessary cleanup and termination procedures are executed properly. However, it is important to note that the actual duration may vary based on the number of connected endpoints and the complexity of the ongoing communications.
:::
Relay Server provides support for reloading its configuration file without the need to restart the service. You can accomplish this by executing the following `systemctl` command:
```
sudo systemctl reload Binalyze.AIR.Relay.service
```
By running this command, any changes made to the Relay Server's configuration file will be applied without requiring a full restart of the service. This allows you to update the configuration manually and have the new settings take effect immediately.
---
# Whitelisting for Relay Server
> Source: https://kb.binalyze.ai/air/setup/relay-server/whitelisting-for-relay-server.html
Relay Server is designed to facilitate communication between the AIR console and the responder. As a result, Relay Server carefully examines all connection attempts to ensure they are directed towards the AIR console and blocks any connection requests to other destinations. This strict enforcement guarantees that only connections to the AIR console are permitted, thereby providing a secure environment and ensuring that no undesired connections to other addresses occur.
To enable connections to addresses other than the AIR console, a configuration called "Whitelist" is utilized. By specifying addresses or IP/FQDN patterns in the whitelist, the Relay Server allows communication between clients and the whitelisted addresses. In such cases, the Relay Server acts as a proxy between the client and the whitelisted address, ensuring seamless communication while still maintaining the necessary security measures.
To add or modify the whitelist in the configuration file, you can follow these steps:
1. Locate the `config.yml` file: `/opt/binalyze/air/relay/config.yml`
2. If the Whitelist field is not present in the file, add it as a YAML array in the following format:
```
Whitelist:
- testpage.com
- test.binalyze.com
- 10.5.2.1
- *.google.com
- 10.2.5.1/24
- 10.2.5.3-10.2.5.16
```
In the Whitelist array, you can include various elements such as IP addresses, fully qualified domain names (FQDNs), FQDNs with wildcards, CIDR notations, IP ranges, or use an asterisk (\*) to allow all connections.
The Whitelist elements support the following formats:
* IP address: Enter the specific IP address.
* FQDN: Provide the fully qualified domain name.
* FQDN with wildcard: Use an asterisk (\*) as a wildcard character in the domain name.
* CIDR: Specify the IP range using CIDR notation.
* IP range: Indicate the range of IP addresses using a hyphen (-) between the start and end IP addresses.
:::danger
FQDN addresses that have been added to the whitelist are not resolved to IP addresses. Therefore, destinations using IP addresses without FQDN will be denied. Relay Server only resolves IP addresses of Console Address in the configuration file.
:::
By configuring the whitelist, you can specify the allowed addresses or domains that Relay Server will permit connections to.
After modifying the config file for Relay Server, it is essential to reload the configuration if Relay Server is already running. To accomplish this, you can use the following `systemctl` command:
```
sudo systemctl reload Binalyze.AIR.Relay.service
```
---
# Retrieving metrics from Relay Server
> Source: https://kb.binalyze.ai/air/setup/relay-server/retrieving-metrics-from-relay-server.html
Relay Server serves these metrics produced by Prometheus from a Unix socket.
To retrieve metrics from the Relay Server's Unix socket, you can use the `curl` command to make a request to the following endpoint: `http://localhost/metrics` on the Unix socket `/var/run/Binalyze.AIR.Relay.sock`. Here's an example command:
```
sudo curl --unix-socket /var/run/Binalyze.AIR.Relay.sock http://localhost/metrics
```
Executing this command will provide you with a response containing various metrics related to the Relay Server. The response will include information such as the number of active connections, request duration, request errors, reload count, and more.
Please note that you need to run this command on the same system where the Relay Server is running, as it communicates via the Unix socket.
Here's a sample response:
```
# HELP air_relay_info Information about the Relay Server environment.
# TYPE air_relay_info gauge
air_relay_info{arch="aarch64", build_time="2023-06-14T07:22:01", commit="f064c83645e1901d421714b8bd1dbec274425551", goarch="arm64", goos="linux", hostname="halilonay.ubuntu", os="Ubuntu 22.04.2 LTS (Jammy Jellyfish)", version="2.23.0"} 1
# HELP air_relay_proxy_active_connections Number of active connections to the Relay Server.
# TYPE air_relay_proxy_active_connections gauge
air_relay_proxy_active_connections 0
# HELP air_relay_proxy_request_duration_seconds Duration of each request handled by the Relay Server.
# TYPE air_relay_proxy_request_duration_seconds histogram
air_relay_proxy_request_duration_seconds_bucket{le="0.005"} 0
air_relay_proxy_request_duration_seconds_bucket{le="0.01"} 0
air_relay_proxy_request_duration_seconds_bucket{le="0.025"} 0
air_relay_proxy_request_duration_seconds_bucket{le="0.05"} 0
air_relay_proxy_request_duration_seconds_bucket{le="0.1"} 0
air_relay_proxy_request_duration_seconds_bucket{le="0.25"} 1
air_relay_proxy_request_duration_seconds_bucket{le="0.5"} 1
air_relay_proxy_request_duration_seconds_bucket{le="1"} 1
air_relay_proxy_request_duration_seconds_bucket{le="2.5"} 1
air_relay_proxy_request_duration_seconds_bucket{le="5"} 1
air_relay_proxy_request_duration_seconds_bucket{le="10"} 1
air_relay_proxy_request_duration_seconds_bucket{le="+Inf"} 1
air_relay_proxy_request_duration_seconds_sum 0.149310392
air_relay_proxy_request_duration_seconds_count 1
# HELP air_relay_proxy_request_errors_total Total number of request errors encountered by the Relay Server.
# TYPE air_relay_proxy_request_errors_total counter
air_relay_proxy_request_errors_total 1
# HELP air_relay_proxy_requests_total Total number of requests received by the Relay Server.
# TYPE air_relay_proxy_requests_total counter
air_relay_proxy_requests_total 1
# HELP air_relay_reload_count Number of times the Relay Server has been reloaded.
# TYPE air_relay_reload_count counter
air_relay_reload_count 0
# ...
```
These metrics provide insights into the Relay Server's performance, resource utilization, and various other statistics related to its operations.
---
# Updating and Uninstalling Relay Server
> Source: https://kb.binalyze.ai/air/setup/relay-server/updating-and-uninstalling-relay-server.html
To update Relay Server, you can initiate an update task for the Relay Server from the AIR console.
Follow these steps from the AIR console:
1. Locate the Relay Server from the “Organization Detail” page.
2. Select the relay server and click “Update” button from “Relay Server Details” page.
By running the update task from the AIR console, the Relay Server installed on the asset and the responder itself will be updated to the latest version.
Similarly, if you wish to uninstall Relay Server from an asset, you can click to red button next to the “Update” in “Relay Server Details” page from the AIR console. This will remove Relay Server and responder from the system.
Updating and Uninstalling Relay Server: Relay Server Details
---
# Responder Deployment
> Source: https://kb.binalyze.ai/air/setup/responder-deployment/index.html
Installation of the AIR Responder on your assets is managed via the Assets button in the Main Menu:
Responder Deployment: Assets button in the Main Menu
The AIR Responder installer is a zero-configuration package that contains the console address already embedded in it.
You can deploy the AIR Responder in multiple ways:
1. Downloading an installation package (Windows, macOS, Linux, Chrome, and ESXi)
2. Copying a PowerShell Command (Windows)
3. Copying a CURL Command (macOS and Linux)
4. Copying a WGET Command (macOS and Linux)
5. Downloading a PowerShell Script (Windows)
6. Downloading the Asset installer (macOS and Linux)
7. Manual installation via Active Directory/SCCM.
8. Generation of a shareable Deployment Link (Windows, macOS, Linux, Chrome, and ESXi)
:::note
**The cards below show the default location paths for the AIR Responder:**
:::
In the sections that follow, we will look at the deployment of AIR Responders to Windows, Linux, and Mac operating systems.
The AIR Responder is a 'zero-config' deployment, as the file name has all the information you need for quickly deploying a Responder.
This level of detail in the filename provides all the information needed as a digitally signed binary - this prevents issues with security solutions, and to date, not one issue has arisen.
The file name example shown here has 4 main components:
```xml
AIR.Responder_2.38.7_air-demo.ACME.com_176_9df51c56a73341f4_386_.msi
```
1. **2.38.7** - is the Responder version number.
2. **air-demo.ACME.com** - is the address of the console with which the Responder will be communicating
3. **176** - is the console's internal organization number ID.
4. And the apparently random mixture of letters and numbers, **9df51c56a73341f4**, is the - Deployment Token.
5. **386** - describes the processor architecture of the machine on which the Responder will run.
There are multiple ways of deploying the responder, all of which are designed to be quick and scalable. Let's take a look at the different ways in which you can deploy the AIR Responder to your assets:
From the Main Menu, select **Assets**, then select **Devices** from the Secondary Menu. The **Action Button** labeled **'+ Add New'** appears next to the page name.
When this **'+ Add New'** button is selected, three options are offered in a drop-down menu:
Responder Deployment: Three deployment options for adding AIR Responders to assets.
Each one of the options will present the user with a wizard that will walk through the options needed for the chosen deployment method:
1. **Deploy New** - For assets that are attached to a network that is visible to the AIR console
2. **Cloud Account** - For assets that reside in AWS EC2, and Virtual Machines in Microsoft Azure.
3. **Off-Network** - To generate triage and collection packages for assets that are not connected to a visible network.
## Deploy Responder to New Asset Wizard
1. When you choose 'Deploy New', you'll be prompted via a wizard to determine if the Responder should establish a direct connection to the AIR console or if utilizing a Relay Server connection would be more suitable for your environment. [Relay Server is explained here.](../relay-server/)
Responder Deployment: Select a connection route
2. The second step of the deployment wizard offers distinct deployment options for all currently supported network-attached operating systems: Windows, Linux, and macOS.
Responder Deployment: Choose Platform
## **Windows PowerShell Command**:
* The command varies based on the Organization affiliation. An example PowerShell command to copy is provided below:
```powershell
[System.Net.ServicePointManager]::ServerCertificateValidationCallback = {$true}
(New-Object System.Net.WebClient).DownloadFile("https://air-demo.ACME.com/api/endpoints/download/0/deploy/windows?deployment-token=d297145XXXXXXXX", "$PWD\deploy-responder.ps1")
.\deploy-responder.ps1
```
:::danger
**This command is specific to your console address and Organization.**
:::
## **Windows PowerShell Script**:
* This script can be downloaded from your AIR Console. Ensure you select or are working in the appropriate Organization before downloading.
```
<#
2022-2024 (c) AIR
AIR Responder Powershell Script for Windows
PLEASE DO NOT EDIT! This file is automatically generated at 2024-05-02T13:49:58
VERSION 2.39.9
#>
<#
.SYNOPSIS
This script installs the AIR Responder using given parameters or default values are used.
This script requires administrator privileges!
MSI file is temporarily stored in %LOCALAPPDATA%\binalyze\air\agent
.DESCRIPTION
Powershell script to deploy the AIR Responder.
.PARAMETER Version
The version of the AIR Responder to be deployed.
.PARAMETER ConsoleAddress
The address of the AIR Console without https:// prefix, only domain address.
.PARAMETER OrganizationId
The organization id to register the AIR Responder.
.PARAMETER DeploymentToken
A Valid deployment token to deploy the AIR Responder.
.PARAMETER ConnectionRouteID
Set Connection Route Id for the AIR Responder.
.PARAMETER ConnectionRouteAddress
Set Connection Route Address for the AIR Responder.
.PARAMETER AllowInsecureTlsVersion
Allow insecure TLS version for the AIR Responder.
#>
Param ([string]$Version="2.39.9",
[string]$ConsoleAddress="air-demo.ACME.com",
[string]$OrganizationId="0",
[string]$DeploymentToken="d297145dXXXXXXXX",
[string]$ConnectionRouteID="{{.AIR_CONNECTION_ROUTE_ID}}",
[string]$ConnectionRouteAddress="{{.AIR_CONNECTION_ROUTE_ADDRESS}}",
[switch]$AllowInsecureTlsVersion)
$downloadDir = "$env:LOCALAPPDATA\binalyze\air\agent"
Remove-Item $downloadDir -Force -Recurse -ErrorAction Ignore
New-Item -Path $downloadDir -ItemType Directory
Push-Location
Set-Location -Path $downloadDir
$arch = "386"
if ([Environment]::Is64BitProcess) {
$arch = "amd64"
}
if ($ConnectionRouteID -like '{*') {
$ConnectionRouteID = ""
}
if ($ConnectionRouteAddress -like '{*') {
$ConnectionRouteAddress = ""
}
$fileSuffix = ""
if ($ConnectionRouteID) {
$fileSuffix = "{0}_{1}_" -f $arch,$ConnectionRouteID
if ($ConnectionRouteAddress) {
$fileSuffix = "{0}{1}_" -f $fileSuffix,$ConnectionRouteAddress
}
}
$file = "{0}\AIR.Responder_{1}_{2}_{3}_{4}_{5}.msi" -f $downloadDir,$Version,$ConsoleAddress,$OrganizationId,$DeploymentToken,$fileSuffix
$url = "https://{0}/api/endpoints/download/{1}/windows/msi/{2}?deployment-token={3}" -f $ConsoleAddress,$OrganizationId,$arch,$DeploymentToken
Write-Debug "file: $file"
Write-Debug "url: $url"
if ($AllowInsecureTlsVersion) {
Write-Host "Allowed insecure TLS versions for the AIR Responder. If this flag is set, the AIR Responder will connect to the AIR Console with system default TLS version"
} else {
try {
[System.Net.ServicePointManager]::SecurityProtocol = [System.Net.SecurityProtocolType]::Tls12 -bor [System.Net.SecurityProtocolType]::Tls13
} catch {
Write-Host "TLS1.3 and TLS1.2 is not supported on this operating system, please try to use AllowInsecureTlsVersion flag."
}
}
[System.Net.ServicePointManager]::ServerCertificateValidationCallback = {$true}
(New-Object system.net.webclient).DownloadFile($url,$file)
$process = Start-Process C:\Windows\System32\msiexec.exe -ArgumentList "/i $file /quiet /norestart" -PassThru -Wait
$process.WaitForExit()
if ($process.ExitCode -eq 0) {
Write-Debug "AIR Responder is installed successfully."
Remove-Item -Path $file -ErrorAction Ignore
} else {
Write-Debug "MSI failed. ExitCode: $($process.ExitCode)"
Pop-Location
exit $process.ExitCode
}
Pop-Location
```
## **SCCM Deployment for Windows Responder**:
* If you prefer, the Windows responder can be deployed using SCCM with the following command:
```
msiexec /i AIR.responder_2.24.2_air-demo.ACME.com_0_d297145XXXXXXXX_.msi /qn /norestart
```
For a silent installation you can use the following command:
```
msiexec /i AIR.responder_2.26.4_air-demo.ACME.com_176_9df51c56XXXXXXXX_.msi /qn /norestart
```
:::danger
**These commands are specific to your console address and Organization.**
:::
## **Windows Responder MSI Download**:
* The MSI for the Windows Responder can be downloaded directly from the page, as depicted in the screenshot below:
Responder Deployment: MSI Download
## **Shareable Deployment Link for Windows/Linux/macOS**:
* All three operating systems support the Shareable deployment link available in the console. This method is often the most straightforward—simply share the link with your client, allowing them to download and install the Responder. An example link is shown below:
```
https://air-demo.ACME.com/#/shareable-deploy?token=d297145dXXXXXXXX
```
## **macOS and Linux Deployments**:
* Unlike Windows, macOS and Linux do not utilize PowerShell commands or scripts. Instead, they can employ **CURL or WGET** commands. Alternatively, you can use the Shareable deployment page link mentioned above.
Example of CURL deployment command:
```
sudo curl -kfsSL "https://air-demo.ACME.com/api/endpoints/download/176/deploy/darwin?deployment-token=9df51c56XXXXXXXX" | sudo sh
```
Example of WGET deployment command:
```
sudo wget --no-check-certificate -O- "https://air-demo.ACME.com/api/endpoints/download/176/deploy/darwin?deployment-token=9df51c56XXXXXXXX" | sudo sh
```
:::danger
**These commands are specific to your console address and Organization.**
:::
## Granting Full Disk Access for Responder on macOS
:::caution
**For macOS, the user/administrator must allow Full Disk Access (FDA) to the AIR Responder for it to have full access to the disk for collections.**
Open "System Settings -> Privacy & Security -> Full Disk Access"
Toggle the switch 'on' to enable Full Disk Access for the AIR Responder.
:::
After installing a responder on macOS, users will need to grant Full Disk Access permission. To guide users through this process, a pop-up will appear after installation stating: "Allow AIR to access files on your disk. Open System Settings > Security & Privacy > Full Disk Access to grant permission to "AIR".
If Full Disk Access permission is not granted when starting any Acquisition, this will be shown in the Acquisition logs:
Responder Deployment: Full Disk Access permission is not enabled
Responder Deployment: Full Disk Access toggled on
After toggling on the FDA on this page, select the **/opt/binalyze/air/agent/air** file in the file manager that opens. Once this is done, our responder will appear in the list under the name **'air',** ready for the user to toggle 'on'.
Responder Deployment: Allow access to data
### Why is there no logo next to AIR on the Full Disk Access page in macOS?
The AIR responder operates as an executable binary running as a service rather than a traditional macOS application. This approach ensures consistency across platforms like Linux and macOS.
Since AIR is not packaged as a macOS app, it does not include a `.plist` file, which typically contains the application icon metadata. Consequently, it cannot display a logo on the Full Disk Access page.
This design choice does not affect the functionality or performance of AIR.
### Problem with MDM Installation
While the pop-up effectively guides users in manually installed scenarios, it presents challenges for enterprise environments where macOS devices are managed via Mobile Device Management (MDM). MDM allows remote application installation and security policy enforcement, including granting Full Disk Access.
Customers prefer silent installations for MDM-deployed responders, as permissions are already set through security policies, eliminating the need for pop-ups. However, our current setup cannot distinguish between user-initiated and MDM-initiated installations, resulting in the pop-up appearing in all cases.
We are actively working on a solution to address this issue for seamless enterprise deployments.
[Updating the AIR responder is discussed on this page](../../faqs/how-do-i-update-endpoints).
---
# Responder - Supported Operating Systems
> Source: https://kb.binalyze.ai/air/setup/responder-deployment/responder-supported-operating-systems/index.html
The AIR responder can be installed on Microsoft Windows, Linux, and Apple macOS operating systems. All supported operating systems and associated versions are listed below.
[Responder - MS Windows supported systems](responder-ms-windows-supported-systems)
[Responder - Linux (DEB/RPM) supported systems](responder-linux-deb-rpm-supported-systems)
[Responder - Apple macOS supported systems](responder-apple-macos-supported-systems)
[ESXi Standalone Collector](esxi-standalone-collector)
---
# Responder - MS Windows supported systems
> Source: https://kb.binalyze.ai/air/setup/responder-deployment/responder-supported-operating-systems/responder-ms-windows-supported-systems.html
* Windows 7 SP1 (with latest updates)
* Windows 8
* Windows 8.1
* Windows 10
* Windows 11
* Windows Server 2008 R2 (with latest updates)
* Windows Server 2012
* Windows Server 2012 R2
* Windows Server 2016
* Windows Server 2019
* Windows Server 2022
* Windows Server 2025
---
# Responder - Apple macOS supported systems
> Source: https://kb.binalyze.ai/air/setup/responder-deployment/responder-supported-operating-systems/responder-apple-macos-supported-systems.html
* macOS 10.15
* macOS 11.0
* macOS 12.0
* macOS 13.0
* macOS 14.0
* macOS 15.0
* macOS 26.0
---
# Responder - Linux (DEB/RPM) supported systems
> Source: https://kb.binalyze.ai/air/setup/responder-deployment/responder-supported-operating-systems/responder-linux-deb-rpm-supported-systems.html
* Centos 7
* Centos 8
* Centos 9
* Fedora 21
* Fedora 22
* Fedora 24
* Fedora 26
* Fedora 34
* Fedora 36
* Amazon Linux 1 Latest
* Amazon Linux 2 Latest
* Redhat 7
* Redhat 8
* Redhat 9
* Pardus 17
* Pardus 21
* Rockylinux 9
* Rockylinux 8
* Debian 7
* Debian 8
* Debian 10
* Debian 11
* Debian 12
* Ubuntu 12.04
* Ubuntu 14.04
* Ubuntu 16.04
* Ubuntu 18.04
* Ubuntu 20.04
* Ubuntu 22.10
* Ubuntu 23.04
* Ubuntu 24.04
* Boss Linux 7
* Boss Linux 8
* Boss Linux 9
* Boss Linux 10
_All Linux distros can run on 32/64 bit and ARM64 architectures._
---
# ESXi Standalone Collector
> Source: https://kb.binalyze.ai/air/setup/responder-deployment/responder-supported-operating-systems/esxi-standalone-collector.html
The AIR standalone collector currently provides support for execution on ESXi 6.5+ systems.
VMware ESXi is a type of hypervisor, which is software that creates and runs virtual machines (VMs). It is a part of VMware's vSphere product suite and is used for enterprise-level virtualization. ESXi is popular due to its stability, performance, and extensive feature set for managing and running virtual machines.
AIR offers a robust approach for evidence collection from ESXi platforms. DRONE is not currently supported for ESXi systems. This is achieved through a standalone ESXi collector, available for download on the Assets page of your AIR console:
**Assets>Add New>Deploy New>Direct connection to AIR Console >ESXi**
ESXi Standalone Collector: New Asset
After running Responder using your chosen method, the collected evidence should be converted into a PPC file. This PPC file can then be imported into the AIR Console. Once imported, the asset will be displayed alongside all other assets in AIR, ensuring seamless integration and visibility within the platform.
ESXi Standalone Collector: ESXi platform is shown on the AIR Asset page
:::note
For the conversion to PPC, you'll need an **off-network Responder** binary specific to your operating system on which you want to carry out the conversion.
Here's an example for Microsoft:
1. **Download the Off-Network Responder Package:**
* If you are not sure where to get the binary, visit the following link for an explanation: [Off-Network Responder Package](../../../features/off-network-endpoint/).
2. **Extract the Package:**
* Extract the contents of the downloaded Off-Network Responder zip file.
3. **Prepare Your Evidence:**
* Copy your ESXi evidence file into the same extracted folder.
4. **Run the Command:**
* Execute the following command, replacing `your_ESXi_evidence_name` with the actual name of your ESXi evidence file:
Following these steps will create a new folder containing a `Case.ppc` file. Please import this `Case.ppc` file into the AIR Console.
This process will ensure that your ESXi evidence is accurately processed and seamlessly integrated into the AIR platform.
:::
After ingestion into AIR the ESXi evidence is parsed and pesented in the Investigation Hub in the normal way:
ESXi Standalone Collector: ESXi evidence in the Investigation Hub
However, you can if required decompress the tar.gz file to independently access and examine the evidence. Typically, the evidence will include the following: :
* **System Info:** Basic system information about the ESXi machine.
* **Bash History:** Command history executed on the Bash shell.
* **Collect Bash Files:** Gathering files associated with the Bash shell.
* **Environment Variables:** Variables defined in the system environment.
* **Collect /etc Files:** Gather files under the /etc directory.
* **Log Files:** Collecting various log files.
* **SSH Config:** Retrieves the configuration settings related to the SSH (Secure Shell) protocol.
* **SSH Authorized Keys:** Collects information about authorized SSH keys, which are used for secure authentication.
* **SSH Known Hosts:** Gathers details about known hosts in the context of SSH.
* **File System Enumeration:** Involves enumerating and collecting information about the file system on the ESXi machine.
[A full list of ESXi collected items is shown here](esxi-standalone-collector.md#full-list-of-esxi-collected-items)
Having run the binary the progress will be displayed in the user's terminal/shell:
ESXi Standalone Collector: ESXi collection example
## Full list of ESXi collected items
### File Collectors:
| **ID** | **Collector Name** | **Collected Files** |
| ------ | --------------------- | -------------------------------------------------------------------------------------------------------------------------------------------------- |
| 1 | History Files | .ash\_history, .bash\_history, .sh\_history, .tsch\_history, .psql\_history, .sqlite\_history, .mysql\_history, .vsql\_history, .lesshst, .viminfo |
| 2 | Files of Interest | .bashrc, .bash\_logout, .bash\_login, .bash\_profile .mkshrc, .pam\_environment, .profile, .zshrc, authorized\_keys, known\_hosts, ssh\_config |
| 3 | Cronjob Files | /etc/cron.hourly, /etc/cron.daily, /etc/cron.weekly, /etc/cron.monthly, /etc/cron.d |
| 4 | Cronjob Related Files | \*If any executable file is found in crontabs, it is collected. |
| 5 | /etc Collector | All files under /etc is collected |
| 6 | Log Files | All files under /var/log and /scratch/log is collected |
| 7 | Spool Files | All files under /var/spool is collected |
### Hunt/Triage Collectors
| **ID** | **Collector Name** |
| ------ | ---------------------------------------------------------------------------------------------------------------------- |
| 1 | Process Snapshot Detailed |
| 2 | Process Snapshot Verbose |
| 3 | Open Files |
| 4 | User Info |
| 5 | Disk Usage |
| 6 | Disk Usage By User |
| 7 | Disk Usage Human Readable |
| 8 | System Hostname |
| 9 | VMware Version |
| 10 | System Info |
| 11 | Shell Aliases |
| 12 | Environment Variables |
| 13 | ESX Advanced Configuration |
| 14 | ESX FCoE Configuration |
| 15 | ESX FCoE Networking |
| 16 | ESX IPSec Configuration |
| 17 | ESX IPsec Policy |
| 18 | ESX Module List |
| 19 | ESX Module Query |
| 20 | ESX Multipathing Info |
| 21 | ESX NAS Configuration |
| 22 | ESX Network Interface Cards |
| 23 | ESX Routing Table |
| 24 | ESX Network Routes |
| 25 | ESX IPv6 Routing Table |
| 26 | ESX IPv6 Network Routes |
| 27 | ESX SCSI Devices List |
| 28 | ESX VMKnic List |
| 29 | ESX Volume List |
| 30 | ESX VSwitch List |
| 31 | ESX Configuration Info |
| 32 | List all of the CPUs on this host. |
| 33 | List usb devices and their passthrough status. |
| 34 | List the boot device order, if available, for this host. |
| 35 | Display the current hardware clock time. |
| 36 | Get information about memory. |
| 37 | List all of the PCI devices on this host. |
| 38 | Get information about the platform. |
| 39 | Information about the status of trusted boot. (TPM, DRTM status). |
| 40 | List active TCP/IP connections. |
| 41 | List configured IPv4 routes. |
| 42 | List configured IPv6 routes. |
| 43 | List ARP table entries. |
| 44 | List the VMkernel network interfaces currently known to the system. |
| 45 | List configured Security Associations. |
| 46 | List configured Security Policys. |
| 47 | Print a list of the DNS server currently configured on the system in the order in which they will be used. |
| 48 | List the rulesets in firewall. |
| 49 | List the Physical NICs currently installed and loaded on the system. |
| 50 | List the virtual switches current on the ESXi host. |
| 51 | Hostname |
| 52 | Get Open Network Files |
| 53 | Get Unix Socket Files |
| 54 | Get the network configuration. |
| 55 | Get the DNS configuration. |
| 56 | Get the IP forwarding table. |
| 57 | Gets information about virtual NICs. |
| 58 | Displays information about virtual switches. |
| 59 | Lists the installed VIB packages. |
| 60 | Gets the host acceptance level. This controls what VIBs will be allowed on a host. |
| 61 | Display the installed image profile. |
| 62 | List the VMkernel UserWorld processes currently on the host. |
| 63 | Collect the list open files. |
| 64 | Report a snapshot of the current processes including used time, verbose, session ID and process group, state and type. |
| 65 | List the NAS volumes currently known to the ESX host. |
| 66 | List the NFS v4.1 volumes currently known to the ESX host. |
| 67 | List the volumes available to the host. This includes VMFS, NAS, VFAT and UFS partitions. |
| 68 | Display the mapping of logical volumes with physical disks. |
| 69 | List the VMkernel modules that the system knows about. |
| 70 | List the enforcement level for each domain. |
| 71 | Get FIPS140 mode of ssh. |
| 72 | Get FIPS140 mode of rhttpproxy. |
| 73 | List the advanced options available from the VMkernel. |
| 74 | List VMkernel kernel settings. |
| 75 | Display the date and time when this system was first installed. Value will not change on subsequent updates. |
| 76 | Show the current global syslog configuration values. |
| 77 | Show the currently configured sub-loggers. |
| 78 | Display WBEM Agent configuration. |
| 79 | List local user accounts. |
| 80 | Display the current system clock parameters. |
| 81 | List permissions defined on the host. |
| 82 | Display the product name, version and build information. |
| 83 | List networking information for the VM's that have active ports. |
| 84 | List the virtual machines on this system. This command currently will only list running VMs on the system. |
| 85 | Get the list of virtual machines on the host. |
| 86 | List Summary status from the vm. |
| 87 | Configuration object for the vm. |
| 88 | Virtual devices for the vm. |
| 89 | Datastores for all virtual machines. |
| 90 | List of networks for all virtual machines. |
| 91 | List registered VMs. |
### Other Collectors:
| **ID** | **Collector Name** | **Description** |
| ------ | ------------------ | ------------------------------------------------------------------------------------------------------------------------------------------------------------------------------------------------------------------------------------------------------------------ |
| 1 | File Listing |
All files in the system is enumerated with following infos; File Name,File Type,Size (bytes),Access Rights,User ID,User Name,Group ID,Group Name,Number of Hard Links,Mount Point,Inode Number,Birth Time,Last Access Time,Modification Time,Change Time
|
| 2 | Executable Hashes | All files' MD5 hashes that has executable permission in the system is collected |
---
# Responder - Chrome supported systems
> Source: https://kb.binalyze.ai/air/setup/responder-deployment/responder-supported-operating-systems/responder-chrome-supported-systems/index.html
Chrome 90+
---
# AIR For Chrome
> Source: https://kb.binalyze.ai/air/setup/responder-deployment/responder-supported-operating-systems/responder-chrome-supported-systems/agent-for-chrome.html
The AIR responder standalone collector currently provides support for execution on Chrome v90+ operating systems.
AIR For Chrome is the evidence collector extension for Chrome and ChromeOS. AIR For Chrome extension allows investigators and analysts to capture forensically sound data with a single click at machine speed. All data is collected into a well-organized HTML report that is accompanied by individual CSV files. Investigators and analysts can use AIR For Chrome Extension to collect forensically sound data from Google Chrome and ChromeOS.
AIR For Chrome: New Asset
AIR For Chrome is the fastest and easiest way of capturing forensically sound data from Google Chrome browsers. The forensically sound data collected by AIR For Chrome are listed below.
* Browser History
* Bookmarks
* Cookies
* Downloads
* Extensions
* Platform Keys
* Privacy Settings
* Proxy Settings
* Sessions
* Storage
* Top Sites
* Windows & Tabs
The acquired evidence can be ingested into AIR. After ingestion, the Chrome evidence is parsed and presented in the Investigation Hub alongside your other case evidence for analysis.
### **Add the extension to your Chrome.**
[AIR For Chrome - Chrome Web Store](https://chromewebstore.google.com/detail/iammmeimkeiamnhfkpgnjjepjanaodff)
---
# Responder for Golden Images
> Source: https://kb.binalyze.ai/air/setup/responder-deployment/golden-image.html
AIR supports Golden Image deployments for environments where the same operating system image is used to generate new machines with a Responder already installed. Because AIR uses the hostname of each machine as a unique identifier, you cannot clone an image that already has a registered Responder without following the Golden Image workflow described below.
:::caution
**Deployments Without Golden Image Parameters**
If you are deploying AIR Responders in environments where systems are replicated using Golden Image, VDI, Master Image, VM Templates, or Image Cloning technologies, you must follow the steps in this article before continuing with your deployment.
If you do not apply the Golden Image workflow and proceed with standard installation, all cloned machines will share the same EndpointID and ResponderId. As a result, even if you create N clones, the AIR Console will display only a single Asset record. You will also observe continuous hostname changes on that Asset as each cloned machine connects to the console.
This behavior creates unnecessary load on the system and prevents proper asset management — instead of managing N individual Assets, you will only be able to manage the most recently connected clone.
:::
The Golden Image workflow consists of two steps:
1. **Before imaging** — run `--prepare-golden-image` to clean registration-related configuration, stop the Responder service, and prepare the system for imaging.
2. **After deployment** — run `--init-golden-image` on each cloned instance before it connects to the AIR Console, so that a unique identity is generated for the new machine.
## \--prepare-golden-image
The user must use this flag before creating a golden image.
Windows:
`"C:\Program Files (x86)\Binalyze\AIR\agent\AIR.exe" configure --prepare-golden-image`
Linux/macOS:
`/opt/binalyze/air/agent/air configure --prepare-golden-image`
This flag does the following:
* Stops the service.
* Disables the service.
* Cleans the **RegisteredTo**, **SecurityToken**, **ResponderID** and **EndpointID** fields in the **config.yml**.
* Uninstalls the watchdog (if tamper detection was enabled)
## \--init-golden-image
The init command should be run after the hostname has been changed.
Windows:
`"C:\Program Files (x86)\Binalyze\AIR\agent\AIR.exe" configure --init-golden-image --deployment-token 769aca0ff45a433a --console-address air-qa.binalyze.com --organization-id 0`
Linux/macOS:
`/opt/binalyze/air/agent/air configure --init-golden-image --deployment-token 769aca0ff45a433a --console-address air-qa.binalyze.com --organization-id 0`
**Note:** The use of `--deployment-token` is required. Because the deployment token is clean after the registration of the AIR Responder. The use of `--console-address` and `--organization-id` is optional. They are used to overwrite the console address and organization id which are already set in the configuration file at the first installation before the image was taken.
This flag does the following:
* Generates the ResponderID for the asset.
* Updates the **DeploymentToken**, **ConsoleAddress,** and **OrganizationID** values entered as a command in the **config.yml**.
* Starts the service.
* Enables the service.
* Watchdog is installed automatically after registration if it is enabled by AIR Console.
### **Troubleshooting**
Exit code other than 0 (zero) means an error occurred while executing commands. The terminal will print the error messages, and also log file will contain the error messages.
If something goes wrong first option is to re-run the same command.
If a re-run of the command doesn't succeed, the user should perform the same steps manually.
---
# Responder and Active Directory OUs
> Source: https://kb.binalyze.ai/air/setup/responder-deployment/responder-and-active-directory-ous.html
This page summarizes the capabilities and current limitations of Responder for Organization Units (OUs) within an Active Directory (AD) environment.
**Key Points:**
1. **Current Capability:**
* Once Active Directory integration is complete, the AIR will display the domain on the Assets page.
* Users can filter assets by clicking on their Organization Unit on the Assets page. Further filtering for "Managed Status in Managed" will show assets where the Responder is installed.
2. **Limitations and Requests:**
* As of now, AIR does not support querying or installing Responders directly at specific OU levels (e.g., SecurityTesting.AIR.local) beyond the root AD level (e.g., AIR.local).
* A feature request has been submitted to allow integration directly at the OU level to enhance targeted management within the domain structure.
3. **Installation Note:**
* The AIR Responder will report on systems where it is installed. It does not automatically install on systems within an AD environment where it is not already installed.
:::note
**Integrating AIR with Active Directory: Permissions Information**
When integrating AIR with Active Directory, it is important to note that the account used for this integration **does not** require Domain Admin permissions. The integration primarily involves LDAP searches for reading directory information. Therefore, having Domain Users permission is sufficient for LDAP integration with AIR. This ensures that the necessary operations can be performed securely without granting excessive privileges.
:::
**Conclusion:** Efforts to extend AIR's integration capabilities to specific OUs are ongoing, following feedback and feature requests. This enhancement aims to provide more granular control and efficiency in managing cybersecurity operations across different organizational units.
---
# Responder Exception Rules for EPP and EDR
> Source: https://kb.binalyze.ai/air/setup/responder-deployment/responder-exception-rules/index.html
## Overview
AIR Responders run acquisition tools, create temporary artifacts, and access protected areas of the file system. Endpoint Protection Platform (EPP), Endpoint Detection and Response (EDR), and antivirus products can identify this expected activity as suspicious and interrupt evidence collection.
Add the folder and binary exclusions for each operating system used in your deployment. After saving the rules, follow [Validate the exclusions](#validate-the-exclusions).
:::note
Exclusion syntax and matching behavior vary between security products. The pattern examples on this page are illustrative; use the syntax documented by your EPP, EDR, or antivirus provider.
:::
## Windows
### Folders to exclude
- `C:\Program Files (x86)\Binalyze\AIR\agent\`
- `C:\ProgramData\.binalyze-air`
### Binaries to exclude
- `C:\Program Files (x86)\Binalyze\AIR\agent\AIR.exe`
- `C:\Program Files (x86)\Binalyze\AIR\agent\DRONE.exe`
- `C:\Program Files (x86)\Binalyze\AIR\agent\TACTICAL.exe`
- `C:\ProgramData\.binalyze-air\WATCHDOG.exe`
- `C:\Program Files (x86)\Binalyze\AIR\agent\utils\curl.exe`
- `C:\Program Files (x86)\Binalyze\AIR\agent\utils\osqueryi.exe`
## Linux
### Folders to exclude
- `/opt/binalyze/air/agent/`
- `/usr/share/.binalyze-air/`
### Binaries to exclude
- `/opt/binalyze/air/agent/air`
- `/opt/binalyze/air/agent/drone`
- `/opt/binalyze/air/agent/tactical`
- `/opt/binalyze/air/agent/utils/osqueryi`
- `/opt/binalyze/air/agent/utils/curl`
- `/usr/share/.binalyze-air/watchdog`
## macOS
### Folders to exclude
- `/opt/binalyze/air/agent/`
- `/usr/local/share/.binalyze-air/`
### Binaries to exclude
- `/opt/binalyze/air/agent/air`
- `/opt/binalyze/air/agent/drone`
- `/opt/binalyze/air/agent/tactical`
- `/opt/binalyze/air/agent/utils/osqueryi`
- `/opt/binalyze/air/agent/utils/curl`
- `/usr/share/.binalyze-air/watchdog`
## When an exclusion does not cover subdirectories
Security products interpret path separators and wildcards differently. In uncommon product-specific cases, a rule that uses a recursive wildcard may still leave immediate subdirectories in scope for scanning, detection, or blocking. Adding a separate, explicit rule for the affected path can resolve the issue.
Check for this behavior when detections continue after you save an exclusion.
Use the folder locations listed above and express them in the syntax required by your security product. Common pattern forms include:
- Anchored Windows path: `C:\Program Files (x86)\Binalyze\AIR\agent\**`
- Windows path without a drive letter: `Program Files (x86)\Binalyze\AIR\agent\**`
- Windows path with a wildcard prefix: `**\Binalyze\AIR\agent\**`
- Anchored Unix path: `/opt/binalyze/air/agent/**`
- Unix path with a wildcard prefix: `**/binalyze/air/agent/**`
A path beginning with a drive letter or `/` is typically anchored to that location. A Windows path without a drive letter is relative, while a path beginning with `**` can match under any parent directory. A trailing `**` commonly makes the rule recursive; a single `*` often matches only one path segment.
Support for `\`, `/`, environment variables, recursive wildcards, and case-sensitive matching varies by product. A folder exclusion also may not cover processes whose image path is under that folder or child processes they launch.
:::caution
Keep exclusions as narrow as your security product allows. Prefer rules anchored to the installed AIR paths over patterns that match the same folder name anywhere on the file system.
:::
## Validate the exclusions
1. Add exclusions for the folders and binaries listed for your operating system.
2. Configure each folder rule to include subdirectories. If the product provides an option to apply the exclusion to descendant or child processes, enable it.
3. Save or assign the policy and wait for the provider-recommended propagation time.
4. Restart the asset if the security product requires a reboot before updated exclusions take effect.
5. Run a controlled AIR task. Confirm that the task completes and the expected evidence is uploaded, then check the security product's detection, quarantine, and event views for new entries that reference the excluded paths or binaries.
6. If detections continue, verify that immediate subdirectories are covered. Add a separate, explicit rule for the affected path and test again.
Contact your EPP, EDR, or antivirus provider if the behavior still differs from its documented matching rules.
## Related articles
- [AIR Watchdog Folder](watchdog-folder) — what the Watchdog folder contains and why it must be excluded
---
# AIR Watchdog Folder
> Source: https://kb.binalyze.ai/air/setup/responder-deployment/responder-exception-rules/watchdog-folder.html
#### AIR Watchdog Folder:
`C:\ProgramData\.binalyze-air\` or `%ProgramData%\.binalyze-air\*`
The **AIR Watchdog Folder** (`C:\ProgramData\.binalyze-air\` or `%ProgramData%\.binalyze-air\`) is a critical directory used by the **AIR responder** for storing internal data required to maintain and monitor the health and proper functioning of the AIR responder agent. This folder contains temporary files, logs, and configuration data that help the **Watchdog** component of the AIR platform ensure that the responder agent is running correctly and automatically restarts the agent if any issues arise.
#### Purpose of the Watchdog Folder
1. **Health Monitoring**:\
The Watchdog monitors the responder agent's status. If the agent stops unexpectedly or malfunctions, the Watchdog uses this folder to store diagnostic data and trigger the necessary actions (e.g., restarting the agent).
2. **Temporary Storage**:\
The folder stores temporary files used by the AIR responder during its forensic and investigative processes. These may include logs, process monitoring data, or execution-related files.
3. **Configuration Data**:\
The directory can also house configuration and state files that help the agent track its operational state, ensuring that it maintains continuity of processes even in the event of interruptions.
#### Exception Configuration
When configuring **EDR (Endpoint Detection and Response)** or **AV (Antivirus)** software, it is essential to exclude this folder from being scanned or interfered with. Failure to do so may cause unnecessary alerts or interruptions to the operations of the AIR responder, potentially halting the forensic collection process or causing data collection to fail.
#### Folder Path Variations
* **Absolute Path**:\
`C:\ProgramData\.binalyze-air\*`\
This is the standard path used by the AIR Watchdog on Windows systems.
* **Environment Variable Path**:\
`%ProgramData%\.binalyze-air\*`\
This variation uses the `%ProgramData%` environment variable, which points to the `C:\ProgramData\` folder. It's a more dynamic way of referencing the same location in different system configurations.
#### Importance of Allow-Listing This Folder
For AIR to function seamlessly, especially during critical incident response tasks, excluding this folder from AV/EDR scans or interference is vital. The **Watchdog** service ensures that the responder remains operational and recovers automatically if disrupted.
To ensure uninterrupted operation, follow these allow-listing rules in your security setup:
* **Windows AV/EDR Systems**: Allow-list the folder `C:\ProgramData\.binalyze-air\*`
* **Linux/macOS Equivalents**: Similar watchdog components may exist in those environments within paths like `/usr/share/.binalyze-air/` or `/opt/binalyze/air/agent/` (adjust based on OS).
By allowing the Watchdog folder, you ensure AIR remains resilient and responsive, even in the event of unexpected issues.
---
# FDA via Jamf and Apple's PPPC utility
> Source: https://kb.binalyze.ai/air/setup/responder-deployment/fda-via-jamf-and-apples-pppc-utility.html
**Jamf** is a software company that supplies one of the most well-known and popular **Mobile Device Management (MDM)** software solutions used to manage Apple devices. Using Jamf, and following the steps below, you can **silently grant full disk access to AIR responder's remotely.**
**Full Disk Access (FDA)** on macOS can be activated by importing a **Privacy Preferences Policy Control (PPPC)** config file instead of manually providing permission options via the Jamf UI.
#### Why is FDA required?
AIR (and all other platforms) will only achieve complete macOS data acquisitions if FDA is enabled. Typically some of the artifacts that will give partial or no results if FDA is not active include:
* App Usage
* Bluetooth Connections
* Document Revisions
* Downloads
* DS\_Store
* Notification Info
* TCC
A **PPPC config file** in macOS manages permissions for apps to access sensitive data and system features like Full Disk Access, camera, and microphone. It's used by organizations to pre-configure these permissions, often through MDM, ensuring necessary apps run without user prompts. These files are in `.mobileconfig` (XML) format and help balance security with convenience by automating privacy settings for applications.
**Steps to follow:**
1. Download and open the Jamf PPPC Utility: [https://github.com/jamf/PPPC-Utility/releases/tag/1.5.0](https://github.com/jamf/PPPC-Utility/releases/tag/1.5.0)
2. From a MacBook where AIR is already installed, go to the path /opt/binalyze/air/agent, drag the "air" binary to PPPC Utility, and you will be able to see identifier details
3. In properties - "Full Disk Access" -> Choose "Allow"
4. Bottom right, Click "Save", and provide a Payload Name, for example, "AIR"
5. Save AIR.mobileconfig.
FDA via Jamf and Apple's PPPC utility: Adding AIR to PPPC and generating the config file for Jamf
Now you can Import the saved config file into Jamf - Configuration Profiles.
Identifier and Identifier Type for importing the config created using PPPC utility to achieve FDA:
FDA via Jamf and Apple's PPPC utility: Importing the config created using PPPC utility to achieve FDA
#### Verification of Full Disk Access:
* An entry is created in /Library/Application Support/com.apple.TCC/TCC.db for all the applications that were assigned FDA (Manual Install)
* For remote deployments, an entry is created in /Library/Application Support/com.apple.TCC/MDMOverrides.plist
* For practical verification, users should try to collect KnowledgeC evidence. Successful collection confirms that the responder has Full Disk Access.
* Reference: [https://docs.sophos.com/central/customer/help/en-us/PeopleAndDevices/ProtectDevices/EndpointProtection/MacCheckSecurityPermissions/index.html#terminal](https://docs.sophos.com/central/customer/help/en-us/PeopleAndDevices/ProtectDevices/EndpointProtection/MacCheckSecurityPermissions/index.html#terminal)
---
# Responder Tamper Detection
> Source: https://kb.binalyze.ai/air/setup/responder-deployment/responder-tamper-detection.html
## Overview
Tamper Detection is a security feature that protects the integrity and continuous operation of AIR Responders. When enabled, the Responder watchdog actively monitors the agent for interference, modification, or attempts to disable it. If suspicious activity is detected, the watchdog immediately reports the event to the AIR console.
This feature is critical in high‑security environments where maintaining asset visibility and control is essential.
## How Tamper Detection Works
Tamper Detection is handled by the `agent-watchdog` component. When a tamper condition is detected, the watchdog sends an HTTP POST request to:
```
{ConsoleAddress}/api/endpoints/{EndpointID}/event-log
```
Important behavior:
- The watchdog does **not** use the current agent configuration for reporting.
- It uses a **backup configuration** saved during installation.
- This ensures reporting still succeeds if the current config is missing or maliciously modified.
If reporting fails:
- Events are queued on disk.
- Retries use exponential backoff.
- Maximum retry duration is approximately **1 day**.
- Reporting supports Relay and proxy configurations if configured.
## Where Tamper Events Appear
Tamper Detection events are posted to the AIR console event log endpoint and are visible in **Activity > Audit Logs**. You can filter by:
- **EventClass** = `TamperDetectionEvent`
- **Category** = `System`
- **Source** = `agent-watchdog`
See [Console Audit Logs](../../features/console-audit-logs) for details on access, filtering, and retention.
## Tamper Detection Event Types
There are three Tamper Detection event types. All share the following common properties:
```
EventClass = TamperDetectionEvent
Category = System
Severity = S
Source = agent-watchdog
```
### 1) agent-not-found
**Title format**
```
Tamper detected (agent-not-found) on asset {AssetName}
```
**Trigger condition**
The Responder executable file no longer exists on disk.
**Detection logic**
The watchdog checks the agent binary path using:
```
os.Lstat()
```
If the check returns `fs.ErrNotExist`, the event is triggered.
**Typical scenarios**
- Responder was uninstalled.
- The agent executable was manually deleted.
- The installation directory was removed.
**Meaning**
The Responder binary is missing from the system.
### 2) agent-suspended
**Title format**
```
Tamper detected (agent-suspended) on asset {AssetName}
```
**Trigger condition**
The Responder binary exists on disk, but the agent process is not running.
**Detection logic**
After confirming the binary exists, the watchdog checks whether the agent holds its single‑instance lock.
**Platform-specific behavior**
- **Windows**: checks for named mutex `Global\AIRAgentRunning`
- **Unix-based systems**: checks file lock using `flock` on:
```
/var/run/Binalyze.AIR.Agent.pid
```
If the lock is not held, the agent is considered suspended.
**Typical scenarios**
- Responder service manually stopped using `sc stop`, `systemctl stop`, or `launchctl unload`
- Agent process crashed and did not restart
- Service disabled
**Meaning**
The Responder binary exists but the service is not running.
### 3) agent-config-changed
**Title format**
```
Tamper detected (agent-config-changed) on asset {AssetName}
```
**Trigger condition**
The current agent configuration differs from the watchdog’s backup configuration.
**Detection logic**
When installed, the watchdog stores a backup copy of the agent configuration. Each time it runs, it compares the current configuration with the backup. If differences are detected in monitored fields, the event is triggered.
**Monitored configuration fields**
Only the following fields are included in the tamper comparison:
| Field | Description |
| --- | --- |
| `ConsoleAddress` | AIR console URL |
| `RegisteredTo` | Registration URL |
| `SecurityToken` | Authentication token |
| `EndpointID` | Unique asset ID |
| `DebugLogging` | Debug logging flag |
| `CACert` | TLS CA certificate |
| `ProxyEnabled` | Proxy enabled flag |
| `OrganizationID` | Organization identifier |
**Excluded from comparison**
- `RelayURL`
**Typical scenarios**
- Console address modified to redirect to another server
- Security token changed
- Asset ID altered
- CA certificate modified
- Debug logging enabled/disabled outside normal console operations
**Meaning**
The Responder configuration has been modified outside expected console‑controlled operations.
## Additional Watchdog Behavior
### Update handling
If the watchdog detects a `.update` trigger directory, it **skips all checks** to avoid false positives during updates. If the directory is older than **10 minutes**, it is considered stale, removed, and normal checks resume.
### Uninstall handling
If a `.uninstall` trigger directory exists, the watchdog treats the removal as intentional. Process checks are skipped.
## Example Event Structure
Example event fields:
- `Title` = Tamper detected (agent-not-found) on asset 110-Win2025-Responder
- `EventClass` = TamperDetectionEvent
- `Category` = System
- `Severity` = S
- `HeaderEventSource` = System
- `EventDate` = 2026.02.11 15:12:47
- `ID` = 7f370182-6a09-4b2f-befd-4a56fcfe05ea
- `Time` = 2026-02-11T16:51:55.3001356+04:30
- `Type` = agent-not-found
- `Source` = agent-watchdog
- `Version` = 2.85.0
- `Platform` = windows
- `EventLogId` = 2050eab7-3278-4085-b84c-38ca2759ee25
- `EventSource` = System
- `AssetName` = 110-Win2025-Responder
This is how a tamper event appears in the AIR console. To view it, go to **Activity** → **Audit Logs** and filter for `TamperDetectionEvent`.
Responder Tamper Detection: Example of agent-not-found event
## Summary Table
| Event Type | Trigger Condition | Meaning |
| --- | --- | --- |
| `agent-not-found` | Agent executable missing | Responder removed or binary deleted |
| `agent-suspended` | Binary exists but process not running | Service stopped, disabled, or crashed |
| `agent-config-changed` | Configuration differs from backup | Configuration modified outside console |
## Why Tamper Detection Is Critical
Tamper Detection ensures:
- Early detection of malicious interference
- Continuous monitoring of asset integrity
- Protection against unauthorized configuration changes
- Reliable alerting even if the agent is modified or removed
---
# Responder in Windows 'Safe Mode'
> Source: https://kb.binalyze.ai/air/setup/responder-deployment/responder-in-windows-safe-mode.html
AIR Responder is now capable of functioning in Safe Mode, allowing forensic acquisition and remote tasking on machines operating in a restricted state. However, to maintain full functionality and allow task execution via the AIR Console, specific registry modifications must be applied before entering Safe Mode.
### Enabling AIR Responder in Safe Mode
Before booting into Safe Mode, execute the following Registry modifications to register the AIR Responder Service:
`REG ADD "HKLM\SYSTEM\CurrentControlSet\Control\SafeBoot\Network\Binalyze.AIR.Agent.Service" /VE /T REG_SZ /D "Service" /F`
`REG ADD "HKLM\SYSTEM\CurrentControlSet\Control\SafeBoot\Minimal\Binalyze.AIR.Agent.Service" /VE /T REG_SZ /D "Service" /F`
These registry changes can also be enforced via the Windows UI by running msconfig to get to the System Configuration window where in the Boot tab, the user can select Safe Boot with the Network button active:
Responder in Windows 'Safe Mode': Boot Options
These registry entries ensure the AIR Responder Service is recognized and loaded in Safe Mode.
### Behavioral Scenarios
**Safe Mode with Networking**
* If a machine enters Safe Mode with Networking, the AIR Responder will continue operating as expected, maintaining communication with the AIR Console.
**Safe Mode (Without Networking)**
* The AIR Responder cannot communicate with the console if networking is unavailable unless an off-network package is used for forensic acquisitions.
**Remote Task Execution**
* Without the registry modifications, the AIR Console cannot issue remote tasks to the assets in Safe Mode.
* Adding the registry keys before booting into Safe Mode ensures that Responder and interACT remain functional.
#### Manual Execution in Safe Mode (Not Recommended)
* If the registry modifications are not applied and the AIR Responder does not load, users can manually execute AIR.exe after entering Safe Mode to establish a temporary connection.
* However, this approach is not recommended due to potential inconsistencies and administrative overhead.
By proactively applying the recommended registry changes, organizations can ensure seamless forensic investigations even when assets are booted in Safe Mode.
### Related: Windows Recovery Environment (WinRE)
For systems that cannot boot normally, off-network Responders can also operate in offline mode within Windows Recovery Environment (WinRE) to collect evidence such as registry hives, event logs, and file artifacts. For more details, see [Evidence Collection in Windows Recovery Environment](../../features/off-network-endpoint/#evidence-collection-in-windows-recovery-environment-winre).
---
# Proxy Configurations
> Source: https://kb.binalyze.ai/air/setup/responder-deployment/proxy-configurations/index.html
Configure proxy settings for the AIR Responder so it can communicate with the AIR console and evidence repositories through your network proxy.
[Adding proxy to Responder](adding-proxy-to-responder)
[Additional Proxy Details](additional-proxy-details)
---
# Adding proxy to Responder
> Source: https://kb.binalyze.ai/air/setup/responder-deployment/proxy-configurations/adding-proxy-to-responder.html
### Why Proxy Support
Responder establishes connections to remote servers over HTTP, HTTPS, NATS, SFTP, FTPS, SMB, and Websocket over HTTPS. Please note that the supported protocols are subject to change in the future.
Responder primarily communicates with the AIR console via HTTP/S, as HTTP/S is the most essential protocol.
There is a requirement to tunnel the responder's connections over a different server, not to directly communicate with the AIR console or other servers. As a result, we implemented the proxy feature for all types of communication methods, which is entirely optional. Although it is optional, we enable the Proxy feature of the responder by default during the initial installation. However, previous installations without the proxy feature are unaffected, and the feature remains disabled. This means upgrading an existing responder to a version `<= v2.15.x` will not be affected by this new feature as long as it is not enabled explicitly. Enabling and disabling the proxy feature manually is documented below. Please note that, as of now, the only way to enable or disable the proxy feature is to run the related commands on the machine. That is to say, it cannot be changed remotely via the AIR console.
### Proxy Server Types
In this document, we are only interested in Forward proxy servers. Other types of proxy servers, such as reverse proxy servers and transparent proxy servers, are out of scope.
**We only support forward proxy servers that support HTTP Tunneling with the HTTP Connect method and SOCKS5 proxy servers.**
Note that we also support HTTP proxy servers using SSL/TLS encryption via HTTPS protocol; however, the SSL certificate of the server must be a valid certificate, or the CA certificate of the server certificate must be loaded to the machine to determine whether the encrypted connection is secure or not.
The responder uses the system's SSL/TLS certificate validation methods and the AIR console's CA certificate to validate the certificates of the remote server.
We will also describe how we handle Authenticated Proxy Servers below.
We anticipate encountering more issues with HTTPS proxy servers, authenticated proxy servers, and SSL interception/bumping in the future. Because of this, the proxy configuration of these types of servers and the Agent must be performed carefully.
### Configure Proxy Settings
There are different ways to configure the proxy settings for all supported platforms, including the machine and the responder. Due to historical reasons, responders can detect proxy settings on different platforms from various sources. As a result, our detection of the proxy settings logic is described below.
1. **Config gate:** If `ProxyEnabled: false` or the `ProxyEnabled` option is missing in the agent's `config.yml` file, we skip reading proxy settings. A missing `ProxyEnabled` option means `ProxyEnabled: false`, implicitly.
2. **AIR-specific override:** Try to find proxy settings using `AIR_HTTP_PROXY` and `AIR_HTTPS_PROXY` environment variables. If these are set, they take precedence and override all other proxy configurations. These variables are cross-platform and can be defined on Windows, macOS, and Linux.
3. **Standard global variables:** Try to find proxy settings using the standard `HTTP_PROXY`, `HTTPS_PROXY`, `http_proxy`, and `https_proxy` environment variables. If no AIR-specific variables are present, the responder automatically detects these parameters. Since these are industry-standard global variables, they are also valid across all operating systems.
4. **OS proxy settings:** If no proxy environment variables are set, we use the operating system's API to retrieve the proxy settings.
Note that setting one of the `HTTP_PROXY`, `HTTPS_PROXY`, `AIR_HTTP_PROXY`, or `AIR_HTTPS_PROXY` environment variables is sufficient to define a global proxy address across Windows, macOS, and Linux systems.
You must restart the responder's service if there is a change in the environment variables or `config.yml` file to let the Agent take the new values into account.
#### Configure Proxy Settings on Linux
`AIR_HTTP_PROXY`, `AIR_HTTPS_PROXY`, `HTTP_PROXY`, `HTTPS_PROXY`, `http_proxy`, and `https_proxy` proxy server environment variables are used if they are set. We use them to configure the Agent's proxy behavior. In addition to these environment variables `AIR_NO_PROXY`, `NO_PROXY`, and `no_proxy` environment variables are also used if they are set as long as a proxy server is set in the proxy environment variables.
We use an additional `AIR_` prefix for responder-specific proxy environment variables to let users set a proxy server for only the Agent or use a different proxy server for the responder.
Since the Agent runs as a service or daemon, users need to configure the proxy settings using the following method.
If `/etc/environment.d/binalyze-air-agent.conf` does not exist, create it.
Open `/etc/environment.d/binalyze-air-agent.conf` and add the following example lines to it:
`AIR_HTTP_PROXY=proxy.example.com:3128 AIR_HTTPS_PROXY=proxy.example.com:4128 AIR_NO_PROXY=localhost,127.0.0.0/8,::1`
The responder's systemd service file will read the changes made to the edited file. Therefore, it is necessary to reload the changes and restart the service for the changes to take effect. You can do this by running the following commands:
`sudo systemctl daemon-reload sudo systemctl restart Binalyze.AIR.Agent.service`
You should keep in mind that using systemd's approach to override service settings to set proxy settings can create an issue after uninstalling the responder from the machine. Because the overridden service settings are retained after uninstallation, installing a responder to that machine after uninstallation will utilize the overridden service configuration.
#### Configure Proxy Settings on macOS
Setting proxy environment variables is a way to configure a proxy for the responder.
As the agent works as a daemon in the macOS system with root privileges under the `launchd` service manager, we can set the environment variables like this
Open the launchd.conf file to add environment variables (Note that the file may not exist, you can create it)
`sudo nano /etc/launchd.conf`
Append the proxy environment variables like this. Alternatively, you can skip `AIR_` prefix but it will affect other programs in the system.
`# ... setenv AIR_HTTP_PROXY proxy.example.com:3128 setenv AIR_HTTPS_PROXY proxy.example.com:4128 setenv AIR_NO_PROXY *.local,169.254/16`
The method above will require a reboot to be effective. Alternatively, you can use the other methods mentioned below without needing to reboot.
The second method for setting environment variables on macOS is to use the following commands.
`sudo launchctl setenv AIR_HTTP_PROXY proxy.example.com:3128 # You should use the same command for other environment variables`
The method above requires restarting the responder's service like this:
`sudo launchctl unload /Library/LaunchDaemons/com.binalyze.air-agent.plist sudo launchctl load -w /Library/LaunchDaemons/com.binalyze.air-agent.plist`
***
Apple explains the third way to set a proxy for macOS systems with this link [Change proxy settings on Mac](https://support.apple.com/guide/mac-help/change-proxy-settings-on-mac-mchlp2591/mac)
You should bear in mind that only HTTP and HTTPS proxies are supported via `System Settings > Network > ... > Proxies` not SOCKS or other types.
macOS saves the credentials of the proxies set by System Sessions to the Key Chain. The responder doesn't support Key Chain access to get the credentials, so we don't recommend using authenticated proxies using this method. You can set the username and password of the proxy server using environment variables, which are explained in this document.
#### macOS launchd Tips
**Question:**
**How do I set environment variables that persist across reboots for a specific daemon/service on a macOS system?**
**Answer:**
To set environment variables that are persisted across reboots for a specific daemon or service on a macOS system, you can use the `launchctl setenv` command as follows:
1. Identify the name of the daemon or service that you want to set the environment variables for. This name is typically specified in the `Label` key in the daemon's property list file, which is stored in `/Library/LaunchDaemons` or `/System/Library/LaunchDaemons` for system-level daemons, or in `~/Library/LaunchAgents` for user-level daemons and services.
2. Use the `launchctl setenv` command to set the environment variables for the daemon or service, using the `-n` option to specify the name of the daemon or service. For example, to set the `FOO` environment variable to `bar` for the `com.example.myservice` service, you would use the following command:
`sudo launchctl setenv -n com.example.myservice FOO bar`
1. To verify that the environment variable has been set, you can use the `launchctl getenv` command, using the `-n` option to specify the name of the daemon or service. For example:
`sudo launchctl getenv -n com.example.myservice FOO`
This should print `bar`.
Keep in mind that the `launchctl setenv` command only sets environment variables for processes launched by `launchd`, and it does not modify the environment of processes that are already running. If you want to set environment variables for a running process, you will need to use a different method, such as setting the variables in the process's shell configuration file or using the `export` command in the process's shell.
Also, note that the `launchctl setenv` command only sets environment variables for daemons and services managed by `launchd`. If you want to set environment variables for other processes, you will need to use a different method.
The responder's service/daemon name is `com.binalyze.air-agent` on macOS systems.
#### Configure Proxy Settings on Windows
As explained for Linux and macOS, the responder can also use the specified proxy environment variables for Windows.
The responder runs as a service using SYSTEM account on Windows systems. Because of this, a user's proxy settings cannot be accessed by the SYSTEM account without using unnecessarily complex methods.
The responder can only access the system's environment variables, not the user's environment variables.
The first method is to use the proxy environment variables to set a proxy for the responder. There are different ways to set environment variables for Windows.
**Question:**
**Please instruct me on how to set system environment variables for Windows systems.**
**Answer:**
To set system environment variables on a Windows system, you will need to follow these steps:
1. Press the Windows key + R to open the Run dialog.
2. Type "sysdm.cpl" and press Enter to open the System Properties window.
3. Switch to the "Advanced" tab.
4. Click the "Environment Variables" button.
5. In the Environment Variables window, you can set system environment variables by doing the following:
* To set a new system environment variable, click the "New" button under the "System variables" section.
* To edit an existing system environment variable, select it from the list and click the "Edit" button.
1. In the Edit Environment Variable window, enter the name and value for the environment variable.
Samples:
* Variable Name: `AIR_HTTP_PROXY` | Value: `proxy.example.com:3128`
* OR
* Variable Name: `HTTP_PROXY` | Value: `proxy.example.com:3128`
2. Click "OK" to save the changes.
3. Close the Environment Variables and System Properties windows.
Note: You will need to have administrator privileges to make these changes.
***
The second method is to use the `netsh` command to set winhttp proxy.
**Question:**
**Please instruct me on how to set a proxy using the netsh command on a Windows system with an administrator account.**
**Answer:**
1. Press the Windows key + X and select "Command Prompt (Admin)" to open an elevated Command Prompt window.
2. Type the following command and press Enter to set the proxy server:
`netsh winhttp set proxy [proxy_server_name]:[port]`
Replace `[proxy_server_name]` and `[port]` with the actual values for your proxy server and port.
1. If your proxy requires authentication, you can use the following command to set the username and password:
`netsh winhttp set proxy [proxy_server_name]:[port] "user=[username]&password=[password]"`
Replace `[proxy_server_name]`, `[port]`, `[username]`, and `[password]` with the actual values for your proxy server, port, username, and password.
1. To verify that the proxy has been set, you can use the following command:
`netsh winhttp show proxy`
This will display the current proxy settings.
Note: You will need to have administrator privileges to run these commands.
***
The third way of setting a proxy is to use the `netsh winhttp set advproxy` command. This is introduced after Windows 11.
Create a settings.json file like this:
`{"Proxy": "10.211.55.3:3128", "ProxyBypass": "", "AutoconfigUrl": "", "AutoDetect": false}`
Run the command like this:
`netsh winhttp set advproxy setting-scope=machine settings-file=settings.json`
To clear advproxy settings, you need to run the same command but settings.json should have empty fields like this
`{"Proxy": "", "ProxyBypass": "", "AutoconfigUrl": "", "AutoDetect": false}`
***
The fourth way of setting a proxy using the Windows registry is as follows:
Open the registry editor and go to the Internet Settings key
`HKEY_LOCAL_MACHINE\SOFTWARE\Microsoft\Windows\CurrentVersion\Internet Settings`
Set the values using proxy settings like this
`[HKEY_LOCAL_MACHINE\SOFTWARE\Microsoft\Windows\CurrentVersion\Internet Settings] "ProxyEnable"=dword:00000001 "ProxyOverride"="*.noproxy.example.com" "ProxyServer"="example.com:3128" "AutoConfigURL"="http://example.com/wpad.dat"`
You need to restart the responder's service if proxy settings are changed.
### Authenticated Proxies
The responder obtains the proxy server's authentication information using the proxy server's URL. For example, if a proxy is set using an environment variable `AIR_HTTP_PROXY=http://username:password@example.com:3128` then the responder parses the URL and uses the username and password of the proxy server to send to the proxy server with an HTTP header, e.g. `Proxy-Authorization: Basic encoded-credentials`\`
For authenticated SOCKS5 proxy servers, the URL structure is the same for authorization, and it uses the SOCKS5 protocol's authentication method, e.g. `socks5://username:password@example.com:1080`
### Additional Proxy Details
For advanced topics—static vs automatic proxy, NATS and evidence repository tunneling, and SSL bumping/interception—see [Additional Proxy Details](additional-proxy-details).
### Enable / Disable Proxy
By default, the proxy support is enabled after fresh new installations of version `>=2.16.x`.
When the proxy support is enabled, the `config.yml` file contains the`ProxyEnabled: true` entry. When this configuration is set to `false` or missing, it means it is disabled.
You can enable or disable proxy support by running the following commands after the installation or upgrade is successful. Note that you must be an administrator or root to run these commands.
##### Windows Enable:
`"C:\Program Files (x86)\Binalyze\AIR\agent\AIR.exe" configure --enable-proxy`
##### Windows Disable:
`"C:\Program Files (x86)\Binalyze\AIR\agent\AIR.exe" configure --disable-proxy`
##### Linux/macOS Enable:
`/opt/binalyze/air/agent/air configure --enable-proxy`
##### Linux/macOS Disable:
`/opt/binalyze/air/agent/air configure --disable-proxy`
These commands enable or disable proxy support to perform the following actions.
* Check if the configuration change can be applied; otherwise, exit
* Stop the responder's service
* Change the responder's configuration
* Start the responder's service
Note that exit code 0 (zero) means success. Other exit codes indicate that an error occurred.
---
# Additional Proxy Details
> Source: https://kb.binalyze.ai/air/setup/responder-deployment/proxy-configurations/additional-proxy-details.html
This page covers advanced proxy topics: static vs automatic proxy behavior, NATS and evidence repository tunneling, and SSL bumping/interception.
### Static vs Automatic Proxy
Automatic proxy means that we use the URL of the PAC file to get the proxy URL from the Operating System. Automatic proxy support is only applicable to macOS and Windows platforms. Other proxy settings are considered static proxy settings, and they require restarting the responder service if any changes are made.
There may be some issues if Automatic Proxy is used with our Isolation feature on Windows.
Because, for automatic proxies, wpad.dat or PAC files are fetched from the AutoConfigURL address by the Windows platform's own services. Therefore, these services may not have access to the target URL during DNS resolution or HTTP request processing. This may grant the responder direct access to the remote servers, bypassing the proxy. If a direct connection is not allowed from that machine, the responder will not be able to communicate with the AIR console. It is recommended that users exercise such scenarios for Windows platforms.
### NATS & Evidence Repositories
The responder uses a NATS client to connect to a NATS server over port 4222. NATS is used to get notifications from the AIR console about the tasks in the queue. This helps the responder complete tasks promptly when assigned.
As our proxy requirement for the responder is to connect over a proxy server always, if it is set, the responder tries to connect to the AIR console's NATS server using HTTP or SOCKS5 proxies, like regular HTTP connections. It uses the same HTTP Connect method to create a tunnel to the server for the NATS protocol.
If the proxy server does not support tunneling on port 4222, the responder attempts to connect to the NATS server directly, thereby bypassing the proxy server. Note that this is the default behavior for all non-HTTP protocols, SMB, FTPS, and SFTP.
SMB uses port 445.
SFTP uses port 22.
FTPS uses port 21 and high ports for data transfer.
If the proxy server is configured to open a tunnel for our supported protocols, there shouldn't be any problem. Because of the fallback mechanism we use to bypass the proxy server when creating a tunnel fails, the responder should be able to send data to the remote server.
### SSL Bumping/Interception
If the proxy server is configured to intercept SSL traffic between the responder and the AIR console, several essential points must be considered.
1. CA certificate of the AIR console should be considered valid by the proxy server. Otherwise, the proxy server cannot open a tunnel to the AIR console.
2. The responder uses Websocket for interACT communication over the HTTPS protocol. However, some proxy servers, e.g., Squid, may not support WebSocket communication well when SSL Bumping is enabled. So, the proxy server must be configured to handle Websocket over HTTPS with SSL bumping if interACT is used. This can be verified by opening an interACT terminal on the AIR console and seeing the established connection.
---
# Security
> Source: https://kb.binalyze.ai/air/setup/security/index.html
[Two-factor authentication (2FA)](two-factor-authentication-2fa)
---
# Two-factor authentication (2FA)
> Source: https://kb.binalyze.ai/air/setup/security/two-factor-authentication-2fa.html
In AIR (Settings > Security > Authentication), two-factor authentication (2FA) is a security feature designed to enhance user account protection by requiring two forms of verification when logging in. This adds an additional layer of security beyond the traditional username and password combination, significantly reducing the risk of unauthorized access.
Some key points about 2FA in AIR:
* **LDAP User Compatibility with 2FA:** AIR supports two-factor authentication (2FA) for LDAP users. You can easily configure 2FA directly from the account settings within AIR, making the setup process straightforward and efficient for centralized user management systems.
* **Administrators can enforce two-factor authentication (2FA) for all users.** This uniform security policy enhances overall security by requiring all users to authenticate with an additional method, such as a one-time password (OTP) sent to a mobile device or generated by an authenticator app.
* **Individual 2FA Setup and Reset:** Users can enable two-factor authentication (2FA) independently in 'Account > Setup Two Factor Authentication'. Global Admin and users with the "user update" privilege can reset 2FA.
Two-factor authentication: Set up
* **Enhanced Security Posture**: By enabling 2FA, AIR significantly reduces the risk of unauthorized access, even in the event of compromised credentials. This is a critical step in safeguarding sensitive investigation data and maintaining the confidentiality and integrity of your forensic and cybersecurity operations.
* **User-Friendly Configuration**: The integration of 2FA in AIR is designed to be user-friendly, making it easy for administrators to enable and enforce 2FA without complex configuration steps.
* If you have activated the AIR SSO feature, this will override 2FA.
:::caution
**Troubleshooting 2FA Issues: Time Synchronization**
If you are experiencing issues with Two-Factor Authentication (2FA) in AIR, it may often be due to time synchronization problems on your system. Ensuring your system's time is correctly synchronized with an NTP (Network Time Protocol) server is crucial for the proper functioning of 2FA.
**Steps to Check Time Synchronization:**
1. **Run the `timedatectl` Command:** Open a terminal and execute the following command:
```html
timedatectl
```
2. **Verify the Output:** After running the command, check the output for the following two lines:
* **System clock synchronized:** `yes`
* **NTP service:** `active`
Here's an example of what the correct output should look like:
3. **What to Do if the Time is Not Accurate:** If your system clock is not synchronized or the NTP service is not active, this could be the root cause of your 2FA issues. To resolve this, you may need to synchronize your system's time using NTP.
**How to Synchronize Your System Time:**
1. **Enable NTP Synchronization:** You can synchronize your system's time by running:
```bash
sudo timedatectl set-ntp true
```
2. **Re-check the Time Status:** After enabling NTP, re-run the `timedatectl` command to ensure that the system clock is now synchronized and the NTP service is active.
By ensuring your system's time is accurate and synchronized, you can help prevent potential issues with 2FA in AIR. If the issue persists even after correcting the time, please contact our support team for further assistance.
:::
---
# Settings
> Source: https://kb.binalyze.ai/air/settings/index.html
[Console Settings](console-settings/)
[Organization Settings](organization-settings)
[Account Settings](account-settings)
---
# Console Settings
> Source: https://kb.binalyze.ai/air/settings/console-settings/index.html
Console Settings: Categories in AIR's Secondary Menu
All console settings can be accessed via the gear icon in the top-right corner of the header bar. This page provides a complete guide to configuring and managing settings across AIR, including:
* **General Settings**: Platform-wide configurations.
* **Assets**: Managing asset inventories.
* **Security**: Setting up security features.
* **Features**: Customizing AIR’s core functionalities.
* **Evidence Repositories**: Configuring storage for collected evidence.
* **Policies**: Defining evidence collection rules.
* **User Management:**
* Users
* Groups
* UserRoles
* **Backup and Backup History**: Managing backups and retention schedules.
* **Investigation Hub Disk Usage: E**mpowers users to manage **Investigation Hub data storage** effectively.
* **Danger Zone.**
Each section ensures optimal setup for your AIR environment.
:::note
**Viewing and copying timestamps in the Console**
Throughout the Console (e.g. Evidence Repositories, Tasks, Cases, Assets, Acquisition Profiles, API Tokens), you can hover over any timestamp in a table to see a pop-over with that time in multiple formats—UTC (ISO 8601), UTC, local timezone, relative (e.g. “an hour ago”), and epoch. You can copy any format for reports or external tools; copying creates an event record for audit.
:::
Console Settings: Contextual pop-over that reveals different time formats
---
# General
> Source: https://kb.binalyze.ai/air/settings/console-settings/general.html
### **Version Information**
This section provides details on the versions of various components of the AIR platform, helping administrators ensure that all parts of the system are up to date.
1. **AIR**: The main application version (e.g., 4.41.1). This represents the core platform's release and includes the latest features and security updates.
2. **DB (Database)**: The version of the database used by AIR (e.g., 6.0.7), which stores all data related to the platform’s tasks and configuration settings.
3. **Responder**: The version of the AIR responder (e.g., 2.50.5) installed on assets for data acquisition and remote interaction.
4. **DRONE**: The version of the DRONE analysis engine (e.g., 3.11.0), which processes collected evidence to deliver findings and insights on this and some live artifacts through automated analyzers.
5. **TACTICAL**: These versions indicate the status of various responders for different operating systems, including Linux, macOS, Windows, and the legacy version for older Windows systems. For example, the latest responders are at version 3.12.1, ensuring compatibility with the latest operating system environments.
6. **MITRE ATT\&CK Analyzer**: This version (e.g., 7.0.0) refers to the built-in mapping against the MITRE ATT\&CK framework, which helps identify adversary tactics, techniques, and procedures during investigations.
7. **Disk Image Explorer**: This component (e.g., version 1.0.0) provides functionality for exploring disk and volume images acquired during investigations.
### **Logging**
1. **Log Level**: Determines the level of verbosity in logging within AIR. Adjusting the log level can help with debugging or tracking system activity.
2. **Log Files**: Provides access to the system's log files, which are helpful for auditing, troubleshooting, and reviewing system performance and security events.
### **License**
This section provides details about the current licensing status of the AIR installation.
1. **License Key**: Displays the license key currently in use (e.g., TEST-LICENSE).
2. **Valid Until**: The expiration date of the license (e.g., 2025.09.29), indicating the duration for which the platform is licensed.
3. **Max Client**: The maximum number of assets (clients) that can be managed under this license (e.g., 1,000,000 assets).
4. **In Use**: The number of assets currently being monitored by AIR (e.g., 447,908 assets).
5. **Remaining**: The number of asset slots still available (e.g., 552,092 assets). This helps ensure scalability and license compliance.
### **Connection**
1. **Console Address**: This is the current address of the AIR Console (e.g., air-demo.ACME.com), where asset responders poll to check for any tasking assignments that require execution.
* **Important**: Changing this address will trigger a **migration process**, which will cause all assets to connect to the new address while they are deregistered from the old one.
2. **Console Proxy**: Settings for configuring an internet proxy that AIR can use to connect to external services, such as updates or external evidence storage.
* **Address**: The IP address of the proxy (e.g., 10.0.0.1).
* **Port**: The port used for proxy communication (e.g., 0).
* **Username and Password**: Credentials for authenticating with the proxy.
3. **Certificate Authority (CA)**: If your organization uses a custom CA for SSL communication, this setting allows you to upload the certificate in the appropriate format for secure connections between assets and the AIR Console.
### **System Resources**
Displays information about the system where AIR is installed, helping monitor and optimize performance.
1. **CPU**:
* **Cores**: The number of processor cores (e.g., 8), indicating the processing power available for handling AIR tasks.
* **CPU Type**: Details of the CPU model (e.g., Intel Xeon Processor, Skylake architecture).
* **Flags**: A list of supported CPU features (e.g., SSE, HT, etc.), indicating hardware capabilities relevant to performance.
2. **Memory**:
* **Total Memory**: The total available system memory (e.g., 32.87 GB).
* **Used Memory**: The amount of memory currently in use (e.g., 5.29 GB).
* **Free Memory**: The remaining available memory (e.g., 27.58 GB), ensures that there are enough resources to handle future operations.
3. **File System**:
* **Total Storage**: The total storage space available (e.g., 315.93 GB).
* **Used Storage**: How much storage is currently used (e.g., 189.46 GB).
* **Partition**: The partition where AIR data is stored (e.g., /dev/sdb1). Monitoring this ensures sufficient space for data storage and logging.
---
# Assets
> Source: https://kb.binalyze.ai/air/settings/console-settings/assets.html
### **Responder Updates**
Manage how AIR Responders on your assets receive version updates.
Under **Settings → Assets → Responder Updates**, you can:
* Choose **Manual Updates** (assign an upgrade task) or **Automatic Updates**
* Configure the **Default policy** schedule used when no custom policy matches
* Create **custom update policies** and **exclusion policies** based on asset filters
* Review matching assets before you save
To assign an immediate or scheduled update task to one or more assets, see [How do I update Responders on assets?](../../faqs/how-do-i-update-endpoints).
:::note
"The asset's AIR Responder must be updated to accept tasks" appears when an asset is in an **Update Required** state. Update that Responder with Automatic Updates (if eligible) or by assigning an **Update Responder Version** task.
:::
For the complete model—including policy precedence, manual exclusions, schedules, and troubleshooting—see **[Responder Updates](assets/responder-updates)**. To read the update state of an individual asset, see [Responder Update Status](assets/responder-update-status). To review past attempts, see [Responder Update History](assets/responder-update-history).
:::note
**Backward Compatibility for AIR and Responder Updates**
Clarifying Backward Compatibility since AIR v4.29+
**Overview**\
In AIR v4.29, we introduced a major improvement: **decoupling AIR console updates from Responder updates**. This gives teams greater flexibility when deploying AIR updates, especially in large-scale environments.
**What This Means (and What It Doesn’t)**
* **Starting with AIR v4.29**, the AIR console can be updated independently of Responder updates.
* All AIR versions (4.29 and onward) will maintain **backward compatibility** with Responders **that are also on version 4.29 or newer**.
* **Responders running versions older than 4.29 (e.g., 2.54.3)** are **not compatible** with certain key features such as:
* Evidence acquisition
* Hunt/Triage
* interACT
Users with older Responder versions will see messages like:
> _"The asset’s AIR Responder must be updated to accept tasks."_
**To summarize:**\
Backward compatibility was introduced with AIR version 4.29 and **onwards**. If your Responders are still on versions earlier than 4.29, they **must be upgraded at least once** to benefit from this compatibility model going forward.
:::
### **Tamper Detection**
Enable alerts for tampering attempts on responders.
* When **Tamper Detection** is enabled, the responder will actively monitor its own operation for any interference or attempts to disable it.
* **Functionality**: If there is an attempt to modify or interfere with the responder (e.g., by disabling it or altering its files), the responder will notify the AIR Console, ensuring that any malicious attempts are flagged immediately.
* This feature is critical for ensuring the integrity and continuous operation of responders in high-security environments.
* For details, see [Responder Tamper Detection](../../setup/responder-deployment/responder-tamper-detection).
### **Uninstall Protection**
Prevent unauthorized uninstallation of responders by requiring a Console-generated uninstall code.
* When this feature is enabled, users must supply a valid **uninstall code** to uninstall the responder from an asset. This prevents unauthorized personnel from removing the responder, which could otherwise leave the asset vulnerable or unmonitored.
* **Uninstallation Method**: Manual uninstallation is restricted to shell commands, meaning the responder can't be removed via a simple GUI or file system manipulation, adding an extra layer of security.
* **Managing codes**: Use **New Code** to generate a Console-wide uninstall code (valid for approximately 30 days) and **Revoke All Codes** to rotate the signing key and invalidate all previously generated codes. Console-initiated uninstall tasks do not require a manual code.
* For details, see [Uninstalling Responders](../../self-hosted/setup/uninstalling-responders).
### **Active Directory (AD) Integration**
Synchronize assets from Active Directory with AIR.
* This feature allows AIR to integrate with your **Active Directory (AD)** environment. You can specify the **AD server** (e.g., 10.0.0.1) and the **domain** (e.g., company.local) to automatically synchronize information about computers and users from AD into AIR.
* **LDAP Synchronization**: By manually starting the **LDAP synchronization**, you can query Active Directory for specific objects such as computers, ensuring that AIR can discover and manage assets from your organization's AD.
* The **Query For Computers** field (e.g., `(&(objectCategory=computer))`) uses an LDAP filter to query and sync only computer objects from the directory.
* **Authentication**: You will need to provide an **AD username and password** to authenticate and pull information from the directory.
---
# Responder Updates
> Source: https://kb.binalyze.ai/air/settings/console-settings/assets/responder-updates.html
## Overview
AIR Responders installed on your assets must stay compatible with the Console. **Responder Updates** control how and when those Responders receive the current Responder version packaged with your Console.
You can:
- Update Responders **manually** by assigning an **Update Responder Version** task
- Update Responders **automatically** using a **Default policy** and optional **custom policies**
- **Exclude** groups of assets from automatic updates with exclusion policies
- **Manually exclude** individual assets from updates
- See why a specific asset is or is not eligible for automatic updates on the asset detail page
Automatic updates always target the Responder version that matches your Console. There is no per-policy target version selector.
:::note
Responder update policies are **not** the same as acquisition Policies (evidence collection, isolation, resource limits). They only control Responder version updates.
:::
---
## Manual Updates vs Automatic Updates
| Mode | What happens |
| --- | --- |
| **Manual Updates** | Responders update only when an administrator assigns an **Update Responder Version** task. Saved automatic policies remain stored but are **not enforced**. |
| **Automatic Updates** | Managed assets update according to the **Default policy** and any matching **custom policies**, when they next check in with the Console and are eligible. |
You select the mode under **Settings → Assets → Responder Updates**.
:::tip
You can keep custom policies configured while Manual Updates are selected. They become active again when you switch back to Automatic Updates and save.
:::
---
## Global Responder Update settings
### Open the settings
1. Open **Settings**.
2. Go to **Assets**.
3. Find the **Responder Updates** section.
Changes on this page are kept in a draft until you click **Save**. Leaving the page with unsaved changes shows a confirmation prompt.
### Switch to Automatic Updates
1. Select **Update asset Responders automatically**.
2. Confirm when prompted (type **Enable** when asked).
3. Review the summary of enabled and disabled custom policies, and the Default policy schedule.
4. Click **Save**.
:::caution
Enabling Automatic Updates removes manually scheduled Responder update tasks that are still scheduled or assigned. Only proceed if you accept that impact.
:::
### Switch to Manual Updates
1. Select **Update asset Responders manually (by assigning an upgrade task)**.
2. Confirm when prompted (type **Manual** when asked).
3. Click **Save**.
Automatic configuration (Default policy and custom policies) remains stored but inactive.
### Choose what happens when an update conflicts with running tasks
An update restarts the Responder, so it cannot run at the same time as an acquisition, Hunt/Triage, or other task. Under **When an update conflicts with running tasks**, choose which takes priority:
| Option | Behaviour |
| --- | --- |
| **Wait for running tasks to finish** | The update starts automatically once every running task completes, provided the update window is still open. Otherwise it moves to the next window. |
| **Stop running tasks and update immediately** | Running tasks are cancelled so the update can start. They must be started again manually. |
Responder Updates: Choosing what happens when an update conflicts with running tasks
This setting governs automatic updates. When you assign a manual update to an asset that has running tasks, AIR asks you to confirm first and tells you how many tasks would be stopped.
Responder Updates: Confirmation shown before a manual update stops running tasks
---
## Default policy
When Automatic Updates are enabled, the **Default policy** applies to managed assets that **do not match any enabled custom policy**.
- Behaviour: **Update automatically**
- Target: Managed assets that do not match any custom policy
- You can edit the **schedule** only
- The Default policy **cannot be deleted or disabled**
### Edit the Default policy schedule
1. Under **Default policy**, click **Edit schedule**.
2. Choose either:
- Update at **any time**, or
- A recurring **time window** (days of the week, start and end time, and timezone)
3. Apply the drawer changes, then click **Save** on the settings page.
Timezone options:
- **Use each asset's local timezone**, or
- A **specific timezone** you select
:::note
The "applies to up to N managed assets" count for the Default policy is an **approximate upper bound**. Assets that match a custom policy follow that policy instead.
:::
---
## Custom update policies
Custom **update policies** refine Automatic Updates for filtered groups of managed assets. Each update policy can use its own schedule and timezone.
Typical uses:
- Update Windows workstations only during a maintenance window
- Use a different schedule for a production organization or tag
- Roll updates for one platform earlier than another
### What an update policy controls
| Field | Description |
| --- | --- |
| **Policy name** | Unique name shown in Settings and on asset status |
| **Behaviour** | **Update automatically** |
| **Filter** | Asset conditions that must match |
| **Enabled** | Disabled policies are ignored |
| **Schedule** | Any time, or a day/time window with timezone |
Update policies do **not** set a specific Responder version. Matching eligible assets receive the Console's current Responder version.
---
## Exclusion policies
An **exclusion policy** uses the same filter model as an update policy, but its behaviour is **Exclude from automatic updates**.
Matching managed assets **never update automatically**, even when the Default policy would update them.
Exclusion policies:
- Do **not** use a schedule
- Do **not** block manually assigned **Update Responder Version** tasks
- Can be enabled or disabled like update policies
:::tip
Use exclusion policies for groups (for example, all Linux servers or a `no-auto-update` tag). Use **manual exclusion** for individual critical assets.
:::
---
## Manually excluded assets
You can exclude a specific asset from Responder updates without creating a policy.
### Exclude an asset
From the asset list (bulk actions) or asset actions, choose the exclude-from-updates action and confirm.
While an asset is manually excluded:
- It does **not** receive automatic Responder updates
- Queued update tasks are **not delivered** until the asset is included again
- The asset detail **Responder Update Status** shows **Manually excluded from updates**
### Include an asset again
Use **Include in updates** from the asset detail status card, asset actions, or bulk actions, then confirm.
:::caution
If an asset is manually excluded, include it again before you expect an assigned update task to run on that asset.
:::
---
## Policy matching and precedence
Custom policies have **no priority order**. AIR evaluates matching as follows when Automatic Updates are enabled:
```text
1. Is the asset manually excluded?
→ Yes: do not update automatically (and do not deliver update tasks until included)
2. Is global mode Manual Updates?
→ Yes: policies are inactive; update only via assigned tasks
3. Does any enabled exclusion policy match?
→ Yes: do not update automatically
4. Does any enabled update policy match?
→ Yes: update only if at least one matching update policy's schedule window is open
(if all matching update windows are closed, the Default policy is NOT used)
5. No custom policy matches?
→ Use the Default policy schedule
```
Disabled policies are ignored.
### Decision examples
| Situation | Result |
| --- | --- |
| Global Manual Updates | No automatic updates; assign tasks manually |
| Manually excluded, matches an update policy | Remains excluded until included again |
| Matches an exclusion policy and an update policy | **Excluded** (exclusion wins) |
| Matches two update policies; either window is open | Eligible during an open matching window |
| Matches an update policy; all matching windows are closed | **Not** eligible; Default schedule does not apply |
| Matches no custom policy | Follows the Default policy |
| Policy disabled | Treated as if the policy does not exist |
:::note
If several exclusion or update policies match, the status card may show one of the matching policy names. The effective outcome still follows the rules above (any exclusion blocks; any open update window can allow).
:::
---
## Create, edit, enable, disable, and delete policies
### Create a custom policy
1. Under **Custom policies**, click **Add policy**.
2. Enter a unique **Policy name**.
3. Choose **Behaviour**:
- **Update automatically**, or
- **Exclude from automatic updates**
4. Add at least one **filter** condition.
5. For update policies, configure the **schedule** if needed.
6. Click **Apply changes** in the drawer.
7. Click **Save** on the settings page.
:::note[Important]
Drawer changes are applied to your draft only. They take effect after you save the main settings page.
:::
### Edit a policy
Open the policy from the custom policy list, change fields, apply drawer changes, then **Save**.
### Enable or disable a policy
Use the enable/disable control on the policy card, then **Save**.
- **Active:** Automatic Updates are on and the policy is enabled
- **Inactive:** Manual Updates are on (policy stored but not enforced), or the policy itself is disabled
### Delete a policy
1. Delete the policy and confirm.
2. **Save** the settings page.
Deleting an update policy may cause matching assets to follow another matching policy or the Default policy.
Deleting an exclusion policy may make matching assets eligible for automatic updates again.
---
## Configure asset filters
Filters select which **managed** assets a custom policy applies to. The UI always scopes policies to managed assets.
Supported filter fields include:
| Field | Typical use |
| --- | --- |
| Organization | Limit to one or more organizations |
| IP address | Match management or interface addresses |
| Device name | Hostname patterns |
| Label | Asset label text |
| Group path | Asset group location |
| Operating system | OS string (for example, Windows, Ubuntu) |
| Responder version | Current Responder version on the asset |
| Tags | One or more tags |
| Platform | Windows, Linux, macOS, and other supported platforms |
| Server | Whether the asset is classified as a server |
Combine conditions with the filter builder (AND/OR groups) using operators such as equals, contains, matches, in, and all/not-all for tags.
:::note
Matching asset counts and the Matching Responders view include **managed** assets only.
:::
---
## Preview matching assets
On a policy card:
- Review the **matching asset** count
- Click **View matches** to open **Matching Responders**
- Search by device name and page through results
Counts reflect filter matches for managed assets. They do not by themselves prove that an asset is currently inside an update window or free of manual exclusion.
---
## Identify why an asset is or is not updating
The asset detail page answers this in two places.
### Responder Update Status
Open the asset → **General** (or asset overview) and find **Responder Update Status**. It summarises the asset's eligibility under your policies.
| Status | Meaning |
| --- | --- |
| **Manually excluded from updates** | Asset-level exclusion is active |
| **Automatic updates are disabled** | Global Manual Updates mode |
| **Excluded from automatic updates** | An exclusion policy matches |
| **Automatic updates enabled** | Eligible via a matching update policy or the Default policy |
It may also show:
- The matching **policy** name (when applicable)
- The effective **schedule** summary
- Shortcuts to **Include in updates**, **Assign an update task manually**, or **Manage Responder update settings**
### Version update card
Higher up the same page, the **Version update** card reports what is happening right now rather than what your configuration allows. It shows the current and target versions, the lifecycle status, and the specific reason an update is waiting, scheduled, or failed — plus **Update now** and **View update history**.
Use **Responder Update Status** to check whether your policies make an asset eligible, and the **Version update** card to find out why an eligible asset has not updated yet.
For the full status reference — the nine statuses, the distinct waiting reasons, retry timing, and the at-a-glance view in the Assets list — see [Responder Update Status](responder-update-status).
---
## Manually update one asset
Use this when you need an immediate or scheduled update outside (or in addition to) automatic policy behaviour.
High-level steps:
1. Open the asset.
2. For an immediate install, expand **Version update** and choose **Update now**.
3. To schedule, or to use the full drawer, start **Update Responder Version** (from asset actions or **Responder Update Status → Assign an update task manually**).
4. Configure the task in the drawer (now or later), then assign it.
For detailed drawer steps and screenshots, see [How do I update Responders on assets?](../../../faqs/how-do-i-update-endpoints).
:::note
Only assets that need a Responder update can be selected for the update task. Assets already on the current Console Responder version are not eligible for selection.
:::
---
## Manually update multiple assets
1. In the asset list, select the assets (or use a filter and bulk selection).
2. From the bulk actions bar, choose **Update Responder Version**.
3. Complete the **Update Responder Version** drawer.
If some selected assets are already current, the drawer limits selection to assets that require an update.
See the FAQ for the full drawer workflow.
---
## Immediate and scheduled update tasks
The **Update Responder Version** drawer supports:
| Option | Behaviour |
| --- | --- |
| **Now** | Assign the update task immediately |
| **Schedule for later** | Choose timezone (asset timezone or a selected timezone) and start time |
Scheduling a new update for an asset **replaces** any previously scheduled Responder update for that asset.
:::tip
When Automatic Updates are enabled, prefer policies for recurring updates across your assets. Use scheduled manual tasks for one-off maintenance windows or exceptions.
:::
Full steps: [How do I update Responders on assets?](../../../faqs/how-do-i-update-endpoints)
---
## Version update statuses vs Assets Summary labels
Two Console surfaces use similar wording for different jobs. Do not treat them as the same label set.
### Version update card and Assets list Version column
These report the live Responder update lifecycle. Common idle or behind-target states include:
| Status | Meaning |
| --- | --- |
| **Update required** | The Responder is older than a release Binalyze has marked as mandatory and must be updated (for example, to accept tasks) |
| **Update available** | A newer Responder version can be installed; automatic updating is not applying it for this asset (for example, global Manual Updates) |
| **Up to date** | The asset runs the target version; automatic update is not issued and manual update selection is unavailable |
The full set of nine statuses, waiting reasons, and retry rules is in [Responder Update Status](responder-update-status).
### Assets Summary (Home)
The Assets Summary widget still uses endpoint **issue** labels for fleet counts and filters:
| Label | Meaning |
| --- | --- |
| **Update Required** | Same urgency class as the Version update **Update required** status — the Responder must be updated for compatibility |
| **Update Advised** | The Responder is on an older version and an update is recommended (`OldVersion` issue). This Home label is not the Version update card's **Update available** status |
Automatic updates run when the asset checks in, is eligible under precedence and schedule rules, and is behind the Console Responder version. AIR also limits how many Responder updates run at the same time across the environment; see [Concurrent update limit](responder-update-status#concurrent-update-limit).
---
## Recommended practices
1. Start in **Manual Updates** while you design filters and schedules, then switch to Automatic after reviewing Matching Responders.
2. Keep the **Default policy** conservative (for example, a maintenance window) if most assets should wait for off-hours updates.
3. Use **update policies** for clear cohorts (platform, organization, tags).
4. Use **exclusion policies** for groups that must never auto-update.
5. Use **manual exclusion** for individual critical servers.
6. After changing policies, open a representative asset's **Responder Update Status** and **Version update** card to verify eligibility and live state.
7. Remember that enabling Automatic Updates clears outstanding scheduled/assigned manual update tasks.
---
## Examples
### Automatically update Windows assets during a maintenance window
1. Enable **Automatic Updates** and save.
2. Add an **update policy** named for example `Windows maintenance`.
3. Filter: Platform is Windows (add other conditions as needed).
4. Schedule: your maintenance days and hours; choose asset timezone or a fixed timezone.
5. Apply and **Save**.
6. Use **View matches** to confirm the cohort.
Assets that match this policy follow its window. They do **not** fall back to the Default policy if that window is closed.
### Exclude Linux servers from automatic updates
1. Add an **exclusion policy**.
2. Filter: Platform is Linux (optionally Server is true).
3. Apply and **Save**.
Matching Linux servers skip automatic updates. You can still assign **Update Responder Version** tasks to them when needed.
### Different policies by tag or organization
1. Create an update policy filtered by Tag (for example `tier-1`) with an earlier window.
2. Create another update policy filtered by Organization or Tag `tier-2` with a later window.
3. Leave remaining assets on the Default policy.
If an asset matches both an exclusion policy and an update policy, it is excluded.
### Manually exclude a critical server that matches an update policy
1. Open the critical asset.
2. Exclude it from updates and confirm.
3. Confirm **Responder Update Status** shows **Manually excluded from updates**.
The asset stays excluded even if it still matches an update policy. Include it again when you are ready to update.
### Determine why an asset is not receiving automatic updates
Start on the asset detail page, then fall back to policy checks:
1. Open the **Version update** card — the status badge and explanation name the current blocker (window, maintenance, running tasks, capacity, failure, and so on). See [Responder Update Status](responder-update-status).
2. Open **View update history** (or the **Version Updates** tab) if the card shows **Failed** or repeated retries. See [Responder Update History](responder-update-history).
3. Check **Responder Update Status** for eligibility: **manually excluded**, global **Manual Updates**, or an **exclusion policy**.
4. If an **update policy** matches with a **closed** window, the Default schedule does not apply for that asset.
5. Confirm the asset is not already **Up to date**, and that it is managed and checking in.
---
## Troubleshooting
| Problem | What to check |
| --- | --- |
| No assets update automatically | Confirm Automatic Updates is selected and saved; confirm assets are managed and online/checking in |
| Asset matches my update policy but never updates | Open the **Version update** card first; then check manual exclusion, exclusion policies, and whether the policy schedule window is open — closed grant windows do not use Default |
| Asset still follows Default after I created a policy | Confirm the policy is enabled, saved, and that the asset appears under Matching Responders |
| I assigned an update but nothing happens | If the asset is manually excluded, include it first; confirm the asset needs an update; confirm the task was not cleared by enabling Automatic Updates; check history for a failed or cancelled attempt |
| Enabling Automatic cleared my scheduled updates | Expected behaviour — scheduled/assigned Version Update tasks are removed when Automatic Updates is enabled |
| Unexpected policy name on the status card | Multiple policies may match; verify all matching update and exclusion policies, not only the displayed name |
| Changes in the policy drawer did not apply | Click **Save** on the main settings page after applying drawer changes |
---
## Permissions
| Action | Typical privilege requirement |
| --- | --- |
| Change Responder Updates settings and policies | Settings save permission |
| Exclude or include assets; assign Update Responder Version | Assign version update task permission |
| View asset Responder Update Status | Endpoint / asset view permission |
Exact role names depend on your configured roles.
---
## Related articles
- [Responder Update Status](responder-update-status) — status reference, the Version update card, retry timing, and the Assets list view
- [Responder Update History](responder-update-history) — past attempts and failure diagnosis
- [How do I update Responders on assets?](../../../faqs/how-do-i-update-endpoints) — assign immediate or scheduled update tasks
- [Assets (Console Settings)](../assets) — Asset Settings overview, including Tamper Detection and related controls
- [Post-Deployment Configuration Guide](../../../self-hosted/setup/post-deployment-configuration-guide/) — self-hosted setup checklist
---
# Responder Update Status
> Source: https://kb.binalyze.ai/air/settings/console-settings/assets/responder-update-status.html
[Responder Updates](responder-updates) explains how you configure automatic updating. This page explains how to read the result: what AIR decided for a given asset, and why.
Two surfaces answer that question. The **Version update** card on the asset detail page gives the full explanation for one asset, and the **Version** column in the Assets list gives an at-a-glance view across all your assets.
:::note
The asset page also has a **Responder Update Status** field that summarises whether your policies make the asset eligible for automatic updating. That is a question about configuration; this page is about what is happening right now. See [Responder Updates](responder-updates#responder-update-status).
:::
:::note
Detailed update status is available from AIR v5.24 onwards. Earlier versions report eligibility only, without lifecycle statuses, wait reasons, attempt counts, or update history.
:::
## The Version update card
Open an asset and expand **Version update**. The card shows the fields relevant to the current state:
| Field | What it tells you |
|-------|-------------------|
| **Current version** | The Responder version installed on the asset |
| **Target version** | The version AIR wants the asset to reach |
| **Automatic updates** | Whether automatic updating is enabled globally, plus a shortcut to the settings page |
| **Update policy** | The policy governing this asset. If more than one policy matches, a `+n` badge lists the others. |
| **Running-task policy** | Whether an update waits for running tasks or stops them |
| **Next attempt** | When the next automatic attempt becomes possible |
| **Attempts** | The attempt count against the automatic attempt limit, for example *Attempt 3 of 5* |
Beneath the fields, a short explanation names the current blocker, and the **Update now** and **View update history** actions let you act on it.
Selecting the policy name opens a preview of that policy, so you can check its schedule and reach without leaving the asset.
Responder Update Status: Policy preview opened from the Version update card
Responder Update Status: The Version update card while an update is being installed
## Status reference
The card and the Assets list share the same nine statuses. AIR evaluates them in a fixed order and shows the first one that applies, so an asset always has exactly one status.
| Status | Meaning |
|--------|---------|
| **Unsupported OS** | Responder updates are not available for this operating system. Manual updates are unavailable too. |
| **Updating** | An update task is assigned, or the Responder is installing the update |
| **Waiting** | The asset is eligible, but something is deferring the update |
| **Failed** | The last attempt did not succeed |
| **Scheduled** | The update will start in the next configured update window |
| **Excluded** | The asset is excluded from automatic updates; manual updates are still possible |
| **Update required** | The Responder is older than a release Binalyze has marked as mandatory, and must be updated |
| **Update available** | A newer Responder version can be installed |
| **Up to date** | The asset runs the target version |
When an asset is up to date there is nothing to explain or act on, so the card stays collapsed to a single line.
Responder Update Status: An asset already running the target version
Every other status expands to show the versions, the governing policy, and the reason behind the current state.
Responder Update Status: An asset scheduled for the next update window
### When no automatic update is coming
Three statuses mean the asset will not update on its own, so the card explains what to do instead.
**Update available** appears when a newer Responder version exists but automatic updating is switched off for the asset. Nothing happens until you install it manually.
Responder Update Status: A newer version available while automatic updates are off
**Update required** is more urgent. The Responder is older than a release Binalyze has marked as mandatory, so it can no longer accept every kind of task. Update it as soon as you can.
Responder Update Status: A Responder below the mandatory version
**Unsupported OS** means the operating system cannot receive Responder updates at all. Neither automatic nor manual updating is possible, so no **Update now** action is offered.
Responder Update Status: An operating system that cannot receive Responder updates
## Why an update is waiting
**Waiting** always comes with a specific reason, so you can tell a temporary delay from a configuration problem:
| Reason shown | What to do |
|--------------|------------|
| A task is currently running on the asset | Nothing. The update starts after the task finishes, if the update window is still open. |
| The asset is in maintenance mode | End [Maintenance Mode](../../../features/maintenance-mode) when the work is complete. |
| The concurrent update limit has been reached | Nothing. The update starts when a slot becomes available. See [Concurrent update limit](#concurrent-update-limit). |
| The last attempt failed | Nothing. The next automatic attempt is shown under **Next attempt**. |
| The update will start in the next eligible update window | Widen the schedule on the governing policy if the window is too narrow. |
| The update will start when the asset next contacts AIR | Check that the asset is online and able to reach the Console. |
| Automatic updates are disabled | Use **Update now**, or switch the Console back to automatic updates. |
Responder Update Status: An update deferred because the asset is in maintenance mode
An asset that is eligible in every other respect still has to contact the Console before the update can be handed to it, so an offline asset waits without any configuration being at fault.
Responder Update Status: An update waiting for the asset to contact the Console
An excluded asset never retries automatically. When exclusion applies, the card says so instead of promising a retry.
Responder Update Status: An asset excluded by policy, with manual update still offered
## Update state in the Assets list
In the Assets list, the **Version** column shows a coloured status dot next to the Responder version whenever an asset needs attention. Hovering the dot reveals the status, its reason, and the next attempt time where one applies. Assets that are up to date show no dot, so the column stays quiet until something needs looking at.
Responder Update Status: Status indicators beside the Responder version in the Assets list
To narrow the list down to a particular state, add a **Version Status** condition in **Advanced Filters**.
:::note
The **Excluded** indicator covers only assets you excluded manually. Assets blocked by an exclusion policy keep their underlying status instead. To review policy-driven exclusions, open **Settings → Assets → Responder Updates**.
:::
The **Last Seen** column continues to describe connectivity. Whether an asset is reachable and whether it is eligible to update are separate questions, and the **Version update** card is the place to answer the second one.
## Retry behaviour and limits
When an automatic attempt fails, AIR retries with an increasing delay rather than immediately:
| Rule | Value |
|------|-------|
| Automatic attempts per target version | 5 (the first attempt plus 4 retries) |
| Delay between retries | 15 minutes, then 1 hour, 4 hours, and 12 hours |
| Time allowed for a Responder to acknowledge an update | 1 hour, after which the attempt is closed as a dispatch timeout |
| Re-check interval while waiting for running tasks | 5 minutes |
Retries are still subject to the update window, so a retry that becomes due outside the window waits for the window to open. This means an attempt can land later than the interval alone suggests.
Responder Update Status: A failed attempt with the next retry time and attempt count
After 5 failed automatic attempts for the same target version, AIR stops retrying and shows **Failed** with an explanation. Automatic updating resumes when a new target version becomes available. To act sooner, use **Update now**, or investigate the failure first using [Responder Update History](responder-update-history).
## Concurrent update limit
To protect your network and the Console, AIR updates a limited number of Responders at the same time. By default, up to **50** assets can be updating concurrently. Assets that become eligible while every slot is taken show **Waiting** and start as soon as a slot frees up, provided their update window is still open.
Responder Update Status: An asset waiting for a free update slot
Self-hosted administrators can change this limit with the `AIR_MAX_CONCURRENT_VERSION_UPGRADE_LIMIT` environment variable on the Console. Raising it speeds up large rollouts at the cost of more simultaneous package downloads; lowering it is useful on constrained links. On SaaS deployments the limit is managed by Binalyze.
## Related articles
- [Responder Updates](responder-updates) — update modes, Default policy, custom policies, exclusions, precedence
- [Responder Update History](responder-update-history) — past attempts and failure diagnosis
- [How do I update Responders on assets?](../../../faqs/how-do-i-update-endpoints) — assign immediate or scheduled update tasks
- [Maintenance Mode](../../../features/maintenance-mode) — how maintenance defers automatic updates
---
# Responder Update History
> Source: https://kb.binalyze.ai/air/settings/console-settings/assets/responder-update-history.html
Every Responder update attempt is recorded, whether AIR started it automatically or an operator triggered it. The history tells you what was tried, who or what started it, how it ended, and why — which is what you need when an asset has fallen behind the rest of your estate.
Open it from the **Version Updates** tab on the asset detail page, or from **View update history** on the **Version update** card.
:::note
Responder update history is available from AIR v5.24 onwards. Attempts made before an upgrade to v5.24 are not backfilled.
:::
## Reading the history
Each row is one update attempt:
| Column | Contents |
|--------|----------|
| **Name** | The version change the attempt aimed for, shown as *from → target* |
| **Status** | The outcome, with a one-line description of what happened |
| **Trigger** | Whether the attempt was **Automatic**, **Manual**, or a **Retry** |
| **Duration** | How long the attempt took, counting up while it is still running |
| **Created At** | When the attempt was created |
| **Created by** | The operator who started a manual attempt, or *System* for automatic ones |
Responder Update History: A failed automatic attempt followed by a successful retry
Selecting the details icon next to a status opens a summary of the attempt: its status and description, the trigger, who initiated it, the previous and target versions, and where the update package was downloaded from.
Responder Update History: Details of a completed update attempt
A stop icon on a row means the attempt cancelled running tasks in order to proceed. Hover it to see how many tasks were stopped; those tasks must be started again manually.
## Attempt outcomes
| Status | Meaning |
|--------|---------|
| **Assigned** | The update task has been created and is waiting for the Responder to pick it up |
| **Updating** | The Responder is installing the update |
| **Completed** | The Responder reached the target version |
| **Failed** | The attempt did not succeed |
| **Cancelled** | The attempt was stopped before it could finish |
Failed and cancelled attempts always carry a reason:
| Description in the history | What happened |
|----------------------------|---------------|
| The Responder reported that the update failed | The update ran on the asset but did not complete. Any error the Responder returned is shown in place of this text. |
| The Responder did not acknowledge the update within the allowed time | The task was assigned but the Responder never started it within an hour. Usually a connectivity problem. |
| Replaced by an update to a newer Responder version | A newer target version was released, so this attempt was abandoned in favour of the newer one. |
| Replaced by a manually initiated update | An operator used **Update now** while this automatic attempt was in progress. See the example below. |
| The automatic update attempt limit was reached | Five automatic attempts failed for the same target version, so automatic retrying stopped. |
| Automatic updates were disabled before this attempt could continue | The Console was switched to manual updates while the attempt was active. |
Responder Update History: A manual update cancelling the automatic attempt it replaced
## Retry chains
A failed automatic attempt is followed by a **Retry** attempt rather than a new independent one, so a chain of related attempts stays readable. Attempt numbering runs through the chain, and the **Version update** card shows the current position as *Attempt n of 5*.
Retry delays increase after each failure — 15 minutes, then 1 hour, 4 hours, and 12 hours — and each retry still has to fall inside an open update window. After the fifth failed attempt, AIR stops retrying for that target version. See [Responder Update Status](responder-update-status) for the full set of timing rules.
## Retention
A weekly housekeeping job keeps the attempts for the five most recent successfully completed target versions per asset and prunes anything older. Attempts that are still assigned or in progress are never removed, so an active update always keeps its full trail.
## Diagnosing a Responder that is not updating
Work through these in order:
1. **Open the Version update card.** The status badge and the explanation beneath it name the current blocker. Most cases end here — the asset is waiting for a window, for maintenance mode, or for a running task.
2. **Check the Update policy field.** If the asset matches an exclusion policy, or is manually excluded, it will never update automatically. See [Responder Updates](responder-updates).
3. **Check Automatic updates.** If the Console is set to manual updates, nothing updates on its own regardless of policies.
4. **Open the update history.** Repeated failures with the same description point to the asset or its environment. A dispatch timeout points to connectivity; a Responder-reported failure points to something on the asset such as disk space or an endpoint protection product blocking the installer.
5. **Try Update now.** A manual update bypasses policies, windows, and the attempt limit. If the manual attempt succeeds, the automatic path was being blocked by configuration. If it fails the same way, the problem is on the asset.
If you need to raise the issue with Binalyze support, include:
* A screenshot of the **Version update** card showing the status and its explanation
* The relevant history row, including the trigger and the status description
* The name of the governing update policy or exclusion
* The attempt number, for example *Attempt 3 of 5*
For Responder problems that are not related to updating, see [Responder troubleshooting](../../../faqs/responder-troubleshooting).
## Related articles
- [Responder Updates](responder-updates) — update modes, policies, exclusions, precedence
- [Responder Update Status](responder-update-status) — status reference and the Version update card
- [Responder troubleshooting](../../../faqs/responder-troubleshooting) — general Responder issues
- [Collecting Responder log files](../../../troubleshooting/how-to-gather-logs-for-troubleshooting/collecting-responder-log-files)
---
# Security
> Source: https://kb.binalyze.ai/air/settings/console-settings/security.html
### **SSL Certificate**
Enable secure connections between AIR Console and users/assets by using SSL encryption.
* **Certificate**: This displays the **SSL certificate** details used by AIR for secure HTTPS communication. In this case, the certificate is issued by **Let's Encrypt** (Issuer: Let's Encrypt, Common Name: R3) and is valid for a specific period (e.g., from **2022.09.18** to **2022.12.17**).
* **Subject**: The **Common Name (CN)** field shows the domain (e.g., air-demo.ACME.com) to which the certificate applies.
* Having an SSL certificate ensures that all communications between users and the AIR Console are encrypted, preventing unauthorized access to sensitive information.
### **SSL Root CA**
Acts as the root certificate authority (CA) for issuing certificates if a custom SSL certificate is not provided.
* AIR generates an SSL Root CA for each instance when a custom certificate isn’t supplied. This certificate is used to create secure communication channels within the system.
* **Issuer and Subject**: Both are **BINALYZE R1**, ensuring that the root certificate is tied to the Binalyze platform.
* **Validity**: The root CA certificate is valid from **2017.10.14** until **2100.10.14**, ensuring long-term use and security.
### **Console Port**
Define the port over which the AIR Console is accessible.
* The **AIR Console** is configured to be accessed on port **8443**, which is a secure port typically used for HTTPS traffic.
* Meanwhile, **responders** will continue to communicate with the console over the default secure port **443**. This setup ensures that assets and users can access the platform via separate but secure ports, enhancing security and flexibility.
### **IP Restriction**
Restrict access to the AIR Console based on IP addresses.
* This feature allows administrators to restrict access to the AIR Console to a specific range of IP addresses, limiting who can interact with the console.
* **Important**: This restriction does **not** affect communication between the AIR Console and the assets themselves. It only controls who can access the console’s user interface.
* The **current IP address** of the user accessing the system (e.g., 172.71.122.69) is displayed for reference.
### **Authentication**
Configure user authentication security settings.
You can **enforce Two-Factor Authentication (2FA)** for all users, adding an extra layer of security by requiring a second form of verification (e.g., a mobile app code) when logging in. (SSO will override this option)
* This setting enhances overall security by ensuring that only authenticated and verified users can access the system.
### **Single Sign-On (SSO)**
Enable and configure Single Sign-On (SSO) for AIR.
* SSO allows users to log in to AIR using their organization’s existing identity provider (e.g., Azure AD, Okta) without needing separate credentials. This simplifies the login process and enhances security by centralizing authentication management.
* **Tenant ID** and **Client ID**: These are provided by the SSO identity provider (e.g., Azure, Okta) and uniquely identify the organization’s SSO configuration.
* **Client Secret**: A secure key used for authenticating the connection between AIR and the SSO provider (shown as encrypted in the system).
* **Callback URL**: This is the URL where users are redirected after successful authentication via SSO (e.g., `https://air-demo.ACME.com/api/auth/sso/azure/callback`) . It ensures that users are logged into the AIR platform after authenticating through the identity provider.
* **Entry Point** and **Issuer**: These fields are also part of the SSO configuration, ensuring that AIR communicates correctly with the identity provider.
* **Certificate**: Uploading a certificate from the identity provider is necessary for secure communication between AIR and the SSO service.
SSO improves user management and security by centralizing login credentials with your existing identity provider, simplifying the user experience while ensuring strong authentication practices.
---
# Features
> Source: https://kb.binalyze.ai/air/settings/console-settings/features.html
### **Enable interACT**
This feature enables or disables the **interACT** functionality in AIR.
* **interACT** allows users to remotely open a shell session to interact with assets. Users can execute commands and scripts based on their assigned privileges.
* **Security Requirement**: To use interACT, users must have enhanced security in place—either **Two-Factor Authentication (2FA)** or **Single Sign-On (SSO)**. This ensures secure access to sensitive systems, limiting unauthorized use.
* Read more about interACT here: [interACT](../../features/interact/)
:::tip
**Two-Factor Authentication (2FA) for isolated AIR installations**
To enhance security, **AIR interACT** requires Two-Factor Authentication (2FA) using **Time-Based One-Time Passwords (TOTP)**. You can set up offline 2FA solutions such as **Google Authenticator** or **Microsoft Authenticator**, making it suitable for use in isolated networks.
**Why is 2FA Mandatory in interACT?**
1. **Preventing Unauthorized Access**\
interACT provides direct access to systems, making security a top priority. Relying solely on a password increases the risk of unauthorized individuals gaining control. 2FA significantly reduces this risk by adding an extra layer of authentication.
2. **Securing Critical Command Execution**\
interACT allows users to execute commands directly on a system. Without a strong authentication mechanism, a malicious actor could exploit access to perform harmful operations. 2FA ensures that only authorized users can issue commands, maintaining system integrity and security.
By enforcing 2FA, interACT safeguards against unauthorized access and potential misuse, ensuring a secure and controlled environment for forensic investigations.
:::
#### **Enforce additional interACT security**
This toggle controls whether Two-Factor Authentication (2FA) is required to use interACT.
| Setting | Behavior |
|---------|----------|
| **ON** | Users must have 2FA enabled to use interACT |
| **OFF** | Any signed-in user can use interACT without 2FA |
:::caution
**Security Consideration**
Disabling this setting removes an important layer of authentication. Only turn it off when operational flexibility is required during live-response investigations, and re-enable it as soon as the situation permits.
:::
### **Resolve Responder Public IP**
This feature allows AIR to capture and associate the public IP of an asset.
* When enabled, the **AIR Console** parses HTTP request headers to extract the `X-Forwarded-For` header provided by proxies. This header reveals the **public IP address** of the responder (asset), even if it's behind a proxy or firewall.
* **Visibility**: If the feature is enabled, AIR will display the `X-Forwarded-For` IP address instead of the communication IP (the one directly visible to AIR). This provides more accurate forensic visibility of an asset's location and origin.
### **Custom Evidence Collection Naming**
Change the location and file name of collected evidence in Assets (on local machines) and remote Evidence Repositories.
You can configure a custom naming template by combining text and variables:
| Variable | Description |
|----------|-------------|
| **Timestamp** (Mandatory) | Date/time of acquisition |
| **Organization Name** | Name of the organization |
| **Acquisition Profile** | Profile used for collection |
| **Task Type** | Type of task performed |
| **Task Name** | Name of the acquisition task |
| **Asset Name** | Name of the asset |
| **Case ID (If Exists)** | Associated case identifier |
:::note
**Naming Rules:**
- Use `/` to create folder structures
- The following characters are not allowed: `< > : " \ | ? * .`
- Folder names are limited to **50 characters**
:::
### **Case Selection**
Enforce mandatory case selection when starting tasks.
* This feature requires users to associate every task they run in AIR with a specific **case**.
* **Benefit**: It enforces structured workflows, ensuring that all investigations are organized and traceable to a particular case, which is critical for auditing and maintaining clarity in incident response efforts.
### **RFC3161 Timestamping**
Provides cryptographic proof of when data was acquired and its integrity.
* RFC3161 timestamping ensures that the data collected during acquisition has a digital signature, proving that the data existed at a specific time and has not been altered since.
* When enabled, every new acquisition task will include a signature file with metadata, adding legal and forensic robustness to your investigation process.
* Read more in this blog: [https://www.binalyze.com/blog/dfir-lab/protect-your-chain-of-custody-with-content-hashing-and-timestamping](https://www.binalyze.com/blog/dfir-lab/protect-your-chain-of-custody-with-content-hashing-and-timestamping)
### **Chain of Custody**
Protect evidence integrity by registering it on the blockchain via LOCARD, which is a blockchain-based system for secure evidence handling in digital forensics. It has seen some adoption in Europe but remains underutilized in the U.S. due to regulatory and infrastructure challenges, leading to slower adoption and less frequent use.
* This feature integrates with **LOCARD**, a blockchain-based platform for evidence integrity. When enabled, the chain of custody for digital evidence is secured by submitting evidence metadata to the blockchain, ensuring it hasn't been tampered with.
* **LOCARD Credentials**: To use this, you'll need to provide the **Organization**, **Host**, **Username**, and **Password** for your LOCARD account.
### **SMTP (Email Configuration)**
Set up email notifications, such as password-reset emails.
* Specifying an **SMTP server** allows AIR to send out automated emails, particularly for password resets. This is useful for self-service password recovery.
* You must configure the SMTP server address, port, sender email, username, and password. For example, using `mail.smtp2go.com` as the server.
### **Syslog / SIEM Integration**
Enable integration with Syslog servers or SIEM systems.
* This feature allows AIR to send event logs to a centralized **Syslog** or **SIEM (Security Information and Event Management)** system for enhanced log monitoring and analysis.
* You will need to configure the **protocol** (TCP/UDP), **server address**, and **port** to send logs from AIR to your preferred log management system.
* You can control **which events** are transmitted via Syslog using one of three modes: **send all events** (default), **include only selected event types**, or **exclude specified event types**. This helps reduce noise in downstream SIEM pipelines while still allowing high-value activities—such as case creation and authentication events—to be streamed when you configure inclusion rules accordingly.
* **Analytics** in the Console reports adoption and usage metrics for this Syslog filtering configuration, supporting audits of how the integration is used over time.
### **Banner Message**
Display a custom banner message across all AIR Console pages.
* This feature allows you to set a **banner message** that will appear on all pages of the AIR Console. This is useful for displaying system notices, warnings, or other important information to all users.
### **Enable Policy**
Enforce task options and preferences across assets.
**Policies** allow administrators to define global task preferences and restrictions for assets in the organization.
* **Customizability**: Policies can be tailored for different subsets of assets using filters, and a user must have the "Override Policy" privilege to modify the default organizational policies.
### **Auto Asset Tagging**
Automate tagging of assets when they are added to AIR.
* When this feature is enabled, AIR automatically applies **asset tags** based on predefined rules as soon as a responder is installed on an asset.
* **Flexibility**: Even if this feature is disabled, users can still run the **Auto Asset Tagging** task manually on assets.
### **Enable/Disable AI Assistant**
Activate AI-powered assistance for investigations.
**AI Assistant** is a chat-based AI helper integrated into AIR. It uses an OpenAI model customized for DFIR workflows and can assist analysts with questions, rule drafting, MITRE ATT&CK guidance, and investigation advice — all within the AIR Console. AI Assistant does not have access to case data, asset information, evidence files, or rule results.
AI Assistant is enabled by default for SaaS customers. Self-hosted (on-prem) customers must provide their own **OpenAI API Key** under **Settings > Features > AI Assistant** to enable this functionality.
---
# Evidence Repositories
> Source: https://kb.binalyze.ai/air/settings/console-settings/evidence-repositories.html
AIR allows you to set up various **Evidence Repositories** for storing and managing collected data securely. The supported repository types are:
1. **SMB**: Ideal for sharing files across network devices.
2. **SFTP**: Utilizes SSH for encrypted data transfer.
3. **FTPS**: Combines FTP with SSL/TLS for secure transfers.
4. **Amazon S3**: Provides scalable cloud-based storage, perfect for large-scale investigations.
5. **Azure Blob**: Microsoft's cloud object storage solution with SAS URL authentication.
6. **Google Cloud Storage (GCS)** (AIR 5.11+): Google's scalable cloud storage using service account authentication.
#### **Key Features:**
* **Global or Organization-Level Setup**: Repositories can be defined at both global and organizational levels, providing flexibility in evidence management across multiple AIR instances or within a single organization.
* **Secure Data Management**: Protocols like SFTP and FTPS ensure that data transfers are encrypted, safeguarding sensitive information during uploads and downloads.
* **Automatic and Manual Uploads**: Evidence can be automatically uploaded to repositories based on configured tasks, or users can manually upload files as needed.
* **Task Management**: Repositories support task scheduling for evidence uploads, ensuring a smooth workflow for collecting, storing, and analyzing evidence.
* **Connection Settings**: When configuring repositories, users must provide essential connection details such as credentials, encryption options, and repository paths. For cloud-based storage like Amazon S3, Azure Blob, and Google Cloud Storage, you also need to configure bucket/container settings and authentication credentials.
This setup ensures secure, scalable, and efficient management of evidence within AIR, accommodating various infrastructure needs.
---
# Policies
> Source: https://kb.binalyze.ai/air/settings/console-settings/policies.html
**Policies** serve to define how evidence is collected and managed, providing fine-grained control over resources and processes.
Policies in AIR provide central configuration management and support global configurations that can be overridden at the Organisation level when required.
This overriding is **only possible** when the user has the “Override Policy” privilege allocated to their role.
#### **Key Components:**
1. **Name & Organization**: Policies must have a unique name and be assigned to a specific organization.
2. **Evidence Storage**: Configures where evidence is stored—either locally (default paths: `Binalyze\AIR\` on Windows, `/opt/binalyze/air/` on Linux/macOS) or in defined repositories like SMB or SFTP.
3. **Resource Limits**: Caps the Responder's resource usage while it executes tasks on an asset, so collections cannot disrupt in-use systems. See [Resource Limits](../../features/policies/resource-limits.md) for every available limit, its default value, enforcement behavior per operating system, and tuning guidance.
4. **Compression & Encryption**: Enables optional compression and encryption of the collected evidence, with a password for added security.
5. **Scan Scope**: You can opt to restrict scans to local drives only, excluding network and external drives.
6. **Isolation Settings**: Policies can include IP/Port and process allow lists for isolation tasks, ensuring that specific communication channels remain open during an asset’s isolation. Allow-list behavior is applied bidirectionally (inbound and outbound), and DNS/DHCP behavior during isolation can be configured based on operational needs.
#### **Use Case Example:**
When creating a policy for a specific investigation, you could configure it to save evidence in an AWS S3 bucket, limit the CPU to 50%, compress the evidence for efficient storage, and ensure network drives are excluded from the scan. You could also configure the policy to allow communication with critical servers even if the asset is isolated.
---
# User Management
> Source: https://kb.binalyze.ai/air/settings/console-settings/user-management/index.html
## **AIR > Settings > User Management > Users**:
This section enables administrators to view existing users and their attributes. It also allows for the addition of new users to the AIR platform, where key details such as name, organization, role, and login credentials are specified during setup.
For organizations needing to onboard multiple users simultaneously, the **Import Users** button provides bulk user import capability via CSV file upload or email list. Optional metadata such as organization, role, or group can be included for automatic assignment. A preview step allows validation before changes are applied, expediting onboarding for large enterprise security operations teams while reducing human error and maintaining consistent access structures.
Mandatory fields are marked with an asterisk (\*).
1. **Full Name**:
* **Name**: The first name of the user being added (e.g., "John").
* **Surname**: The last name of the user (e.g., "Doe"). These fields are crucial for identifying and managing users within the system, particularly in larger organizations.
2. **Username**\*:
* The **username** is a mandatory field (indicated by the asterisk). This is the unique identifier that the user will use to log in to the AIR platform (e.g., `IH_reviewer2@binalyze.com`).
* The username is often based on the user's email address to ensure uniqueness and facilitate easy recognition.
3. **Email**\*:
* The **email** is also a mandatory field. It is used for account-related communications, such as password resets, system alerts, or notifications.
* This email should be valid and associated with the user being created to ensure they receive important platform-related information.
4. User Groups:
* Select the User Groups to which the new user needs to be added.
5. **Organization**\*:
* This field allows you to assign the new user to a specific **organization** within the AIR system.
* If multiple organizations are managed within the AIR platform (e.g., in a multi-tenant setup), you can select the organization to which the user belongs.
* The system can restrict users from viewing or managing other organizations, depending on their access privileges.
* **Note**: If no organization is selected or assigned, the user may have limited or no permissions within the platform.
6. **Role**\*:
* The **Role** dropdown allows you to assign the user's role within the platform. Roles define the level of access and permissions the user will have. Common roles could include:
* **Administrator**: Full access to manage the platform, users, and assets.
* **Investigator**: Access to forensic and incident investigation features.
* **Viewer**: Read-only access to view data and reports.
* This field is crucial for setting user permissions and ensuring that they can only perform actions aligned with their responsibilities.
7. **Password**\*:
* This is where you set the **password** for the user’s account. The password should meet the organization's security requirements (e.g., complexity, length).
* A secure password is crucial to prevent unauthorized access to the platform.
8. **Confirm Password**\*:
* This field is used to **confirm** the password entered above. Ensuring that the passwords match helps avoid login issues caused by incorrect entries.
## **User Actions**
Each row in the Users table has an actions menu. The actions offered depend on your privileges and on the account you are acting on. For example, **Reset Password** requires the **Update User** privilege and is offered only for locally authenticated users.
[Resetting a User Password](resetting-a-user-password)
---
# Resetting a User Password
> Source: https://kb.binalyze.ai/air/settings/console-settings/user-management/resetting-a-user-password.html
In AIR (Settings > User Management > Users), administrators can reset the password of a locally authenticated user who is unable to sign in.
The reset does not produce a password. It produces a **single-use reset link** that you share with the user out of band, such as over chat, phone, or a support ticket. The user opens the link and chooses their own password, so the new credential is never known to anyone but them.
:::note
The reset link behavior described on this page applies to **AIR 5.24 and later**. In earlier versions, the same action assigned a temporary password that was displayed in the Console and had to be changed by the user at their next sign-in.
:::
## Privileges Required
The **Reset Password** action is only available when all of the following conditions are met:
* **Update User privilege:** Your role must include the **Update User** privilege. Among the default roles, only **Org Admin** has it. See [User Roles](user-roles).
* **Organization scope:** The target user must belong to an organization your account manages.
* **Local authentication strategy:** The target must be a local user. Users who sign in through **SSO**, **LDAP**, or an **API** strategy have no AIR-managed password, so their credentials must be reset at the identity provider instead.
* **Not your own account:** To change your own password, use **Settings > Account Settings > Change Password**.
* **Global Admin accounts:** Only a Global Admin can reset the password of another Global Admin. An Org Admin cannot.
* **User Management enabled:** If the **User Management** feature is disabled for the Console, no user actions are offered.
If the action does not appear in a user's row, review the conditions above before reporting an issue.
:::note
Resetting a password does not change the user's two-factor authentication (2FA) state. If the user has also lost access to their authenticator, reset 2FA separately. See [Two-factor authentication (2FA)](/air/setup/security/two-factor-authentication-2fa).
:::
## Resetting a Password from the Console
1. **Open the Users page:** Navigate to **Settings > User Management > Users**.
2. **Locate the user:** Find the user and open the actions menu at the end of their row. The **Strategy** column identifies which accounts are eligible, as **Reset Password** is offered only for `Local` users.
3. **Select Reset Password:** Choose **Reset Password** from the menu.
Resetting a User Password: Reset Password row action
4. **Confirm the warning:** The confirmation states that the user's current password stops working immediately and that you will receive a single-use link to share. Select **Reset Password** to continue.
Resetting a User Password: Reset link confirmation warning
5. **Copy the link:** The **Password reset link created** dialog displays the **Password reset link**. Use the copy button to copy it.
Resetting a User Password: Password reset link created modal
6. **Share the link:** Send the link to the user through a channel you trust.
:::caution
**Treat the reset link as a credential**
Anyone who opens the link before the intended user can set the password for that account. Share it only over a channel where you have confirmed the recipient's identity, and avoid pasting it into shared or long-lived locations such as group chats, tickets, or notes.
:::
The dialog is the only place the link is displayed. If you close it before copying the link, repeat the reset to issue a new one.
## Completing the Reset as a User
1. **Open the link:** The user opens the link you shared.
2. **Set a new password:** AIR presents the **Reset Password** form. Opening the link alone does not consume it, so a link previewed by a mail or chat client remains usable.
Resetting a User Password: Set a new password form
3. **Sign in:** The user submits the new password and signs in with it.
The user is not prompted to change the password again at the next sign-in. The password set through the link is their permanent password.
## Link Lifetime and Reuse
* **Validity:** The link is valid for **60 minutes** from the moment it is issued.
* **Single use:** Once a password has been set through the link, it stops working.
* **Immediate effect:** The user's existing password is invalidated as soon as you confirm the reset, before you share the link.
* **Re-issuing:** Resetting the password again produces a new link and **revokes the previous one**. Only the most recent link remains valid.
* **Expired or used links:** The user is informed that the link is no longer valid. Reset the password again to issue a fresh one.
Because the current password stops working immediately, the user has no access between the moment you confirm the reset and the moment they set a new password. Issue the link when you are ready to share it rather than in advance.
:::note
The link is built from the Console address configured for your deployment. If that address is not reachable from the user's network, the link will not open for them. Confirm the Console address is correct before relying on this flow for remote users.
:::
For self-hosted deployments, the 60-minute lifetime is set by the `AIR_JWT_ADMIN_RESET_PASSWORD_TOKEN_EXPIRES_IN_SECONDS` environment variable, which defaults to `3600`. Restarting the Console invalidates any link that has not yet been used, in which case you must issue a new one.
## Auditing
A complete reset produces two entries in the Console audit log:
* **Password reset initiated for user "username"** is recorded when you issue the link. The event is attributed to the administrator who performed the action, with **Event Source** set to **User**.
Resetting a User Password: Audit log entry for the issued link
* **Password reset for user "username"** is recorded when the user sets their new password. Because the user acts through the link rather than an authenticated session, the event is attributed to **System** and includes the **IP Address** the password was set from.
Resetting a User Password: Audit log entry for the completed reset
Together the two entries show who initiated the reset and whether the user completed it. If only the first entry is present, the link was never used. For more detail on reviewing these records, see [Console Audit Logs](/air/features/console-audit-logs).
## Resetting a Password Without Console Access
When no administrator can sign in to the Console, a password can still be reset from the server using the AIR-CLI. This path assigns a temporary password instead of issuing a link, and the user is prompted to change it at their next sign-in. Use it only as a recovery fallback.
[How to reset the password of a user via the CLI?](/air/self-hosted/faqs/how-to-reset-the-password-of-a-user-via-the-cli)
## Resetting a Password Through the API
The reset-password endpoints behave the same way as the Console action. They return the single-use link rather than a password, and they require the **Update User** privilege:
* `POST /api/public/user-management/users/:id/reset-password`
* `POST /api/user-management/users/:id/reset-password`
The response provides the link and the moment it expires:
:::caution
**Integrations that read a password must be updated**
As of **AIR 5.24**, these endpoints no longer return a `password` field. Update any integration that depends on it to read `resetUrl` instead, deliver the link to the user through a trusted channel, and use `expiresAt` to determine when a new link must be issued. Do not cache or store the link, as it can only be used once.
:::
For payload details and examples, refer to the API documentation at [docs.binalyze.com](https://docs.binalyze.com/).
---
# User Groups
> Source: https://kb.binalyze.ai/air/settings/console-settings/user-management/user-groups.html
**User Groups** are a powerful feature in AIR designed to streamline user access management across organizations, especially in large environments or those using Single Sign-On (SSO).
### What Are User Groups?
User Groups allow you to manage users collectively instead of individually. This simplifies role assignments and organization-level access across AIR. Whether you're handling internal teams or integrating with Azure AD or Okta, User Groups provide scalable, centralized control.
### Why Use User Groups?
Managing user access across multiple organizations can be time-consuming. With User Groups, you can:
* Group users by function, department, or region
* Assign them to organizations and roles in bulk
* Sync groups directly from SSO providers like **Azure AD** or **Okta**
This reduces manual overhead and ensures consistency in access management.
### Accessing the User Groups Page
To access this feature:
* Navigate to **Settings** → **User Groups**
> _Note: Only Global Admins can access and manage User Groups._
### Creating a New User Group
1. Click **Create Group**
2. Enter a **Group Name** (e.g., "HR Team")
3. Optionally, provide a description for context
### Adding Users to a Group
After creating a group:
1. Select users from your existing AIR user list
2. Users in the group automatically inherit all organization and role assignments associated with the group
> _You can always view and manage group membership from the main User Groups table._
### Syncing with SSO (Optional)
If you're using Azure AD or Okta:
* Toggle **"Sync with SSO"** when creating or editing a group
* Once enabled, group membership is pulled from your identity provider
* Manual editing of group members in AIR will be disabled
> _A tooltip will indicate that synced groups are read-only within AIR._
### Assigning a User Group to an Organization
1. Go to **Settings** → **Organizations**
2. Create or edit an organization
3. In **Step 2** of the wizard, assign the desired User Group(s)
All users in the selected group will be granted access to the organization with their predefined roles.
### Managing Group Membership
* In the **User Groups** table, click the **user count** to view members
> _For SSO-synced groups, membership cannot be modified in AIR._
### Safeguards When Removing Users
Users added via a group **cannot be removed individually** from an organization.\
To revoke access:
* Remove the user from the **User Group**
> A tooltip will appear if removal is attempted at the individual level.
### Viewing Group Membership from the Users Page
The **Users** list now includes a **Groups** column to show which user groups a person belongs to. This offers helpful context when reviewing or auditing user access.
### Notes and Limitations
* Only **Global Admins** can create and edit User Groups
* **Group duplication** is not yet available, but it is planned
* When a user is assigned to an organization both individually and via a group, the **group assignment takes precedence**
* To fully remove access, remove the user from the group
### Summary
**User Groups** simplify access control and scale with your environment. Benefits include:
* Centralized user and role management
* SSO directory sync support
* Consistent access inheritance across organizations
Whether you're managing 10 users or 10,000, User Groups provide a more efficient and secure way to manage access in AIR.
---
# User Roles
> Source: https://kb.binalyze.ai/air/settings/console-settings/user-management/user-roles.html
In AIR, the **Global Admin** has full control over managing **118 specific privileges**, allowing the creation of highly customized user roles. This granular access control ensures that each user or group has permissions tailored to their specific needs, such as handling evidence acquisition, interACT sessions, or audit log management.
A useful feature within this setup is the **tooltips** provided alongside each privilege. These tooltips highlight any **dependencies** that may exist between privileges, helping administrators configure roles accurately without unintentionally restricting necessary functions.
For example, an admin could create a role that enables a user to access interACT for remote evidence collection while restricting access to audit logs or system-wide settings. The tooltips ensure that admins are aware of any required privileges to avoid misconfigurations.
This approach provides both flexibility and clarity, empowering admins to manage user roles effectively.
## Default Role Privileges
The tables below show the default privileges assigned to each built-in role. These can be customized by creating new roles with specific privilege combinations.
:::note
**Note:** Global Admin is not shown in these tables as this role has full access to all privileges by default.
:::
:::tip
**Download:** For offline reference or custom analysis, [download the complete privilege matrix as CSV](//assets/Platform_roles_privileges.csv).
:::
---
## System Privileges
### Backup
| Privilege | Org Admin | L1/L2 | L3/L4 | Maintenance | Responder |
|-----------|:---------:|:-----:|:-----:|:-----------:|:---------:|
| View Backup | ❌ | ❌ | ❌ | ✅ | ❌ |
| Backup Now | ❌ | ❌ | ❌ | ✅ | ❌ |
| Delete Backup | ❌ | ❌ | ❌ | ❌ | ❌ |
| Download Backup | ❌ | ❌ | ❌ | ❌ | ❌ |
### License
| Privilege | Org Admin | L1/L2 | L3/L4 | Maintenance | Responder |
|-----------|:---------:|:-----:|:-----:|:-----------:|:---------:|
| View License Key | ❌ | ❌ | ❌ | ✅ | ❌ |
| Update License Key | ❌ | ❌ | ❌ | ✅ | ❌ |
### Organizations
| Privilege | Org Admin | L1/L2 | L3/L4 | Maintenance | Responder |
|-----------|:---------:|:-----:|:-----:|:-----------:|:---------:|
| Create Organization | ❌ | ❌ | ❌ | ❌ | ❌ |
| Delete Organization | ❌ | ❌ | ❌ | ❌ | ❌ |
### Settings
| Privilege | Org Admin | L1/L2 | L3/L4 | Maintenance | Responder |
|-----------|:---------:|:-----:|:-----:|:-----------:|:---------:|
| Save Settings | ❌ | ❌ | ❌ | ✅ | ❌ |
### Others
| Privilege | Org Admin | L1/L2 | L3/L4 | Maintenance | Responder |
|-----------|:---------:|:-----:|:-----:|:-----------:|:---------:|
| Download Server Logs | ❌ | ❌ | ❌ | ❌ | ❌ |
---
## User Privileges
### Acquisition
| Privilege | Org Admin | L1/L2 | L3/L4 | Maintenance | Responder |
|-----------|:---------:|:-----:|:-----:|:-----------:|:---------:|
| View Acquisition Profile | ✅ | ✅ | ✅ | ❌ | ✅ |
| Create Acquisition Profile | ✅ | ✅ | ✅ | ❌ | ✅ |
| Update Acquisition Profile | ✅ | ✅ | ✅ | ❌ | ✅ |
| Delete Acquisition Profile | ✅ | ❌ | ✅ | ❌ | ✅ |
### Auditlog
| Privilege | Org Admin | L1/L2 | L3/L4 | Maintenance | Responder |
|-----------|:---------:|:-----:|:-----:|:-----------:|:---------:|
| View Auditlog | ✅ | ❌ | ❌ | ❌ | ❌ |
### Auto Asset Tags
| Privilege | Org Admin | L1/L2 | L3/L4 | Maintenance | Responder |
|-----------|:---------:|:-----:|:-----:|:-----------:|:---------:|
| Create Auto Asset Tag | ✅ | ❌ | ❌ | ❌ | ✅ |
| Update Auto Asset Tag | ✅ | ❌ | ❌ | ❌ | ✅ |
| View Auto Asset Tag | ✅ | ❌ | ❌ | ❌ | ✅ |
| Delete Auto Asset Tag | ✅ | ❌ | ❌ | ❌ | ✅ |
| Assign Auto Asset Tagging Task | ✅ | ❌ | ❌ | ❌ | ✅ |
### Automation Hub
| Privilege | Org Admin | L1/L2 | L3/L4 | Maintenance | Responder |
|-----------|:---------:|:-----:|:-----:|:-----------:|:---------:|
| View Automation Hub | ✅ | ✅ | ✅ | ❌ | ✅ |
| Manage Automation Hub | ✅ | ❌ | ✅ | ❌ | ✅ |
### Case
| Privilege | Org Admin | L1/L2 | L3/L4 | Maintenance | Responder |
|-----------|:---------:|:-----:|:-----:|:-----------:|:---------:|
| View Case | ✅ | ✅ | ✅ | ❌ | ✅ |
| Create Case | ✅ | ✅ | ✅ | ❌ | ✅ |
| Manage Case | ✅ | ✅ | ✅ | ❌ | ✅ |
| Update Case Status | ✅ | ✅ | ✅ | ❌ | ❌ |
| Change Owner Case | ✅ | ✅ | ✅ | ❌ | ✅ |
### Cloud Acquisition Profile
| Privilege | Org Admin | L1/L2 | L3/L4 | Maintenance | Responder |
|-----------|:---------:|:-----:|:-----:|:-----------:|:---------:|
| View Cloud Acquisition Profile | ❌ | ❌ | ❌ | ❌ | ❌ |
| Create Cloud Acquisition Profile | ❌ | ❌ | ❌ | ❌ | ❌ |
| Update Cloud Acquisition Profile | ❌ | ❌ | ❌ | ❌ | ❌ |
| Delete Cloud Acquisition Profile | ❌ | ❌ | ❌ | ❌ | ❌ |
### Cloud Asset Account
| Privilege | Org Admin | L1/L2 | L3/L4 | Maintenance | Responder |
|-----------|:---------:|:-----:|:-----:|:-----------:|:---------:|
| View Cloud Asset Account | ❌ | ❌ | ❌ | ❌ | ❌ |
| Create Cloud Asset Account | ❌ | ❌ | ❌ | ❌ | ❌ |
| Delete Cloud Asset Account | ❌ | ❌ | ❌ | ❌ | ❌ |
| Sync Cloud Asset Account | ❌ | ❌ | ❌ | ❌ | ❌ |
### Cloud Forensics
| Privilege | Org Admin | L1/L2 | L3/L4 | Maintenance | Responder |
|-----------|:---------:|:-----:|:-----:|:-----------:|:---------:|
| Manage Cloud Account | ✅ | ❌ | ❌ | ❌ | ✅ |
| Deploy Responder to Cloud | ✅ | ❌ | ❌ | ❌ | ✅ |
### Asset
| Privilege | Org Admin | L1/L2 | L3/L4 | Maintenance | Responder |
|-----------|:---------:|:-----:|:-----:|:-----------:|:---------:|
| Create Asset | ✅ | ❌ | ✅ | ❌ | ✅ |
| Edit Asset Label | ✅ | ❌ | ❌ | ❌ | ✅ |
| Delete Asset | ✅ | ❌ | ❌ | ✅ | ✅ |
| View Asset | ✅ | ✅ | ✅ | ✅ | ✅ |
| Sync LDAP | ✅ | ❌ | ❌ | ✅ | ✅ |
| Download Asset Logs | ✅ | ❌ | ❌ | ✅ | ✅ |
| Import Off-Network Asset | ✅ | ❌ | ✅ | ❌ | ✅ |
| Import PPC to Existing Asset | ✅ | ❌ | ✅ | ❌ | ✅ |
| Update Asset Connection Route | ✅ | ❌ | ✅ | ✅ | ✅ |
| Update Asset Maintenance Mode | ❌ | ❌ | ❌ | ❌ | ❌ |
### Asset Tag
| Privilege | Org Admin | L1/L2 | L3/L4 | Maintenance | Responder |
|-----------|:---------:|:-----:|:-----:|:-----------:|:---------:|
| Create Asset Tag | ✅ | ✅ | ✅ | ✅ | ✅ |
| Update Asset Tags | ✅ | ❌ | ❌ | ✅ | ✅ |
| Delete Asset Tag | ✅ | ❌ | ❌ | ✅ | ✅ |
| Delete All Asset Tags | ✅ | ❌ | ❌ | ✅ | ✅ |
| Remove Tags from Asset | ✅ | ❌ | ❌ | ✅ | ✅ |
| Add Tags to Assets | ✅ | ✅ | ✅ | ✅ | ✅ |
### Event Subscriptions
| Privilege | Org Admin | L1/L2 | L3/L4 | Maintenance | Responder |
|-----------|:---------:|:-----:|:-----:|:-----------:|:---------:|
| Create Event Subscriptions | ✅ | ❌ | ❌ | ❌ | ✅ |
| Update Event Subscriptions | ✅ | ❌ | ❌ | ❌ | ✅ |
| View Event Subscriptions | ✅ | ❌ | ❌ | ❌ | ✅ |
| Delete Event Subscriptions | ✅ | ❌ | ❌ | ❌ | ✅ |
### Evidence
| Privilege | Org Admin | L1/L2 | L3/L4 | Maintenance | Responder |
|-----------|:---------:|:-----:|:-----:|:-----------:|:---------:|
| View Evidence Repository | ✅ | ✅ | ✅ | ✅ | ✅ |
| Create Evidence Repository | ✅ | ❌ | ❌ | ✅ | ✅ |
| Update Evidence Repository | ✅ | ❌ | ❌ | ✅ | ✅ |
| Delete Evidence Repository | ✅ | ❌ | ❌ | ✅ | ✅ |
| View Case Report | ✅ | ✅ | ✅ | ❌ | ✅ |
### Full Text Search Profile
| Privilege | Org Admin | L1/L2 | L3/L4 | Maintenance | Responder |
|-----------|:---------:|:-----:|:-----:|:-----------:|:---------:|
| View Full Text Search Profile | ✅ | ✅ | ✅ | ❌ | ✅ |
| Create Full Text Search Profile | ✅ | ✅ | ✅ | ❌ | ✅ |
| Update Full Text Search Profile | ✅ | ✅ | ✅ | ❌ | ✅ |
| Delete Full Text Search Profile | ✅ | ❌ | ✅ | ❌ | ✅ |
### Disk Image Acquisition Profile
| Privilege | Org Admin | L1/L2 | L3/L4 | Maintenance | Responder |
|-----------|:---------:|:-----:|:-----:|:-----------:|:---------:|
| View Disk Image Acquisition Profile | ❌ | ❌ | ❌ | ❌ | ❌ |
| Create Disk Image Acquisition Profile | ❌ | ❌ | ❌ | ❌ | ❌ |
| Update Disk Image Acquisition Profile | ❌ | ❌ | ❌ | ❌ | ❌ |
| Delete Disk Image Acquisition Profile | ❌ | ❌ | ❌ | ❌ | ❌ |
### interACT Library
| Privilege | Org Admin | L1/L2 | L3/L4 | Maintenance | Responder |
|-----------|:---------:|:-----:|:-----:|:-----------:|:---------:|
| View interACT Library | ✅ | ✅ | ✅ | ❌ | ✅ |
| Modify interACT Library | ✅ | ❌ | ✅ | ❌ | ✅ |
### interACT Shell
| Privilege | Org Admin | L1/L2 | L3/L4 | Maintenance | Responder |
|-----------|:---------:|:-----:|:-----:|:-----------:|:---------:|
| Enumerate | ✅ | ✅ | ✅ | ❌ | ✅ |
| Read Content | ✅ | ❌ | ✅ | ❌ | ✅ |
| Write and Execute | ✅ | ❌ | ✅ | ❌ | ✅ |
### Notification
| Privilege | Org Admin | L1/L2 | L3/L4 | Maintenance | Responder |
|-----------|:---------:|:-----:|:-----:|:-----------:|:---------:|
| View Notification | ✅ | ✅ | ✅ | ✅ | ✅ |
| Delete All Notifications | ✅ | ❌ | ❌ | ✅ | ✅ |
| Mark All as Read Notification | ✅ | ✅ | ✅ | ✅ | ✅ |
### Organizations
| Privilege | Org Admin | L1/L2 | L3/L4 | Maintenance | Responder |
|-----------|:---------:|:-----:|:-----:|:-----------:|:---------:|
| View Organization | ✅ | ❌ | ❌ | ❌ | ❌ |
| Update Organization | ✅ | ❌ | ❌ | ❌ | ❌ |
### Organizations Deployment Token
| Privilege | Org Admin | L1/L2 | L3/L4 | Maintenance | Responder |
|-----------|:---------:|:-----:|:-----:|:-----------:|:---------:|
| Update Deployment Token | ✅ | ❌ | ❌ | ❌ | ❌ |
### Policy
| Privilege | Org Admin | L1/L2 | L3/L4 | Maintenance | Responder |
|-----------|:---------:|:-----:|:-----:|:-----------:|:---------:|
| View Policy | ✅ | ✅ | ✅ | ✅ | ✅ |
| Create Policy | ✅ | ❌ | ❌ | ✅ | ✅ |
| Update Policy | ✅ | ❌ | ❌ | ✅ | ✅ |
| Delete Policy | ✅ | ❌ | ❌ | ✅ | ✅ |
| Override Policy | ✅ | ❌ | ✅ | ✅ | ✅ |
### Relay Server
| Privilege | Org Admin | L1/L2 | L3/L4 | Maintenance | Responder |
|-----------|:---------:|:-----:|:-----:|:-----------:|:---------:|
| Manage Relay Server | ✅ | ❌ | ❌ | ❌ | ✅ |
### Task
| Privilege | Org Admin | L1/L2 | L3/L4 | Maintenance | Responder |
|-----------|:---------:|:-----:|:-----:|:-----------:|:---------:|
| View Task | ✅ | ✅ | ✅ | ✅ | ✅ |
| Delete Task | ✅ | ✅ | ✅ | ❌ | ✅ |
| Cancel Task | ✅ | ✅ | ✅ | ❌ | ✅ |
| Update Task | ✅ | ❌ | ❌ | ❌ | ✅ |
| Schedule Task | ✅ | ❌ | ✅ | ❌ | ✅ |
| Update Scheduled Task | ✅ | ❌ | ✅ | ❌ | ✅ |
### Task Assign
| Privilege | Org Admin | L1/L2 | L3/L4 | Maintenance | Responder |
|-----------|:---------:|:-----:|:-----:|:-----------:|:---------:|
| Assign Hunt/Triage Task | ✅ | ✅ | ✅ | ❌ | ✅ |
| Assign Acquire Evidence Task | ✅ | ✅ | ✅ | ❌ | ✅ |
| Assign Full Text Search Task | ✅ | ❌ | ❌ | ❌ | ❌ |
| Assign Disk Image Acquisition Task | ❌ | ❌ | ❌ | ❌ | ❌ |
| Assign Reboot Task | ✅ | ❌ | ✅ | ✅ | ❌ |
| Assign Shutdown Task | ✅ | ❌ | ❌ | ✅ | ❌ |
| Assign Log Retrieval Task | ✅ | ❌ | ❌ | ✅ | ✅ |
| Assign Version Update Task | ✅ | ❌ | ✅ | ✅ | ✅ |
| Assign Isolation Task | ✅ | ❌ | ✅ | ✅ | ✅ |
### Task Assignment
| Privilege | Org Admin | L1/L2 | L3/L4 | Maintenance | Responder |
|-----------|:---------:|:-----:|:-----:|:-----------:|:---------:|
| Delete Task Assignment | ✅ | ✅ | ✅ | ✅ | ✅ |
| Cancel Task Assignment | ✅ | ✅ | ✅ | ✅ | ✅ |
### Hunt/Triage
| Privilege | Org Admin | L1/L2 | L3/L4 | Maintenance | Responder |
|-----------|:---------:|:-----:|:-----:|:-----------:|:---------:|
| View Hunt/Triage | ✅ | ✅ | ✅ | ❌ | ✅ |
| Create Hunt/Triage | ✅ | ✅ | ✅ | ❌ | ✅ |
| Update Hunt/Triage | ✅ | ✅ | ✅ | ❌ | ✅ |
| Delete Hunt/Triage | ✅ | ✅ | ✅ | ❌ | ✅ |
### User
| Privilege | Org Admin | L1/L2 | L3/L4 | Maintenance | Responder |
|-----------|:---------:|:-----:|:-----:|:-----------:|:---------:|
| View User | ✅ | ✅ | ✅ | ❌ | ✅ |
| Create User | ✅ | ❌ | ❌ | ❌ | ❌ |
| Delete User | ✅ | ❌ | ❌ | ❌ | ❌ |
| Update User | ✅ | ❌ | ❌ | ❌ | ❌ |
### User Role
| Privilege | Org Admin | L1/L2 | L3/L4 | Maintenance | Responder |
|-----------|:---------:|:-----:|:-----:|:-----------:|:---------:|
| View Role | ✅ | ❌ | ❌ | ❌ | ❌ |
### Two Factor Authentication (2FA)
| Privilege | Org Admin | L1/L2 | L3/L4 | Maintenance | Responder |
|-----------|:---------:|:-----:|:-----:|:-----------:|:---------:|
| Update 2FA Settings | ✅ | ❌ | ❌ | ❌ | ❌ |
### Webhook
| Privilege | Org Admin | L1/L2 | L3/L4 | Maintenance | Responder |
|-----------|:---------:|:-----:|:-----:|:-----------:|:---------:|
| View Webhook | ✅ | ❌ | ❌ | ❌ | ✅ |
| Create Webhook | ✅ | ❌ | ❌ | ❌ | ✅ |
| Update Webhook | ✅ | ❌ | ❌ | ❌ | ✅ |
| Delete Webhook | ✅ | ❌ | ❌ | ❌ | ✅ |
---
# Backup
> Source: https://kb.binalyze.ai/air/settings/console-settings/backup.html
## **AIR > Settings > Backup**:
The **AIR Backup** feature allows users to back up system data securely and flexibly through the **UI** or **Command Line Interface (CLI)**. Backups can be stored locally, on **SFTP**, or in **Amazon S3**, and encrypted using **AES256** with a password.
Backups can be performed **immediately** or scheduled at intervals of **every 4 hours, daily, weekly, or monthly**. Users can set the number of backups to retain and the scheduled start time. CLI backup options are available, with detailed instructions in the **Knowledge Base**.
## **AIR > Settings > Backup History**:
This page displays the Backup History available to the AIR console.
## AIR Backup File Naming Convention
AIR backup files use a structured naming format that embeds timestamp and version information directly into the `.abf` filename. This makes it easy to identify when a backup was created and which internal backup schema and AIR console version were used.
### Example Filename
```
~25-11-17_6-6-0-026_v4_AIRv5.5.1.abf
```
### Filename Components
**Date Component:** `25-11-17`
* **25** = Year (2025)
* **11** = Month
* **17** = Day
**Time Component:** `6-6-0-026`
Represents the exact creation time of the backup:
* **6** = Hour
* **6** = Minute
* **0** = Second
* **026** = Millisecond
**Backup File Format Version:** `v4`
Indicates the internal backup schema/version used by AIR. This ensures compatibility between console versions and the expected backup structure.
**AIR Console Version:** `AIRv5.5.1`
Shows which AIR version generated the backup.
**File Extension:** `.abf`
AIR Backup File.
### Summary
`~25-11-17_6-6-0-026_v4_AIRv5.5.1.abf` means the backup was created on **17 November 2025** at **06:06:00.026**, using the **v4 backup format**, from an **AIR 5.5.1** console.
---
# Investigation Hub Disk Usage
> Source: https://kb.binalyze.ai/air/settings/console-settings/investigation-hub-disk-usage.html
This feature empowers users to manage **Investigation Hub data storage** effectively and is fully explained here: [Investigation Hub – Data Usage Statistics Dashboard](../../features/investigation-hub/investigation-hub-data-usage-statistics-dashboard).
---
# Danger Zone
> Source: https://kb.binalyze.ai/air/settings/console-settings/danger-zone.html
### Killswitch: Cancel All Running Tasks
The **Killswitch** is a powerful administrative control available under **Settings > Danger Zone** in the AIR Console. It allows Global Admins to immediately cancel _all currently running cancellable tasks_ across the entire platform, without needing to select individual assets or tasks.
#### Safety Confirmation
To safeguard against accidental activation, a case-sensitive confirmation is required. You must, before the operation can proceed. Type the exact phrase:_`Cancel All Tasks`_
> **Note:** This action cannot be reversed.
>
> Only tasks that are in a cancellable state will be affected.
Use this feature carefully, particularly during large-scale investigations or scheduled operations.
---
# Organization Settings
> Source: https://kb.binalyze.ai/air/settings/organization-settings.html
### Organizational Controls
Organization Settings: Access via the top bar
From the top bar, the drop-down allows the user to select:
* **Organization Settings**
* **Switch Organizations**
* **Add new Organizations**
:::note
Each responder is associated with a single Organization, ensuring integrity and clarity in investigations.
:::
### Organization Overview
Organization Settings: Overview
When viewing an Organization, you’ll see key details like:
* **Name**, **ID**, **Owner**
* **Created At** timestamp
* **Asset count**, and case stats (Open, Closed, Archived)
### Configuration Tabs
Each Organization has four main configuration areas:
#### 1. **Deployment**
* Displays the Organization’s **deployment token**
* Includes a **Shareable Deployment Page** for fast responder distribution
* The link can be regenerated or disabled from this view
#### 2. **Relay Server**
* Manage Relay Servers used to support off-network response
* Includes search and "New Relay" functions
#### 3. **User Settings**
* View and manage users, roles, and groups
* Use the **Assign Users** button to add new team members
#### 4. **Contact**
* Optional form fields for storing the Organization’s contact name, title, and phone number
### Use Cases
Organizations help:
* MSSPs manage multiple customers
* Enterprises segment data by business unit, region, or compliance zone
* Security teams isolate cloud, on-prem, and off-network assets
### Access & Policy Enforcement
* Policies can be global or overridden at the Organization level
* Shareable deployment links and responder access are organization-scoped
* User roles support granular privileges
### Summary
Organization Settings are central to structuring your AIR environment securely and efficiently. They govern deployment, user access, case management, and responder scope, all from a single, intuitive interface.
---
# Account Settings
> Source: https://kb.binalyze.ai/air/settings/account-settings.html
The **Account Settings** section in AIR allows users to manage personal preferences and session details. This section is accessible via the **user icon** located in the **top-right corner** of the AIR interface toolbar.
#### What You Can Do in Account Settings
* **View Account Details**: Includes your registered name, surname, email address, and username.
* **Change Password**: Locally authenticated users can update their password directly from here.
* **Sign Out**: Securely log out of your AIR session.
* **Customize Theme Preferences**: Switch between Light and Dark Mode or set the UI to follow system time-based settings.
#### Dark Mode
The AIR interface supports a **Dark Mode** UI theme, providing a modern, eye-friendly visual style that is ideal for use in low-light conditions or during extended periods of use. This feature:
* Enhances usability and reduces eye strain.
* Can be toggled manually between **Light** and **Dark** modes.
* Includes an **Auto** mode that adapts the UI based on your machine's **time zone** and **daylight saving hours**, ensuring a seamless experience.
Dark Mode aligns with current UI standards and user expectations, supporting a comfortable and productive working environment.
#### **User Profile Photos**
Users can upload their own profile images. These will be displayed across the AIR console UI in user-facing areas, such as the user menu, case history, and activity logs. Supported for both regular and SSO-authenticated users, although not synced from the identity provider.
---
# Submitting Feedback
> Source: https://kb.binalyze.ai/air/settings/submitting-feedback.html
AIR includes a built-in feedback mechanism that allows analysts to share insights, report issues, and ask questions directly from within the Console. All submissions are sent securely to the internal support channel for review.
## Accessing the Feedback Form
The Feedback button is accessible from within the AIR Console. Look for the **Feedback** icon, which is typically located in the bottom-right corner of the interface.
Submitting Feedback: Accessing the Feedback button from the Console
:::note
The Feedback button may appear in different locations depending on your Console version, but the icon and functionality remain the same.
:::
## Feedback Types
When submitting feedback, select the type that best describes your submission:
| Type | Use When |
|------|----------|
| **Feedback** | You have suggestions, ideas, or general comments about AIR |
| **Bug Report** | You've encountered an issue or unexpected behavior |
| **Question** | You need clarification or have a query about functionality |
## Submitting Your Feedback
Click the Feedback button to open the submission form:
Submitting Feedback: The Feedback submission form
Complete the form with the following information:
1. **Feedback Type** - Select Feedback, Bug Report, or Question
2. **Contact Email** - Automatically populated with your logged-in user's email address; can be edited if needed
3. **Description** - Provide a detailed description of your feedback, issue, or question
## Attaching Additional Information
To help the support team understand and address your submission more effectively, you can include:
* **Application Logs** - Check the "Attach application logs" option to automatically include diagnostic information
* **Screenshots** - Click "Take Screenshot" to capture the current screen, or drag and drop existing image files
* **Files** - Drag and drop or browse to attach any relevant files
## Submission Limits
Each user may submit feedback up to **five times per day**. This helps ensure all submissions receive appropriate attention from the support team.
## What Happens Next
Once submitted, your feedback is securely transmitted to the AIR support channel where it will be reviewed by the team. For bug reports and questions, you may be contacted at your provided email address for follow-up information or resolution updates.
---
# Updating
> Source: https://kb.binalyze.ai/air/updating/index.html
AIR provides update controls that let you manage when and how your console is upgraded. Use the topics in this section to configure update behavior for your environment.
---
# Console Updating - SaaS
> Source: https://kb.binalyze.ai/air/updating/console-updating-saas.html
AIR provides a controlled and predictable update process for SaaS tenants by using **maintenance windows**. These windows allow you to define exactly when updates may occur, helping you align upgrades with organisational change-control processes and minimise operational impact.
All update settings are available from:
**Settings → Update**
Console Updating SaaS: The UI for SaaS maintenance
## Update Methods
### Auto Update (Recurring Maintenance Window)
**Auto Update** allows AIR to automatically install new versions during a recurring update window that you configure.
When Auto Update is enabled, you can define:
**Time Window**
Select a 30-minute update window (e.g., **02:00–02:30** or **14:00–14:30** (Europe/Istanbul – UTC +03:00)).
Updates will only run within this defined window.
**Days of the Week**
Choose one or more days on which updates are permitted (e.g., Monday–Friday, Saturday only, or Wednesday).
At least one day must be selected.
**How it works:**
When a new version becomes available, AIR identifies the next selected day and applies the update during the time window you have configured.
### One-time Scheduled Update
Use a **One-time Scheduled Update** when you want to apply the next update at a specific upcoming window outside your normal recurring schedule.
* When selected, AIR displays the next available maintenance windows.
* Choose your preferred window and save the configuration.
* The system will update once during that window and then revert to your existing Auto Update settings.
**This option is ideal for:**
* Alignment with a formal change-control event
* Situations where you want to temporarily override your regular update pattern
* Urgent updates that cannot wait for the next recurring window
### Disabling Automatic Updates
If you wish to temporarily halt updates:
* Set **Auto Update** to **off**
* Ensure **One-time Scheduled Update** is not selected
Your tenant will not update until a new maintenance window is configured.
:::note
**Note:** Critical or mandatory updates may still be applied to ensure security, stability, or compliance.
:::
## Update Status Information
The **Update Settings** page displays your current version, for example:
```
Your system is up-to-date – v5.7.0.xxxxx
```
If an update has been scheduled, the page will show:
* The update version
* The scheduled maintenance window
* Any relevant notifications
:::caution
Automatic Backup Before SaaS Updates
AIR automatically creates a backup before every SaaS console update.
If the update fails, the system can roll back to the previous working state.
No manual backup action is required.
:::
## Summary
AIR's SaaS update management offers:
* **Controlled and predictable updates**
* **Recurring and one-time maintenance window options**
* **Full alignment with change-control practices**
* **Built-in automatic backups for safety**
These controls ensure uninterrupted operation while keeping your environment consistently up-to-date.
---
# Features
> Source: https://kb.binalyze.ai/air/features/index.html
[Acquisition](acquisition/)
[Auto Tagging & Tags](auto-tagging-and-tags/)
[Hunt/Triage](triage/)
[interACT](interact/)
[Compare](compare)
[Timeline](timeline)
[API](api/)
[DRONE](drone/)
[Investigation Hub](investigation-hub/)
[Repository Explorer](repository-explorer)
[Evidence Repositories](evidence-repositories/)
[File Explorer](file-explorer/)
[Tornado (Preview Version)](tornado-preview-version/)
[Asset Isolation](asset-isolation)
[Policies](policies)
[Off-Network Responder](off-network-endpoint/)
[Responder Proxy Support](responder-proxy-support)
[Proxy Configuration on the Console](proxy-configuration-on-the-console)
[Console Audit Logs](console-audit-logs)
---
# API
> Source: https://kb.binalyze.ai/air/features/api/index.html
The AIR API facilitates seamless communication with the AIR console, enabling users to collect information or execute tasks with precision and efficiency.
We provide sample requests in various programming languages, including Go, Python, and Java, as well as sample cURL requests to equip users with comprehensive integration resources. These samples serve as practical guides, showcasing the seamless implementation of our API functionalities across different development environments.
To access detailed documentation and unlock the full potential of our API, we invite developers to explore our comprehensive resource at [docs.binalyze.com](https://docs.binalyze.com/). Here, you can find in-depth explanations, tutorials, and reference materials that guide you through the integration process seamlessly.
Our API documentation, which includes detailed endpoint descriptions, authentication guidelines, and practical code examples, offers invaluable insights for developers at every stage. Leverage the power of our API at [docs.binalyze.com](https://docs.binalyze.com/) to empower your development journey and unlock new possibilities.
## Enhanced API Token Management with Role-Based Access Control
API Token Management supports role-based access control (RBAC), which enhances security and flexibility while reducing the need for excessive permissions.
* **Global Admins can only** create and modify API tokens.
* **Granular Permissions:** Tokens inherit only the privileges of their assigned role (e.g., read-only or custom roles), preventing over-permissioning.
* **Post-Creation Role Updates:** Token permissions can be modified after creation, allowing for dynamic access control.
* **Governance & Security:**
* The role assigned to a token and its creator cannot be deleted unless the token is reassigned or removed.
* This enhances audibility and compliance with the principle of least privilege.
API token management in AIR has role-based limitations, allowing API usage to be tailored according to the selected role. This capability refines automation workflows and strengthens access control policies.
## New API Endpoints
We regularly add new API endpoints to improve capabilities for organizations integrating AIR into their workflows. Below is an example of a recently added endpoint. For complete and up-to-date API documentation, always refer to [docs.binalyze.com](https://docs.binalyze.com/).
### Application Information API
This endpoint provides authenticated access to core version and configuration information about your AIR deployment.
**Returns:**
- Console version
- Responder version
- Active feature flags across the tenant
**Use Cases:**
- **Integration Partners:** Verify feature availability before initiating evidence collection or response workflows
- **Support Automation:** Validate configuration and monitor platform health
- **Compatibility Checks:** Ensure orchestration systems are working with supported AIR versions
:::note
For detailed endpoint specifications, authentication requirements, and code examples, visit [docs.binalyze.com](https://docs.binalyze.com/).
:::
---
# API is likely to be more effective than Webhooks
> Source: https://kb.binalyze.ai/air/features/api/api-is-likely-to-be-more-effective-than-webhooks.html
#### **Why Using the API in AIR is Likely to be More Effective**
APIs and webhooks both serve as methods for integrating systems and enabling communication between applications, but they are suited for different use cases. In many scenarios, using APIs is recommended over webhooks due to the control, flexibility, and broader operational capabilities they offer.
#### API Offers Broader Capabilities Beyond Acquisitions
With webhooks in AIR, you can only trigger acquisitions. However, APIs allow you to access and perform far more operations, making them the preferred method for extensive system interactions and automation.
#### 1. **Control Over Data Requests**
* **API (Application Programming Interface):** APIs enable clients to request data from the server as needed actively. This provides greater control over when and how data is retrieved. If your application requires data on demand or in real-time (e.g., when a user requests information), APIs are more suitable, as they enable the retrieval of data as needed.
* **Webhook:** Webhooks rely on the server to push data to the client based on predefined events. The client passively waits for updates, which may result in missed data if the client is not ready or the webhook fails.
#### 2. **Error Handling & Retry Mechanisms**
* **API:** APIs are generally more reliable because they operate within a request-response cycle. If a request fails, the client can handle errors, retry the request, or log the issue. This gives greater control over failure management.
* **Webhook:** Webhooks can be unreliable in environments with unstable real-time connectivity. If a webhook fails (e.g., the client is offline or the endpoint is inaccessible), it relies on the server’s retry mechanisms, which may not always be reliable.
#### 3. **Security & Authentication**
* **API:** APIs typically have strong security measures, such as API keys or OAuth for authentication. They enable fine-grained access control, allowing for the definition of specific scopes and permissions.
* **Webhook:** Webhooks can also be secured, but they often provide less granular control over who can receive the data. Webhooks rely on callbacks, making them more vulnerable to attacks such as man-in-the-middle or endpoint spoofing.
#### 4. **Customizability & Flexibility**
* **APIs offer more flexibility, allowing clients** to request exactly the data they need. Clients can filter, sort, or customize responses according to their specific requirements. This level of optimization is key to efficient data handling.
* **Webhooks** push predefined data with limited flexibility. If only part of the data is required, webhooks may send unnecessary information, resulting in inefficiencies.
#### 5. **Scalability & Polling**
* **While APIs can lead to over-polling, modern APIs include optimizations such as caching or using long-polling methods (like GraphQL) to retrieve only the** necessary data. This makes APIs scalable for large applications.
* **Webhooks** eliminate polling by pushing real-time updates. However, frequent triggers across many users can become resource-intensive and difficult to manage.
#### 6. **Real-time Needs**
* **Webhooks** are ideal for real-time updates when the client doesn’t want to poll the server frequently. They work well in event-driven systems that require instant notifications, such as payment alerts or status updates.
* **API:** For use cases where real-time updates are not critical, or when the client needs precise control over when to retrieve data, APIs offer a better solution. For instance, querying data based on user actions or scheduling retrievals at specific intervals.
#### Summary: When APIs are Recommended
* **On-Demand Requests:** APIs are better when the client needs to control when and how often data is requested.
* **Error Handling:** APIs offer more effective mechanisms for managing errors, thereby ensuring reliable data integration.
* **Security:** APIs typically offer more robust and customizable security features.
* **Custom Data Needs:** APIs give more flexibility for retrieving specific or customized data.
* **Scalability:** APIs can be more efficient for large-scale systems that require avoiding constant event-triggered updates.
#### When Webhooks are Preferred
* **Real-Time Notifications:** Webhooks are well-suited for event-driven systems that require immediate updates, making polling an inefficient approach.
* **Low-Frequency, Event-Driven Integrations:** For infrequent events, webhooks minimize unnecessary API calls.
#### Best of Both Worlds: Combining APIs and Webhooks
In many cases, combining both webhooks and APIs provides the best solution. Webhooks can handle real-time notifications, while APIs can be used to fetch additional data or control access when necessary.
In AIR, for instance, while webhooks enable you to perform acquisitions, APIs allow for a wider range of operations, making them more versatile for comprehensive incident response and investigation workflows.
---
# Breaking Change: Assertions Field Required for Asset Filter-Based API Endpoints
> Source: https://kb.binalyze.ai/air/features/api/assertions-field-required-for-filter-based-api-endpoints.html
This article describes a breaking API behavior change for asset filter-based bulk operations.
## What changed
For API endpoints that execute actions by asset filter, the `assertions` object is now required in the request body.
Previously, this field could be omitted.
You must include:
{
  "assertions": {
    "failIfNumberOfAssetsGreaterThan": NUMBER
  }
}
## Why this change was introduced
This safety control reduces the risk of unintended bulk operations caused by broad or incorrect filters.
When `failIfNumberOfAssetsGreaterThan` is set, the request fails instead of executing if the filter matches more assets than expected.
This helps prevent accidental high-impact actions across large asset sets.
## Affected asset filter API endpoints
The following API endpoints include `assertions` and should be treated as requiring this field:
| Endpoint | Docs |
| -------------------------------------------- | ---------------------------------------------------------------------------------------------------------------------------- |
| `/api/public/acquisitions/acquire` | Open |
| `/api/public/acquisitions/acquire/image` | Open |
| `/api/public/triages/triage` | Open |
| `/api/public/full-text-search-tasks` | Open |
| `/api/public/auto-asset-tag/start-tagging` | Open |
| `/api/public/baseline/acquire` | Open |
| `/api/public/assets/tasks/reboot` | Open |
| `/api/public/assets/tasks/shutdown` | Open |
| `/api/public/assets/tasks/isolation` | Open |
| `/api/public/assets/tasks/retrieve-logs` | Open |
| `/api/public/assets/tasks/version-update` | Open |
| `/api/public/assets/uninstall-without-purge` | Open |
| `/api/public/assets/purge-and-uninstall` | Open |
| `/api/public/assets/purge-without-uninstall` | Open |
## Request pattern example
The full request body varies by endpoint, but the assertions pattern is shared:
{
  "assertions": {
    "failIfNumberOfAssetsGreaterThan": NUMBER
  },
  "...": "other specific fields"
}
## Required action for API consumers
- Update all integrations that call the affected endpoints.
- Add `assertions.failIfNumberOfAssetsGreaterThan` to each request body.
- Set the threshold based on your operational safety limits.
- Validate behavior in a non-production environment before rollout.
:::note
For specific payload details and examples, refer to the official API documentation: [docs.binalyze.com](https://docs.binalyze.com/).
:::
---
# Asset Isolation
> Source: https://kb.binalyze.ai/air/features/asset-isolation.html
Asset Isolation enables you to completely isolate an asset from all network communication **except** its connection to the AIR Console. This allows your investigation to proceed with full AIR capabilities while preventing threat actors from accessing the asset or external parties from interfering with the investigation.
:::caution
**Key Point:** An isolated asset can only communicate with the AIR Console. All other network connections—inbound and outbound—are blocked.
:::
## Why Use Asset Isolation?
When you suspect an asset has been compromised, you face a dilemma:
- **Leave it connected** → Risk the threat actor maintaining access, exfiltrating data, or destroying evidence
- **Disconnect it completely** → Lose the ability to perform remote forensic collection
Asset Isolation solves this by **cutting off the threat actor while preserving your investigative access**. The asset remains fully manageable through AIR, enabling you to collect evidence, run queries, and interact with the system—all while the asset is protected from external interference.
## How It Works
When you isolate an asset:
1. **All existing network connections are terminated** — Any active connections to other systems are immediately dropped
2. **New network connections are blocked** — The asset cannot establish connections to any external system
3. **AIR Console communication is preserved** — The Responder maintains its connection to the Console
4. **Full AIR capabilities remain available** — Acquisition, Hunt/Triage, interACT, and Time-lining all continue to function
:::note
Isolation behavior on Linux and macOS aligns with expected cross-platform enforcement. Inbound and outbound filtering, immediate termination of active TCP sessions, and policy exception handling behave consistently across supported operating systems.
:::
### Technical Implementation
This feature uses a **Kernel Mode Driver** for performing the isolation. It operates independently of Windows Firewall, ensuring reliable isolation regardless of firewall configuration or state.
:::tip
**Persistence:** Asset Isolation survives reboots. If you restart an isolated asset from the AIR Console, it will remain isolated after the reboot until you explicitly un-isolate it from the Asset Details page.
:::
:::note
**Connection Reliability:** The Responder uses advanced connection verification routines—including DNS cache persistence, fallback DNS mechanisms, and extended retry durations—to ensure isolated assets maintain reliable Console connectivity even in complex network environments.
:::
## What Remains Available
During isolation, all AIR capabilities continue to function:
| Action | Status | Purpose |
|--------|--------|---------|
| **Acquisition** | ✅ Available | Collect forensic evidence |
| **Hunt/Triage** | ✅ Available | Search for indicators of compromise |
| **interACT** | ✅ Available | Live interaction with the asset |
| **Time-lining** | ✅ Available | Build activity timelines |
| **Scheduled Tasks** | ✅ Available | Automated task execution continues |
| **External Network Access** | ❌ Blocked | Threat actor access denied |
## Isolation Policy Controls
Isolation behavior can be further tuned in Policies:
- **Isolation IP/Port and Process Allow Lists** can be used for explicitly allowed communication during isolation.
- Exception handling is applied bidirectionally (inbound and outbound) for supported platforms.
- **DNS and DHCP behavior during isolation** can be configured in policy when your operational model requires these services to remain available.
## Use Cases
### Incident Response Containment
When you identify a potentially compromised asset, immediately isolate it to prevent:
- Threat actors from maintaining command and control access
- Data exfiltration to external servers
- Lateral movement to other assets on the network
- Remote destruction of evidence
### Active Investigation
Isolation allows you to investigate a live system without interference. The threat actor cannot detect your investigation activities or take countermeasures while the asset is isolated.
### Evidence Preservation
By isolating the asset, you ensure that evidence remains intact during collection. No external process can modify, encrypt, or delete files while you're acquiring them.
:::tip
**Best Practice:** When responding to a suspected compromise, isolate the asset first, then begin your forensic acquisition. This ensures you capture evidence in its current state without risk of tampering.
:::
## Isolating and Un-isolating Assets
### To Isolate an Asset
1. Navigate to the asset in the AIR Console
2. Open the **More Actions** menu
3. Select **Isolate Asset**
The asset will immediately be isolated from all network communication except the AIR Console.
### To Un-isolate an Asset
1. Navigate to the isolated asset's **Asset Details** page
2. Select **Un-isolate Asset**
Network connectivity will be restored and the asset can resume normal operations.
## Comparison with Maintenance Mode
Both features control asset behaviour, but serve different purposes:
| Feature | Asset Isolation | Maintenance Mode |
|---------|-----------------|------------------|
| **Primary Purpose** | Network containment | Prevent task creation |
| **Network Access** | ❌ Blocked (except Console) | ✅ Normal |
| **Task Creation** | ✅ Allowed | ❌ Blocked |
| **Acquisition** | ✅ Available | ❌ Blocked |
| **Hunt/Triage** | ✅ Available | ❌ Blocked |
| **interACT** | ✅ Available | ✅ Available |
:::note
**When to use which?**
- Use **Asset Isolation** when you need to contain a potentially compromised asset—cut off threat actor access while continuing your investigation
- Use **Maintenance Mode** when you need to prevent task creation for an asset during planned maintenance or diagnostics
:::
---
# Maintenance Mode
> Source: https://kb.binalyze.ai/air/features/maintenance-mode.html
Maintenance Mode prevents the AIR Console from generating or assigning tasks to an asset. When activated, the Console will not allow you to create tasks for that asset—this includes manual task creation, scheduled tasks, and bulk task assignments.
:::caution
**Key Point:** Maintenance Mode is a console-side control. The Responder continues to operate normally, but the Console blocks all task creation for the maintained asset.
:::
## How It Works
When you place an asset into Maintenance Mode:
1. **Task creation is blocked** — You cannot generate new tasks for the asset from the Console
2. **Scheduled tasks are skipped** — Any scheduled tasks that would target this asset will not execute
3. **Bulk tasks exclude the asset** — The asset is automatically excluded from bulk task operations
4. **In-progress tasks continue** — Tasks that were already executing when Maintenance Mode was activated will run to completion
### What Remains Available
To support essential diagnostic and investigative activities, the following actions are still permitted:
| Action | Status | Reason |
|--------|--------|--------|
| **interACT** | ✅ Available | Essential for live diagnostics |
| **Log Gathering** | ✅ Available | Required for troubleshooting |
| **New Task Creation** | ❌ Blocked | Primary function of Maintenance Mode |
| **Scheduled Tasks** | ❌ Blocked | Prevented by Console |
| **Bulk Tasks** | ❌ Blocked | Asset is excluded |
| **Automatic Responder Updates** | ⏸ Deferred | Resume when Maintenance Mode ends |
:::note
Automatic Responder updates are postponed rather than cancelled. While an asset is in Maintenance Mode, its **Version update** card shows **Waiting** with the maintenance reason, and the update starts once Maintenance Mode ends and the update window is open. You can still update the Responder immediately with **Update now**. See [Responder Update Status](../settings/console-settings/assets/responder-update-status).
:::
## Enabling Maintenance Mode
Maintenance Mode can be enabled from the **More Actions** menu on any asset.
Maintenance Mode: Enabling via the More Actions button
## Visibility and Status
When an asset is in Maintenance Mode, this status is clearly visible:
- **Asset Details Page**: The Maintenance Mode status is displayed in the asset information panel
- **Asset Filters**: Filter by Maintenance Mode status to identify maintained assets across large environments
Maintenance Mode: Status displayed on the Asset Info page
## Use Cases
### Planned Maintenance Windows
During system updates, patches, or configuration changes, activate Maintenance Mode to ensure no tasks—manual or automated—can be created for the asset until maintenance is complete.
### Diagnostic Sessions
When troubleshooting an asset, Maintenance Mode prevents accidental task execution while you investigate. interACT and log gathering remain available for diagnostics.
### Handling Cloned or Duplicated Assets
When working with cloned or duplicated asset instances, Maintenance Mode prevents conflicting task assignments. This helps analysts maintain chain-of-custody and ensures collected information remains contextually accurate.
:::tip
**Best Practice:** When working with cloned environments or forensic duplicates, place the original asset in Maintenance Mode to prevent task conflicts and preserve evidence integrity.
:::
## Comparison with Asset Isolation
Both features control asset behaviour, but serve different purposes:
| Feature | Maintenance Mode | Asset Isolation |
|---------|-----------------|-----------------|
| **Primary Purpose** | Prevent task creation | Network containment |
| **Network Access** | Normal | Terminated |
| **Task Creation** | ❌ Blocked | ✅ Allowed |
| **Scheduled Tasks** | ❌ Blocked | ✅ Execute normally |
| **interACT** | ✅ Available | ✅ Available |
| **Acquisition** | ❌ Blocked | ✅ Available |
| **Hunt/Triage** | ❌ Blocked | ✅ Available |
:::note
**When to use which?**
- Use **Maintenance Mode** when you need to prevent any task creation for an asset—keeping it operational but protected from Console-initiated actions
- Use **Asset Isolation** when you need to contain a potentially compromised asset on the network while continuing forensic collection
:::
---
# Acquisition
> Source: https://kb.binalyze.ai/air/features/acquisition/index.html
Data acquisition is the collection of forensically sound data from any computer system (disk, external storage, memory, etc.). This data generally varies based on the operating system installed on the computer or server. Acquired data often needs to be parsed, stored, and presented in a human-readable format for further analysis and investigation.
Data acquisition is the primary activity of most digital investigations. Before data acquisition, the investigators generally identify the data they’ll need. Since data or evidence is an essential element of any investigation, investigators tend to take as much as they can in the first instance to avoid, if possible, a second acquisition. Therefore, the power of the digital investigation and DFIR solution is often proportional to the acquisition capability and the features associated with it.
AIR provides easy-to-deploy and fast data acquisition capabilities with a wide range of operating systems supported for the collection of 600+ forensically sound data types. AIR provides remote data acquisition for on-premise, cloud, and off-network devices. Thus, investigators can remotely investigate multiple devices at speed and scale.
AIR supports a growing number of operating systems, including Windows, Linux, macOS, ChromeOS, ESXi, and IBM AIX.
The results of AIR's Acquisition and Hunt/Triage processes can be further analyzed using DRONE's automated Post Acquisition Analyzers. DRONE's findings, along with all collected artifacts, are then presented within the **Investigation Hub**.
_**The AIR responder needs to be deployed first to acquire data. All data acquisition is performed according to the Data Acquisition Profile created before the acquisition is started.**_
Data acquisition is classified into three categories: Evidence, Artifacts, and Network Capture. Additionally, investigators have the flexibility to create custom content profiles, allowing them to collect specific files or data from designated locations.
At Binalyze, we recognize the critical importance of maintaining a strong 'chain of custody' when it comes to the collection and handling of evidence. That's why we employ SHA-256 hashing in combination with RFC3161 digital timestamp certificates. This approach serves to safeguard data content and offers assurance regarding the precise timestamp of the content's creation, as well as a guarantee that it has remained unaltered.
**Read more** about RFC3161 and the secure way AIR maintains a strong chain of custody here: [**Protect Your Chain Of Custody With Content Hashing And Timestamping**](https://www.binalyze.com/blog/dfir-lab/protect-your-chain-of-custody-with-content-hashing-and-timestamping)
---
# Acquisition Profiles
> Source: https://kb.binalyze.ai/air/features/acquisition/acquisition-profiles.html
Acquisition profiles in AIR define the specific types of data to be collected during an acquisition task. AIR offers two types of acquisition profiles:
* **Device Acquisition Profiles**: Used to collect evidence and artifacts from Windows, Linux, macOS, and IBM AIX machines—either via an installed Responder on networked assets, or using a portable Responder executed from external media (such as a USB drive) for off-network collections.
* **Disk Image Acquisition Profiles**: Extend collection capabilities to disk images via the File Explorer, enabling investigators to extract evidence and artifacts from forensic images without requiring a live system.
Both profile types enable you to customize and streamline data collection to meet the unique requirements of your investigation. Saved within the AIR Libraries, acquisition profiles can be easily shared, reused, or edited for further refinement, ensuring efficiency and consistency across investigations.
### **Using Out-of-the-Box Acquisition Profiles**
Acquisition Profiles: Built-in Profiles
As shown above, AIR comes with several predefined acquisition profiles that you can use immediately, for example:
1. **Quick**: Designed for fast data acquisition with essential evidence types.
2. **Full**: Collects a comprehensive and rich set of data from the assets.
3. **Compromise Assessment**: Focuses on locations commonly abused by malicious actors, defined by the Binalyze threat hunting team.
These out-of-the-box profiles are ideal for common scenarios and provide an ideal quick start for your investigations.
### **Creating your own Acquisition Profiles**
To create your own custom acquisition profile, follow these steps:
### (1) Navigate to Acquisition Profiles
* Go to the "Libraries > Acquisition Profiles" section from the main dashboard.
### (2) Create a New Profile
* Click on the "+ New Profile" Action Button.
* Provide your new profile with a name that will help you identify its purpose later.
### (3) Select the Operating System(s) for your new profile
* Windows
* Linux
* macOS
* IBM AIX
* Or a cross-platform eDiscovery collection
Acquisition Profiles: Supported platforms and eDiscovery option
## (4) Select Evidence Types
* AIR supports the most comprehensive, and ever-growing number of evidence types for collection and presentation in the Investigation Hub. To build your profile, choose the data you want to collect from the extensive options grouped under the following eight tabs:
* **System**
* System artifacts (e.g., registry, jump lists, UAL, Cron Jobs)
* **Memory**
* Memory files (e.g., RAM image, Page File, Memory Map)
* **Network**
* Network artifacts (e.g., IP Tables, TCP Tables, DNS Servers)
* **Event Log Records**
* AIR allows users to collect and present event logs or define specific channels for log collection. [Learn more about Windows Event Records](supported-evidence/windows-collections-detail/event-log-evt-records/windows-event-records-and-how-they-are-handled)
* **Disk & File System**
* Collect disk & file System items (e.g., $mft, $Boot File, Mounts, fseventsd)
* **Applications**
* Data for specific applications (e.g., browsers, AV logs, RDM tools, Microsoft application data)
* **Custom Content Profiles**
* Select bespoke file locations for collection.
* **osquery**
* Use bespoke osquery commands to collect live system artifacts, including processes, network activity, and configuration files.
:::tip
#### Custom Content Profile Path Tips
* You can omit the drive letter — start from the folder name (e.g., `Program Files\Common Files`).
* Use `**` for recursive matching:
* `C:\Users\**\*.txt` collects all `.txt` files under that path.
* `**\malware.exe` (or `**/malware.exe` on Unix) finds all `malware.exe` files system-wide.
* Windows paths can use `/` or `\` — both are supported.
:::
* **Network Capture**
Network Flow captures TCP/UDP connections and stores them as a CSV.
PCAP will capture IP packets and save them as a PCAP file.
The duration of the Network Capture is determined by the user.
* **osquery**
* Use your own bespoke osquery commands to collect live system artifacts, including processes, network activity, and configuration files.
Acquisition Profiles: Choose items for collection from the 8 tabbed groupings
:::tip
#### View in Knowledge Base
* Note that in the screenshot above, you can click the Info button at the end of each item in the collection list to open the Knowledge Base for a detailed explanation of the item and what we collect.
:::
### Searching Across All Collections
With hundreds of evidence types available across multiple operating systems, finding specific collectors can be time-consuming. The **Search in all collections** feature enables you to instantly locate relevant collectors by keyword.
Acquisition Profiles: Search in all collections with badge indicators showing match counts
**How it works:**
1. Enter a search term in the **"Search in all collections"** field at the top of the profile editor. In the example above we search for 'log'.
2. Results are displayed with **badge indicators** at two levels:
* **Operating System level**: Shows the total number of matches within each platform (e.g., Windows Collection: 78 matches, Linux Collection: 27 matches).
* **Tab level**: Shows how matches are distributed across tabs within each OS (e.g., System: 5, Event Logs: 3, Applications: 68).
3. **Matching text is highlighted in yellow** within the collector names and descriptions, making it easy to identify relevant items.
4. Use the secondary search field within each OS section to further filter results.
This feature is particularly useful when:
* Building targeted profiles for specific artifact types (e.g., searching "log" to find all log-related collectors).
* Investigating specific applications or services across multiple platforms.
* Quickly identifying which operating systems support collection of particular evidence types.
### (5) Save the Profile
* Once you have configured all the necessary settings, click "Save" to create your custom acquisition profile.
### **Managing Acquisition Profiles**
* **Edit Profiles**: You can edit existing profiles by selecting the profile and making necessary changes.
* **Delete Profiles**: Remove profiles that are no longer needed to keep your list organized.
* **Duplicate Profiles**: Create a copy of an existing profile to use as a template for a new one.
* **User Privileges** for acquisition profiles can be managed via ‘Settings > Roles’
### **Best Practices**
* **Check Profiles**: Ensure your acquisition profiles are up-to-date with the latest evidence types and investigation requirements.
* **Test Profiles**: Test new profiles in a controlled environment to ensure they collect the intended data.
* **Average Time Taken:** In the Acquisition Profiles table, you can see the ‘Average Time’ taken by each profile. This can be useful when considering the performance and efficiency of individual profiles.
* **The Profile Types** column provides a quick visual reference to indicate which operating systems—Windows, Linux, or macOS—are supported by each acquisition profile.
Acquisition Profiles: Average time to run profiles and action button to duplicate the profile
By using acquisition profiles in AIR, you can efficiently gather relevant data for your investigations, saving time and ensuring comprehensive evidence collection.
---
# Supported Evidence
> Source: https://kb.binalyze.ai/air/features/acquisition/supported-evidence/index.html
[Windows Collections](windows-collections)
[macOS Collections](macos-collections)
[Linux Collections](linux-collections)
[AIX Collections](ibm-aix-collections)
[ESXi Collections](esxi-collections)
---
# $Boot
> Source: https://kb.binalyze.ai/air/features/acquisition/supported-evidence/windows-collections-detail/boot.html
## Overview
**Evidence:** $Boot
**Description:** Dump Raw Contents of $Boot File
**Category:** DiskFilesystem
**Platform:** windows
**Short Name:** ntfsboot
**Is Parsed:** No
**Sent to Investigation Hub:** Yes
**Collect File(s):** Yes
## Background
The $Boot file contains the boot sector and bootstrap code for the NTFS volume. It includes critical volume parameters such as cluster size, MFT location, volume size, and other fundamental file system metadata. This file is essential for mounting and accessing NTFS volumes.
## Data Collected
This collector gathers structured data about $boot.
### $Boot Data
| Field | Description | Example |
|-------|-------------|---------|
| `Type` | File type | Boot |
| `Name` | File name | $Boot |
| `SourcePath` | Original path | C:\$Boot |
| `FilePath` | Path in evidence | NTFSFiles/$Boot |
| `FileSize` | File size in bytes | 8192 |
## Collection Method
This collector uses kernel driver NTFS raw access to read $Boot from each fixed NTFS drive.
## Forensic Value
The boot sector provides essential information about NTFS volume configuration and can reveal volume tampering or corruption. Forensic analysis of the boot sector can identify disk geometry, partition parameters, and potential bootkits or other boot sector malware.
---
# $Log File
> Source: https://kb.binalyze.ai/air/features/acquisition/supported-evidence/windows-collections-detail/log-file.html
## Overview
**Evidence:** $Log File
**Description:** Dump raw contents of $LogFile
**Category:** DiskFilesystem
**Platform:** windows
**Short Name:** ntfslog
**Is Parsed:** No
**Sent to Investigation Hub:** Yes
**Collect File(s):** Yes
## Background
The $LogFile is NTFS's transaction log that records all changes to the file system before they are committed. This logging mechanism ensures file system consistency and enables recovery from system crashes or power failures. The log file maintains both redo and undo information for file system operations.
## Data Collected
This collector gathers structured data about $log file.
### $Log File Data
| Field | Description | Example |
|-------|-------------|---------|
| `Type` | File type | LogFile |
| `Name` | File name | $LogFile |
| `SourcePath` | Original path | C:\$LogFile |
| `FilePath` | Path in evidence | NTFSFiles/$LogFile |
| `FileSize` | File size in bytes | 67108864 |
## Collection Method
This collector uses kernel driver NTFS raw access to read $LogFile from each fixed NTFS drive.
## Forensic Value
The $LogFile provides forensic evidence of recent file system activity including file creation, deletion, and modification operations. It can reveal transient files that may have been deleted and provide precise timing information about file system changes. Particularly valuable for detecting data manipulation and understanding recent system activity.
---
# $Secure:$SDS
> Source: https://kb.binalyze.ai/air/features/acquisition/supported-evidence/windows-collections-detail/securesds.html
## Overview
**Evidence:** $Secure:$SDS
**Description:** Dump Contents of $Secure:$SDS
**Category:** DiskFilesystem
**Platform:** windows
**Short Name:** securesds
**Is Parsed:** No
**Sent to Investigation Hub:** Yes
**Collect File(s):** Yes
## Background
The $Secure file contains security descriptors for all files and directories on the NTFS volume. These descriptors include access control lists (ACLs), ownership information, and audit settings. The $SDS alternate data stream stores the actual security descriptor data, which is referenced by file entries to avoid duplication.
## Data Collected
This collector gathers structured data about $secure:$sds.
### $Secure:$SDS Data
| Field | Description | Example |
|-------|-------------|---------|
| `Type` | File type | SecureSDS |
| `Name` | File name | $Secure:$SDS |
| `SourcePath` | Original path | C:\$Secure:$SDS |
| `FilePath` | Path in evidence | NTFSFiles/$Secure_$SDS |
| `FileSize` | File size in bytes | 10485760 |
## Collection Method
This collector uses kernel driver NTFS raw access to read $Secure:$SDS from each fixed NTFS drive.
## Forensic Value
Security descriptors provide critical information about file permissions, ownership, and access control. This data can reveal unauthorized access, privilege escalation attempts, and security policy violations. Essential for investigating insider threats and understanding who had access to sensitive files.
---
# $TxfLog $Tops:$T
> Source: https://kb.binalyze.ai/air/features/acquisition/supported-evidence/windows-collections-detail/txflog-topst.html
## Overview
**Evidence:** $TxfLog $Tops:$T
**Description:** Dump Contents of $TxfLog\$Tops:$T
**Category:** DiskFilesystem
**Platform:** windows
**Short Name:** txflogtops
**Is Parsed:** No
**Sent to Investigation Hub:** Yes
**Collect File(s):** Yes
## Background
Transactional NTFS (TxF) allows applications to perform file operations as atomic transactions. The $TxfLog directory contains transaction logs, and the $Tops:$T stream maintains transaction metadata. While TxF is deprecated in modern Windows versions, these files may still exist on systems and contain historical transaction data.
## Data Collected
This collector gathers structured data about $txflog $tops:$t.
### $TxfLog $Tops:$T Data
| Field | Description | Example |
|-------|-------------|---------|
| `Type` | File type | TxfLogTopsT |
| `Name` | File name | $Tops:$T |
| `SourcePath` | Original path | C:\$Extend\$RmMetadata\$TxfLog\$Tops:$T |
| `FilePath` | Path in evidence | NTFSFiles/$Tops_$T |
| `FileSize` | File size in bytes | 524288 |
## Collection Method
This collector uses kernel driver NTFS raw access to read $TxfLog $Tops:$T from each fixed NTFS drive.
## Forensic Value
TxF logs can provide evidence of transactional file operations and application activity. Although TxF is deprecated, these files may contain valuable historical data about file system transactions and can reveal application behavior patterns.
---
# Activities DB
> Source: https://kb.binalyze.ai/air/features/acquisition/supported-evidence/windows-collections-detail/activities-db.html
## Overview
**Evidence:** Activities DB
**Description:** Dump Activities DB Files
**Category:**
**Platform:** windows
**Short Name:** adb
**Is Parsed:** Yes
**Sent to Investigation Hub:** Yes
**Collect File(s):** No
## Data Collected
This collector gathers structured data about activities db.
---
# Action1 RMM Logs
> Source: https://kb.binalyze.ai/air/features/acquisition/supported-evidence/windows-collections-detail/action1-rmm-logs.html
## Overview
**Evidence:** Action1 RMM Logs
**Description:** Collect Action1 RMM Logs
**Category:** Applications
**Platform:** windows
**Short Name:** action1rmmlgs
**Is Parsed:** No
**Sent to Investigation Hub:** No
**Collect File(s):** Yes
## Background
Action1 RMM is a remote monitoring and management platform that maintains logs of agent activities, remote commands, patch deployments, and system monitoring events.
## Data Collected
This collector gathers structured data about action1 rmm logs.
## Collection Method
This collector gathers Action1 log files from the Windows directory containing RMM agent activity and command execution records.
## Forensic Value
Action1 logs help investigate RMM-based attacks, identify executed commands, track software deployments, and reveal potential abuse of management tools for malicious purposes.
---
# Active Directory Logs
> Source: https://kb.binalyze.ai/air/features/acquisition/supported-evidence/windows-collections-detail/active-directory-logs.html
## Overview
**Evidence:** Active Directory Logs
**Description:** Collect Active Directory Logs
**Category:** Applications
**Platform:** windows
**Short Name:** adl
**Is Parsed:** No
**Sent to Investigation Hub:** No
**Collect File(s):** Yes
## Background
Active Directory NTDS directory contains the AD database and transaction logs. This is the core directory service database that stores user accounts, groups, computers, and organizational structure for Windows domains.
## Data Collected
This collector gathers structured data about active directory logs.
## Collection Method
This collector gathers files from the Windows NTDS directory, including the Active Directory database (ntds.dit) and associated transaction logs.
## Forensic Value
Active Directory data is essential for investigating credential theft, privilege escalation, unauthorized access, account manipulation, and domain compromise. The NTDS.dit database contains password hashes and is a high-value target for attackers.
---
# WMI Active Script
> Source: https://kb.binalyze.ai/air/features/acquisition/supported-evidence/windows-collections-detail/wmi-active-script.html
## Overview
**Evidence:** WMI Active Script
**Description:** Dump WMI Active Script Event Consumers
**Category:** System
**Platform:** windows
**Short Name:** wmiasc
**Is Parsed:** Yes
**Sent to Investigation Hub:** Yes
**Collect File(s):** No
## Background
WMI ActiveScript Event Consumers execute VBScript or JScript code when specific WMI events occur. This is a powerful persistence mechanism that allows attackers to run arbitrary scripts with SYSTEM privileges in response to system events.
ActiveScript consumers are particularly dangerous because they don't require a file on disk (fileless persistence) and run with high privileges.
## Data Collected
This collector gathers structured data about wmi active script.
### WMI Active Script Data
| Field | Description | Example |
|-------|-------------|---------|
| `Name` | Consumer name | MaliciousConsumer |
| `PayloadScriptEngine` | Scripting engine | VBScript |
| `PayloadScriptText` | Script code | Set objShell = CreateObject("WScript.Shell")... |
## Collection Method
This collector queries WMI for ActiveScriptEventConsumer instances in multiple namespaces:
- `ROOT\Subscription`
- `ROOT\DEFAULT`
- `ROOT\CIMV2`
## Forensic Value
ActiveScript consumers are a common advanced persistence technique. Investigators use this data to detect WMI script-based persistence, identify malicious VBScript/JScript payloads, and track fileless malware techniques.
---
# AI Agent Events
> Source: https://kb.binalyze.ai/air/features/acquisition/supported-evidence/windows-collections-detail/ai-agent-events.html
## Overview
**Evidence:** AI Agent Events
**Description:** Parse AI agent transcripts to extract a hash-chained event timeline
**Category:** AI
**Platform:** windows
**Short Name:** aievt
**Is Parsed:** Yes
**Sent to Investigation Hub:** Yes
**Collect File(s):** No
## Background
AI coding assistants and agent frameworks persist prompts, tool calls, approvals, and execution results in JSONL or JSON transcripts. Those records show what an agent was asked to do, which tools it invoked, and whether a user approved the action.
## Data Collected
This collector gathers structured data about AI agent events, including prompts, assistant messages, tool calls, MCP server names, approval states, exit codes, and source hashes.
## Collection Method
Transcripts from AI tools are parsed with explicit size limits. Each event is hash-chained using the previous hash and source offset so analysts can detect gaps or tampering. Prompt text is stored as a bounded redacted excerpt with SHA-256.
## Forensic Value
Reconstructs what an AI agent did on the host: which commands it ran, which files it referenced, which MCP tools it called, and whether the user approved or denied those actions. Risk flags highlight prompt injection, dangerous commands, credential access, and transcript integrity gaps.
---
# AI Agents
> Source: https://kb.binalyze.ai/air/features/acquisition/supported-evidence/windows-collections-detail/ai-agents.html
## Overview
**Evidence:** AI Agents
**Description:** Parse custom AI agent definitions and autonomy settings
**Category:** AI
**Platform:** windows
**Short Name:** aiagent
**Is Parsed:** Yes
**Sent to Investigation Hub:** Yes
**Collect File(s):** No
## Background
Claude Code, Cursor, and similar tools store custom agent definitions that control tools, permission modes, MCP servers, and standing instructions. A poisoned agent definition can grant broad tool access or persist hidden automation.
## Data Collected
This collector gathers structured data about custom AI agent definitions, including agent path, tools, permission mode, MCP servers, and bounded instruction excerpts.
## Collection Method
This collector parses YAML frontmatter and bounded markdown bodies from project and global agent directories, preserving raw sources in Content.
## Forensic Value
Identifies custom agents with broad tool access, permission bypass, embedded hooks, or malicious instructions that can steer AI tool execution without an interactive prompt.
---
# AI Artifacts
> Source: https://kb.binalyze.ai/air/features/acquisition/supported-evidence/windows-collections-detail/ai-artifacts.html
## Overview
**Evidence:** AI Artifacts
**Description:** Inventory AI tool files (configs, transcripts, databases, MCP definitions)
**Category:** AI
**Platform:** windows
**Short Name:** aiart
**Is Parsed:** No
**Sent to Investigation Hub:** Yes
**Collect File(s):** Yes
## Background
AI coding tools leave configs, transcripts, state databases, and MCP definitions under user homes and project directories such as .cursor/, .claude/, and .codex/. An inventory of those files establishes which tools were present and where their evidence lives.
## Data Collected
This collector gathers structured inventory data about AI tool artifacts, including path, SHA-256, size, modification time, tool name, and artifact type, and collects the matching files.
## Collection Method
This collector walks user homes and development directories to discover AI tool artifacts in known and project-local locations, recording file metadata without deep-parsing content.
## Forensic Value
Provides a filesystem inventory of AI tool presence on the host. Paths, hashes, and timestamps support timeline correlation with other collectors and tamper detection across acquisitions.
---
# AI Commands
> Source: https://kb.binalyze.ai/air/features/acquisition/supported-evidence/windows-collections-detail/ai-commands.html
## Overview
**Evidence:** AI Commands
**Description:** Parse custom AI slash-command definitions
**Category:** AI
**Platform:** windows
**Short Name:** aicmd
**Is Parsed:** Yes
**Sent to Investigation Hub:** Yes
**Collect File(s):** No
## Background
Claude Code and Cursor allow project and user custom slash-command markdown files. Those commands can embed shell instructions, automation, or prompt text that runs whenever an operator invokes them.
## Data Collected
This collector gathers structured data about custom AI slash-command definitions, including command path, name, and bounded redacted excerpts.
## Collection Method
This collector parses command frontmatter and bounded excerpts from project and user command directories while preserving raw files in Content.
## Forensic Value
Identifies custom commands that embed dangerous shell instructions, prompt injection, or hidden automation that can execute during AI-assisted work.
---
# AI Configs
> Source: https://kb.binalyze.ai/air/features/acquisition/supported-evidence/windows-collections-detail/ai-configs.html
## Overview
**Evidence:** AI Configs
**Description:** Parse AI tool configuration files for provider, model, and permission metadata
**Category:** AI
**Platform:** windows
**Short Name:** aicfg
**Is Parsed:** Yes
**Sent to Investigation Hub:** Yes
**Collect File(s):** No
## Background
AI tools store provider, model, permission, and trust settings in files such as claude.json, settings.json, and cli-config.json. Those settings determine which models are used and whether the agent can act without approval.
## Data Collected
This collector gathers structured data about AI tool configurations, including provider, model, permission mode, trust overrides, and secret-like value indicators.
## Collection Method
This collector scans per-user and project-scope config files and parses JSON content to extract provider, model, and permission metadata and to flag risky configurations.
## Forensic Value
Reveals which AI providers and models are configured, whether auto-approve or manual permission modes are in use, and whether configs contain secret-like values. Risk flags highlight permission bypasses and broad tool allowlists.
---
# AI Hooks
> Source: https://kb.binalyze.ai/air/features/acquisition/supported-evidence/windows-collections-detail/ai-hooks.html
## Overview
**Evidence:** AI Hooks
**Description:** Parse AI hook definitions that auto-execute commands on agent events
**Category:** AI
**Platform:** windows
**Short Name:** aihook
**Is Parsed:** Yes
**Sent to Investigation Hub:** Yes
**Collect File(s):** No
## Background
Cursor hooks.json and Claude settings can bind shell commands to AI tool events such as session start, prompt submit, or file edit. Hooks run automatically and are a high-risk persistence and remote-code-execution surface.
## Data Collected
This collector gathers structured data about AI hook definitions, including event, matcher, command, referenced script hashes, and source config paths.
## Collection Method
This collector parses hook event, matcher, and command entries from Cursor and Claude hook configs, hashes referenced scripts, and preserves source configs.
## Forensic Value
Hooks can run shell commands before or after AI tool events without an interactive prompt. They are a high-risk persistence and code-execution surface during AI-assisted investigations.
---
# AI MCP
> Source: https://kb.binalyze.ai/air/features/acquisition/supported-evidence/windows-collections-detail/ai-mcp.html
## Overview
**Evidence:** AI MCP
**Description:** Extract MCP server definitions and execution surface from AI tool configs
**Category:** AI
**Platform:** windows
**Short Name:** aimcp
**Is Parsed:** Yes
**Sent to Investigation Hub:** Yes
**Collect File(s):** No
## Background
Model Context Protocol (MCP) servers are the execution bridge between AI agents and external systems. Configured servers can launch local commands, expose environment variables, or connect to remote endpoints.
## Data Collected
This collector gathers structured data about MCP servers, including server name, launch command and arguments, environment-variable names, transport, URL host, and risk flags.
## Collection Method
This collector scans claude_desktop_config.json, .mcp.json, and mcp.json in per-user and per-project scope and extracts each defined MCP server.
## Forensic Value
Inventories every MCP server configured on the host. Risk flags highlight remote servers, risky launchers, broad environment exposure, and suspicious command patterns that can extend an agent's reach.
---
# AI Models
> Source: https://kb.binalyze.ai/air/features/acquisition/supported-evidence/windows-collections-detail/ai-models.html
## Overview
**Evidence:** AI Models
**Description:** Inventory Ollama, Hugging Face, and signature-confirmed local model components
**Category:** AI
**Platform:** windows
**Short Name:** aimodel
**Is Parsed:** Yes
**Sent to Investigation Hub:** Yes
**Collect File(s):** No
## Background
Local model runtimes such as Ollama and Hugging Face caches store model revisions and component files on disk. Presence of a model is not proof it was executed; inventory still shows which components were referenced locally.
## Data Collected
This collector gathers structured data about local model-component references, including model key, revision, component role, locator, capture mode, digest provenance, verification status, size, and timestamps where available.
## Collection Method
This collector parses bounded Ollama manifests, Hugging Face cache refs and snapshot metadata, and recognized model metadata inside signature-confirmed project roots. Large model-content files remain metadata-only.
## Forensic Value
Shows which model revisions and components were referenced locally, preserving declared and physically computed digest provenance without treating a downloaded model as proof of execution.
---
# AI Rules
> Source: https://kb.binalyze.ai/air/features/acquisition/supported-evidence/windows-collections-detail/ai-rules.html
## Overview
**Evidence:** AI Rules
**Description:** Parse AI tool rules, instructions, and ignore/indexing files
**Category:** AI
**Platform:** windows
**Short Name:** airule
**Is Parsed:** Yes
**Sent to Investigation Hub:** Yes
**Collect File(s):** No
## Background
Instruction files such as CLAUDE.md, AGENTS.md, .cursorrules, Copilot instructions, and AI ignore/indexing files persist standing guidance for coding assistants. They can inject attacker-controlled directives or hide files from AI review.
## Data Collected
This collector gathers structured data about AI rules and instruction files, including path, type, SHA-256, size, and a bounded redacted excerpt.
## Collection Method
This collector uses the AI artifact scanner across user homes and development roots. Full rule bodies are copied to Content; Case.db stores metadata plus a bounded redacted excerpt.
## Forensic Value
Surfaces persistent prompt-injection directives and anti-forensics exclusions that can hide malicious files from AI review or steer agent behavior across sessions.
---
# AI Secrets
> Source: https://kb.binalyze.ai/air/features/acquisition/supported-evidence/windows-collections-detail/ai-secrets.html
## Overview
**Evidence:** AI Secrets
**Description:** Hunt credentials exposed in AI prompts, responses, tool output, and configs
**Category:** AI
**Platform:** windows
**Short Name:** aisec
**Is Parsed:** Yes
**Sent to Investigation Hub:** Yes
**Collect File(s):** No
## Background
Developers paste tokens, keys, and credentials into AI prompts. Agents can also echo secrets back or receive them from tool output and config stores. Those findings are a credential-exposure lead, not proof of theft.
## Data Collected
This collector gathers structured data about redacted credential findings, including detector, category, surface, location, and links back to the originating session or event. Cleartext is not stored in Case.db.
## Collection Method
This collector reuses the AI artifact scanner and transcript/config parsers. A two-stage detector emits redacted findings with their surface and location. Cleartext is never written to Case.db.
## Forensic Value
Reveals secrets a developer pasted into an AI tool, that an agent echoed back, or that a tool returned. Findings link to the originating session, event, and preserved raw source for follow-up.
---
# AI Sessions
> Source: https://kb.binalyze.ai/air/features/acquisition/supported-evidence/windows-collections-detail/ai-sessions.html
## Overview
**Evidence:** AI Sessions
**Description:** Parse AI agent transcripts to extract session timeline headers
**Category:** AI
**Platform:** windows
**Short Name:** aisess
**Is Parsed:** Yes
**Sent to Investigation Hub:** Yes
**Collect File(s):** No
## Background
AI coding tools persist conversation sessions as JSONL transcripts and workspace files. Session headers show when an agent ran, which project it targeted, and how many prompts or tool calls occurred.
## Data Collected
This collector gathers structured data about AI agent sessions, including project path, timestamps, message counts, tool-call counts, and session-level risk flags.
## Collection Method
This collector scans per-user transcript directories and workspace storage. JSONL transcripts are parsed for session metadata; workspace files map workspace IDs to project paths.
## Forensic Value
Reconstructs the timeline of AI agent sessions: when they ran, in which projects, and how many prompts and tool calls occurred. Risk flags surface sessions with dangerous commands, prompt injection indicators, or transcript integrity gaps.
---
# AI Skills
> Source: https://kb.binalyze.ai/air/features/acquisition/supported-evidence/windows-collections-detail/ai-skills.html
## Overview
**Evidence:** AI Skills
**Description:** Parse AI skill definitions and bundled script inventory
**Category:** AI
**Platform:** windows
**Short Name:** aiskill
**Is Parsed:** Yes
**Sent to Investigation Hub:** Yes
**Collect File(s):** No
## Background
AI tools load SKILL.md definitions and bundled scripts that extend agent capabilities. A malicious skill can inject dynamic context or execute bundled payloads during an agent run.
## Data Collected
This collector gathers structured data about AI skills and bundled skill files, including skill path, tools, SHA-256, size, and inventoried script metadata.
## Collection Method
This collector parses skill frontmatter and body excerpts, inventories bundled scripts by path, hash, and size, and copies raw files to Content.
## Forensic Value
Surfaces executable skill payloads and dynamic context injection that can steer or compromise AI agent execution beyond the interactive prompt.
---
# AmCache
> Source: https://kb.binalyze.ai/air/features/acquisition/supported-evidence/windows-collections-detail/amcache.html
## Overview
**Evidence:** AmCache
**Description:** Collect Amcache and Parse
**Category:** System
**Platform:** windows
**Short Name:** amc
**Is Parsed:** Yes
**Sent to Investigation Hub:** Yes
**Collect File(s):** Yes
## Background
Amcache.hve is a registry hive maintained by Windows Application Compatibility infrastructure. It tracks information about executed programs, installed applications, device drivers, and application shortcuts.
Amcache provides historical evidence of program execution and can contain information about programs that have been deleted. The format changed significantly between Windows 7/8 (old format with Root\File and Root\Programs keys) and Windows 10 (new format with Root\InventoryApplication* keys).
## Data Collected
This collector gathers structured data about amcache.
### AmCache Data
| Field | Description | Example |
|-------|-------------|---------|
| `ProgramID` | Program identifier | 00001234567890abcdef |
| `ProgramName` | Application name | Google Chrome |
| `Version` | Application version | 118.0.5993.89 |
| `Publisher` | Software publisher | Google LLC |
| `RootDirPath` | Installation directory | C:\Program Files\Google\Chrome |
| `InstallDate` | Installation date | 2023-10-01T10:00:00 |
| `KeyLastWriteTime` | Registry key modification time | 2023-10-15T14:30:00 |
| `PackageFullName` | UWP package name | |
| `InstallSourceType` | Installation source | 2 |
| `MSIProductCode` | MSI product code GUID | {12345678-1234-1234-1234-123456789ABC} |
| `MSIPackageCode` | MSI package code GUID | {12345678-1234-1234-1234-123456789ABC} |
| `UninstallKey` | Uninstall registry key | SOFTWARE\Microsoft\Windows\CurrentVersion\Uninstall\... |
| `UninstallString` | Uninstall command | "C:\Program Files\App\uninstall.exe" |
| `ProgramID` | Associated program ID | 00001234567890abcdef |
| `FileID` | File identifier (SHA1) | a1b2c3d4e5f6... |
| `ProductName` | Product name from file metadata | Google Chrome |
| `ProductVersion` | Product version | 118.0.5993.89 |
| `Name` | File name | chrome.exe |
| `FilePath` | Lowercase long path | c:\program files\google\chrome\application\chrome.exe |
| `OriginalFileName` | Original file name from PE header | chrome.exe |
| `SHA1` | SHA1 hash | a1b2c3d4e5f6... |
| `Publisher` | Publisher name | Google LLC |
| `FileSize` | File size in bytes | 3145728 |
| `USN` | Update Sequence Number | 123456789 |
| `IsOsComponent` | Whether file is OS component | FALSE |
| `KeyLastWriteTime` | Registry key modification time | 2023-10-15T14:30:00 |
| `KeyName` | Registry key name | chrome.lnk |
| `LNKPath` | Path to shortcut file | C:\Users\user\Desktop\Chrome.lnk |
| `KeyLastWriteTime` | Registry key modification time | 2023-10-15T14:30:00 |
| `KeyName` | Device identifier | USB\VID_1234&PID_5678 |
| `Class` | Device class | USB |
| `Description` | Device description | USB Mass Storage Device |
| `DriverName` | Driver name | usbstor.inf |
| `DriverPackageStrongName` | Driver package identifier | oem12.inf:... |
| `Model` | Device model | SanDisk Ultra |
| `FirstInstallDate` | First installation date | 2023-09-01T12:00:00 |
| `InstallDate` | Last installation date | 2023-10-01T14:00:00 |
| `KeyLastWriteTime` | Registry key modification time | 2023-10-15T14:30:00 |
| `Manufacturer` | Device manufacturer | SanDisk |
| `Provider` | Driver provider | Microsoft |
| `Service` | Associated service | USBSTOR |
| `DriverVerDate` | Driver version date | 2023-06-15T00:00:00 |
| `DriverVerVersion` | Driver version | 10.0.19041.1234 |
| `HWID` | Hardware ID | USB\VID_1234&PID_5678&REV_0100 |
| `Inf` | INF file name | usbstor.inf |
| `ParentID` | Parent device ID | USB\ROOT_HUB30 |
| `DriverID` | Driver identifier | usbstor.inf:... |
| `ContainerID` | Container ID GUID | {12345678-1234-1234-1234-123456789ABC} |
| `ClassGuid` | Class GUID | {36FC9E60-C465-11CF-8056-444553540000} |
| `COMPID` | Compatible IDs | USB\Class_08 |
| `BusReportedDescription` | Bus-reported description | USB Mass Storage Device |
| `KeyName` | Driver key name | ntfs.sys |
| `Product` | Product name | Microsoft Windows |
| `ProductVersion` | Product version | 10.0.19041.1234 |
| `DriverName` | Driver file name | ntfs.sys |
| `DriverVersion` | Driver version | 10.0.19041.1234 |
| `DriverPackageStrongName` | Driver package identifier | oem0.inf:... |
| `DriverCompany` | Driver company | Microsoft Corporation |
| `DriverLastWriteTime` | Driver last write time | 2023-06-01T00:00:00 |
| `DriverTimeStamp` | Driver timestamp | 2023-06-01T00:00:00 |
| `KeyLastWriteTime` | Registry key modification time | 2023-10-15T14:30:00 |
| `DriverIsKernelMode` | Whether driver is kernel-mode | TRUE |
| `DriverSigned` | Whether driver is signed | TRUE |
| `Service` | Associated service | NTFS |
| `Inf` | INF file name | ntfs.inf |
| `DriverId` | Driver identifier | ntfs.sys:... |
| `DriverCheckSum` | Driver checksum | 0x12345678 |
| `ImageSize` | Driver image size | 524288 |
| `VolumeID` | Volume GUID | {12345678-1234-1234-1234-123456789ABC} |
| `FileID` | File entry identifier | 00001234abcd |
| `ProgramID` | Associated program ID | 00005678efgh |
| `ProductName` | Product name | Google Chrome |
| `CompanyName` | Company name | Google LLC |
| `FilePath` | File path | C:\Program Files\Google\Chrome\Application\chrome.exe |
| `FileDescription` | File description | Google Chrome |
| `FileVersion` | File version | 118.0.5993.89 |
| `FileSize` | File size in bytes | 3145728 |
| `SHA1` | SHA1 hash | a1b2c3d4e5f6... |
| `CompilationTime` | PE compilation timestamp | 2023-09-15T10:00:00 |
| `FileModificationTime` | File modification time | 2023-09-20T14:00:00 |
| `FileCreationTime` | File creation time | 2023-10-01T12:00:00 |
| `EntryCreationTime` | Amcache entry creation | 2023-10-01T12:05:00 |
| `KeyLastWriteTime` | Registry key modification time | 2023-10-15T14:30:00 |
| `MFTEntryNumber` | MFT entry number | 12345 |
| `MFTSequenceNumber` | MFT sequence number | 1 |
| `ProgramID` | Program identifier | 00005678efgh |
| `VolumeIDFileID` | Space-separated list of file IDs | 00001234abcd 00005678ijkl |
| `ProgramName` | Program name | Google Chrome |
| `ProgramVersion` | Program version | 118.0.5993.89 |
| `FilePaths` | Space-separated file paths | C:\Program Files\Google\Chrome\... |
| `Publisher` | Publisher name | Google LLC |
| `InstallDate` | Installation date | 2023-10-01T10:00:00 |
| `KeyLastWriteTime` | Registry key modification time | 2023-10-15T14:30:00 |
| `InstallSourceType` | Installation source type | 2 |
| `UninstallKeys` | Uninstall registry keys | SOFTWARE\Microsoft\Windows\CurrentVersion\Uninstall\... |
| `ProductCode` | Product code GUID | {12345678-1234-1234-1234-123456789ABC} |
| `PackageCode` | Package code GUID | {12345678-1234-1234-1234-123456789ABC} |
| `MSIProductCodes` | MSI product codes | {12345678-1234-1234-1234-123456789ABC} |
| `MSIPackageCodes` | MSI package codes | {12345678-1234-1234-1234-123456789ABC} |
## Collection Method
This collector:
- Collects `Windows\appcompat\Programs\Amcache.hve` and transaction logs
- Parses the offline registry hive using OfflineRegistry library
- Detects format version (old vs new)
- Extracts data from appropriate registry keys based on version
**New Format Keys:**
- `Root\InventoryApplication`
- `Root\InventoryApplicationFile`
- `Root\InventoryApplicationShortcut`
- `Root\InventoryDevicePnp`
- `Root\InventoryDriverBinary`
**Old Format Keys:**
- `Root\File`
- `Root\Programs`
## Forensic Value
Amcache is invaluable for program execution analysis and historical application tracking. Investigators use this data to prove program execution (even deleted programs), establish installation timelines, identify malware execution, track application versions and updates, correlate file hashes with known malware, detect portable executable usage, and reconstruct user application usage patterns.
---
# AmmyAdmin Logs
> Source: https://kb.binalyze.ai/air/features/acquisition/supported-evidence/windows-collections-detail/ammyadmin-logs.html
## Overview
**Evidence:** AmmyAdmin Logs
**Description:** Collect AmmyAdmin Logs
**Category:** Applications
**Platform:** windows
**Short Name:** aammyadmnlg
**Is Parsed:** No
**Sent to Investigation Hub:** No
**Collect File(s):** Yes
## Background
AMMYY Admin (AmmyAdmin) is a remote desktop application that has been used both legitimately and by threat actors. The software maintains logs of remote connections and sessions.
## Data Collected
This collector gathers structured data about ammyadmin logs.
## Collection Method
This collector gathers log files from the AMMYY ProgramData directory containing connection history and activity records.
## Forensic Value
AmmyAdmin logs are important for investigations as the software has been used by scammers and threat actors for unauthorized access. Logs reveal remote connection attempts, session times, and can identify malicious use of the tool.
---
# Antivirus Information
> Source: https://kb.binalyze.ai/air/features/acquisition/supported-evidence/windows-collections-detail/antivirus-information.html
## Overview
**Evidence:** Antivirus Information
**Description:** Collect information about installed antivirus
**Category:** System
**Platform:** windows
**Short Name:** avi
**Is Parsed:** Yes
**Sent to Investigation Hub:** Yes
**Collect File(s):** No
## Background
Windows Security Center tracks registered antivirus and antispyware products. Security software registers itself with Security Center to report its status to Windows.
This information helps investigators understand the security posture of the system and whether adequate protection was present during an incident.
## Data Collected
This collector gathers structured data about antivirus information.
### Antivirus Information Data
| Field | Description | Example |
|-------|-------------|---------|
| `AntiVirus` | Comma-separated list of AV products | Windows Defender,McAfee Endpoint Security |
## Collection Method
This evidence is collected as part of the System collector by querying WMI:
- `ROOT\SecurityCenter` - For Windows XP (AntiVirusProduct, AntiSpywareProduct)
- `ROOT\SecurityCenter2` - For Windows Vista+ (AntiVirusProduct, AntiSpywareProduct)
Queries both AntiVirusProduct and AntiSpywareProduct classes and extracts DisplayName.
## Forensic Value
Antivirus information helps assess security posture and detection capabilities. Investigators use this data to verify security software presence, identify detection gaps, correlate with malware infections, assess why threats weren't detected, and validate security controls.
---
# AnyDesk Logs
> Source: https://kb.binalyze.ai/air/features/acquisition/supported-evidence/windows-collections-detail/anydesk-logs.html
## Overview
**Evidence:** AnyDesk Logs
**Description:** Collect AnyDesk Logs
**Category:** Applications
**Platform:** windows
**Short Name:** nydskl
**Is Parsed:** No
**Sent to Investigation Hub:** No
**Collect File(s):** Yes
## Background
AnyDesk is a widely-used remote desktop application frequently leveraged by both legitimate users and threat actors. It stores trace logs, configuration files, connection traces, and recorded sessions. The software is commonly abused for initial access and persistence in cyber attacks.
## Data Collected
This collector gathers structured data about anydesk logs.
## Collection Method
This collector gathers AnyDesk trace files, configuration files, connection trace logs, and recorded session files from user and system directories.
## Forensic Value
AnyDesk artifacts are critical for investigating unauthorized remote access, as the tool is frequently used in ransomware attacks, tech support scams, and remote access trojans. Logs reveal connection IDs, session times, file transfers, and can link to specific AnyDesk addresses used by attackers.
---
# Apache Logs
> Source: https://kb.binalyze.ai/air/features/acquisition/supported-evidence/windows-collections-detail/apache-logs.html
## Overview
**Evidence:** Apache Logs
**Description:** Collect Apache Logs
**Category:** Applications
**Platform:** windows
**Short Name:** apcl
**Is Parsed:** No
**Sent to Investigation Hub:** No
**Collect File(s):** Yes
## Background
Apache HTTP Server and Tomcat logs record web server activity including access logs, error logs, and application-specific logs. These logs are critical for understanding web server operations and detecting web-based attacks.
## Data Collected
This collector gathers structured data about apache logs.
## Collection Method
This collector gathers Apache and Tomcat log files from standard installation directories in Program Files, collecting access logs, error logs, and other server activity logs.
## Forensic Value
Apache logs are essential for detecting web attacks, unauthorized access attempts, data exfiltration, and command injection. They reveal attacker IP addresses, requested URLs, user agents, and exploitation attempts against web applications.
---
# AppCompactCache
> Source: https://kb.binalyze.ai/air/features/acquisition/supported-evidence/windows-collections-detail/appcompactcache.html
## Overview
**Evidence:** AppCompactCache
**Description:** Enumarate AppCompatCache (aka ShimCache)
**Category:** System
**Platform:** windows
**Short Name:** appcc
**Is Parsed:** Yes
**Sent to Investigation Hub:** Yes
**Collect File(s):** No
## Background
The Application Compatibility Cache (also known as Shimcache) tracks metadata about executable files to improve application compatibility. Windows records information about executables when they are run, and this data persists across reboots.
AppCompatCache can provide evidence of program execution and file presence, including programs that may have been deleted. The cache is stored in the registry and contains up to 1024 entries (varies by Windows version).
## Data Collected
This collector gathers structured data about appcompactcache.
### AppCompactCache Data
| Field | Description | Example |
|-------|-------------|---------|
| `KeyPath` | Registry key path | HKLM\SYSTEM\CurrentControlSet\Control\Session Manager\AppCompatCache |
| `EntryName` | Control set name | CurrentControlSet |
| `Position` | Position in cache | 0 |
| `CachedFileSize` | File size recorded in cache | 1048576 |
| `CachedFileModified` | Modification time in cache | 2023-10-15T14:30:00 |
| `Executed` | Whether file was executed (varies by OS version) | TRUE |
## Collection Method
This collector:
- Searches registry for AppCompatCache locations:
- `HKLM\SYSTEM\ControlSet00*\Control\Session Manager\AppCompatibility`
- `HKLM\SYSTEM\ControlSet00*\Control\Session Manager\AppCompatCache`
- Reads the `AppCompatCache` binary registry value
- Parses the cache data format (varies by Windows version)
- Extracts file paths, timestamps, and execution flags
- Normalizes file paths to full paths
## Forensic Value
AppCompatCache is critical for establishing program execution and file presence. Investigators use this data to identify executed programs (even if deleted), establish execution timelines, detect malware execution, identify reconnaissance tools, track lateral movement utilities, detect portable executable usage, and correlate with other execution artifacts.
---
# AppPaths
> Source: https://kb.binalyze.ai/air/features/acquisition/supported-evidence/windows-collections-detail/apppaths.html
## Overview
**Evidence:** AppPaths
**Description:** Enumerate AppPaths
**Category:** System
**Platform:** windows
**Short Name:** apppaths
**Is Parsed:** Yes
**Sent to Investigation Hub:** Yes
**Collect File(s):** No
## Background
The App Paths registry key allows applications to register custom search paths so they can be launched by name without specifying the full path. When a user types just the executable name (e.g., "chrome"), Windows searches the App Paths registry to find the full path.
Malware can abuse this mechanism to hijack application launches or establish persistence by registering malicious executables under legitimate application names.
## Data Collected
This collector gathers structured data about apppaths.
### AppPaths Data
| Field | Description | Example |
|-------|-------------|---------|
| `KeyName` | Application executable name | chrome.exe |
| `KeyDefaultValue` | Default value (full path to exe) | C:\Program Files\Google\Chrome\Application\chrome.exe |
| `Path` | Additional search path | C:\Program Files\Google\Chrome\Application |
| `Username` | User account (empty for HKLM) | user or empty |
| `KeyPath` | Registry key path | SOFTWARE\Microsoft\Windows\CurrentVersion\App Paths\chrome.exe |
| `LastWriteTime` | Registry key last write time | 2023-10-15T14:30:00 |
| `RegPath` | Path to registry hive | Registry/SOFTWARE or Registry/ntuser.dat |
## Collection Method
This collector searches both machine and user registry locations:
- `HKLM\SOFTWARE\Microsoft\Windows\CurrentVersion\App Paths\*`
- `HKCU\SOFTWARE\Microsoft\Windows\CurrentVersion\App Paths\*`
For each application, it reads:
- Default value (full executable path)
- Path value (additional search path)
- Registry key last write time
## Forensic Value
App Paths can reveal application installations and detect persistence mechanisms. Investigators use this data to identify registered applications, detect application hijacking, track custom executable paths, identify persistence mechanisms, verify application locations, and detect malware masquerading as legitimate applications.
---
# ARP Table
> Source: https://kb.binalyze.ai/air/features/acquisition/supported-evidence/windows-collections-detail/arp-table.html
## Overview
**Evidence:** ARP Table
**Description:** Collect ARP Table
**Category:** Network
**Platform:** windows
**Short Name:** arpt
**Is Parsed:** Yes
**Sent to Investigation Hub:** Yes
**Collect File(s):** No
## Background
The ARP (Address Resolution Protocol) table maps IP addresses to physical MAC addresses on the local network. Windows maintains this cache for performance, storing recent IP-to-MAC mappings from network communication.
ARP cache can reveal devices the system has recently communicated with on the local network, including routers, file servers, and other workstations.
## Data Collected
This collector gathers structured data about arp table.
### ARP Table Data
| Field | Description | Example |
|-------|-------------|---------|
| `PhysicalAddress` | MAC address | 00:50:56:C0:00:08 |
| `IPAddress` | IP address | 192.168.1.1 |
| `Adapter` | Network adapter index | 12 |
| `Type` | Entry type | 4 (Static) |
## Collection Method
This collector uses Windows API to enumerate ARP cache:
- `GetIpNetTable` to retrieve all ARP entries
- Parses MAC addresses into readable format
- Records adapter associations
ARP entry types: Other (1), Invalid (2), Dynamic (3), Static (4).
## Forensic Value
ARP cache reveals local network communication patterns. Investigators use this data to identify devices on the local network, detect ARP spoofing attacks, track lateral movement targets, identify network infrastructure devices, correlate with network connections, and detect man-in-the-middle attacks.
---
# Avast Logs
> Source: https://kb.binalyze.ai/air/features/acquisition/supported-evidence/windows-collections-detail/avast-logs.html
## Overview
**Evidence:** Avast Logs
**Description:** Collect Avast Logs
**Category:** Applications
**Platform:** windows
**Short Name:** avstls
**Is Parsed:** No
**Sent to Investigation Hub:** No
**Collect File(s):** Yes
## Background
Avast Antivirus maintains comprehensive logs of malware detections, real-time shield activities, scan results, and quarantine operations. The Chest is Avast's quarantine area where suspected files are isolated, with index.xml tracking quarantined items.
## Data Collected
This collector gathers structured data about avast logs.
## Collection Method
This collector gathers Avast log files from Application Data and ProgramData directories across different Windows versions, plus the Chest index file that catalogs quarantined threats.
## Forensic Value
Avast logs provide critical evidence of malware detections, security threats, user actions, and system protection events. The Chest index reveals quarantined files that may indicate successful attack prevention or ongoing compromise attempts.
---
# AVG Logs
> Source: https://kb.binalyze.ai/air/features/acquisition/supported-evidence/windows-collections-detail/avg-logs.html
## Overview
**Evidence:** AVG Logs
**Description:** Collect AVG Logs
**Category:** Applications
**Platform:** windows
**Short Name:** avgls
**Is Parsed:** No
**Sent to Investigation Hub:** No
**Collect File(s):** Yes
## Background
AVG Antivirus is a popular security solution that logs malware detections, scan activities, quarantine actions, and threat analysis. These logs are stored in dedicated log and report directories within the application data folders.
## Data Collected
This collector gathers structured data about avg logs.
## Collection Method
This collector gathers AVG log files and scan reports from both legacy Application Data directories and current ProgramData locations, including detection logs and scan reports.
## Forensic Value
AVG logs are valuable for identifying detected malware, understanding threat timelines, correlating infections with system activities, and verifying security response actions. They can reveal attempted attacks, quarantined files, and the system's security posture over time.
---
# Avira Logs
> Source: https://kb.binalyze.ai/air/features/acquisition/supported-evidence/windows-collections-detail/avira-logs.html
## Overview
**Evidence:** Avira Logs
**Description:** Collect Avira Logs
**Category:** Applications
**Platform:** windows
**Short Name:** avrals
**Is Parsed:** No
**Sent to Investigation Hub:** No
**Collect File(s):** Yes
## Background
Avira Antivirus records malware detections, system scans, real-time protection events, and update activities in its LOGFILES directory. These logs provide detailed information about security events and antivirus operations.
## Data Collected
This collector gathers structured data about avira logs.
## Collection Method
This collector gathers all log files from the Avira Antivirus LOGFILES directory located in ProgramData, which contains comprehensive antivirus activity records.
## Forensic Value
Avira logs are essential for tracking malware detections, analyzing security incidents, understanding system exposure to threats, and verifying antivirus effectiveness. They help establish timelines of security events and identify potential compromises.
---
# Bitdefender Logs
> Source: https://kb.binalyze.ai/air/features/acquisition/supported-evidence/windows-collections-detail/bitdefender-logs.html
## Overview
**Evidence:** Bitdefender Logs
**Description:** Collect Bitdefender Logs
**Category:** Applications
**Platform:** windows
**Short Name:** btfndrls
**Is Parsed:** No
**Sent to Investigation Hub:** No
**Collect File(s):** Yes
## Background
Bitdefender is an enterprise-grade security solution that maintains detailed logs of endpoint protection, firewall activities, malware detections, and system events. Logs include XML-formatted system events, firewall logs, and database files containing threat intelligence.
## Data Collected
This collector gathers structured data about bitdefender logs.
## Collection Method
This collector gathers Bitdefender logs from multiple locations including Endpoint Security logs, Desktop profile logs, system XML files, firewall logs, and database files containing security event data.
## Forensic Value
Bitdefender logs are critical for investigating security incidents, tracking malware detections, analyzing firewall blocks, and understanding endpoint protection events. They provide comprehensive visibility into threats, network traffic controls, and security posture over time.
---
# Brave Bookmarks
> Source: https://kb.binalyze.ai/air/features/acquisition/supported-evidence/windows-collections-detail/brave-bookmarks.html
## Overview
**Evidence:** Brave Bookmarks
**Description:** Collect Brave Bookmarks
**Category:** Applications
**Platform:** windows
**Short Name:** bbkmrks
**Is Parsed:** Yes
**Sent to Investigation Hub:** Yes
**Collect File(s):** No
## Background
Browser bookmarks represent user-saved favorite websites and organizational folders. This data reveals frequently accessed sites, user interests, and potential indicators of reconnaissance, phishing targets, or suspicious infrastructure.
## Data Collected
This collector gathers structured data about brave bookmarks.
### Brave Bookmarks Data
| Field | Description | Example |
|-------|-------------|---------|
| `UserName` | User Name | Example value |
| `ProfileName` | Profile Name | Example value |
| `BrowserName` | Browser Name | Example value |
| `GUID` | GUID | Example value |
| `BookmarkID` | Bookmark ID | Example value |
| `Name` | Name | Example value |
| `Type` | Type | Example value |
| `URL` | URL | Example value |
| `ParentFolder` | Parent Folder | Example value |
| `DateAdded` | Date Added | 2023-10-15 14:30:25+03:00 |
| `DateLastUsed` | Date Last Used | 2023-10-15 14:30:25+03:00 |
| `DateModified` | Date Modified | 2023-10-15 14:30:25+03:00 |
## Collection Method
This collector parses the browser's Bookmarks file to extract saved URLs, folder structures, timestamps, and metadata.
## Forensic Value
Bookmark analysis identifies targeted websites, phishing pages, command-and-control servers, internal resources, and organizational reconnaissance patterns. Investigators can detect social engineering campaigns, credential harvesting attempts, and lateral movement preparation.
---
# Brave Browsing History
> Source: https://kb.binalyze.ai/air/features/acquisition/supported-evidence/windows-collections-detail/brave-browsing-history.html
## Overview
**Evidence:** Brave Browsing History
**Description:** Collect Visited URLs from Brave
**Category:** Applications
**Platform:** windows
**Short Name:** bhst
**Is Parsed:** Yes
**Sent to Investigation Hub:** Yes
**Collect File(s):** No
## Background
Browser history records all websites visited by users, including URLs, page titles, visit timestamps, visit counts, and transition types. This data is essential for reconstructing user activity, identifying malicious websites, and tracking lateral movement or reconnaissance activities.
## Data Collected
This collector gathers structured data about brave browsing history.
### Brave Browsing History Data
| Field | Description | Example |
|-------|-------------|---------|
| `AccessTime` | Access Time | 2023-10-15 14:30:25+03:00 |
| `AccessCount` | Access Count | 123 |
| `URL` | URL | Example value |
| `Browser` | Browser | Example value |
| `Title` | Title | Example value |
| `VisitDuration` | Visit Duration | Example value |
| `Referrer` | Referrer | Example value |
| `TypedCount` | Typed Count | 123 |
| `IsHidden` | Is Hidden | true |
| `TransitionType` | Transition Type | Example value |
| `VisitID` | Visit ID | 123 |
| `TransitionQualifiers` | Transition Qualifiers | Example value |
| `User` | User | Example value |
| `Profile` | Profile | Example value |
| `HistoryFilePath` | History File Path | Example value |
## Collection Method
This collector queries the browser's History database to extract visited URLs, timestamps, referrer information, and user interaction patterns.
## Forensic Value
Browsing history reveals phishing sites, malicious domains, command-and-control servers, data exfiltration targets, and reconnaissance activities. Analysts can identify compromised credentials, track attacker infrastructure, and correlate web activity with other security events to establish attack timelines.
---
# Brave Cookies
> Source: https://kb.binalyze.ai/air/features/acquisition/supported-evidence/windows-collections-detail/brave-cookies.html
## Overview
**Evidence:** Brave Cookies
**Description:** Collect Brave Cookies
**Category:** Applications
**Platform:** windows
**Short Name:** bcookies
**Is Parsed:** Yes
**Sent to Investigation Hub:** Yes
**Collect File(s):** No
## Background
Browser cookies store session tokens, authentication credentials, user preferences, and tracking data. This data is essential for understanding authenticated sessions, tracking user activity across websites, and identifying session hijacking or credential theft.
## Data Collected
This collector gathers structured data about brave cookies.
### Brave Cookies Data
| Field | Description | Example |
|-------|-------------|---------|
| `UserName` | User Name | Example value |
| `BrowserName` | Browser Name | Example value |
| `ProfileName` | Profile Name | Example value |
| `Domain` | Domain | Example value |
| `Name` | Name | Example value |
| `Path` | Path | Example value |
| `Value` | Value | Example value |
| `IsSecure` | Is Secure | 123 |
| `IsHTTPOnly` | Is HTTP Only | 123 |
| `HasExpires` | Has Expires | 123 |
| `IsPersistent` | Is Persistent | 123 |
| `Priority` | Priority | 123 |
| `SameSite` | Same Site | 123 |
| `SourcePort` | Source Port | 123 |
| `SourceScheme` | Source Scheme | 123 |
| `CreationTime` | Creation Time | 2023-10-15 14:30:25+03:00 |
| `ExpiresTime` | Expires Time | 2023-10-15 14:30:25+03:00 |
| `LastAccessTime` | Last Access Time | 2023-10-15 14:30:25+03:00 |
## Collection Method
This collector extracts cookies from the browser's Cookies database, including domain, name, value, path, expiration, and security flags.
## Forensic Value
Cookie analysis reveals active sessions, authentication tokens, persistent tracking identifiers, and potential session hijacking. Investigators can identify stolen credentials, unauthorized access, and cross-site tracking used for reconnaissance or targeting.
---
# Brave Downloads
> Source: https://kb.binalyze.ai/air/features/acquisition/supported-evidence/windows-collections-detail/brave-downloads.html
## Overview
**Evidence:** Brave Downloads
**Description:** Collect Brave Downloads
**Category:** Applications
**Platform:** windows
**Short Name:** bdwnlds
**Is Parsed:** Yes
**Sent to Investigation Hub:** Yes
**Collect File(s):** No
## Background
Browser download history records files downloaded by users, including file paths, timestamps, URLs, referrer information, and download status. This data is essential for tracking file acquisition, identifying potentially malicious downloads, and reconstructing user activity timelines.
## Data Collected
This collector gathers structured data about brave downloads.
### Brave Downloads Data
| Field | Description | Example |
|-------|-------------|---------|
| `UserName` | User Name | Example value |
| `Browser` | Browser | Example value |
| `ProfileName` | Profile Name | Example value |
| `URL` | URL | Example value |
| `TargetPath` | Target Path | Example value |
| `CurrentPath` | Current Path | Example value |
| `Referrer` | Referrer | Example value |
| `LastModified` | Last Modified | 2023-10-15 14:30:25+03:00 |
| `DangerType` | Danger Type | 123 |
| `Opened` | Opened | 123 |
| `TabURL` | Tab URL | Example value |
| `TabReferrerURL` | Tab Referrer URL | Example value |
| `StartTime` | Start Time | 2023-10-15 14:30:25+03:00 |
| `EndTime` | End Time | 2023-10-15 14:30:25+03:00 |
| `HistoryFilePath` | History File Path | Example value |
## Collection Method
This collector queries the browser's History database to extract download records, including file paths, download times, source URLs, and security flags.
## Forensic Value
Download history reveals malware delivery vectors, data exfiltration attempts, unauthorized software installation, and user interaction with suspicious websites. Analysts can identify downloaded malicious files, track attack chains, and correlate downloads with other security events.
---
# Brave Extensions
> Source: https://kb.binalyze.ai/air/features/acquisition/supported-evidence/windows-collections-detail/brave-extensions.html
## Overview
**Evidence:** Brave Extensions
**Description:** Collect Brave Extensions
**Category:** Applications
**Platform:** windows
**Short Name:** bext
**Is Parsed:** Yes
**Sent to Investigation Hub:** Yes
**Collect File(s):** No
## Data Collected
This collector gathers structured data about brave extensions.
---
# Brave Favicons
> Source: https://kb.binalyze.ai/air/features/acquisition/supported-evidence/windows-collections-detail/brave-favicons.html
## Overview
**Evidence:** Brave Favicons
**Description:** Collect Brave Favicons
**Category:** Applications
**Platform:** windows
**Short Name:** bfico
**Is Parsed:** Yes
**Sent to Investigation Hub:** Yes
**Collect File(s):** No
## Background
Browser favicons are cached website icons that provide visual history of visited sites. This data supplements browsing history by revealing sites accessed even if history was deleted.
## Data Collected
This collector gathers structured data about brave favicons.
### Brave Favicons Data
| Field | Description | Example |
|-------|-------------|---------|
| `ID` | ID | 123 |
| `UserName` | User Name | Example value |
| `BrowserName` | Browser Name | Example value |
| `Profile` | Profile | Example value |
| `URL` | URL | Example value |
| `IconType` | Icon Type | 123 |
| `Path` | Path | Example value |
## Collection Method
This collector queries the browser's Favicons database to extract cached website icons and associated URLs.
## Forensic Value
Favicon analysis can recover evidence of deleted browsing history, identify visited sites through icon fingerprinting, and correlate with other browser artifacts to establish comprehensive activity timelines.
---
# Brave Form History
> Source: https://kb.binalyze.ai/air/features/acquisition/supported-evidence/windows-collections-detail/brave-form-history.html
## Overview
**Evidence:** Brave Form History
**Description:** Collect Brave Form History
**Category:** Applications
**Platform:** windows
**Short Name:** bfh
**Is Parsed:** Yes
**Sent to Investigation Hub:** Yes
**Collect File(s):** No
## Background
Browser form history stores previously entered form data including search queries, usernames, and other input fields. This data reveals user search patterns, account information, and potential data leakage through autofill.
## Data Collected
This collector gathers structured data about brave form history.
### Brave Form History Data
| Field | Description | Example |
|-------|-------------|---------|
| `UserName` | User Name | Example value |
| `BrowserName` | Browser Name | Example value |
| `Name` | Name | Example value |
| `Value` | Value | Example value |
| `ValueLower` | Value Lower | Example value |
| `Count` | Count | 123 |
| `Profile` | Profile | Example value |
| `Path` | Path | Example value |
| `DateCreated` | Date Created | 2023-10-15 14:30:25+03:00 |
| `DateLastUsed` | Date Last Used | 2023-10-15 14:30:25+03:00 |
## Collection Method
This collector queries the browser's form history database to extract saved form field data, search queries, and associated timestamps.
## Forensic Value
Form history exposes reconnaissance activities, credential enumeration attempts, search queries revealing attacker intent, and potentially sensitive information entered into web forms. Analysts can identify data exfiltration, account compromise indicators, and targeted search patterns.
---
# Brave Local Storage
> Source: https://kb.binalyze.ai/air/features/acquisition/supported-evidence/windows-collections-detail/brave-local-storage.html
## Overview
**Evidence:** Brave Local Storage
**Description:** Collect Brave Local Storage
**Category:** Applications
**Platform:** windows
**Short Name:** bls
**Is Parsed:** Yes
**Sent to Investigation Hub:** Yes
**Collect File(s):** No
## Background
Browser local storage contains persistent key-value data stored by websites. This data includes user preferences, session state, cached data, and potentially authentication tokens or sensitive information.
## Data Collected
This collector gathers structured data about brave local storage.
### Brave Local Storage Data
| Field | Description | Example |
|-------|-------------|---------|
| `UserName` | User Name | Example value |
| `ProfileName` | Profile Name | Example value |
| `BrowserName` | Browser Name | Example value |
| `Key` | Key | Example value |
| `Value` | Value | Example value |
| `Path` | Path | Example value |
## Collection Method
This collector extracts local storage data from browser storage databases and files.
## Forensic Value
Local storage analysis reveals stored credentials, session tokens, tracking identifiers, and application state that can indicate compromised accounts, persistent tracking, or malicious website activity. Analysts can identify credential theft, session hijacking, and data exfiltration attempts.
---
# Brave Login Data
> Source: https://kb.binalyze.ai/air/features/acquisition/supported-evidence/windows-collections-detail/brave-login-data.html
## Overview
**Evidence:** Brave Login Data
**Description:** Collect Brave Login Data
**Category:** Applications
**Platform:** windows
**Short Name:** blgd
**Is Parsed:** Yes
**Sent to Investigation Hub:** Yes
**Collect File(s):** No
## Background
Browser login data stores saved passwords and credential information. This data is critical for identifying stored credentials, password reuse patterns, and potential credential theft targets.
## Data Collected
This collector gathers structured data about brave login data.
### Brave Login Data Data
| Field | Description | Example |
|-------|-------------|---------|
| `ID` | ID | 123 |
| `UserName` | User Name | Example value |
| `BrowserName` | Browser Name | Example value |
| `OriginURL` | Origin URL | Example value |
| `SignonRealm` | Signon Realm | Example value |
| `BlacklistedByUser` | Blacklisted By User | 123 |
| `Scheme` | Scheme | Example value |
| `PasswordType` | Password Type | Example value |
| `TimesUsed` | Times Used | 123 |
| `Profile` | Profile | Example value |
| `Path` | Path | Example value |
| `DateCreated` | Date Created | 2023-10-15 14:30:25+03:00 |
| `DateLastUsed` | Date Last Used | 2023-10-15 14:30:25+03:00 |
## Collection Method
This collector extracts saved credentials from the browser's Login Data database, including URLs, usernames, and encrypted passwords.
## Forensic Value
Login data analysis reveals stored credentials, password reuse across services, targeted accounts, and potential credential harvesting. Investigators can identify compromised accounts, credential theft attempts, and unauthorized access to saved credentials by malware or attackers.
---
# Brave Sessions
> Source: https://kb.binalyze.ai/air/features/acquisition/supported-evidence/windows-collections-detail/brave-sessions.html
## Overview
**Evidence:** Brave Sessions
**Description:** Collect Brave Sessions
**Category:** Applications
**Platform:** windows
**Short Name:** brvss
**Is Parsed:** Yes
**Sent to Investigation Hub:** Yes
**Collect File(s):** No
## Background
Browser sessions maintain active tab state, cookies, and authentication context. This data reveals currently active user sessions, open websites, and authenticated connections at the time of collection.
## Data Collected
This collector gathers structured data about brave sessions.
### Brave Sessions Data
| Field | Description | Example |
|-------|-------------|---------|
| `ID` | ID | 123 |
| `WindowID` | Window ID | 123 |
| `Active` | Active | true |
| `Url` | Url | Example value |
| `Title` | Title | Example value |
| `Deleted` | Deleted | true |
| `Group` | Group | Example value |
| `History` | History | [] |
| `BrowserName` | Browser Name | Example value |
## Collection Method
This collector captures browser session data including active tabs, session cookies, and authentication state.
## Forensic Value
Session analysis identifies active compromises, authenticated sessions to malicious sites, concurrent suspicious activities, and real-time indicators of ongoing attacks. Analysts can detect active C2 connections, authenticated malware communications, and live attacker sessions.
---
# Brave Thumbnails
> Source: https://kb.binalyze.ai/air/features/acquisition/supported-evidence/windows-collections-detail/brave-thumbnails.html
## Overview
**Evidence:** Brave Thumbnails
**Description:** Collect Brave Thumbnails
**Category:** Applications
**Platform:** windows
**Short Name:** bthmb
**Is Parsed:** Yes
**Sent to Investigation Hub:** Yes
**Collect File(s):** No
## Background
Browser thumbnails are cached preview images of visited websites. This visual data supplements browsing history by providing screenshots of accessed pages, useful for recovering deleted history and identifying visited content.
## Data Collected
This collector gathers structured data about brave thumbnails.
### Brave Thumbnails Data
| Field | Description | Example |
|-------|-------------|---------|
| `UserName` | User Name | Example value |
| `Browser` | Browser | Example value |
| `URL` | URL | Example value |
| `URLRank` | URL Rank | 123 |
| `Title` | Title | Example value |
| `Profile` | Profile | Example value |
| `Path` | Path | Example value |
## Collection Method
This collector extracts cached thumbnail images from browser storage.
## Forensic Value
Thumbnail analysis provides visual evidence of visited websites, can recover evidence after history deletion, and helps identify phishing pages, malicious sites, or sensitive internal resources accessed by users through visual inspection.
---
# Brave User Profiles
> Source: https://kb.binalyze.ai/air/features/acquisition/supported-evidence/windows-collections-detail/brave-user-profiles.html
## Overview
**Evidence:** Brave User Profiles
**Description:** Collect Brave User Profiles
**Category:** Applications
**Platform:** windows
**Short Name:** bprfls
**Is Parsed:** Yes
**Sent to Investigation Hub:** Yes
**Collect File(s):** No
## Background
Browser user profiles store per-user browser configurations, extensions, settings, and data segregation. This data reveals multiple user accounts, profile switching patterns, and user-specific browsing behavior.
## Data Collected
This collector gathers structured data about brave user profiles.
### Brave User Profiles Data
| Field | Description | Example |
|-------|-------------|---------|
| `EndpointUserName` | Endpoint User Name | Example value |
| `Profile` | Profile | Example value |
| `ProfileUserName` | Profile User Name | Example value |
| `BrowserName` | Browser Name | Example value |
| `BackgroundApps` | Background Apps | true |
| `GoogleAccountGivenName` | Google Account Given Name | Example value |
| `GoogleAccountID` | Google Account ID | Example value |
| `GoogleAccountName` | Google Account Name | Example value |
| `PictureFileName` | Picture File Name | Example value |
| `LastDownloadedPictureURL` | Last Downloaded Picture URL | Example value |
| `HostedDomain` | Hosted Domain | Example value |
| `IsConsentedPrimaryAccount` | Is Consented Primary Account | true |
| `IsEphemeral` | Is Ephemeral | true |
## Collection Method
This collector enumerates browser user profiles and extracts profile metadata, configurations, and associated data paths.
## Forensic Value
Profile analysis identifies multiple user accounts, profile-specific extensions and configurations, shared device usage patterns, and potential privilege escalation or lateral movement using different browser profiles. Investigators can correlate activity across profiles and identify unauthorized profile creation.
---
# Brave Web Storage
> Source: https://kb.binalyze.ai/air/features/acquisition/supported-evidence/windows-collections-detail/brave-web-storage.html
## Overview
**Evidence:** Brave Web Storage
**Description:** Collect Brave Web Storage
**Category:** Applications
**Platform:** windows
**Short Name:** bws
**Is Parsed:** Yes
**Sent to Investigation Hub:** Yes
**Collect File(s):** No
## Background
Browser web storage includes both local and session storage used by websites to store client-side data. This data can contain application state, user preferences, cached content, and potentially sensitive information.
## Data Collected
This collector gathers structured data about brave web storage.
### Brave Web Storage Data
| Field | Description | Example |
|-------|-------------|---------|
| `UserName` | User Name | Example value |
| `ProfileName` | Profile Name | Example value |
| `BrowserName` | Browser Name | Example value |
| `Key` | Key | Example value |
| `Value` | Value | Example value |
| `Path` | Path | Example value |
## Collection Method
This collector extracts web storage data from browser storage locations including local storage and session storage.
## Forensic Value
Web storage analysis reveals cached application data, stored credentials, session information, and potential data exfiltration staging. Analysts can identify malicious website activity, stored authentication tokens, tracking identifiers, and sensitive data cached by compromised web applications.
---
# Carbon Black Logs
> Source: https://kb.binalyze.ai/air/features/acquisition/supported-evidence/windows-collections-detail/carbon-black-logs.html
## Overview
**Evidence:** Carbon Black Logs
**Description:** Collect Carbon Black Logs
**Category:** Applications
**Platform:** windows
**Short Name:** crbnl
**Is Parsed:** No
**Sent to Investigation Hub:** No
**Collect File(s):** Yes
## Background
Carbon Black (now VMware Carbon Black) is an enterprise EDR solution that logs endpoint activities, threat detections, behavioral analysis, and AMSI (Antimalware Scan Interface) events for comprehensive threat visibility.
## Data Collected
This collector gathers structured data about carbon black logs.
## Collection Method
This collector gathers Carbon Black log files including general activity logs and AMSI event logs that capture script-based threat detections from the ProgramData directory.
## Forensic Value
Carbon Black logs are essential for EDR investigations, providing detailed process execution, network connections, file modifications, and behavioral threat detections. AMSI logs reveal script-based attacks including PowerShell and VBScript exploits.
---
# Clipboard
> Source: https://kb.binalyze.ai/air/features/acquisition/supported-evidence/windows-collections-detail/clipboard.html
## Overview
**Evidence:** Clipboard
**Description:** Collect Clipboard Contents
**Category:**
**Platform:** windows
**Short Name:** clp
**Is Parsed:** No
**Sent to Investigation Hub:** Yes
**Collect File(s):** No
## Background
The Windows clipboard is a system-wide buffer that temporarily stores data during cut, copy, and paste operations. Applications can place data on the clipboard in multiple formats simultaneously (e.g., text, HTML, images, files).
Clipboard contents can provide valuable forensic evidence about user activity, including copied passwords, URLs, file paths, images, and other sensitive data that was recently copied or cut.
## Data Collected
This collector gathers structured data about clipboard.
### Clipboard Data
| Field | Description | Example |
|-------|-------------|---------|
| `FormatName` | Clipboard format type | CF_UNICODETEXT |
| `FormatID` | Numeric format identifier | 13 |
| `FilePath` | Path to saved clipboard data | Clipboard/1.CF_UNICODETEXT(13).txt |
| `FileSize` | Size of clipboard data | 256 |
## Collection Method
This collector:
- Opens the system clipboard
- Enumerates all available clipboard formats
- Retrieves data for each format
- Saves each format to a separate file with appropriate extension
Supported formats include:
- Text formats (CF_TEXT, CF_UNICODETEXT, CF_OEMTEXT)
- Image formats (CF_BITMAP, CF_DIB, CF_DIBV5, CF_TIFF)
- File lists (CF_HDROP)
- Custom application formats
## Forensic Value
Clipboard contents can reveal critical evidence about user actions immediately before system acquisition. Investigators can recover copied passwords, URLs visited, file paths accessed, sensitive document excerpts, and data prepared for exfiltration. This evidence is particularly valuable in data theft investigations, insider threat cases, and scenarios involving credential theft.
---
# Clipboard History
> Source: https://kb.binalyze.ai/air/features/acquisition/supported-evidence/windows-collections-detail/clipboard-history.html
## Overview
**Evidence:** Clipboard History
**Description:** Parse Clipboard History from ActivitiesCache.db
**Category:** System
**Platform:** windows
**Short Name:** clphst
**Is Parsed:** Yes
**Sent to Investigation Hub:** Yes
**Collect File(s):** Yes
## Background
Windows Clipboard History stores clipboard entries in ActivitiesCache.db when Clipboard History is enabled (Windows 10 1809 and later). This is distinct from the live Clipboard collector, which captures current clipboard contents. History records reveal copied text and copy or paste operations across applications over time.
## Data Collected
This collector gathers structured clipboard history and copy/paste activity, including content, content format, source application, timestamps, and related activity identifiers. Results are recorded in `clipboard_history` and `clipboard_activity`.
## Collection Method
This collector copies ActivitiesCache.db from user profiles, queries clipboard entries, decodes clipboard payloads, and records structured fields. Companion database files are collected with the parsed results.
## Forensic Value
Clipboard history can reveal sensitive data that users copied, including passwords, credentials, and confidential text. Copy and paste tracking shows data movement between applications, which is critical for data exfiltration investigations.
---
# Chrome Bookmarks
> Source: https://kb.binalyze.ai/air/features/acquisition/supported-evidence/windows-collections-detail/chrome-bookmarks.html
## Overview
**Evidence:** Chrome Bookmarks
**Description:** Collect Chrome Bookmarks
**Category:** Applications
**Platform:** windows
**Short Name:** cbkmrks
**Is Parsed:** Yes
**Sent to Investigation Hub:** Yes
**Collect File(s):** No
## Background
Browser bookmarks represent user-saved favorite websites and organizational folders. This data reveals frequently accessed sites, user interests, and potential indicators of reconnaissance, phishing targets, or suspicious infrastructure.
## Data Collected
This collector gathers structured data about chrome bookmarks.
### Chrome Bookmarks Data
| Field | Description | Example |
|-------|-------------|---------|
| `UserName` | User Name | Example value |
| `ProfileName` | Profile Name | Example value |
| `BrowserName` | Browser Name | Example value |
| `GUID` | GUID | Example value |
| `BookmarkID` | Bookmark ID | Example value |
| `Name` | Name | Example value |
| `Type` | Type | Example value |
| `URL` | URL | Example value |
| `ParentFolder` | Parent Folder | Example value |
| `DateAdded` | Date Added | 2023-10-15 14:30:25+03:00 |
| `DateLastUsed` | Date Last Used | 2023-10-15 14:30:25+03:00 |
| `DateModified` | Date Modified | 2023-10-15 14:30:25+03:00 |
## Collection Method
This collector parses the browser's Bookmarks file to extract saved URLs, folder structures, timestamps, and metadata.
## Forensic Value
Bookmark analysis identifies targeted websites, phishing pages, command-and-control servers, internal resources, and organizational reconnaissance patterns. Investigators can detect social engineering campaigns, credential harvesting attempts, and lateral movement preparation.
---
# Chrome Browsing History
> Source: https://kb.binalyze.ai/air/features/acquisition/supported-evidence/windows-collections-detail/chrome-browsing-history.html
## Overview
**Evidence:** Chrome Browsing History
**Description:** Collect visited URLs from Google Chrome
**Category:** Applications
**Platform:** windows
**Short Name:** chst
**Is Parsed:** Yes
**Sent to Investigation Hub:** Yes
**Collect File(s):** No
## Background
Browser history records all websites visited by users, including URLs, page titles, visit timestamps, visit counts, and transition types. This data is essential for reconstructing user activity, identifying malicious websites, and tracking lateral movement or reconnaissance activities.
## Data Collected
This collector gathers structured data about chrome browsing history.
### Chrome Browsing History Data
| Field | Description | Example |
|-------|-------------|---------|
| `AccessTime` | Access Time | 2023-10-15 14:30:25+03:00 |
| `AccessCount` | Access Count | 123 |
| `URL` | URL | Example value |
| `Browser` | Browser | Example value |
| `Title` | Title | Example value |
| `VisitDuration` | Visit Duration | Example value |
| `Referrer` | Referrer | Example value |
| `TypedCount` | Typed Count | 123 |
| `IsHidden` | Is Hidden | true |
| `TransitionType` | Transition Type | Example value |
| `VisitID` | Visit ID | 123 |
| `TransitionQualifiers` | Transition Qualifiers | Example value |
| `User` | User | Example value |
| `Profile` | Profile | Example value |
| `HistoryFilePath` | History File Path | Example value |
## Collection Method
This collector queries the browser's History database to extract visited URLs, timestamps, referrer information, and user interaction patterns.
## Forensic Value
Browsing history reveals phishing sites, malicious domains, command-and-control servers, data exfiltration targets, and reconnaissance activities. Analysts can identify compromised credentials, track attacker infrastructure, and correlate web activity with other security events to establish attack timelines.
---
# Chrome Cookies
> Source: https://kb.binalyze.ai/air/features/acquisition/supported-evidence/windows-collections-detail/chrome-cookies.html
## Overview
**Evidence:** Chrome Cookies
**Description:** Collect Chrome Cookies
**Category:** Applications
**Platform:** windows
**Short Name:** ccookies
**Is Parsed:** Yes
**Sent to Investigation Hub:** Yes
**Collect File(s):** No
## Background
Browser cookies store session tokens, authentication credentials, user preferences, and tracking data. This data is essential for understanding authenticated sessions, tracking user activity across websites, and identifying session hijacking or credential theft.
## Data Collected
This collector gathers structured data about chrome cookies.
### Chrome Cookies Data
| Field | Description | Example |
|-------|-------------|---------|
| `UserName` | User Name | Example value |
| `BrowserName` | Browser Name | Example value |
| `ProfileName` | Profile Name | Example value |
| `Domain` | Domain | Example value |
| `Name` | Name | Example value |
| `Path` | Path | Example value |
| `Value` | Value | Example value |
| `IsSecure` | Is Secure | 123 |
| `IsHTTPOnly` | Is HTTP Only | 123 |
| `HasExpires` | Has Expires | 123 |
| `IsPersistent` | Is Persistent | 123 |
| `Priority` | Priority | 123 |
| `SameSite` | Same Site | 123 |
| `SourcePort` | Source Port | 123 |
| `SourceScheme` | Source Scheme | 123 |
| `CreationTime` | Creation Time | 2023-10-15 14:30:25+03:00 |
| `ExpiresTime` | Expires Time | 2023-10-15 14:30:25+03:00 |
| `LastAccessTime` | Last Access Time | 2023-10-15 14:30:25+03:00 |
## Collection Method
This collector extracts cookies from the browser's Cookies database, including domain, name, value, path, expiration, and security flags.
## Forensic Value
Cookie analysis reveals active sessions, authentication tokens, persistent tracking identifiers, and potential session hijacking. Investigators can identify stolen credentials, unauthorized access, and cross-site tracking used for reconnaissance or targeting.
---
# Chrome Downloads
> Source: https://kb.binalyze.ai/air/features/acquisition/supported-evidence/windows-collections-detail/chrome-downloads.html
## Overview
**Evidence:** Chrome Downloads
**Description:** Collect Chrome Downloads
**Category:** Applications
**Platform:** windows
**Short Name:** cdwnlds
**Is Parsed:** Yes
**Sent to Investigation Hub:** Yes
**Collect File(s):** No
## Background
Browser download history records files downloaded by users, including file paths, timestamps, URLs, referrer information, and download status. This data is essential for tracking file acquisition, identifying potentially malicious downloads, and reconstructing user activity timelines.
## Data Collected
This collector gathers structured data about chrome downloads.
### Chrome Downloads Data
| Field | Description | Example |
|-------|-------------|---------|
| `UserName` | User Name | Example value |
| `Browser` | Browser | Example value |
| `ProfileName` | Profile Name | Example value |
| `URL` | URL | Example value |
| `TargetPath` | Target Path | Example value |
| `CurrentPath` | Current Path | Example value |
| `Referrer` | Referrer | Example value |
| `LastModified` | Last Modified | 2023-10-15 14:30:25+03:00 |
| `DangerType` | Danger Type | 123 |
| `Opened` | Opened | 123 |
| `TabURL` | Tab URL | Example value |
| `TabReferrerURL` | Tab Referrer URL | Example value |
| `StartTime` | Start Time | 2023-10-15 14:30:25+03:00 |
| `EndTime` | End Time | 2023-10-15 14:30:25+03:00 |
| `HistoryFilePath` | History File Path | Example value |
## Collection Method
This collector queries the browser's History database to extract download records, including file paths, download times, source URLs, and security flags.
## Forensic Value
Download history reveals malware delivery vectors, data exfiltration attempts, unauthorized software installation, and user interaction with suspicious websites. Analysts can identify downloaded malicious files, track attack chains, and correlate downloads with other security events.
---
# Chrome Extensions
> Source: https://kb.binalyze.ai/air/features/acquisition/supported-evidence/windows-collections-detail/chrome-extensions.html
## Overview
**Evidence:** Chrome Extensions
**Description:** Collect Chrome Extensions
**Category:** Applications
**Platform:** windows
**Short Name:** chrext
**Is Parsed:** Yes
**Sent to Investigation Hub:** Yes
**Collect File(s):** No
## Data Collected
This collector gathers structured data about chrome extensions.
---
# Chrome Favicons
> Source: https://kb.binalyze.ai/air/features/acquisition/supported-evidence/windows-collections-detail/chrome-favicons.html
## Overview
**Evidence:** Chrome Favicons
**Description:** Collect Chrome Favicons
**Category:** Applications
**Platform:** windows
**Short Name:** cfico
**Is Parsed:** Yes
**Sent to Investigation Hub:** Yes
**Collect File(s):** No
## Background
Browser favicons are cached website icons that provide visual history of visited sites. This data supplements browsing history by revealing sites accessed even if history was deleted.
## Data Collected
This collector gathers structured data about chrome favicons.
### Chrome Favicons Data
| Field | Description | Example |
|-------|-------------|---------|
| `ID` | ID | 123 |
| `UserName` | User Name | Example value |
| `BrowserName` | Browser Name | Example value |
| `Profile` | Profile | Example value |
| `URL` | URL | Example value |
| `IconType` | Icon Type | 123 |
| `Path` | Path | Example value |
## Collection Method
This collector queries the browser's Favicons database to extract cached website icons and associated URLs.
## Forensic Value
Favicon analysis can recover evidence of deleted browsing history, identify visited sites through icon fingerprinting, and correlate with other browser artifacts to establish comprehensive activity timelines.
---
# Chrome Form History
> Source: https://kb.binalyze.ai/air/features/acquisition/supported-evidence/windows-collections-detail/chrome-form-history.html
## Overview
**Evidence:** Chrome Form History
**Description:** Collect Chrome Form History
**Category:** Applications
**Platform:** windows
**Short Name:** cfh
**Is Parsed:** Yes
**Sent to Investigation Hub:** Yes
**Collect File(s):** No
## Background
Browser form history stores previously entered form data including search queries, usernames, and other input fields. This data reveals user search patterns, account information, and potential data leakage through autofill.
## Data Collected
This collector gathers structured data about chrome form history.
### Chrome Form History Data
| Field | Description | Example |
|-------|-------------|---------|
| `UserName` | User Name | Example value |
| `BrowserName` | Browser Name | Example value |
| `Name` | Name | Example value |
| `Value` | Value | Example value |
| `ValueLower` | Value Lower | Example value |
| `Count` | Count | 123 |
| `Profile` | Profile | Example value |
| `Path` | Path | Example value |
| `DateCreated` | Date Created | 2023-10-15 14:30:25+03:00 |
| `DateLastUsed` | Date Last Used | 2023-10-15 14:30:25+03:00 |
## Collection Method
This collector queries the browser's form history database to extract saved form field data, search queries, and associated timestamps.
## Forensic Value
Form history exposes reconnaissance activities, credential enumeration attempts, search queries revealing attacker intent, and potentially sensitive information entered into web forms. Analysts can identify data exfiltration, account compromise indicators, and targeted search patterns.
---
# Chrome Local Storage
> Source: https://kb.binalyze.ai/air/features/acquisition/supported-evidence/windows-collections-detail/chrome-local-storage.html
## Overview
**Evidence:** Chrome Local Storage
**Description:** Collect Chrome Local Storage
**Category:** Applications
**Platform:** windows
**Short Name:** chrls
**Is Parsed:** Yes
**Sent to Investigation Hub:** Yes
**Collect File(s):** No
## Background
Browser local storage contains persistent key-value data stored by websites. This data includes user preferences, session state, cached data, and potentially authentication tokens or sensitive information.
## Data Collected
This collector gathers structured data about chrome local storage.
### Chrome Local Storage Data
| Field | Description | Example |
|-------|-------------|---------|
| `UserName` | User Name | Example value |
| `ProfileName` | Profile Name | Example value |
| `BrowserName` | Browser Name | Example value |
| `Key` | Key | Example value |
| `Value` | Value | Example value |
| `Path` | Path | Example value |
## Collection Method
This collector extracts local storage data from browser storage databases and files.
## Forensic Value
Local storage analysis reveals stored credentials, session tokens, tracking identifiers, and application state that can indicate compromised accounts, persistent tracking, or malicious website activity. Analysts can identify credential theft, session hijacking, and data exfiltration attempts.
---
# Chrome Login Data
> Source: https://kb.binalyze.ai/air/features/acquisition/supported-evidence/windows-collections-detail/chrome-login-data.html
## Overview
**Evidence:** Chrome Login Data
**Description:** Collect Chrome Login Data
**Category:** Applications
**Platform:** windows
**Short Name:** chrlgd
**Is Parsed:** Yes
**Sent to Investigation Hub:** Yes
**Collect File(s):** No
## Background
Browser login data stores saved passwords and credential information. This data is critical for identifying stored credentials, password reuse patterns, and potential credential theft targets.
## Data Collected
This collector gathers structured data about chrome login data.
### Chrome Login Data Data
| Field | Description | Example |
|-------|-------------|---------|
| `ID` | ID | 123 |
| `UserName` | User Name | Example value |
| `BrowserName` | Browser Name | Example value |
| `OriginURL` | Origin URL | Example value |
| `SignonRealm` | Signon Realm | Example value |
| `BlacklistedByUser` | Blacklisted By User | 123 |
| `Scheme` | Scheme | Example value |
| `PasswordType` | Password Type | Example value |
| `TimesUsed` | Times Used | 123 |
| `Profile` | Profile | Example value |
| `Path` | Path | Example value |
| `DateCreated` | Date Created | 2023-10-15 14:30:25+03:00 |
| `DateLastUsed` | Date Last Used | 2023-10-15 14:30:25+03:00 |
## Collection Method
This collector extracts saved credentials from the browser's Login Data database, including URLs, usernames, and encrypted passwords.
## Forensic Value
Login data analysis reveals stored credentials, password reuse across services, targeted accounts, and potential credential harvesting. Investigators can identify compromised accounts, credential theft attempts, and unauthorized access to saved credentials by malware or attackers.
---
# Chrome Sessions
> Source: https://kb.binalyze.ai/air/features/acquisition/supported-evidence/windows-collections-detail/chrome-sessions.html
## Overview
**Evidence:** Chrome Sessions
**Description:** Collect Chrome Sessions
**Category:** Applications
**Platform:** windows
**Short Name:** chrss
**Is Parsed:** Yes
**Sent to Investigation Hub:** Yes
**Collect File(s):** No
## Background
Browser sessions maintain active tab state, cookies, and authentication context. This data reveals currently active user sessions, open websites, and authenticated connections at the time of collection.
## Data Collected
This collector gathers structured data about chrome sessions.
### Chrome Sessions Data
| Field | Description | Example |
|-------|-------------|---------|
| `ID` | ID | 123 |
| `WindowID` | Window ID | 123 |
| `Active` | Active | true |
| `Url` | Url | Example value |
| `Title` | Title | Example value |
| `Deleted` | Deleted | true |
| `Group` | Group | Example value |
| `History` | History | [] |
| `BrowserName` | Browser Name | Example value |
## Collection Method
This collector captures browser session data including active tabs, session cookies, and authentication state.
## Forensic Value
Session analysis identifies active compromises, authenticated sessions to malicious sites, concurrent suspicious activities, and real-time indicators of ongoing attacks. Analysts can detect active C2 connections, authenticated malware communications, and live attacker sessions.
---
# Chrome Thumbnails
> Source: https://kb.binalyze.ai/air/features/acquisition/supported-evidence/windows-collections-detail/chrome-thumbnails.html
## Overview
**Evidence:** Chrome Thumbnails
**Description:** Collect Chrome Thumbnails
**Category:** Applications
**Platform:** windows
**Short Name:** cthmb
**Is Parsed:** Yes
**Sent to Investigation Hub:** Yes
**Collect File(s):** No
## Background
Browser thumbnails are cached preview images of visited websites. This visual data supplements browsing history by providing screenshots of accessed pages, useful for recovering deleted history and identifying visited content.
## Data Collected
This collector gathers structured data about chrome thumbnails.
### Chrome Thumbnails Data
| Field | Description | Example |
|-------|-------------|---------|
| `UserName` | User Name | Example value |
| `Browser` | Browser | Example value |
| `URL` | URL | Example value |
| `URLRank` | URL Rank | 123 |
| `Title` | Title | Example value |
| `Profile` | Profile | Example value |
| `Path` | Path | Example value |
## Collection Method
This collector extracts cached thumbnail images from browser storage.
## Forensic Value
Thumbnail analysis provides visual evidence of visited websites, can recover evidence after history deletion, and helps identify phishing pages, malicious sites, or sensitive internal resources accessed by users through visual inspection.
---
# Chrome User Profiles
> Source: https://kb.binalyze.ai/air/features/acquisition/supported-evidence/windows-collections-detail/chrome-user-profiles.html
## Overview
**Evidence:** Chrome User Profiles
**Description:** Collect Chrome User Profiles
**Category:** Applications
**Platform:** windows
**Short Name:** cprfls
**Is Parsed:** Yes
**Sent to Investigation Hub:** Yes
**Collect File(s):** No
## Background
Browser user profiles store per-user browser configurations, extensions, settings, and data segregation. This data reveals multiple user accounts, profile switching patterns, and user-specific browsing behavior.
## Data Collected
This collector gathers structured data about chrome user profiles.
### Chrome User Profiles Data
| Field | Description | Example |
|-------|-------------|---------|
| `EndpointUserName` | Endpoint User Name | Example value |
| `Profile` | Profile | Example value |
| `ProfileUserName` | Profile User Name | Example value |
| `BrowserName` | Browser Name | Example value |
| `BackgroundApps` | Background Apps | true |
| `GoogleAccountGivenName` | Google Account Given Name | Example value |
| `GoogleAccountID` | Google Account ID | Example value |
| `GoogleAccountName` | Google Account Name | Example value |
| `PictureFileName` | Picture File Name | Example value |
| `LastDownloadedPictureURL` | Last Downloaded Picture URL | Example value |
| `HostedDomain` | Hosted Domain | Example value |
| `IsConsentedPrimaryAccount` | Is Consented Primary Account | true |
| `IsEphemeral` | Is Ephemeral | true |
## Collection Method
This collector enumerates browser user profiles and extracts profile metadata, configurations, and associated data paths.
## Forensic Value
Profile analysis identifies multiple user accounts, profile-specific extensions and configurations, shared device usage patterns, and potential privilege escalation or lateral movement using different browser profiles. Investigators can correlate activity across profiles and identify unauthorized profile creation.
---
# Chrome Web Storage
> Source: https://kb.binalyze.ai/air/features/acquisition/supported-evidence/windows-collections-detail/chrome-web-storage.html
## Overview
**Evidence:** Chrome Web Storage
**Description:** Collect Chrome Web Storage
**Category:** Applications
**Platform:** windows
**Short Name:** cws
**Is Parsed:** Yes
**Sent to Investigation Hub:** Yes
**Collect File(s):** No
## Background
Browser web storage includes both local and session storage used by websites to store client-side data. This data can contain application state, user preferences, cached content, and potentially sensitive information.
## Data Collected
This collector gathers structured data about chrome web storage.
### Chrome Web Storage Data
| Field | Description | Example |
|-------|-------------|---------|
| `UserName` | User Name | Example value |
| `ProfileName` | Profile Name | Example value |
| `BrowserName` | Browser Name | Example value |
| `Key` | Key | Example value |
| `Value` | Value | Example value |
| `Path` | Path | Example value |
## Collection Method
This collector extracts web storage data from browser storage locations including local storage and session storage.
## Forensic Value
Web storage analysis reveals cached application data, stored credentials, session information, and potential data exfiltration staging. Analysts can identify malicious website activity, stored authentication tokens, tracking identifiers, and sensitive data cached by compromised web applications.
---
# CIDSizeMRU
> Source: https://kb.binalyze.ai/air/features/acquisition/supported-evidence/windows-collections-detail/cidsizemru.html
## Overview
**Evidence:** CIDSizeMRU
**Description:** Enumerate CIDSizeMRU
**Category:** System
**Platform:** windows
**Short Name:** cidsizemru
**Is Parsed:** Yes
**Sent to Investigation Hub:** Yes
**Collect File(s):** No
## Background
The CIDSizeMRU registry key tracks file names associated with window size and position preferences in common file dialogs. When users open or save files through applications, Windows remembers the dialog window size and position for each file.
This artifact can provide evidence of file names users have interacted with through file dialogs.
## Data Collected
This collector gathers structured data about cidsizemru.
### CIDSizeMRU Data
| Field | Description | Example |
|-------|-------------|---------|
| `KeyPath` | Registry key path | Software\Microsoft\Windows\CurrentVersion\Explorer\ComDlg32\CIDSizeMRU |
| `LastWriteTime` | Registry key last write time | 2023-10-15T14:30:00 |
| `Value` | MRU value name | 0 |
| `Username` | User account name | user |
| `FileName` | File name | confidential-report.docx |
| `MRUPosition` | Position in MRU list | 0 |
| `RegPath` | Path to registry hive | Registry/ntuser.dat |
## Collection Method
This collector:
- Collects user registry hives (ntuser.dat)
- Searches for: `Software\Microsoft\Windows\CurrentVersion\Explorer\ComDlg32\CIDSizeMRU`
- Parses MRUListEx binary data
- Extracts file name strings
- Orders by MRU position
## Forensic Value
CIDSizeMRU provides additional evidence of file interaction through dialogs. Investigators use this data to identify files accessed through dialogs, corroborate other file access evidence, detect access to sensitive file names, and supplement OpenSavePidlMRU analysis.
---
# CLR
> Source: https://kb.binalyze.ai/air/features/acquisition/supported-evidence/windows-collections-detail/clr.html
## Overview
**Evidence:** CLR
**Description:** Collect CLR Log
**Category:** System
**Platform:** windows
**Short Name:** clr
**Is Parsed:** No
**Sent to Investigation Hub:** Yes
**Collect File(s):** Yes
## Background
The .NET Common Language Runtime (CLR) generates diagnostic logs, crash dumps, and error reports for .NET applications. These logs are stored in user-specific directories and contain information about .NET application crashes, exceptions, and runtime errors.
CLR logs can provide evidence of .NET application failures, crashes, and error conditions that may be relevant to incident investigation or malware analysis.
## Data Collected
This collector gathers structured data about clr.
### CLR Data
| Field | Description | Example |
|-------|-------------|---------|
| `Name` | Artifact name | CLR Log |
| `Type` | Folder | Folder |
| `SourcePath` | Original folder path | C:\Users\user\AppData\Local\Microsoft\CLRv4.0 |
| `Path` | Relative path in evidence | Other/CLRv4.0 |
## Collection Method
This collector collects CLR log directories:
- `Users\*\AppData\Local\Microsoft\CLR*`
All directories matching the CLR* pattern are collected recursively.
## Forensic Value
CLR logs can reveal .NET application errors and crashes that may indicate malware behavior or application exploitation. Investigators use this data to analyze .NET application failures, detect malicious .NET assemblies, investigate application crashes, and identify .NET-based malware activity.
---
# Cisco AMP Logs
> Source: https://kb.binalyze.ai/air/features/acquisition/supported-evidence/windows-collections-detail/cisco-amp-logs.html
## Overview
**Evidence:** Cisco AMP Logs
**Description:** Collect Cisco AMP Logs
**Category:** Applications
**Platform:** windows
**Short Name:** cscmpl
**Is Parsed:** No
**Sent to Investigation Hub:** No
**Collect File(s):** Yes
## Background
Cisco AMP (Advanced Malware Protection) for Endpoints is an enterprise security solution that provides advanced threat detection, continuous monitoring, and retrospective security. It stores security event data in database files.
## Data Collected
This collector gathers structured data about cisco amp logs.
## Collection Method
This collector gathers Cisco AMP database files from the Program Files installation directory, which contain threat detection data, file reputation information, and endpoint activity logs.
## Forensic Value
Cisco AMP databases are critical for investigating advanced malware, providing file trajectory data, threat intelligence, retrospective analysis, and continuous endpoint monitoring. They help trace malware propagation and identify patient zero.
---
# Collect LNK Files
> Source: https://kb.binalyze.ai/air/features/acquisition/supported-evidence/windows-collections-detail/collect-lnk-files.html
## Overview
**Evidence:** Collect LNK Files
**Description:** Collect LNK Files
**Category:** System
**Platform:** windows
**Short Name:** lnkscol
**Is Parsed:** Yes
**Sent to Investigation Hub:** Yes
**Collect File(s):** Yes
## Background
Windows shortcut (.lnk) files record metadata about target files and execution. This data is essential for identifying file launches and user activity.
## Data Collected
This collector gathers structured data about collect lnk files.
## Collection Method
This collector searches common paths for .lnk files across drives, copies them, and records file timestamps into `lnk_collected_files`.
## Forensic Value
This evidence is crucial for forensic investigations as .lnk artifacts can reveal execution paths and accessed files even if originals are deleted.
---
# Collect SRUM Database Files
> Source: https://kb.binalyze.ai/air/features/acquisition/supported-evidence/windows-collections-detail/collect-srum-database-files.html
## Overview
**Evidence:** Collect SRUM Database Files
**Description:** Collect System Resource Usage Monitor (SRUM) database files.
**Category:**
**Platform:** windows
**Short Name:** srumcol
**Is Parsed:** No
**Sent to Investigation Hub:** Yes
**Collect File(s):** No
## Data Collected
This collector gathers structured data about collect srum database files.
### Collect SRUM Database Files Data
| Field | Description | Example |
|-------|-------------|---------|
| `Path` | Full path to SRUM file | C:\Windows\System32\file.ext |
| `CreationTime` | File creation timestamp | 2023-10-15 14:30:25 |
| `AccessTime` | File last access timestamp | 2023-10-15 14:30:25 |
| `WriteTime` | File last write timestamp | 2023-10-15 14:30:25 |
| `Size` | File size in bytes | 1024 |
| `CollectionMethod` | File access method used (OS/NTFS) | Example value |
| `CollectionTime` | When this file was collected | 2023-10-15 14:30:25 |
---
# ComboFix
> Source: https://kb.binalyze.ai/air/features/acquisition/supported-evidence/windows-collections-detail/combofix.html
## Overview
**Evidence:** ComboFix
**Description:** Collect ComboFix Logs
**Category:** Applications
**Platform:** windows
**Short Name:** cmbfls
**Is Parsed:** No
**Sent to Investigation Hub:** No
**Collect File(s):** Yes
## Background
ComboFix is a specialized malware removal tool that creates a detailed log file (ComboFix.txt) documenting all actions taken during system cleaning, including detected threats, removed files, registry changes, and system modifications.
## Data Collected
This collector gathers structured data about combofix.
## Collection Method
This collector gathers the ComboFix.txt log file from the root directory, which contains a comprehensive report of the tool's scan and remediation activities.
## Forensic Value
ComboFix logs provide valuable evidence of malware presence, removal actions, and system state before remediation. They document infections, compromised files, and cleanup activities, helping reconstruct attack timelines and assess damage.
---
# WMI Command Line
> Source: https://kb.binalyze.ai/air/features/acquisition/supported-evidence/windows-collections-detail/wmi-command-line.html
## Overview
**Evidence:** WMI Command Line
**Description:** Dump WMI Command Line Event Consumers
**Category:** System
**Platform:** windows
**Short Name:** wmicec
**Is Parsed:** Yes
**Sent to Investigation Hub:** Yes
**Collect File(s):** No
## Background
WMI CommandLineEventConsumers execute command-line programs when specific WMI events occur. This persistence mechanism allows attackers to launch executables or scripts with SYSTEM privileges in response to system events.
CommandLine consumers can execute any command-line program, including PowerShell, cmd.exe, or malicious executables.
## Data Collected
This collector gathers structured data about wmi command line.
### WMI Command Line Data
| Field | Description | Example |
|-------|-------------|---------|
| `Name` | Consumer name | BadConsumer |
| `PayloadCommand` | Command template to execute | cmd.exe /c powershell.exe -enc ... |
| `PayloadExecutable` | Executable path | C:\Windows\System32\cmd.exe |
## Collection Method
This collector queries WMI for CommandLineEventConsumer instances in multiple namespaces:
- `ROOT\Subscription`
- `ROOT\DEFAULT`
- `ROOT\CIMV2`
## Forensic Value
CommandLine consumers enable command execution persistence. Investigators use this data to detect WMI command-based persistence, identify malicious command payloads, track PowerShell execution via WMI, and detect living-off-the-land persistence.
---
# Cortana History
> Source: https://kb.binalyze.ai/air/features/acquisition/supported-evidence/windows-collections-detail/cortana-history.html
## Overview
**Evidence:** Cortana History
**Description:** Collect Cortana History Databases
**Category:** Applications
**Platform:** windows
**Short Name:** crtnh
**Is Parsed:** No
**Sent to Investigation Hub:** No
**Collect File(s):** Yes
## Background
Cortana stores search queries, voice commands, reminders, and interaction history in ESE and IndexedDB databases. This data captures user searches and voice assistant interactions within Windows.
## Data Collected
This collector gathers structured data about cortana history.
## Collection Method
This collector gathers Cortana IndexedDB and CortanaCoreDb databases from the Cortana app package directories containing search and interaction history.
## Forensic Value
Cortana history reveals user searches, questions asked, reminders set, and system queries. This provides insights into user intent, information gathering, and system usage patterns that may be relevant to investigations.
---
# Crash Dump Information
> Source: https://kb.binalyze.ai/air/features/acquisition/supported-evidence/windows-collections-detail/crash-dump-information.html
## Overview
**Evidence:** Crash Dump Information
**Description:** Collect information about crash dumps
**Category:** System
**Platform:** windows
**Short Name:** cdi
**Is Parsed:** Yes
**Sent to Investigation Hub:** Yes
**Collect File(s):** No
## Background
When Windows encounters a critical error (BSOD), it can create crash dump files containing system memory and diagnostic information. These dumps come in different formats:
- Full memory dump (MEMORY.DMP): Complete physical memory
- Kernel dump: Kernel memory only
- Minidumps: Small dumps with essential information
Crash dump locations are configured in the registry under `HKLM\SYSTEM\CurrentControlSet\Control\CrashControl`.
## Data Collected
This collector gathers structured data about crash dump information.
### Crash Dump Information Data
| Field | Description | Example |
|-------|-------------|---------|
| `Path` | Full path to crash dump | C:\Windows\MEMORY.DMP |
| `Minidump` | Whether this is a minidump | FALSE |
| `FileModified` | Last modified timestamp | 2023-10-15T14:30:00 |
| `FileAccessed` | Last accessed timestamp | 2023-10-15T15:45:00 |
| `FileCreated` | Creation timestamp | 2023-10-15T14:30:00 |
## Collection Method
This collector:
- Reads crash dump configuration from registry:
- `HKLM\SYSTEM\CurrentControlSet\Control\CrashControl` - DumpFile value
- `HKLM\SYSTEM\CurrentControlSet\Control\CrashControl` - MinidumpDir value
- Catalogs dump files (actual collection of large dumps may be optional)
- Records dump file metadata and timestamps
## Forensic Value
Crash dumps can reveal system instability issues and rootkit behavior. Investigators use this data to analyze system crash causes, detect rootkit-induced crashes, identify driver bugs or exploitation, analyze kernel memory state, and correlate crashes with malware activity.
---
# Cybereason Logs
> Source: https://kb.binalyze.ai/air/features/acquisition/supported-evidence/windows-collections-detail/cybereason-logs.html
## Overview
**Evidence:** Cybereason Logs
**Description:** Collect Cybereason Logs
**Category:** Applications
**Platform:** windows
**Short Name:** cybrsls
**Is Parsed:** No
**Sent to Investigation Hub:** No
**Collect File(s):** Yes
## Background
Cybereason is an EDR platform that monitors endpoint behavior and logs malicious operations. It uses multiple components (crs1, apv2, crb1) that each maintain separate log directories for different monitoring functions.
## Data Collected
This collector gathers structured data about cybereason logs.
## Collection Method
This collector gathers logs from multiple Cybereason components including the sensor (crs1), anti-ransomware (apv2), and behavioral analysis (crb1) modules, plus text configuration files.
## Forensic Value
Cybereason logs provide comprehensive EDR visibility into malicious operations, behavioral detections, ransomware attempts, and system compromises. They're critical for investigating advanced threats and understanding attack chains.
---
# Cylance Logs
> Source: https://kb.binalyze.ai/air/features/acquisition/supported-evidence/windows-collections-detail/cylance-logs.html
## Overview
**Evidence:** Cylance Logs
**Description:** Collect Cylance Logs
**Category:** Applications
**Platform:** windows
**Short Name:** cylncl
**Is Parsed:** No
**Sent to Investigation Hub:** No
**Collect File(s):** Yes
## Background
CylancePROTECT (now BlackBerry Protect) is an AI-powered endpoint security solution that uses machine learning for threat prevention. It maintains desktop logs, checkpoint files (chp), status information, and Optics EDR logs for comprehensive security monitoring.
## Data Collected
This collector gathers structured data about cylance logs.
## Collection Method
This collector gathers Cylance logs from multiple locations including Desktop application logs, checkpoint files, status JSON, and Optics EDR logs from both Program Files and ProgramData directories.
## Forensic Value
Cylance logs provide AI-based threat detections, machine learning analysis results, checkpoint data for threat prevention, and EDR visibility through Optics. They're essential for investigating advanced threats and understanding AI-detected malware.
---
# Deep Instinct Logs
> Source: https://kb.binalyze.ai/air/features/acquisition/supported-evidence/windows-collections-detail/deep-instinct-logs.html
## Overview
**Evidence:** Deep Instinct Logs
**Description:** Collect Deep Instinct Logs
**Category:** Applications
**Platform:** windows
**Short Name:** dpnstncl
**Is Parsed:** No
**Sent to Investigation Hub:** No
**Collect File(s):** Yes
## Background
Deep Instinct is an AI-powered endpoint security solution that uses deep learning for threat prevention. It logs detections and prevention actions in ETL (Event Trace Log) format for detailed analysis.
## Data Collected
This collector gathers structured data about deep instinct logs.
## Collection Method
This collector gathers Deep Instinct ETL log files from the ProgramData directory, which contain threat detection and prevention events captured by the deep learning engine.
## Forensic Value
Deep Instinct logs provide insights into AI-detected threats, zero-day attack prevention, and behavioral anomalies. They're valuable for investigating advanced malware and understanding threats that traditional signatures might miss.
---
# Default Browser
> Source: https://kb.binalyze.ai/air/features/acquisition/supported-evidence/windows-collections-detail/default-browser.html
## Overview
**Evidence:** Default Browser
**Description:** Collect Default Browser
**Category:** Applications
**Platform:** windows
**Short Name:** dbrws
**Is Parsed:** Yes
**Sent to Investigation Hub:** Yes
**Collect File(s):** No
## Background
The default browser setting reveals user preferences and potential attack surfaces. Malware and persistence mechanisms may change the default browser to hijack web traffic, inject malicious extensions, or redirect users to phishing sites. Tracking changes to this setting helps detect browser hijacking and unauthorized modifications.
## Data Collected
This collector gathers structured data about default browser.
### Default Browser Data
| Field | Description | Example |
|-------|-------------|---------|
| `DefaultBrowser` | Default Browser | Example value |
## Collection Method
This collector queries the operating system's default application registry to identify which browser is configured as the default handler for HTTP/HTTPS protocols.
## Forensic Value
Default browser configuration is crucial for understanding user behavior patterns and detecting browser-based attacks. Unexpected changes may indicate malware activity, persistence mechanisms, or social engineering attacks. This evidence helps establish timelines for browser-related compromise and identify attack vectors.
---
# Dependency Manifests
> Source: https://kb.binalyze.ai/air/features/acquisition/supported-evidence/windows-collections-detail/dependency-manifests.html
## Overview
**Evidence:** Dependency Manifests
**Description:** Collect developer dependency manifests
**Category:** Applications
**Platform:** windows
**Short Name:** depman
**Is Parsed:** Yes
**Sent to Investigation Hub:** Yes
**Collect File(s):** No
## Background
Developer dependency manifests and lockfiles define declared and resolved third-party packages used by software projects. Covered formats include package.json, package-lock.json, yarn.lock, pnpm-lock.yaml, bun.lock, go.mod, requirements.txt, Pipfile.lock, pyproject.toml, poetry.lock, Cargo.toml, pom.xml, composer.json, Gemfile, Gemfile.lock, Gradle files, and NuGet project files. These files are primary targets for supply chain attacks including dependency confusion, typosquatting, and known-malicious package injection.
## Data Collected
This collector gathers structured data about declared and resolved dependencies, including package names, version constraints, resolved versions, source registries, integrity hashes, direct or transitive status, and whether a lock file is present. Results are recorded in `dependency_manifests`.
## Collection Method
This collector scans user home directories and common development paths for dependency manifest and lock files. Each file is parsed to extract package metadata. Directories such as node_modules, vendor, and .git are skipped for performance.
## Forensic Value
Dependency manifest data is critical for detecting supply chain compromises. Investigators can identify known-malicious packages, typosquatted dependencies, dependency confusion attacks, and missing lock files that indicate insecure dependency resolution.
---
# DHCP Server Logs
> Source: https://kb.binalyze.ai/air/features/acquisition/supported-evidence/windows-collections-detail/dhcp-server-logs.html
## Overview
**Evidence:** DHCP Server Logs
**Description:** Collect DHCP Server Logs
**Category:** Applications
**Platform:** windows
**Short Name:** dhcpl
**Is Parsed:** No
**Sent to Investigation Hub:** No
**Collect File(s):** Yes
## Background
DHCP Server logs track IP address assignments, lease renewals, and client network activity. These logs maintain records of which devices connected to the network and when, mapping MAC addresses to IP addresses.
## Data Collected
This collector gathers structured data about dhcp server logs.
## Collection Method
This collector gathers DHCP log files from the Windows DHCP directory, including active and backup logs that record IP address lease information.
## Forensic Value
DHCP logs help identify unauthorized devices on the network, track device movement, correlate network activity to specific machines, and establish timelines for when compromised systems were active on the network.
---
# Discord Desktop Cache
> Source: https://kb.binalyze.ai/air/features/acquisition/supported-evidence/windows-collections-detail/discord-desktop-cache.html
## Overview
**Evidence:** Discord Desktop Cache
**Description:** Collect Discord Desktop Cache
**Category:** Applications
**Platform:** windows
**Short Name:** dscrdc
**Is Parsed:** No
**Sent to Investigation Hub:** No
**Collect File(s):** Yes
## Background
Discord caches images, emojis, avatars, and other media content in its Cache directory. This includes content from servers, direct messages, and user profiles.
## Data Collected
This collector gathers structured data about discord desktop cache.
## Collection Method
This collector gathers the Discord Cache directory from the Roaming profile containing cached media and web content.
## Forensic Value
Discord cache contains visual evidence including shared images, profile pictures, server content, and media from conversations. This helps recover deleted content, identify participants, and understand server/channel activity.
---
# DNS Cache
> Source: https://kb.binalyze.ai/air/features/acquisition/supported-evidence/windows-collections-detail/dns-cache.html
## Overview
**Evidence:** DNS Cache
**Description:** Collect DNS Cache
**Category:** Network
**Platform:** windows
**Short Name:** dnsc
**Is Parsed:** Yes
**Sent to Investigation Hub:** Yes
**Collect File(s):** No
## Background
The Windows DNS resolver cache stores the results of recent DNS queries to speed up subsequent lookups. The cache contains hostname-to-IP mappings for recently accessed domains and can reveal web browsing activity, malware C2 domains, and network reconnaissance.
DNS cache entries are volatile and cleared when the DNS Client service restarts or entries expire.
## Data Collected
This collector gathers structured data about dns cache.
### DNS Cache Data
| Field | Description | Example |
|-------|-------------|---------|
| `Name` | DNS name | www.example.com |
| `Type` | DNS record type | 1 (A record) |
## Collection Method
This collector:
- Loads DNSAPI.dll
- Calls the undocumented `DnsGetCacheDataTable` function
- Enumerates all cached DNS entries
- Extracts hostname and record type
## Forensic Value
DNS cache reveals recent network activity and domain lookups. Investigators use this data to identify recently accessed domains, detect malware C2 domains, track web browsing activity, identify reconnaissance activity, correlate with network connections, and detect DNS tunneling or exfiltration.
---
# DNS Server Logs
> Source: https://kb.binalyze.ai/air/features/acquisition/supported-evidence/windows-collections-detail/dns-server-logs.html
## Overview
**Evidence:** DNS Server Logs
**Description:** Collect DNS Server Logs
**Category:** Applications
**Platform:** windows
**Short Name:** dnsl
**Is Parsed:** No
**Sent to Investigation Hub:** No
**Collect File(s):** Yes
## Background
DNS Server logs record domain name resolution queries and responses. DNS logging captures which domains were queried, by whom, and when, providing visibility into network communication patterns.
## Data Collected
This collector gathers structured data about dns server logs.
## Collection Method
This collector gathers DNS server log files from the Windows DNS directory, including active and backup logs containing query records.
## Forensic Value
DNS logs are crucial for detecting command and control communications, data exfiltration via DNS tunneling, malicious domain lookups, and DGA-based malware. They reveal network reconnaissance and lateral movement attempts.
---
# DNS Servers
> Source: https://kb.binalyze.ai/air/features/acquisition/supported-evidence/windows-collections-detail/dns-servers.html
## Overview
**Evidence:** DNS Servers
**Description:** Collect DNS Server addresses
**Category:** Network
**Platform:** windows
**Short Name:** dnss
**Is Parsed:** Yes
**Sent to Investigation Hub:** Yes
**Collect File(s):** No
## Background
DNS servers configured on the system are used to resolve domain names to IP addresses. The configured DNS servers can reveal normal network infrastructure or indicate DNS hijacking if unauthorized servers are present.
DNS server configuration is typically obtained via DHCP or configured statically.
## Data Collected
This collector gathers structured data about dns servers.
### DNS Servers Data
| Field | Description | Example |
|-------|-------------|---------|
| `DNSServers` | Comma-separated DNS server IPs | 8.8.8.8,8.8.4.4 |
## Collection Method
This evidence is collected as part of the System collector using:
- `DnsQueryConfig` with `DnsConfigDnsServerList` flag
- Extracts IP addresses of all configured DNS servers
- Returns comma-separated list
## Forensic Value
DNS server configuration can reveal network infrastructure or DNS hijacking. Investigators use this data to verify legitimate DNS servers, detect DNS hijacking, identify rogue DNS servers, correlate with DHCP configuration, and detect DNS redirection attacks.
---
# Docker Changes
> Source: https://kb.binalyze.ai/air/features/acquisition/supported-evidence/windows-collections-detail/docker-changes.html
## Overview
**Evidence:** Docker Changes
**Description:** Collect Docker Changes
**Category:** Applications
**Platform:** windows
**Short Name:** dockchanges
**Is Parsed:** Yes
**Sent to Investigation Hub:** Yes
**Collect File(s):** No
## Background
Docker filesystem changes track modifications made to container filesystems since container creation. These changes reveal files added, modified, or deleted, essential for detecting malware installation, data tampering, or unauthorized access.
## Data Collected
This collector gathers structured data about docker changes.
## Collection Method
This collector queries the Docker daemon via Docker Engine API to retrieve filesystem changes for each container. It lists file paths and change types (added, modified, deleted) since the container was created from its base image.
## Forensic Value
Filesystem changes expose malware droppers, backdoor installations, log tampering, credential theft, or data exfiltration staging. Investigators can identify suspicious file modifications, detect persistence mechanisms, and trace attacker activities within compromised containers.
---
# Docker Container Logs
> Source: https://kb.binalyze.ai/air/features/acquisition/supported-evidence/windows-collections-detail/docker-container-logs.html
## Overview
**Evidence:** Docker Container Logs
**Description:** Collect Docker Container Logs
**Category:** Applications
**Platform:** windows
**Short Name:** dcl
**Is Parsed:** Yes
**Sent to Investigation Hub:** Yes
**Collect File(s):** No
## Background
Docker container logs capture stdout/stderr output from containerized applications. Log data provides runtime behavior, error messages, access patterns, and potential indicators of compromise within container workloads.
## Data Collected
This collector gathers structured data about docker container logs.
## Collection Method
This collector queries the Docker daemon via Docker Engine API to retrieve logs from each container. It captures stdout and stderr output with timestamps for forensic analysis of application behavior and security events.
## Forensic Value
Container logs reveal application errors, authentication attempts, command execution, data access patterns, and exploitation attempts. Analyzing logs helps identify suspicious activities, trace attacker actions, detect data exfiltration, and reconstruct incident timelines in containerized environments.
---
# Docker Containers
> Source: https://kb.binalyze.ai/air/features/acquisition/supported-evidence/windows-collections-detail/docker-containers.html
## Overview
**Evidence:** Docker Containers
**Description:** Collect Docker Containers
**Category:** Applications
**Platform:** windows
**Short Name:** dockcontainers
**Is Parsed:** Yes
**Sent to Investigation Hub:** Yes
**Collect File(s):** No
## Background
Docker containers are isolated runtime environments that package applications and their dependencies. Container metadata reveals running services, exposed ports, mounted volumes, and runtime configurations, essential for identifying malicious containers, unauthorized deployments, and security misconfigurations.
## Data Collected
This collector gathers structured data about docker containers.
## Collection Method
This collector queries the Docker daemon via Docker Engine API to enumerate all containers (running and stopped). It extracts container ID, name, image, state, created time, ports, mounts, network settings, labels, and environment variables for forensic analysis.
## Forensic Value
Container data helps investigators identify suspicious containers, detect cryptominers, backdoors, or data exfiltration tools running in containerized environments. Configuration details reveal privilege escalation, volume mounts to sensitive host paths, and network exposure that may indicate compromise or policy violations.
---
# Docker Image History
> Source: https://kb.binalyze.ai/air/features/acquisition/supported-evidence/windows-collections-detail/docker-image-history.html
## Overview
**Evidence:** Docker Image History
**Description:** Collect Docker Image History
**Category:** Applications
**Platform:** windows
**Short Name:** dockimagehist
**Is Parsed:** Yes
**Sent to Investigation Hub:** Yes
**Collect File(s):** No
## Background
Docker image history shows the layered build steps and commands used to construct an image. This forensic data reveals how an image was built, what software was installed, files added, and configuration changes made during image creation.
## Data Collected
This collector gathers structured data about docker image history.
## Collection Method
This collector queries the Docker daemon via Docker Engine API to retrieve the build history of each image. It extracts layer ID, created time, created by command, size, and tags for each layer in the image's history.
## Forensic Value
Image history exposes malicious commands embedded in image layers, such as backdoor installations, credential theft scripts, or cryptominer deployments. Investigators can identify suspicious layers, trace image lineage, and detect tampering or supply chain attacks in containerized environments.
---
# Docker Images
> Source: https://kb.binalyze.ai/air/features/acquisition/supported-evidence/windows-collections-detail/docker-images.html
## Overview
**Evidence:** Docker Images
**Description:** Collect Docker Images
**Category:** Applications
**Platform:** windows
**Short Name:** dockimages
**Is Parsed:** Yes
**Sent to Investigation Hub:** Yes
**Collect File(s):** No
## Background
Docker images are templates used to create containers, consisting of layered filesystems and metadata. Image inventories reveal deployed applications, base operating systems, vulnerabilities, and potentially malicious or unauthorized images in the environment.
## Data Collected
This collector gathers structured data about docker images.
## Collection Method
This collector queries the Docker daemon via Docker Engine API to list all images (tagged and untagged). It extracts image ID, repository tags, size, creation time, and layer information for each image stored locally.
## Forensic Value
Image data helps identify vulnerable base images, unauthorized images pulled from untrusted registries, backdoored images, or bloated images that may hide malicious payloads. Tracking image provenance and tags assists in supply chain security investigations and compliance audits.
---
# Docker Info
> Source: https://kb.binalyze.ai/air/features/acquisition/supported-evidence/windows-collections-detail/docker-info.html
## Overview
**Evidence:** Docker Info
**Description:** Collect Docker Info
**Category:** Applications
**Platform:** windows
**Short Name:** dockinfo
**Is Parsed:** Yes
**Sent to Investigation Hub:** Yes
**Collect File(s):** No
## Background
Docker system information provides configuration details about the Docker daemon including storage driver, kernel version, operating system, total containers/images, and resource limits. This metadata is crucial for understanding the Docker environment configuration and detecting anomalies.
## Data Collected
This collector gathers structured data about docker info.
## Collection Method
This collector queries the Docker daemon via Docker Engine API to retrieve system-wide information including version, storage driver, logging driver, plugins, security options, and resource constraints.
## Forensic Value
System-level Docker configuration reveals potential security weaknesses such as insecure registries, disabled security features, or resource exhaustion. This data helps investigators understand the Docker deployment model and identify misconfigurations that attackers may exploit.
---
# Docker Networks
> Source: https://kb.binalyze.ai/air/features/acquisition/supported-evidence/windows-collections-detail/docker-networks.html
## Overview
**Evidence:** Docker Networks
**Description:** Collect Docker Networks
**Category:** Applications
**Platform:** windows
**Short Name:** docknetworks
**Is Parsed:** Yes
**Sent to Investigation Hub:** Yes
**Collect File(s):** No
## Background
Docker networks define how containers communicate with each other and external systems. Network configuration reveals bridge networks, overlay networks, host networking modes, and IP address allocations critical for understanding container connectivity and isolation.
## Data Collected
This collector gathers structured data about docker networks.
## Collection Method
This collector queries the Docker daemon via Docker Engine API to enumerate all Docker networks. It extracts network ID, name, driver type, scope, subnet configuration, gateway, connected containers, and network options.
## Forensic Value
Network data identifies containers exposed to the host network (potential privilege escalation), custom networks used for lateral movement, or misconfigured network isolation. Analyzing network attachments helps map container communication paths and detect unauthorized network access or data exfiltration channels.
---
# Docker Processes
> Source: https://kb.binalyze.ai/air/features/acquisition/supported-evidence/windows-collections-detail/docker-processes.html
## Overview
**Evidence:** Docker Processes
**Description:** Collect Docker Processes
**Category:** Applications
**Platform:** windows
**Short Name:** docktops
**Is Parsed:** Yes
**Sent to Investigation Hub:** Yes
**Collect File(s):** No
## Background
Docker container processes show which processes are running inside each container. This data reveals the actual workload, potential process injection, privilege escalation, and unauthorized process execution within containerized environments.
## Data Collected
This collector gathers structured data about docker processes.
## Collection Method
This collector queries the Docker daemon via Docker Engine API to execute 'top' command for each container. It lists processes, PIDs, user, CPU usage, memory usage, and command line for processes running in containers.
## Forensic Value
Process data within containers identifies cryptominers, reverse shells, suspicious child processes, or privilege escalation attempts. Comparing running processes against expected workload helps detect compromised containers, malware, or unauthorized access to containerized applications.
---
# Docker Volumes
> Source: https://kb.binalyze.ai/air/features/acquisition/supported-evidence/windows-collections-detail/docker-volumes.html
## Overview
**Evidence:** Docker Volumes
**Description:** Collect Docker Volumes
**Category:** Applications
**Platform:** windows
**Short Name:** dockvolumes
**Is Parsed:** Yes
**Sent to Investigation Hub:** Yes
**Collect File(s):** No
## Background
Docker volumes provide persistent storage for containers, allowing data to persist beyond container lifecycle. Volume metadata reveals mount paths, drivers, and which containers have access to shared data, critical for data exfiltration and persistence investigations.
## Data Collected
This collector gathers structured data about docker volumes.
## Collection Method
This collector queries the Docker daemon via Docker Engine API to list all volumes. It extracts volume name, driver, mount point, labels, and scope information for each volume in the system.
## Forensic Value
Volume data exposes sensitive data storage locations, shared volumes between containers (lateral movement risk), and host path mounts that may grant container access to sensitive host files. Investigators can identify data staging locations, credential stores, or malicious persistence mechanisms using volumes.
---
# Downloaded Files Information
> Source: https://kb.binalyze.ai/air/features/acquisition/supported-evidence/windows-collections-detail/downloaded-files-information.html
## Overview
**Evidence:** Downloaded Files Information
**Description:** Collect information about downloaded files
**Category:** System
**Platform:** windows
**Short Name:** dli
**Is Parsed:** Yes
**Sent to Investigation Hub:** Yes
**Collect File(s):** No
## Background
Windows marks files downloaded from the Internet with Zone Identifier information stored in an Alternate Data Stream (ADS) named `Zone.Identifier`. This ADS contains metadata about the download including the source URL and referrer.
The Downloads folder is the default location where browsers and other applications save downloaded files. Analyzing these files and their Zone Identifier information can reveal what files were downloaded and from where.
## Data Collected
This collector gathers structured data about downloaded files information.
### Downloaded Files Information Data
| Field | Description | Example |
|-------|-------------|---------|
| `ZoneIdentifier` | Whether file has Zone Identifier ADS | TRUE |
| `ZoneIdentifierHostURL` | URL where file was downloaded from | https://example.com/malware.exe |
| `ZoneIdentifierReferrerURL` | Referring URL | https://example.com/downloads.html |
## Collection Method
This collector:
- Searches for all `Users\*\Downloads` folders
- Recursively enumerates all files in Downloads folders
- For each file, reads the `Zone.Identifier` ADS if present
- Parses the Zone Identifier for HostUrl and ReferrerUrl
- Collects file metadata including hash and signature
## Forensic Value
Downloads folder analysis is crucial for identifying malware delivery, phishing attacks, and data exfiltration staging. Investigators use this data to identify malicious downloads, trace download sources and referrers, establish download timelines, detect phishing attack vectors, identify staged exfiltration data, and correlate downloads with browser history and network activity.
---
# Driver Objects
> Source: https://kb.binalyze.ai/air/features/acquisition/supported-evidence/windows-collections-detail/driver-objects.html
## Overview
**Evidence:** Driver Objects
**Description:** Collect Driver Objects Information
**Category:** System
**Platform:** windows
**Short Name:** drvobjinf
**Is Parsed:** Yes
**Sent to Investigation Hub:** Yes
**Collect File(s):** No
## Background
Kernel driver objects contain detailed information about loaded drivers including their dispatch tables, which specify how the driver handles various I/O operations. Analyzing driver object details can reveal rootkit behavior, driver hooking, and malicious driver functionality.
The driver object includes function pointers for DriverInit, DriverStart, DriverUnload, major functions (IRP handlers), and Fast I/O routines. Anomalies in these function pointers can indicate driver compromise.
## Data Collected
This collector gathers structured data about driver objects.
### Driver Objects Data
| Field | Description | Example |
|-------|-------------|---------|
| `ObjectAddress` | Driver object address | 0xFFFF8A8012345678 |
| `DriverSize` | Size of driver in memory | 524288 |
| `ServiceKeyName` | Service registry key name | \Registry\Machine\System\CurrentControlSet\Services\MyDriver |
| `DriverInit` | DriverEntry address | 0xFFFFF80012340000 |
| `DriverStart` | Driver start routine address | 0xFFFFF80012341000 |
| `DriverUnload` | Driver unload routine address | 0xFFFFF80012342000 |
| `DriverStartIo` | StartIo routine address | 0xFFFFF80012343000 |
| `AddDevice` | AddDevice routine address | 0xFFFFF80012344000 |
## Collection Method
This collector:
- Creates a snapshot of the `\Driver` object directory
- For each driver object, uses IOCTL to retrieve detailed information
- Extracts driver object structure details
- Records all function pointers from dispatch tables
- Creates columns for all 28 Fast I/O functions
- Creates columns for all 28 Major functions
## Forensic Value
Driver object analysis enables advanced rootkit detection and driver security analysis. Investigators use this data to detect hooked driver dispatch tables, identify rootkit driver modifications, analyze driver functionality, detect inline hooking of drivers, verify driver integrity, identify suspicious function pointers, and perform advanced malware analysis.
---
# Drivers List
> Source: https://kb.binalyze.ai/air/features/acquisition/supported-evidence/windows-collections-detail/drivers-list.html
## Overview
**Evidence:** Drivers List
**Description:** Collect driver list
**Category:** System
**Platform:** windows
**Short Name:** dri
**Is Parsed:** Yes
**Sent to Investigation Hub:** Yes
**Collect File(s):** No
## Background
Kernel drivers are privileged software components that run in kernel mode with full access to system memory and hardware. They are used for device drivers, file system filters, security software, and system utilities.
Malicious drivers (rootkits) can hide processes, files, network connections, and other artifacts from user-mode tools. Enumerating loaded drivers is critical for detecting kernel-level threats and understanding the system's low-level software stack.
## Data Collected
This collector gathers structured data about drivers list.
### Drivers List Data
| Field | Description | Example |
|-------|-------------|---------|
| `FilePath` | Full path to the driver file | C:\Windows\System32\drivers\ntfs.sys |
| `FileName` | Driver file name | ntfs.sys |
| `FileSize` | Size of the driver file | 1048576 |
| `FileModified` | Last modified timestamp | 2023-10-15T14:30:00 |
| `FileAccessed` | Last accessed timestamp | 2023-10-15T15:45:00 |
| `FileCreated` | Creation timestamp | 2023-10-01T10:00:00 |
| `Hash` | Hash of the driver file | SHA256:a1b2c3... |
| `Signature` | Digital signature information | Microsoft Windows |
| `SignatureValid` | Whether signature is valid | TRUE |
| `BaseAddress` | Memory address where driver is loaded | 0xFFFFF80012340000 |
| `Size` | Size of loaded driver in memory | 1048576 |
## Collection Method
This collector uses IOCTL calls to enumerate loaded kernel modules and retrieves detailed information about each driver.
## Forensic Value
Driver enumeration is essential for detecting rootkits and kernel-level malware. Investigators use this data to identify unsigned or suspicious drivers, detect kernel-mode persistence, validate system integrity, identify outdated or vulnerable drivers, and detect malicious kernel modules. The memory addresses and load order can reveal driver injection or manipulation attempts.
---
# Dropbox Cache
> Source: https://kb.binalyze.ai/air/features/acquisition/supported-evidence/windows-collections-detail/dropbox-cache.html
## Overview
**Evidence:** Dropbox Cache
**Description:** Collect Dropbox Cache
**Category:** Applications
**Platform:** windows
**Short Name:** drpc
**Is Parsed:** No
**Sent to Investigation Hub:** No
**Collect File(s):** Yes
## Background
Dropbox caches file data, thumbnails, and metadata in cache directories. These caches include temporary file copies and preview data for synchronized content.
## Data Collected
This collector gathers structured data about dropbox cache.
## Collection Method
This collector gathers Dropbox cache directories from Local AppData containing cached files and thumbnails.
## Forensic Value
Dropbox cache can contain file thumbnails, cached documents, and metadata about synchronized files, potentially revealing deleted or modified content.
---
# Dropbox Databases
> Source: https://kb.binalyze.ai/air/features/acquisition/supported-evidence/windows-collections-detail/dropbox-databases.html
## Overview
**Evidence:** Dropbox Databases
**Description:** Collect Dropbox Synchronization Databases
**Category:** Applications
**Platform:** windows
**Short Name:** drpdb
**Is Parsed:** No
**Sent to Investigation Hub:** No
**Collect File(s):** Yes
## Background
Dropbox stores synchronization state, file metadata, and account information in SQLite databases (DB and DBX files). These databases track local and cloud file synchronization, sharing, and account details.
## Data Collected
This collector gathers structured data about dropbox databases.
## Collection Method
This collector gathers Dropbox database (DB) and DBX files from Application Data and Local directories, collecting sync databases at multiple directory levels.
## Forensic Value
Dropbox databases reveal synchronized files, shared folders, account information, file modifications, and deletion history. This is critical for investigating data exfiltration, identifying shared sensitive files, and recovering evidence stored in cloud storage.
---
# Dropbox Logs
> Source: https://kb.binalyze.ai/air/features/acquisition/supported-evidence/windows-collections-detail/dropbox-logs.html
## Overview
**Evidence:** Dropbox Logs
**Description:** Collect Dropbox Logs
**Category:** Applications
**Platform:** windows
**Short Name:** drpl
**Is Parsed:** No
**Sent to Investigation Hub:** No
**Collect File(s):** Yes
## Background
Dropbox maintains log files tracking synchronization events, errors, file operations, and application activities. These logs record sync operations, conflicts, and client-server communications.
## Data Collected
This collector gathers structured data about dropbox logs.
## Collection Method
This collector gathers Dropbox log files from the Local AppData directory containing sync logs and application activity.
## Forensic Value
Dropbox logs reveal synchronization times, file uploads/downloads, errors, conflicts, and sync operations. This helps establish timelines for cloud storage activities and identify when files were synchronized.
---
# Dump Brave Indexed DB
> Source: https://kb.binalyze.ai/air/features/acquisition/supported-evidence/windows-collections-detail/dump-brave-indexed-db.html
## Overview
**Evidence:** Dump Brave Indexed DB
**Description:** Dump Brave Indexed DB
**Category:** Applications
**Platform:** windows
**Short Name:** bidxdb
**Is Parsed:** Yes
**Sent to Investigation Hub:** Yes
**Collect File(s):** No
## Background
Browser IndexedDB is a client-side database used by web applications to store structured data. This data can contain application state, cached content, user data, and potentially sensitive information stored by web applications.
## Data Collected
This collector gathers structured data about dump brave indexed db.
## Collection Method
This collector extracts IndexedDB databases and records from browser storage locations.
## Forensic Value
IndexedDB analysis reveals web application data, cached credentials, offline application state, and potential data exfiltration staging areas. Investigators can identify malicious web application activity, stored authentication tokens, and sensitive data cached by compromised websites.
---
# Dump Chrome Indexed DB
> Source: https://kb.binalyze.ai/air/features/acquisition/supported-evidence/windows-collections-detail/dump-chrome-indexed-db.html
## Overview
**Evidence:** Dump Chrome Indexed DB
**Description:** Dump Chrome Indexed DB
**Category:** Applications
**Platform:** windows
**Short Name:** cidxdb
**Is Parsed:** Yes
**Sent to Investigation Hub:** Yes
**Collect File(s):** No
## Background
Browser IndexedDB is a client-side database used by web applications to store structured data. This data can contain application state, cached content, user data, and potentially sensitive information stored by web applications.
## Data Collected
This collector gathers structured data about dump chrome indexed db.
## Collection Method
This collector extracts IndexedDB databases and records from browser storage locations.
## Forensic Value
IndexedDB analysis reveals web application data, cached credentials, offline application state, and potential data exfiltration staging areas. Investigators can identify malicious web application activity, stored authentication tokens, and sensitive data cached by compromised websites.
---
# Dump Edge Indexed DB
> Source: https://kb.binalyze.ai/air/features/acquisition/supported-evidence/windows-collections-detail/dump-edge-indexed-db.html
## Overview
**Evidence:** Dump Edge Indexed DB
**Description:** Dump Edge Indexed DB
**Category:** Applications
**Platform:** windows
**Short Name:** eidxdb
**Is Parsed:** Yes
**Sent to Investigation Hub:** Yes
**Collect File(s):** No
## Background
Browser IndexedDB is a client-side database used by web applications to store structured data. This data can contain application state, cached content, user data, and potentially sensitive information stored by web applications.
## Data Collected
This collector gathers structured data about dump edge indexed db.
## Collection Method
This collector extracts IndexedDB databases and records from browser storage locations.
## Forensic Value
IndexedDB analysis reveals web application data, cached credentials, offline application state, and potential data exfiltration staging areas. Investigators can identify malicious web application activity, stored authentication tokens, and sensitive data cached by compromised websites.
---
# Dump Opera Indexed DB
> Source: https://kb.binalyze.ai/air/features/acquisition/supported-evidence/windows-collections-detail/dump-opera-indexed-db.html
## Overview
**Evidence:** Dump Opera Indexed DB
**Description:** Dump Opera Indexed DB
**Category:** Applications
**Platform:** windows
**Short Name:** oidxdb
**Is Parsed:** Yes
**Sent to Investigation Hub:** Yes
**Collect File(s):** No
## Background
Browser IndexedDB is a client-side database used by web applications to store structured data. This data can contain application state, cached content, user data, and potentially sensitive information stored by web applications.
## Data Collected
This collector gathers structured data about dump opera indexed db.
## Collection Method
This collector extracts IndexedDB databases and records from browser storage locations.
## Forensic Value
IndexedDB analysis reveals web application data, cached credentials, offline application state, and potential data exfiltration staging areas. Investigators can identify malicious web application activity, stored authentication tokens, and sensitive data cached by compromised websites.
---
# Dump QQ Indexed DB
> Source: https://kb.binalyze.ai/air/features/acquisition/supported-evidence/windows-collections-detail/dump-qq-indexed-db.html
## Overview
**Evidence:** Dump QQ Indexed DB
**Description:** Dump QQ Indexed DB
**Category:** Applications
**Platform:** windows
**Short Name:** qidxdb
**Is Parsed:** Yes
**Sent to Investigation Hub:** Yes
**Collect File(s):** No
## Background
Browser IndexedDB is a client-side database used by web applications to store structured data. This data can contain application state, cached content, user data, and potentially sensitive information stored by web applications.
## Data Collected
This collector gathers structured data about dump qq indexed db.
## Collection Method
This collector extracts IndexedDB databases and records from browser storage locations.
## Forensic Value
IndexedDB analysis reveals web application data, cached credentials, offline application state, and potential data exfiltration staging areas. Investigators can identify malicious web application activity, stored authentication tokens, and sensitive data cached by compromised websites.
---
# Dump Vivaldi Indexed DB
> Source: https://kb.binalyze.ai/air/features/acquisition/supported-evidence/windows-collections-detail/dump-vivaldi-indexed-db.html
## Overview
**Evidence:** Dump Vivaldi Indexed DB
**Description:** Dump Vivaldi Indexed DB
**Category:** Applications
**Platform:** windows
**Short Name:** vidxdb
**Is Parsed:** Yes
**Sent to Investigation Hub:** Yes
**Collect File(s):** No
## Background
Browser IndexedDB is a client-side database used by web applications to store structured data. This data can contain application state, cached content, user data, and potentially sensitive information stored by web applications.
## Data Collected
This collector gathers structured data about dump vivaldi indexed db.
## Collection Method
This collector extracts IndexedDB databases and records from browser storage locations.
## Forensic Value
IndexedDB analysis reveals web application data, cached credentials, offline application state, and potential data exfiltration staging areas. Investigators can identify malicious web application activity, stored authentication tokens, and sensitive data cached by compromised websites.
---
# Edge Bookmarks
> Source: https://kb.binalyze.ai/air/features/acquisition/supported-evidence/windows-collections-detail/edge-bookmarks.html
## Overview
**Evidence:** Edge Bookmarks
**Description:** Collect Edge Bookmarks
**Category:** Applications
**Platform:** windows
**Short Name:** ebkmrks
**Is Parsed:** Yes
**Sent to Investigation Hub:** Yes
**Collect File(s):** No
## Background
Browser bookmarks represent user-saved favorite websites and organizational folders. This data reveals frequently accessed sites, user interests, and potential indicators of reconnaissance, phishing targets, or suspicious infrastructure.
## Data Collected
This collector gathers structured data about edge bookmarks.
### Edge Bookmarks Data
| Field | Description | Example |
|-------|-------------|---------|
| `UserName` | User Name | Example value |
| `ProfileName` | Profile Name | Example value |
| `BrowserName` | Browser Name | Example value |
| `GUID` | GUID | Example value |
| `BookmarkID` | Bookmark ID | Example value |
| `Name` | Name | Example value |
| `Type` | Type | Example value |
| `URL` | URL | Example value |
| `ParentFolder` | Parent Folder | Example value |
| `DateAdded` | Date Added | 2023-10-15 14:30:25+03:00 |
| `DateLastUsed` | Date Last Used | 2023-10-15 14:30:25+03:00 |
| `DateModified` | Date Modified | 2023-10-15 14:30:25+03:00 |
## Collection Method
This collector parses the browser's Bookmarks file to extract saved URLs, folder structures, timestamps, and metadata.
## Forensic Value
Bookmark analysis identifies targeted websites, phishing pages, command-and-control servers, internal resources, and organizational reconnaissance patterns. Investigators can detect social engineering campaigns, credential harvesting attempts, and lateral movement preparation.
---
# Edge Cookies
> Source: https://kb.binalyze.ai/air/features/acquisition/supported-evidence/windows-collections-detail/edge-cookies.html
## Overview
**Evidence:** Edge Cookies
**Description:** Collect Edge Cookies
**Category:** Applications
**Platform:** windows
**Short Name:** ecookies
**Is Parsed:** Yes
**Sent to Investigation Hub:** Yes
**Collect File(s):** No
## Background
Browser cookies store session tokens, authentication credentials, user preferences, and tracking data. This data is essential for understanding authenticated sessions, tracking user activity across websites, and identifying session hijacking or credential theft.
## Data Collected
This collector gathers structured data about edge cookies.
### Edge Cookies Data
| Field | Description | Example |
|-------|-------------|---------|
| `UserName` | User Name | Example value |
| `BrowserName` | Browser Name | Example value |
| `ProfileName` | Profile Name | Example value |
| `Domain` | Domain | Example value |
| `Name` | Name | Example value |
| `Path` | Path | Example value |
| `Value` | Value | Example value |
| `IsSecure` | Is Secure | 123 |
| `IsHTTPOnly` | Is HTTP Only | 123 |
| `HasExpires` | Has Expires | 123 |
| `IsPersistent` | Is Persistent | 123 |
| `Priority` | Priority | 123 |
| `SameSite` | Same Site | 123 |
| `SourcePort` | Source Port | 123 |
| `SourceScheme` | Source Scheme | 123 |
| `CreationTime` | Creation Time | 2023-10-15 14:30:25+03:00 |
| `ExpiresTime` | Expires Time | 2023-10-15 14:30:25+03:00 |
| `LastAccessTime` | Last Access Time | 2023-10-15 14:30:25+03:00 |
## Collection Method
This collector extracts cookies from the browser's Cookies database, including domain, name, value, path, expiration, and security flags.
## Forensic Value
Cookie analysis reveals active sessions, authentication tokens, persistent tracking identifiers, and potential session hijacking. Investigators can identify stolen credentials, unauthorized access, and cross-site tracking used for reconnaissance or targeting.
---
# Edge Downloads
> Source: https://kb.binalyze.ai/air/features/acquisition/supported-evidence/windows-collections-detail/edge-downloads.html
## Overview
**Evidence:** Edge Downloads
**Description:** Collect Edge Downloads
**Category:** Applications
**Platform:** windows
**Short Name:** edwnlds
**Is Parsed:** Yes
**Sent to Investigation Hub:** Yes
**Collect File(s):** No
## Background
Browser download history records files downloaded by users, including file paths, timestamps, URLs, referrer information, and download status. This data is essential for tracking file acquisition, identifying potentially malicious downloads, and reconstructing user activity timelines.
## Data Collected
This collector gathers structured data about edge downloads.
### Edge Downloads Data
| Field | Description | Example |
|-------|-------------|---------|
| `UserName` | User Name | Example value |
| `Browser` | Browser | Example value |
| `ProfileName` | Profile Name | Example value |
| `URL` | URL | Example value |
| `TargetPath` | Target Path | Example value |
| `CurrentPath` | Current Path | Example value |
| `Referrer` | Referrer | Example value |
| `LastModified` | Last Modified | 2023-10-15 14:30:25+03:00 |
| `DangerType` | Danger Type | 123 |
| `Opened` | Opened | 123 |
| `TabURL` | Tab URL | Example value |
| `TabReferrerURL` | Tab Referrer URL | Example value |
| `StartTime` | Start Time | 2023-10-15 14:30:25+03:00 |
| `EndTime` | End Time | 2023-10-15 14:30:25+03:00 |
| `HistoryFilePath` | History File Path | Example value |
## Collection Method
This collector queries the browser's History database to extract download records, including file paths, download times, source URLs, and security flags.
## Forensic Value
Download history reveals malware delivery vectors, data exfiltration attempts, unauthorized software installation, and user interaction with suspicious websites. Analysts can identify downloaded malicious files, track attack chains, and correlate downloads with other security events.
---
# Edge Extensions
> Source: https://kb.binalyze.ai/air/features/acquisition/supported-evidence/windows-collections-detail/edge-extensions.html
## Overview
**Evidence:** Edge Extensions
**Description:** Collect Edge Extensions
**Category:** Applications
**Platform:** windows
**Short Name:** eext
**Is Parsed:** Yes
**Sent to Investigation Hub:** Yes
**Collect File(s):** No
## Data Collected
This collector gathers structured data about edge extensions.
---
# Edge Favicons
> Source: https://kb.binalyze.ai/air/features/acquisition/supported-evidence/windows-collections-detail/edge-favicons.html
## Overview
**Evidence:** Edge Favicons
**Description:** Collect Edge Favicons
**Category:** Applications
**Platform:** windows
**Short Name:** efico
**Is Parsed:** Yes
**Sent to Investigation Hub:** Yes
**Collect File(s):** No
## Background
Browser favicons are cached website icons that provide visual history of visited sites. This data supplements browsing history by revealing sites accessed even if history was deleted.
## Data Collected
This collector gathers structured data about edge favicons.
### Edge Favicons Data
| Field | Description | Example |
|-------|-------------|---------|
| `ID` | ID | 123 |
| `UserName` | User Name | Example value |
| `BrowserName` | Browser Name | Example value |
| `Profile` | Profile | Example value |
| `URL` | URL | Example value |
| `IconType` | Icon Type | 123 |
| `Path` | Path | Example value |
## Collection Method
This collector queries the browser's Favicons database to extract cached website icons and associated URLs.
## Forensic Value
Favicon analysis can recover evidence of deleted browsing history, identify visited sites through icon fingerprinting, and correlate with other browser artifacts to establish comprehensive activity timelines.
---
# Edge Form History
> Source: https://kb.binalyze.ai/air/features/acquisition/supported-evidence/windows-collections-detail/edge-form-history.html
## Overview
**Evidence:** Edge Form History
**Description:** Collect Edge Form History
**Category:** Applications
**Platform:** windows
**Short Name:** efh
**Is Parsed:** Yes
**Sent to Investigation Hub:** Yes
**Collect File(s):** No
## Background
Browser form history stores previously entered form data including search queries, usernames, and other input fields. This data reveals user search patterns, account information, and potential data leakage through autofill.
## Data Collected
This collector gathers structured data about edge form history.
### Edge Form History Data
| Field | Description | Example |
|-------|-------------|---------|
| `UserName` | User Name | Example value |
| `BrowserName` | Browser Name | Example value |
| `Name` | Name | Example value |
| `Value` | Value | Example value |
| `ValueLower` | Value Lower | Example value |
| `Count` | Count | 123 |
| `Profile` | Profile | Example value |
| `Path` | Path | Example value |
| `DateCreated` | Date Created | 2023-10-15 14:30:25+03:00 |
| `DateLastUsed` | Date Last Used | 2023-10-15 14:30:25+03:00 |
## Collection Method
This collector queries the browser's form history database to extract saved form field data, search queries, and associated timestamps.
## Forensic Value
Form history exposes reconnaissance activities, credential enumeration attempts, search queries revealing attacker intent, and potentially sensitive information entered into web forms. Analysts can identify data exfiltration, account compromise indicators, and targeted search patterns.
---
# Edge Local Storage
> Source: https://kb.binalyze.ai/air/features/acquisition/supported-evidence/windows-collections-detail/edge-local-storage.html
## Overview
**Evidence:** Edge Local Storage
**Description:** Collect Edge Local Storage
**Category:** Applications
**Platform:** windows
**Short Name:** els
**Is Parsed:** Yes
**Sent to Investigation Hub:** Yes
**Collect File(s):** No
## Background
Browser local storage contains persistent key-value data stored by websites. This data includes user preferences, session state, cached data, and potentially authentication tokens or sensitive information.
## Data Collected
This collector gathers structured data about edge local storage.
### Edge Local Storage Data
| Field | Description | Example |
|-------|-------------|---------|
| `UserName` | User Name | Example value |
| `ProfileName` | Profile Name | Example value |
| `BrowserName` | Browser Name | Example value |
| `Key` | Key | Example value |
| `Value` | Value | Example value |
| `Path` | Path | Example value |
## Collection Method
This collector extracts local storage data from browser storage databases and files.
## Forensic Value
Local storage analysis reveals stored credentials, session tokens, tracking identifiers, and application state that can indicate compromised accounts, persistent tracking, or malicious website activity. Analysts can identify credential theft, session hijacking, and data exfiltration attempts.
---
# Edge Login Data
> Source: https://kb.binalyze.ai/air/features/acquisition/supported-evidence/windows-collections-detail/edge-login-data.html
## Overview
**Evidence:** Edge Login Data
**Description:** Collect Edge Login Data
**Category:** Applications
**Platform:** windows
**Short Name:** elgd
**Is Parsed:** Yes
**Sent to Investigation Hub:** Yes
**Collect File(s):** No
## Background
Browser login data stores saved passwords and credential information. This data is critical for identifying stored credentials, password reuse patterns, and potential credential theft targets.
## Data Collected
This collector gathers structured data about edge login data.
### Edge Login Data Data
| Field | Description | Example |
|-------|-------------|---------|
| `ID` | ID | 123 |
| `UserName` | User Name | Example value |
| `BrowserName` | Browser Name | Example value |
| `OriginURL` | Origin URL | Example value |
| `SignonRealm` | Signon Realm | Example value |
| `BlacklistedByUser` | Blacklisted By User | 123 |
| `Scheme` | Scheme | Example value |
| `PasswordType` | Password Type | Example value |
| `TimesUsed` | Times Used | 123 |
| `Profile` | Profile | Example value |
| `Path` | Path | Example value |
| `DateCreated` | Date Created | 2023-10-15 14:30:25+03:00 |
| `DateLastUsed` | Date Last Used | 2023-10-15 14:30:25+03:00 |
## Collection Method
This collector extracts saved credentials from the browser's Login Data database, including URLs, usernames, and encrypted passwords.
## Forensic Value
Login data analysis reveals stored credentials, password reuse across services, targeted accounts, and potential credential harvesting. Investigators can identify compromised accounts, credential theft attempts, and unauthorized access to saved credentials by malware or attackers.
---
# Edge Sessions
> Source: https://kb.binalyze.ai/air/features/acquisition/supported-evidence/windows-collections-detail/edge-sessions.html
## Overview
**Evidence:** Edge Sessions
**Description:** Collect Edge Sessions
**Category:** Applications
**Platform:** windows
**Short Name:** edss
**Is Parsed:** Yes
**Sent to Investigation Hub:** Yes
**Collect File(s):** No
## Background
Browser sessions maintain active tab state, cookies, and authentication context. This data reveals currently active user sessions, open websites, and authenticated connections at the time of collection.
## Data Collected
This collector gathers structured data about edge sessions.
### Edge Sessions Data
| Field | Description | Example |
|-------|-------------|---------|
| `ID` | ID | 123 |
| `WindowID` | Window ID | 123 |
| `Active` | Active | true |
| `Url` | Url | Example value |
| `Title` | Title | Example value |
| `Deleted` | Deleted | true |
| `Group` | Group | Example value |
| `History` | History | [] |
| `BrowserName` | Browser Name | Example value |
## Collection Method
This collector captures browser session data including active tabs, session cookies, and authentication state.
## Forensic Value
Session analysis identifies active compromises, authenticated sessions to malicious sites, concurrent suspicious activities, and real-time indicators of ongoing attacks. Analysts can detect active C2 connections, authenticated malware communications, and live attacker sessions.
---
# Edge Thumbnails
> Source: https://kb.binalyze.ai/air/features/acquisition/supported-evidence/windows-collections-detail/edge-thumbnails.html
## Overview
**Evidence:** Edge Thumbnails
**Description:** Collect Edge Thumbnails
**Category:** Applications
**Platform:** windows
**Short Name:** ethmb
**Is Parsed:** Yes
**Sent to Investigation Hub:** Yes
**Collect File(s):** No
## Background
Browser thumbnails are cached preview images of visited websites. This visual data supplements browsing history by providing screenshots of accessed pages, useful for recovering deleted history and identifying visited content.
## Data Collected
This collector gathers structured data about edge thumbnails.
### Edge Thumbnails Data
| Field | Description | Example |
|-------|-------------|---------|
| `UserName` | User Name | Example value |
| `Browser` | Browser | Example value |
| `URL` | URL | Example value |
| `URLRank` | URL Rank | 123 |
| `Title` | Title | Example value |
| `Profile` | Profile | Example value |
| `Path` | Path | Example value |
## Collection Method
This collector extracts cached thumbnail images from browser storage.
## Forensic Value
Thumbnail analysis provides visual evidence of visited websites, can recover evidence after history deletion, and helps identify phishing pages, malicious sites, or sensitive internal resources accessed by users through visual inspection.
---
# Edge User Profiles
> Source: https://kb.binalyze.ai/air/features/acquisition/supported-evidence/windows-collections-detail/edge-user-profiles.html
## Overview
**Evidence:** Edge User Profiles
**Description:** Collect Edge User Profiles
**Category:** Applications
**Platform:** windows
**Short Name:** eprfls
**Is Parsed:** Yes
**Sent to Investigation Hub:** Yes
**Collect File(s):** No
## Background
Browser user profiles store per-user browser configurations, extensions, settings, and data segregation. This data reveals multiple user accounts, profile switching patterns, and user-specific browsing behavior.
## Data Collected
This collector gathers structured data about edge user profiles.
### Edge User Profiles Data
| Field | Description | Example |
|-------|-------------|---------|
| `EndpointUserName` | Endpoint User Name | Example value |
| `Profile` | Profile | Example value |
| `ProfileUserName` | Profile User Name | Example value |
| `BrowserName` | Browser Name | Example value |
| `BackgroundApps` | Background Apps | true |
| `GoogleAccountGivenName` | Google Account Given Name | Example value |
| `GoogleAccountID` | Google Account ID | Example value |
| `GoogleAccountName` | Google Account Name | Example value |
| `PictureFileName` | Picture File Name | Example value |
| `LastDownloadedPictureURL` | Last Downloaded Picture URL | Example value |
| `HostedDomain` | Hosted Domain | Example value |
| `IsConsentedPrimaryAccount` | Is Consented Primary Account | true |
| `IsEphemeral` | Is Ephemeral | true |
## Collection Method
This collector enumerates browser user profiles and extracts profile metadata, configurations, and associated data paths.
## Forensic Value
Profile analysis identifies multiple user accounts, profile-specific extensions and configurations, shared device usage patterns, and potential privilege escalation or lateral movement using different browser profiles. Investigators can correlate activity across profiles and identify unauthorized profile creation.
---
# Edge Web Storage
> Source: https://kb.binalyze.ai/air/features/acquisition/supported-evidence/windows-collections-detail/edge-web-storage.html
## Overview
**Evidence:** Edge Web Storage
**Description:** Collect Edge Web Storage
**Category:** Applications
**Platform:** windows
**Short Name:** ews
**Is Parsed:** Yes
**Sent to Investigation Hub:** Yes
**Collect File(s):** No
## Background
Browser web storage includes both local and session storage used by websites to store client-side data. This data can contain application state, user preferences, cached content, and potentially sensitive information.
## Data Collected
This collector gathers structured data about edge web storage.
### Edge Web Storage Data
| Field | Description | Example |
|-------|-------------|---------|
| `UserName` | User Name | Example value |
| `ProfileName` | Profile Name | Example value |
| `BrowserName` | Browser Name | Example value |
| `Key` | Key | Example value |
| `Value` | Value | Example value |
| `Path` | Path | Example value |
## Collection Method
This collector extracts web storage data from browser storage locations including local storage and session storage.
## Forensic Value
Web storage analysis reveals cached application data, stored credentials, session information, and potential data exfiltration staging. Analysts can identify malicious website activity, stored authentication tokens, tracking identifiers, and sensitive data cached by compromised web applications.
---
# Elastic Logs
> Source: https://kb.binalyze.ai/air/features/acquisition/supported-evidence/windows-collections-detail/elastic-logs.html
## Overview
**Evidence:** Elastic Logs
**Description:** Collect Elastic Logs
**Category:** Applications
**Platform:** windows
**Short Name:** lstcl
**Is Parsed:** No
**Sent to Investigation Hub:** No
**Collect File(s):** Yes
## Background
Elastic Endpoint Security (formerly Endgame) is an EDR solution that logs endpoint activities, threat detections, and security events. It maintains state logs for monitoring system security posture.
## Data Collected
This collector gathers structured data about elastic logs.
## Collection Method
This collector gathers Elastic Endpoint log files from the Program Files installation directory, including state logs that track endpoint security status and events.
## Forensic Value
Elastic Endpoint logs provide EDR visibility into process execution, network activity, file modifications, and threat detections. They're essential for investigating security incidents and understanding endpoint compromise.
---
# Environment Variables
> Source: https://kb.binalyze.ai/air/features/acquisition/supported-evidence/windows-collections-detail/environment-variables.html
## Overview
**Evidence:** Environment Variables
**Description:** Enumerate Environment Variables
**Category:** System
**Platform:** windows
**Short Name:** envvars
**Is Parsed:** Yes
**Sent to Investigation Hub:** Yes
**Collect File(s):** No
## Background
Environment variables influence process behavior and can be abused for persistence or evasion. This data is essential for auditing process and registry-scoped variables.
## Data Collected
This collector gathers structured data about environment variables.
## Collection Method
This collector queries the current process environment and reads system/user environment values from registry across views and SIDs.
## Forensic Value
This evidence is crucial for forensic investigations to detect suspicious variables, altered paths, and injected configuration.
---
# Eset Logs
> Source: https://kb.binalyze.ai/air/features/acquisition/supported-evidence/windows-collections-detail/eset-logs.html
## Overview
**Evidence:** Eset Logs
**Description:** Collect Eset Logs
**Category:** Applications
**Platform:** windows
**Short Name:** esttls
**Is Parsed:** No
**Sent to Investigation Hub:** No
**Collect File(s):** Yes
## Background
ESET NOD32 is a popular antivirus solution that maintains detailed logs of virus detections, system scans, and real-time protection events. The virlog.dat file contains virus detection history and threat information.
## Data Collected
This collector gathers structured data about eset logs.
## Collection Method
This collector gathers ESET log files from both legacy Application Data and current ProgramData locations, including the virlog.dat file that tracks all virus detections.
## Forensic Value
ESET logs are valuable for identifying malware detections, analyzing threat timelines, understanding attack vectors, and verifying security responses. The virlog.dat file provides historical virus detection data crucial for incident reconstruction.
---
# ETL
> Source: https://kb.binalyze.ai/air/features/acquisition/supported-evidence/windows-collections-detail/etl.html
## Overview
**Evidence:** ETL
**Description:** Collect ETL Log
**Category:** System
**Platform:** windows
**Short Name:** etl
**Is Parsed:** No
**Sent to Investigation Hub:** Yes
**Collect File(s):** Yes
## Background
Event Trace for Windows (ETW) is a high-performance event tracing mechanism built into Windows. ETL (Event Trace Log) files store trace data captured by ETW providers. These files contain detailed system and application event information that can be more granular than standard Windows Event Logs.
ETL files are used for diagnostics, performance analysis, and troubleshooting. They can contain valuable forensic information about system behavior, application activity, and performance metrics.
## Data Collected
This collector gathers structured data about etl.
### ETL Data
| Field | Description | Example |
|-------|-------------|---------|
| `Name` | Artifact name | ETL Log |
| `Type` | File or Folder | File |
| `SourcePath` | Original file path | C:\Windows\System32\WDI\LogFiles\trace.etl |
| `Path` | Relative path in evidence | Other/trace.etl |
## Collection Method
This collector collects ETL files from the following locations:
- `Windows\System32\WDI\LogFiles\*.etl`
- `Windows\System32\LogFiles\WMI\*.etl`
- `Windows\System32\WDI\*\*\*.etl`
- `Programdata\Microsoft\Windows\Power Efficiency Diagnostics` (directory)
- `Windows\Panther\*.etl`
- `Users\*\AppData\Local\Microsoft\Windows\Explorer\*.etl`
## Forensic Value
ETL logs provide detailed diagnostic and performance data that can reveal system behavior and application activity. Investigators use this data to analyze system performance issues, track application behavior, investigate diagnostic events, detect anomalous system activity, and reconstruct detailed system timelines.
---
# Event Log EVT Files
> Source: https://kb.binalyze.ai/air/features/acquisition/supported-evidence/windows-collections-detail/event-log-evt-files.html
## Overview
**Evidence:** Event Log EVT Files
**Description:** Dump evt event log files
**Category:** EventLogs
**Platform:** windows
**Short Name:** evt
**Is Parsed:** Yes
**Sent to Investigation Hub:** Yes
**Collect File(s):** No
## Background
Windows event log files (EVTX/EVT) store channel data on disk. This data is essential for offline analysis and evidence preservation.
## Data Collected
This collector gathers structured data about event log evt files.
## Collection Method
This collector enumerates standard event log directories (EVTX in winevt\Logs, legacy EVT in System32\config), copies files, and records metadata and hashes.
## Forensic Value
This evidence is crucial for forensic investigations to preserve original log files and verify integrity with hashes.
---
# Event Log EVT Records
> Source: https://kb.binalyze.ai/air/features/acquisition/supported-evidence/windows-collections-detail/event-log-evt-records.html
## Overview
**Evidence:** Event Log EVT Records
**Description:** Collect most recent event log records
**Category:** EventLogs
**Platform:** windows
**Short Name:** evtr
**Is Parsed:** Yes
**Sent to Investigation Hub:** Yes
**Collect File(s):** Yes
## Background
Windows event logs (EVTX/EVT) capture system, security, and application events. This data is essential for detection and incident response.
## Data Collected
This collector gathers structured data about event log evt records.
## Collection Method
This collector loads an event configuration, locates channel EVTX files, and parses recent events with filters, storing summaries and event data rows.
## Forensic Value
This evidence is crucial for forensic investigations to reconstruct timelines, detect attacks, and analyze security-relevant events. Default Windows event collection profiles include critical Kerberos Key Distribution Center (KDC) events (Event ID 42), expanding detection visibility for authentication downgrade or anomaly scenarios often relevant in enterprise breaches.
---
# Windows Event Records and How They Are Handled
> Source: https://kb.binalyze.ai/air/features/acquisition/supported-evidence/windows-collections-detail/event-log-evt-records/windows-event-records-and-how-they-are-handled.html
## Overview
AIR can collect **Windows Event Log records** and present them as structured, searchable evidence in the Investigation Hub. This page explains how event log records are collected, parsed, and stored for analysis.
## What Gets Collected
Event log **records** are parsed from Windows EVTX/EVT channels using the event log configuration defined by the platform. The result is structured data (records) rather than raw log files.
If you need the raw EVTX files instead of parsed records, use the **Event Log EVTX Files** collector.
- **Event Log EVT Records:** [Event Log EVT Records](../event-log-evt-records)
- **Event Log EVTX Files:** [Event Log EVTX Files](../event-log-evtx-files)
## How AIR Processes Event Log Records
1. **Loads event log configuration** that defines which channels are in scope.
2. **Locates EVTX/EVT channel files** on the asset.
3. **Parses recent events** using filters to reduce noise and focus on relevant records.
4. **Normalizes the records** into structured rows for analysis.
5. **Stores the results** in the case database and sends them to the Investigation Hub.
## Where Results Appear
Parsed event log records are available in the Investigation Hub under the **Event Logs** evidence category. This allows investigators to search, filter, and correlate records alongside other collected artifacts.
## Why This Matters
Event log records provide system, security, and application signals that are critical for timelines, detection, and incident response. By parsing and normalizing these records, AIR makes them easier to analyze at scale.
---
# Event Log EVTX Files
> Source: https://kb.binalyze.ai/air/features/acquisition/supported-evidence/windows-collections-detail/event-log-evtx-files.html
## Overview
**Evidence:** Event Log EVTX Files
**Description:** Dump evtx event log files
**Category:** EventLogs
**Platform:** windows
**Short Name:** evtx
**Is Parsed:** Yes
**Sent to Investigation Hub:** Yes
**Collect File(s):** No
## Background
Windows event log files (EVTX/EVT) store channel data on disk. This data is essential for offline analysis and evidence preservation.
## Data Collected
This collector gathers structured data about event log evtx files.
## Collection Method
This collector enumerates standard event log directories (EVTX in winevt\Logs, legacy EVT in System32\config), copies files, and records metadata and hashes.
## Forensic Value
This evidence is crucial for forensic investigations to preserve original log files and verify integrity with hashes.
---
# EventTranscript DB
> Source: https://kb.binalyze.ai/air/features/acquisition/supported-evidence/windows-collections-detail/eventtranscript-db.html
## Overview
**Evidence:** EventTranscript DB
**Description:** Collect EventTranscript DB
**Category:** System
**Platform:** windows
**Short Name:** evnttrscdb
**Is Parsed:** Yes
**Sent to Investigation Hub:** Yes
**Collect File(s):** Yes
## Background
EventTranscript.db is a SQLite database maintained by Windows for diagnostic data and telemetry. It contains detailed information about application inventory, browser history, WiFi connections, device installations, and other system events.
This database provides unique forensic artifacts not available in other Windows logs, including granular application usage data, WiFi access point history, and detailed system inventory information.
## Data Collected
This collector gathers structured data about eventtranscript db.
### EventTranscript DB Data
| Field | Description | Example |
|-------|-------------|---------|
| `SID` | User security identifier | S-1-5-21-... |
| `Username` | Username | DOMAIN\user |
| `AccessTime` | URL access timestamp | 2023-10-15T14:30:00 |
| `URL` | Visited URL | https://www.example.com |
| `SID` | User security identifier | S-1-5-21-... |
| `Username` | Username | DOMAIN\user |
| `ProgramName` | Application name | Google Chrome |
| `InstallPath` | Installation path | C:\Program Files\Google\Chrome |
| `OSVersion` | OS version at install time | 10.0.19041 |
| `InstallDate` | Installation timestamp | 2023-10-01T10:00:00 |
| `Version` | Application version | 118.0.5993.89 |
| `SID` | User security identifier | S-1-5-21-... |
| `Username` | Username | DOMAIN\user |
| `AccessTime` | Scan timestamp | 2023-10-15T14:30:00 |
| `SSID` | WiFi network name | Corporate-WiFi |
| `MACAddress` | Access point MAC address | 00:11:22:33:44:55 |
| `SID` | User security identifier | S-1-5-21-... |
| `Username` | Username | DOMAIN\user |
| `DeviceMake` | Device manufacturer | Dell Inc. |
| `DeviceModel` | Device model | Latitude 7490 |
| `TimeZone` | User time zone | America/New_York |
| `DefaultBrowser` | Default browser ProgID | ChromeHTML |
| `DefaultApp` | Default app for file types | |
| `DeviceId` | Device identifier | \\.\PHYSICALDRIVE0 |
| `SerialNumber` | Disk serial number | S4BXNX0N123456 |
| `Size` | Disk size in bytes | 512110190592 |
| `NumPartitions` | Number of partitions | 4 |
| `BytesPerSector` | Bytes per sector | 512 |
| `MediaType` | Media type | SSD |
| `SID` | User security identifier | S-1-5-21-... |
| `Username` | Username | DOMAIN\user |
| `InterfaceGuid` | Network interface GUID | {12345678-1234-1234-1234-123456789ABC} |
| `InterfaceType` | Interface type | 71 |
| `InterfaceDescription` | Interface description | Intel(R) Wireless-AC 9560 |
| `SSID` | Connected WiFi network | Corporate-WiFi |
| `AuthAlg` | Authentication algorithm | WPA2PSK |
| `BSSID` | Access point MAC address | 00:11:22:33:44:55 |
| `Manufacturer` | AP manufacturer | Cisco |
| `ModelName` | AP model name | AIR-AP2802I |
| `ModelNumber` | AP model number | AP2802I |
| `SID` | User security identifier | S-1-5-21-... |
| `Username` | Username | DOMAIN\user |
| `ObjectID` | Device object identifier | PCI\VEN_8086&DEV_9D60 |
| `Service` | Associated service | nvme |
| `FirstInstallDate` | First installation | 2023-01-15T10:00:00 |
| `InstallDate` | Last installation | 2023-10-01T14:00:00 |
| `Model` | Device model | Samsung SSD 970 EVO |
| `Manufacturer` | Device manufacturer | Samsung |
| `SID` | User security identifier | S-1-5-21-... |
| `UserName` | Username | DOMAIN\user |
| `TimeStamp` | Event timestamp | 2023-10-15T14:30:00.123Z |
| `ProducerId` | Producer ID | 123 |
| `Producer` | Producer name | Microsoft-Windows-Kernel-General |
| `ProviderGroupId` | Provider group ID | 45 |
| `ProviderGroupGUID` | Provider group GUID | {A68CA8B7-004F-D7B6...} |
| `LocaleName` | Locale name | en-US |
| `TagName` | Event tag name | BrowserHistory |
| `TagId` | Event tag ID | 1 |
| `FullEventName` | Complete event name | Microsoft.Windows.Shell.SystemSettings.AppDefaultsUpdated |
| `LoggingBinaryName` | Logging binary | SystemSettings.exe |
| `FriendlyLoggingBinaryName` | Friendly binary name | System Settings |
| `FullEventNameHash` | Event name hash | 12345678901234567890 |
| `Keywords` | Event keywords | 0x8000000000000000 |
| `IsCore` | Is core event | true |
| `CompressedSize` | Compressed payload size | 1024 |
| `Payload` | JSON payload data | {"AppId":"MSEdge","Url":"https://..."} |
## Collection Method
This collector:
- Collects the EventTranscript database from `ProgramData\Microsoft\Diagnosis\EventTranscript`
- Opens the SQLite database
- Queries specific event types using SQL
- Parses JSON payloads from event records
- Extracts and structures data into separate tables
- Also exports raw event data organized by tags to CSV files
## Forensic Value
EventTranscript provides unique telemetry data not available in traditional Windows logs. Investigators use this for historical browser activity tracking, application installation timelines, WiFi network history and geolocation, device installation tracking, user behavior patterns, and system configuration analysis.
---
# Evernote Databases
> Source: https://kb.binalyze.ai/air/features/acquisition/supported-evidence/windows-collections-detail/evernote-databases.html
## Overview
**Evidence:** Evernote Databases
**Description:** Collect Evernote Databases
**Category:** Applications
**Platform:** windows
**Short Name:** everdb
**Is Parsed:** No
**Sent to Investigation Hub:** No
**Collect File(s):** Yes
## Background
Evernote stores notes, attachments, and synchronized content in local databases. These databases contain user notes, clipped web content, documents, and organizational information.
## Data Collected
This collector gathers structured data about evernote databases.
## Collection Method
This collector gathers Evernote database directories from user profile and AppData locations containing note databases and synchronized content.
## Forensic Value
Evernote databases contain notes, attachments, web clippings, and documents that may include passwords, account information, planning details, or other evidence relevant to investigations.
---
# Evernote Drag and Drop Files
> Source: https://kb.binalyze.ai/air/features/acquisition/supported-evidence/windows-collections-detail/evernote-drag-and-drop-files.html
## Overview
**Evidence:** Evernote Drag and Drop Files
**Description:** Collect Evernote Drag and Drop Files
**Category:** Applications
**Platform:** windows
**Short Name:** everdd
**Is Parsed:** No
**Sent to Investigation Hub:** No
**Collect File(s):** Yes
## Background
Evernote temporarily stores files dragged and dropped into notes in the TEMP directory before processing. These files may remain cached after being added to notes.
## Data Collected
This collector gathers structured data about evernote drag and drop files.
## Collection Method
This collector gathers Evernote TEMP directories containing temporarily cached files from drag-and-drop operations.
## Forensic Value
Evernote temp files can reveal recently added attachments, documents, images, or files that were incorporated into notes, providing additional evidence or context.
---
# Evernote Logs
> Source: https://kb.binalyze.ai/air/features/acquisition/supported-evidence/windows-collections-detail/evernote-logs.html
## Overview
**Evidence:** Evernote Logs
**Description:** Collect Evernote Logs
**Category:** Applications
**Platform:** windows
**Short Name:** everl
**Is Parsed:** No
**Sent to Investigation Hub:** No
**Collect File(s):** Yes
## Background
Evernote maintains application logs tracking synchronization events, errors, and application activities. These logs record sync operations, note modifications, and application errors.
## Data Collected
This collector gathers structured data about evernote logs.
## Collection Method
This collector gathers Evernote log directories containing application activity and sync logs.
## Forensic Value
Evernote logs reveal synchronization times, note modification activity, and application usage patterns, helping establish timelines and user activity.
---
# Everything History
> Source: https://kb.binalyze.ai/air/features/acquisition/supported-evidence/windows-collections-detail/everything-history.html
## Overview
**Evidence:** Everything History
**Description:** Collect Everything Run History
**Category:** Applications
**Platform:** windows
**Short Name:** evryh
**Is Parsed:** No
**Sent to Investigation Hub:** No
**Collect File(s):** Yes
## Background
Everything is a popular file search tool that maintains a history of executed files and applications in Run History.csv. This file tracks programs launched through Everything's interface.
## Data Collected
This collector gathers structured data about everything history.
## Collection Method
This collector gathers the Run History.csv file from Everything's application data directories containing execution history.
## Forensic Value
Everything run history reveals programs executed, file paths accessed, and search queries. This helps identify tools used, files accessed, and can reveal execution of malicious tools or scripts.
---
# F-Secure Logs
> Source: https://kb.binalyze.ai/air/features/acquisition/supported-evidence/windows-collections-detail/f-secure-logs.html
## Overview
**Evidence:** F-Secure Logs
**Description:** Collect F-Secure Logs
**Category:** Applications
**Platform:** windows
**Short Name:** fscrls
**Is Parsed:** No
**Sent to Investigation Hub:** No
**Collect File(s):** Yes
## Background
F-Secure is a comprehensive security solution that maintains logs for real-time protection, scheduled scans, and security events. It stores logs in both system-wide ProgramData and user-specific AppData locations, plus maintains event history and scan reports.
## Data Collected
This collector gathers structured data about f-secure logs.
## Collection Method
This collector gathers F-Secure log files from multiple locations including general logs, scheduled scan reports, and event history data from both system and user directories.
## Forensic Value
F-Secure logs provide critical evidence of malware detections, security incidents, scan activities, and threat timeline reconstruction. Event history and scan reports are essential for understanding system security posture and investigating compromises.
---
# Facebook Cache
> Source: https://kb.binalyze.ai/air/features/acquisition/supported-evidence/windows-collections-detail/facebook-cache.html
## Overview
**Evidence:** Facebook Cache
**Description:** Collect Facebook Store Application Cache
**Category:** Applications
**Platform:** windows
**Short Name:** fcbkc
**Is Parsed:** No
**Sent to Investigation Hub:** No
**Collect File(s):** Yes
## Background
Facebook app caches images including profile pictures, shared photos, and media from the news feed and messages. These cached images are stored in the OSMeta image_cache directories.
## Data Collected
This collector gathers structured data about facebook cache.
## Collection Method
This collector gathers Facebook image cache directories from the app package LocalState containing cached visual content.
## Forensic Value
Facebook cache contains images from conversations, posts, and profiles. This helps recover visual evidence, identify contacts through profile pictures, and understand viewed content.
---
# Facebook Databases
> Source: https://kb.binalyze.ai/air/features/acquisition/supported-evidence/windows-collections-detail/facebook-databases.html
## Overview
**Evidence:** Facebook Databases
**Description:** Collect Facebook Store Application User Databases
**Category:** Applications
**Platform:** windows
**Short Name:** fcbkdb
**Is Parsed:** No
**Sent to Investigation Hub:** No
**Collect File(s):** Yes
## Background
Facebook Windows Store app maintains multiple databases for Messenger conversations, P2P connections, Scout features, and general app data. These databases are part of Meta's OSMeta framework for cross-platform synchronization.
## Data Collected
This collector gathers structured data about facebook databases.
## Collection Method
This collector gathers Facebook/Messenger database files from app package LocalState directories, including messenger databases, P2P databases, Scout databases, and general DB directories.
## Forensic Value
Facebook databases contain message history, contacts, conversation metadata, and app activity. This is valuable for investigating communications, relationships, and social network connections in investigations.
---
# FileExts
> Source: https://kb.binalyze.ai/air/features/acquisition/supported-evidence/windows-collections-detail/fileexts.html
## Overview
**Evidence:** FileExts
**Description:** Enumerate FileExts
**Category:** System
**Platform:** windows
**Short Name:** fileexts
**Is Parsed:** Yes
**Sent to Investigation Hub:** Yes
**Collect File(s):** No
## Background
Windows maintains per-user file extension associations that track which programs are used to open specific file types. This includes the OpenWithList (programs used to open the extension), OpenWithProgids (program identifiers), and UserChoice (user-selected default program).
Changes to file associations can indicate user preference changes or potential malware that associates itself with specific file types for persistence or execution.
## Data Collected
This collector gathers structured data about fileexts.
### FileExts Data
| Field | Description | Example |
|-------|-------------|---------|
| `KeyPath` | Registry key path | Software\Microsoft\Windows\CurrentVersion\Explorer\FileExts\.docx |
| `LastWriteTime` | Registry key last write time | 2023-10-15T14:30:00 |
| `Username` | User account name | user |
| `Extension` | File extension | .docx |
| `OpenWithList` | Comma-separated list of programs | WINWORD.EXE,notepad.exe |
| `OpenWithProgIDs` | Comma-separated program IDs | Word.Document.12,txtfile |
| `UserChoice` | User-selected default program | Word.Document.12 |
| `RegPath` | Path to registry hive | Registry/ntuser.dat |
## Collection Method
This collector:
- Collects user registry hives (ntuser.dat)
- Searches for: `Software\Microsoft\Windows\CurrentVersion\Explorer\FileExts\*`
- For each extension, reads:
- OpenWithList MRU
- OpenWithProgids value names
- UserChoice ProgId
- Filters out non-extension keys (must start with ".")
## Forensic Value
File extension associations can reveal user preferences and detect malicious associations. Investigators use this data to identify suspicious program associations, detect malware hijacking file extensions, track user's preferred applications, identify attempts to open malicious file types, detect persistence via file association, and analyze user behavior with specific file types.
---
# FileZilla Sessions
> Source: https://kb.binalyze.ai/air/features/acquisition/supported-evidence/windows-collections-detail/filezilla-sessions.html
## Overview
**Evidence:** FileZilla Sessions
**Description:** Collect FileZilla Sessions & Site Manager Settings
**Category:** Applications
**Platform:** windows
**Short Name:** flz
**Is Parsed:** No
**Sent to Investigation Hub:** No
**Collect File(s):** Yes
## Background
FileZilla FTP client stores server configurations, connection history, and transfer logs in XML and SQLite database files. These files contain FTP/SFTP server credentials, connection details, and file transfer history.
## Data Collected
This collector gathers structured data about filezilla sessions.
## Collection Method
This collector gathers FileZilla configuration XML files, site manager XML files, and SQLite databases from the Roaming profile containing server configurations and connection history.
## Forensic Value
FileZilla artifacts reveal FTP servers accessed, credentials (often stored in plaintext), file transfer activities, and remote server connections. This is critical for investigating data exfiltration, unauthorized server access, and identifying compromised credentials.
---
# FireEye Logs
> Source: https://kb.binalyze.ai/air/features/acquisition/supported-evidence/windows-collections-detail/fireeye-logs.html
## Overview
**Evidence:** FireEye Logs
**Description:** Collect FireEye Logs
**Category:** Applications
**Platform:** windows
**Short Name:** fryl
**Is Parsed:** No
**Sent to Investigation Hub:** No
**Collect File(s):** Yes
## Background
FireEye Endpoint Security (xAgent) is an enterprise EDR solution that provides advanced threat detection, behavioral analysis, and incident response capabilities. The xagt component stores threat intelligence and detection data in database files.
## Data Collected
This collector gathers structured data about fireeye logs.
## Collection Method
This collector gathers FireEye xAgent database files from ProgramData, which contain EDR events, threat detections, behavioral analysis, and endpoint telemetry.
## Forensic Value
FireEye databases are essential for advanced threat investigations, providing EDR visibility, behavioral analysis, IOC detections, and threat intelligence correlation. They're critical for investigating APT activities and sophisticated attacks.
---
# Firefox Browsing History
> Source: https://kb.binalyze.ai/air/features/acquisition/supported-evidence/windows-collections-detail/firefox-browsing-history.html
## Overview
**Evidence:** Firefox Browsing History
**Description:** Collect visited URLs from Mozilla Firefox
**Category:** Applications
**Platform:** windows
**Short Name:** fhst
**Is Parsed:** Yes
**Sent to Investigation Hub:** Yes
**Collect File(s):** No
## Background
Browser history records all websites visited by users, including URLs, page titles, visit timestamps, visit counts, and transition types. This data is essential for reconstructing user activity, identifying malicious websites, and tracking lateral movement or reconnaissance activities.
## Data Collected
This collector gathers structured data about firefox browsing history.
### Firefox Browsing History Data
| Field | Description | Example |
|-------|-------------|---------|
| `AccessTime` | Access Time | 2023-10-15 14:30:25+03:00 |
| `AccessCount` | Access Count | 123 |
| `URL` | URL | Example value |
| `Browser` | Browser | Example value |
| `Title` | Title | Example value |
| `VisitDuration` | Visit Duration | Example value |
| `Referrer` | Referrer | Example value |
| `TypedCount` | Typed Count | 123 |
| `IsHidden` | Is Hidden | true |
| `TransitionType` | Transition Type | Example value |
| `VisitID` | Visit ID | 123 |
| `TransitionQualifiers` | Transition Qualifiers | Example value |
| `User` | User | Example value |
| `Profile` | Profile | Example value |
| `HistoryFilePath` | History File Path | Example value |
## Collection Method
This collector queries the browser's History database to extract visited URLs, timestamps, referrer information, and user interaction patterns.
## Forensic Value
Browsing history reveals phishing sites, malicious domains, command-and-control servers, data exfiltration targets, and reconnaissance activities. Analysts can identify compromised credentials, track attacker infrastructure, and correlate web activity with other security events to establish attack timelines.
---
# Firefox Cookies
> Source: https://kb.binalyze.ai/air/features/acquisition/supported-evidence/windows-collections-detail/firefox-cookies.html
## Overview
**Evidence:** Firefox Cookies
**Description:** Collect Firefox Cookies
**Category:** Applications
**Platform:** windows
**Short Name:** fcookies
**Is Parsed:** Yes
**Sent to Investigation Hub:** Yes
**Collect File(s):** No
## Background
Firefox cookies store session data, authentication tokens, user preferences, and tracking information. Cookies can persist across sessions and contain sensitive data including login credentials, API tokens, and user identifiers. Understanding cookie data is essential for investigating account compromises, tracking malicious domains, and identifying data exfiltration paths.
## Data Collected
This collector gathers structured data about firefox cookies.
### Firefox Cookies Data
| Field | Description | Example |
|-------|-------------|---------|
| `UserName` | User Name | Example value |
| `ProfileName` | Profile Name | Example value |
| `OriginAttributes` | Origin Attributes | Example value |
| `Name` | Name | Example value |
| `Value` | Value | Example value |
| `Host` | Host | Example value |
| `Path` | Path | Example value |
| `IsSecure` | Is Secure | true |
| `IsHTTPOnly` | Is HTTP Only | true |
| `InBrowserElement` | In Browser Element | 123 |
| `SameSite` | Same Site | 123 |
| `RawSameSite` | Raw Same Site | 123 |
| `SchemeMap` | Scheme Map | 123 |
| `Expiry` | Expiry | 2023-10-15 14:30:25+03:00 |
| `LastAccessTime` | Last Access Time | 2023-10-15 14:30:25+03:00 |
| `CreationTime` | Creation Time | 2023-10-15 14:30:25+03:00 |
## Collection Method
This collector queries the Firefox cookies.sqlite database to extract cookie information including names, values, domains, paths, expiration times, security flags, and SameSite attributes for all user profiles.
## Forensic Value
Cookie data reveals visited websites, active sessions, authentication states, and tracking mechanisms. Malicious cookies may indicate session hijacking, credential theft, cross-site scripting attacks, or connections to command-and-control infrastructure. This evidence helps establish user activity timelines, identify compromised accounts, and track attacker access to web services.
---
# Firefox Downloads
> Source: https://kb.binalyze.ai/air/features/acquisition/supported-evidence/windows-collections-detail/firefox-downloads.html
## Overview
**Evidence:** Firefox Downloads
**Description:** Collect Firefox Downloads
**Category:** Applications
**Platform:** windows
**Short Name:** fdwnlds
**Is Parsed:** Yes
**Sent to Investigation Hub:** Yes
**Collect File(s):** No
## Background
Browser download history records files downloaded by users, including file paths, timestamps, URLs, referrer information, and download status. This data is essential for tracking file acquisition, identifying potentially malicious downloads, and reconstructing user activity timelines.
## Data Collected
This collector gathers structured data about firefox downloads.
### Firefox Downloads Data
| Field | Description | Example |
|-------|-------------|---------|
| `UserName` | User Name | Example value |
| `Browser` | Browser | Example value |
| `ProfileName` | Profile Name | Example value |
| `URL` | URL | Example value |
| `TargetPath` | Target Path | Example value |
| `CurrentPath` | Current Path | Example value |
| `Referrer` | Referrer | Example value |
| `LastModified` | Last Modified | 2023-10-15 14:30:25+03:00 |
| `DangerType` | Danger Type | 123 |
| `Opened` | Opened | 123 |
| `TabURL` | Tab URL | Example value |
| `TabReferrerURL` | Tab Referrer URL | Example value |
| `StartTime` | Start Time | 2023-10-15 14:30:25+03:00 |
| `EndTime` | End Time | 2023-10-15 14:30:25+03:00 |
| `HistoryFilePath` | History File Path | Example value |
## Collection Method
This collector queries the browser's History database to extract download records, including file paths, download times, source URLs, and security flags.
## Forensic Value
Download history reveals malware delivery vectors, data exfiltration attempts, unauthorized software installation, and user interaction with suspicious websites. Analysts can identify downloaded malicious files, track attack chains, and correlate downloads with other security events.
---
# Firefox Extensions
> Source: https://kb.binalyze.ai/air/features/acquisition/supported-evidence/windows-collections-detail/firefox-extensions.html
## Overview
**Evidence:** Firefox Extensions
**Description:** Collect Firefox Extensions (Addons)
**Category:** Applications
**Platform:** windows
**Short Name:** fext
**Is Parsed:** Yes
**Sent to Investigation Hub:** Yes
**Collect File(s):** No
## Background
Firefox extensions (add-ons) enhance browser functionality but can pose significant security risks. Malicious extensions can steal credentials, inject ads, track browsing activity, exfiltrate data, and modify web content. Understanding installed extensions is crucial for detecting browser-based attacks and unauthorized access.
## Data Collected
This collector gathers structured data about firefox extensions.
### Firefox Extensions Data
| Field | Description | Example |
|-------|-------------|---------|
| `ExtensionID` | Extension ID | Example value |
| `SyncGUID` | Sync GUID | Example value |
| `Version` | Version | Example value |
| `Username` | Username | Example value |
| `Type` | Type | Example value |
| `Name` | Name | Example value |
| `Description` | Description | Example value |
| `Visible` | Visible | true |
| `Active` | Active | true |
| `UserDisabled` | User Disabled | true |
| `AppDisabled` | App Disabled | true |
| `Path` | Path | Example value |
| `DefaultLocale` | Default Locale | Example value |
| `Hidden` | Hidden | true |
| `InstallTelemetryInfo` | Install Telemetry Info | Example value |
| `Location` | Location | Example value |
| `ManifestVersion` | Manifest Version | 123 |
| `OptionsURL` | Options URL | Example value |
| `OptionsType` | Options Type | 123 |
| `SourceURI` | Source URI | Example value |
| `SignedState` | Signed State | 123 |
| `Incognito` | Incognito | Example value |
| `UserPermissions` | User Permissions | Example value |
| `OptionalPermissions` | Optional Permissions | Example value |
| `InstallDate` | Install Date | 2023-10-15 14:30:25+03:00 |
| `UpdateDate` | Update Date | 2023-10-15 14:30:25+03:00 |
| `SignedDate` | Signed Date | 2023-10-15 14:30:25+03:00 |
## Collection Method
This collector parses Firefox extensions.json and addons.json files from user profiles to extract installed extension information including names, IDs, versions, descriptions, permissions, and installation sources.
## Forensic Value
Firefox extension data provides insight into potential compromise vectors and data exfiltration paths. Malicious or suspicious extensions may indicate phishing attacks, credential theft, adware infections, or privacy violations. This evidence helps identify attack entry points, persistence mechanisms, and unauthorized browser modifications.
---
# Firewall Rules
> Source: https://kb.binalyze.ai/air/features/acquisition/supported-evidence/windows-collections-detail/firewall-rules.html
## Overview
**Evidence:** Firewall Rules
**Description:** Enumerate Firewall Rules
**Category:** Network
**Platform:** windows
**Short Name:** frwl
**Is Parsed:** Yes
**Sent to Investigation Hub:** Yes
**Collect File(s):** No
## Background
Windows Firewall (Windows Defender Firewall) controls network traffic to and from the system based on configurable rules. Attackers often modify firewall rules to allow malicious traffic, open backdoors, or disable security controls.
Firewall rules can be configured per-profile (Domain, Private, Public) and can allow or block traffic based on application, port, protocol, and IP address.
## Data Collected
This collector gathers structured data about firewall rules.
### Firewall Rules Data
| Field | Description | Example |
|-------|-------------|---------|
| `Name` | Rule name | Block Outbound Telnet |
| `Description` | Rule description | Blocks outbound telnet traffic |
| `ApplicationName` | Application path | C:\Windows\System32\telnet.exe |
| `ServiceName` | Service name | RemoteAccess |
| `Protocol` | IP protocol | TCP |
| `LocalPort` | Local port(s) | 80,443 |
| `RemotePort` | Remote port(s) | Any |
| `ICMPType` | ICMP type and code | 8:* |
| `Local` | Local addresses | Any |
| `Remote` | Remote addresses | Any |
| `Direction` | Traffic direction | In/Out |
| `Action` | Rule action | Allow/Block |
| `RuleEnabled` | Whether rule is active | TRUE |
| `FirewallProfile` | Profile(s) where rule applies | Domain Private Public |
| `Interface` | Network interfaces | |
| `InterfaceType` | Interface type filter | All |
| `Grouping` | Rule group | Remote Desktop |
| `EdgeTraversal` | Edge traversal setting | FALSE |
## Collection Method
This collector uses the Windows Firewall COM API to:
- Create `INetFwPolicy2` instance
- Retrieve all firewall rules via `get_Rules`
- Enumerate each rule and extract configuration details
- Parse application paths and file information
## Forensic Value
Firewall rules provide critical evidence for detecting unauthorized network access, backdoors, and security control tampering. Investigators use this data to identify suspicious allow rules for malware, detect disabled security controls, track unauthorized remote access rules, identify data exfiltration paths, detect lateral movement enablers, and correlate firewall changes with security incidents.
---
# FirstFolder
> Source: https://kb.binalyze.ai/air/features/acquisition/supported-evidence/windows-collections-detail/firstfolder.html
## Overview
**Evidence:** FirstFolder
**Description:** Enumerate FirstFolder
**Category:** System
**Platform:** windows
**Short Name:** firstfolder
**Is Parsed:** Yes
**Sent to Investigation Hub:** Yes
**Collect File(s):** No
## Background
The FirstFolder MRU (Most Recently Used) list tracks the first folder that was opened when using Windows common file dialogs (Open/Save dialogs). This registry artifact records which folders users or applications initially navigated to when opening or saving files.
This can provide evidence of file operations and folder access patterns associated with specific applications.
## Data Collected
This collector gathers structured data about firstfolder.
### FirstFolder Data
| Field | Description | Example |
|-------|-------------|---------|
| `KeyPath` | Registry key path | Software\Microsoft\Windows\CurrentVersion\Explorer\ComDlg32\FirstFolder |
| `LastWriteTime` | Registry key last write time | 2023-10-15T14:30:00 |
| `Value` | MRU value name | 0 |
| `Username` | User account name | user |
| `Path` | File name | document.docx |
| `Folder` | Folder path opened | C:\Users\user\Documents\Confidential |
| `MRUPosition` | Position in MRU list | 0 |
| `RegPath` | Path to registry hive | Registry/ntuser.dat |
## Collection Method
This collector:
- Collects user registry hives (ntuser.dat)
- Searches for: `Software\Microsoft\Windows\CurrentVersion\Explorer\ComDlg32\FirstFolder`
- Parses MRUListEx binary data to determine access order
- Extracts file names and folder paths from binary structures
- Orders entries by MRU position
## Forensic Value
FirstFolder MRU reveals folder access through file dialogs and can indicate file operations. Investigators use this data to identify folders accessed for file operations, track file saving/opening patterns, detect access to hidden or sensitive folders, correlate with application usage, and establish file operation timelines.
---
# Github Desktop Cache
> Source: https://kb.binalyze.ai/air/features/acquisition/supported-evidence/windows-collections-detail/github-desktop-cache.html
## Overview
**Evidence:** Github Desktop Cache
**Description:** Collect Github Desktop Cache
**Category:** Applications
**Platform:** windows
**Short Name:** gthbc
**Is Parsed:** No
**Sent to Investigation Hub:** No
**Collect File(s):** Yes
## Background
GitHub Desktop caches repository data, avatars, and web content in its Cache directory. This includes profile pictures, repository images, and cached application data.
## Data Collected
This collector gathers structured data about github desktop cache.
## Collection Method
This collector gathers the GitHub Desktop Cache directory containing cached application and web content.
## Forensic Value
GitHub cache can reveal viewed repositories, profile pictures, and accessed content, supporting investigations into repository access and development activities.
---
# Github Desktop Databases
> Source: https://kb.binalyze.ai/air/features/acquisition/supported-evidence/windows-collections-detail/github-desktop-databases.html
## Overview
**Evidence:** Github Desktop Databases
**Description:** Collect Github Desktop Databases
**Category:** Applications
**Platform:** windows
**Short Name:** gtdb
**Is Parsed:** No
**Sent to Investigation Hub:** No
**Collect File(s):** Yes
## Background
GitHub Desktop and GitHub Visual Studio extension store repository information, commit history, and connection details in database files. These databases track local repositories, GitHub accounts, and synchronization state.
## Data Collected
This collector gathers structured data about github desktop databases.
## Collection Method
This collector gathers GitHub Desktop database directories, GitHub Visual Studio database files, and connection files from Roaming and Local directories.
## Forensic Value
GitHub databases reveal accessed repositories, cloned projects, commit activity, and GitHub accounts. This is valuable for identifying intellectual property theft, leaked credentials in commits, and unauthorized repository access.
---
# Github Desktop Logs
> Source: https://kb.binalyze.ai/air/features/acquisition/supported-evidence/windows-collections-detail/github-desktop-logs.html
## Overview
**Evidence:** Github Desktop Logs
**Description:** Collect Github Desktop Logs
**Category:** Applications
**Platform:** windows
**Short Name:** gthbl
**Is Parsed:** No
**Sent to Investigation Hub:** No
**Collect File(s):** Yes
## Background
GitHub Desktop and GitHub Visual Studio extension maintain log files tracking application activities, sync operations, errors, and repository interactions.
## Data Collected
This collector gathers structured data about github desktop logs.
## Collection Method
This collector gathers log files from GitHub Visual Studio and GitHub Desktop log directories.
## Forensic Value
GitHub logs reveal repository operations, sync times, errors, and application usage patterns, helping establish timelines for development activities and repository interactions.
---
# Google Drive Databases
> Source: https://kb.binalyze.ai/air/features/acquisition/supported-evidence/windows-collections-detail/google-drive-databases.html
## Overview
**Evidence:** Google Drive Databases
**Description:** Collect Google Drive Synchronization Databases
**Category:** Applications
**Platform:** windows
**Short Name:** gdrvdb
**Is Parsed:** No
**Sent to Investigation Hub:** No
**Collect File(s):** Yes
## Background
Google Drive (legacy desktop client) stores synchronization databases, cloud graph data, and temporary data in SQLite databases and log files. These databases track synchronized files, cloud relationships, and sync state.
## Data Collected
This collector gathers structured data about google drive databases.
## Collection Method
This collector gathers Google Drive database files, log files, cloud graph databases, and temp data from Application Data and Local directories.
## Forensic Value
Google Drive databases reveal synchronized files, folders accessed, cloud storage usage, sharing activities, and file modifications. This helps identify data exfiltration to cloud storage, shared documents, and cloud-based evidence.
---
# GoTo Logs
> Source: https://kb.binalyze.ai/air/features/acquisition/supported-evidence/windows-collections-detail/goto-logs.html
## Overview
**Evidence:** GoTo Logs
**Description:** Collect GoTo Logs
**Category:** Applications
**Platform:** windows
**Short Name:** gotolgs
**Is Parsed:** No
**Sent to Investigation Hub:** No
**Collect File(s):** Yes
## Background
GoTo (formerly GoToMeeting/GoToAssist) is a remote meeting and support platform that maintains logs of sessions, connections, and user activities during remote support and meetings.
## Data Collected
This collector gathers structured data about goto logs.
## Collection Method
This collector gathers log files from the GoTo user profile directory containing session and connection information.
## Forensic Value
GoTo logs reveal remote support sessions, meeting participation, and remote access events. This helps investigate unauthorized access, data exfiltration during support sessions, and establish timelines for remote activities.
---
# Hibernation File
> Source: https://kb.binalyze.ai/air/features/acquisition/supported-evidence/windows-collections-detail/hibernation-file.html
## Overview
**Evidence:** Hibernation File
**Description:** Dump hibernation file
**Category:** Memory
**Platform:** windows
**Short Name:** hbr
**Is Parsed:** No
**Sent to Investigation Hub:** Yes
**Collect File(s):** Yes
## Background
When Windows hibernates, it saves the complete contents of RAM to the hibernation file (hiberfil.sys). This creates a snapshot of all running processes, kernel state, and memory contents at the time of hibernation.
The hibernation file is essentially a compressed memory dump and can be analyzed with memory forensics tools. It persists even after the system resumes from hibernation.
## Data Collected
This collector gathers structured data about hibernation file.
### Hibernation File Data
| Field | Description | Example |
|-------|-------------|---------|
| `Type` | File type | HibernationFile |
| `Name` | File name | hiberfil.sys |
| `SourcePath` | Original file path | C:\hiberfil.sys |
| `FilePath` | Relative path in evidence | Files/hiberfil.sys |
| `FileSize` | File size in bytes | 17179869184 |
## Collection Method
This collector collects the hibernation file from:
- `C:\hiberfil.sys` (default location)
The file is collected using driver or NTFS raw access if locked.
## Forensic Value
Hibernation files provide a complete memory snapshot from a specific point in time. Investigators use this data for full memory forensic analysis, recovering historical system state, extracting credentials and keys from point of hibernation, analyzing malware present at hibernation time, and reconstructing system state from past hibernation.
---
# HitmanPro Logs
> Source: https://kb.binalyze.ai/air/features/acquisition/supported-evidence/windows-collections-detail/hitmanpro-logs.html
## Overview
**Evidence:** HitmanPro Logs
**Description:** Collect HitmanPro Logs
**Category:** Applications
**Platform:** windows
**Short Name:** htmnpls
**Is Parsed:** No
**Sent to Investigation Hub:** No
**Collect File(s):** Yes
## Background
HitmanPro is a cloud-based anti-malware scanner, and HitmanPro.Alert provides real-time protection against exploits and malware. The excalibur.db database stores threat intelligence and detection information.
## Data Collected
This collector gathers structured data about hitmanpro logs.
## Collection Method
This collector gathers logs from both HitmanPro scanner and HitmanPro.Alert protection service, including the Excalibur threat intelligence database.
## Forensic Value
HitmanPro logs reveal malware detections, exploit prevention, and behavioral analysis results. The Excalibur database contains threat classification data essential for understanding detected malware families and attack techniques.
---
# Hosts
> Source: https://kb.binalyze.ai/air/features/acquisition/supported-evidence/windows-collections-detail/hosts.html
## Overview
**Evidence:** Hosts
**Description:** Dump Hosts File
**Category:** Network
**Platform:** windows
**Short Name:** hosts
**Is Parsed:** Yes
**Sent to Investigation Hub:** Yes
**Collect File(s):** Yes
## Background
The Windows hosts file (`C:\Windows\System32\drivers\etc\hosts`) provides static DNS resolution by mapping hostnames to IP addresses. Entries in the hosts file override DNS resolution.
Attackers commonly modify the hosts file to:
- Block access to security websites
- Redirect browsers to malicious sites
- Prevent software updates
- Establish C2 communication channels
## Data Collected
This collector gathers structured data about hosts.
### Hosts Data
| Field | Description | Example |
|-------|-------------|---------|
| `Address` | Address | Example value |
| `HostNames` | Host Names | Example value |
## Collection Method
This collector:
- Reads the hosts file path from registry:
- `HKLM\SYSTEM\CurrentControlSet\Services\Tcpip\Parameters` - DataBasePath value
- Parses the hosts file line by line
- Extracts IP address and hostname pairs
- Filters out comments (lines starting with #)
## Forensic Value
Hosts file modifications are a common malware indicator and can reveal DNS hijacking. Investigators use this data to detect DNS redirection attacks, identify blocked security domains, detect malware C2 infrastructure mappings, track unauthorized hosts file modifications, and identify phishing infrastructure.
---
# Iconcache
> Source: https://kb.binalyze.ai/air/features/acquisition/supported-evidence/windows-collections-detail/iconcache.html
## Overview
**Evidence:** Iconcache
**Description:** Collect Iconcache
**Category:** System
**Platform:** windows
**Short Name:** ic
**Is Parsed:** No
**Sent to Investigation Hub:** Yes
**Collect File(s):** Yes
## Background
Windows caches icons extracted from executables, DLLs, and other files to improve Explorer performance. These icon caches are stored in database files and can preserve icons from deleted files or files that were present on removable drives.
Icon caches can provide evidence of files that existed on the system, including malware that may have used custom icons.
## Data Collected
This collector gathers structured data about iconcache.
### Iconcache Data
| Field | Description | Example |
|-------|-------------|---------|
| `Name` | Artifact name | Iconcache |
| `Type` | File | File |
| `SourcePath` | Original file path | C:\Users\user\AppData\Local\Microsoft\Windows\Explorer\iconcache_96.db |
| `Path` | Relative path in evidence | Other/iconcache_96.db |
## Collection Method
This collector collects icon cache files from:
- `Users\*\AppData\Local\Microsoft\Windows\Explorer\iconcache_*.db`
- `Users\*\AppData\Local\iconcache_*.db`
- `Documents and Settings\Administrator\Local Settings\Application Data\IconCach*.db` (legacy)
## Forensic Value
Icon caches can preserve visual evidence from deleted executables. Investigators use this data to recover icons from deleted programs, identify applications that were present, detect custom malware icons, and correlate with execution artifacts.
---
# IDE Extensions
> Source: https://kb.binalyze.ai/air/features/acquisition/supported-evidence/windows-collections-detail/ide-extensions.html
## Overview
**Evidence:** IDE Extensions
**Description:** Collect installed IDE extension and plugin metadata
**Category:** Applications
**Platform:** windows
**Short Name:** ideext
**Is Parsed:** Yes
**Sent to Investigation Hub:** Yes
**Collect File(s):** No
## Background
IDE extensions execute with the same privileges as the developer's editor and can read workspace files, access credentials, exfiltrate code, inject backdoors into builds, and persist across sessions. Malicious VS Code-compatible extensions and JetBrains plugins are a proven initial-access and persistence vector.
## Data Collected
This collector gathers structured metadata about installed IDE extensions and plugins, including identity, publisher, version, activation events, marketplace provenance, install scripts, and directory or manifest mismatches that suggest tampering. VS Code-compatible results are recorded in `ide_extensions_vscode`; JetBrains results in `ide_extensions_jetbrains`.
## Collection Method
This collector scans per-user IDE extension directories for VS Code-compatible editors (VS Code, Insiders, Server, Cursor, Devin, Windsurf, VSCodium, Antigravity) and JetBrains IDEs. It parses package.json manifests and plugin.xml metadata without executing extension code. For JetBrains JAR plugins, it reads META-INF/plugin.xml from the archive.
## Forensic Value
Extension metadata reveals unauthorized, sideloaded, or tampered extensions; broad activation events indicating startup persistence; missing marketplace provenance; directory and manifest identity mismatches suggesting post-install modification; and extension dependency chains that may introduce transitive supply-chain risk.
---
# IE 10,11,Edge Browsing History
> Source: https://kb.binalyze.ai/air/features/acquisition/supported-evidence/windows-collections-detail/ie-1011edge-browsing-history.html
## Overview
**Evidence:** IE 10,11,Edge Browsing History
**Description:** Collect visited URLs from Internet Explorer and Edge
**Category:** Applications
**Platform:** windows
**Short Name:** ehst
**Is Parsed:** Yes
**Sent to Investigation Hub:** Yes
**Collect File(s):** Yes
## Background
Internet Explorer 10-11 and Edge Legacy store browsing history in ESE database files (WebCacheV*.dat). Edge Chromium uses SQLite databases like Chrome.
These databases contain comprehensive browsing history including URLs, visit timestamps, and access counts.
## Data Collected
This collector gathers structured data about ie 10,11,edge browsing history.
### IE 10,11,Edge Browsing History Data
| Field | Description | Example |
|-------|-------------|---------|
| `AccessTime` | Access Time | 2023-10-15 14:30:25+03:00 |
| `AccessCount` | Access Count | 123 |
| `URL` | URL | Example value |
| `Browser` | Browser | Example value |
| `Title` | Title | Example value |
| `VisitDuration` | Visit Duration | Example value |
| `Referrer` | Referrer | Example value |
| `TypedCount` | Typed Count | 123 |
| `IsHidden` | Is Hidden | true |
| `TransitionType` | Transition Type | Example value |
| `VisitID` | Visit ID | 123 |
| `TransitionQualifiers` | Transition Qualifiers | Example value |
| `User` | User | Example value |
| `Profile` | Profile | Example value |
| `HistoryFilePath` | History File Path | Example value |
## Collection Method
This collector processes two database formats:
**IE 10-11 & Edge Legacy (ESE):**
- Location: `Users\*\AppData\Local\Microsoft\Windows\WebCache\WebCacheV*.dat`
- Parses using libesedb library
- Extracts URLs from ESE database tables
**Edge Chromium (SQLite):**
- Location: `Users\*\AppData\Local\Microsoft\Edge\User Data\*\History`
- Queries SQLite database
- SQL: `SELECT urls.url, urls.visit_count, datetime(...) FROM urls, visits WHERE urls.id = visits.url`
## Forensic Value
Browser history is essential for investigating web-based attacks and user activity. Investigators use this data to reconstruct web browsing timelines, identify malicious domains visited, detect phishing site visits, correlate with malware downloads, track data exfiltration websites, and establish user intent and awareness.
---
# IE 7,8,9 Browsing History
> Source: https://kb.binalyze.ai/air/features/acquisition/supported-evidence/windows-collections-detail/ie-789-browsing-history.html
## Overview
**Evidence:** IE 7,8,9 Browsing History
**Description:** Collect visited URLs from Internet Explorer
**Category:** Applications
**Platform:** windows
**Short Name:** ihst
**Is Parsed:** Yes
**Sent to Investigation Hub:** Yes
**Collect File(s):** Yes
## Background
Internet Explorer 7, 8, and 9 store browsing history in index.dat files using the MSIECF (Microsoft Internet Explorer Cache File) format. These files contain URLs visited, access timestamps, and visit counts.
Index.dat files are located in various user profile directories depending on Windows version (XP vs Vista+).
## Data Collected
This collector gathers structured data about ie 7,8,9 browsing history.
### IE 7,8,9 Browsing History Data
| Field | Description | Example |
|-------|-------------|---------|
| `BrowserAccessTime` | When URL was accessed | 2023-10-15T14:30:00 |
| `BrowserAccessCount` | Number of times visited | 5 |
| `BrowserURL` | URL visited | https://www.example.com |
| `Browser` | Browser identifier | IE 7-8-9 |
## Collection Method
This collector:
- Searches for index.dat files in multiple locations:
- Legacy XP paths in `Documents and Settings`
- Vista+ paths in `Users\*\AppData\Local\Microsoft\Windows`
- Collects index.dat files
- Parses using libmsiecf library
- Extracts URLs, timestamps, and visit counts
## Forensic Value
IE browsing history reveals web activity and can indicate phishing, malware downloads, or unauthorized access. Investigators use this data to reconstruct web browsing activity, identify malicious websites visited, detect phishing attacks, correlate with downloads and malware infections, and establish user intent through browsing patterns.
---
# IIS Logs
> Source: https://kb.binalyze.ai/air/features/acquisition/supported-evidence/windows-collections-detail/iis-logs.html
## Overview
**Evidence:** IIS Logs
**Description:** Collect IIS Logs
**Category:** Applications
**Platform:** windows
**Short Name:** iisl
**Is Parsed:** No
**Sent to Investigation Hub:** No
**Collect File(s):** Yes
## Background
Internet Information Services (IIS) logs record HTTP/HTTPS requests, responses, and errors for web applications hosted on Windows servers. IIS is Microsoft's web server platform commonly used in enterprise environments.
## Data Collected
This collector gathers structured data about iis logs.
## Collection Method
This collector gathers IIS W3C log files from system32 LogFiles, inetpub directories, and resource directories, collecting HTTP access logs and error information.
## Forensic Value
IIS logs are critical for detecting web application attacks, SQL injection, cross-site scripting, unauthorized access, and data exfiltration. They provide client IPs, requested URIs, status codes, user agents, and referers.
---
# INF Setup
> Source: https://kb.binalyze.ai/air/features/acquisition/supported-evidence/windows-collections-detail/inf-setup.html
## Overview
**Evidence:** INF Setup
**Description:** Collect INF Setup Log Files
**Category:** System
**Platform:** windows
**Short Name:** infl
**Is Parsed:** No
**Sent to Investigation Hub:** Yes
**Collect File(s):** Yes
## Background
Windows maintains setupapi log files that record detailed information about device driver installations, including PnP device installations, driver package installations, and device configuration changes.
These logs can provide evidence of hardware changes, driver installations, and USB device connections that may not be captured elsewhere.
## Data Collected
This collector gathers structured data about inf setup.
### INF Setup Data
| Field | Description | Example |
|-------|-------------|---------|
| `Name` | Artifact name | INF Setup Logs |
| `Type` | File | File |
| `SourcePath` | Original file path | C:\Windows\INF\setupapi.dev.log |
| `Path` | Relative path in evidence | Other/setupapi.dev.log |
## Collection Method
This collector collects INF setup log files from:
- `Windows\INF\setupapi*.log`
- `Windows\setupapi*.log` (legacy location)
## Forensic Value
INF setup logs provide detailed device installation history. Investigators use this data to track USB device installations, identify driver installation timelines, detect hardware changes, investigate PnP device activity, and correlate with USB history artifacts.
---
# Installed Applications
> Source: https://kb.binalyze.ai/air/features/acquisition/supported-evidence/windows-collections-detail/installed-applications.html
## Overview
**Evidence:** Installed Applications
**Description:** Enumerate Installed Applications
**Category:** System
**Platform:** windows
**Short Name:** apps
**Is Parsed:** Yes
**Sent to Investigation Hub:** Yes
**Collect File(s):** No
## Background
Windows maintains a list of installed applications in registry Uninstall keys. This provides software inventory and key metadata such as version, publisher and key last write time.
## Data Collected
This collector gathers structured data about installed applications.
### Installed Applications Data
| Field | Description | Example |
|-------|-------------|---------|
| `AppName` | Application display name | Google Chrome |
| `Is32Bit` | Whether this is a 32-bit application | FALSE |
| `AppVersion` | Application version | 118.0.5993.89 |
| `Publisher` | Software publisher | Google LLC |
| `SystemComponent` | Whether this is a Windows system component | FALSE |
| `LastWriteTime` | Registry key last write time | 2023-10-15T14:30:00 |
## Collection Method
This collector enumerates HKLM\SOFTWARE\...\Uninstall in both 64-bit and 32-bit (WOW64) registry views, reading DisplayName, DisplayVersion, Publisher, SystemComponent and key last write time.
## Forensic Value
This evidence is crucial for forensic investigations to identify installed or recently added software, detect suspicious tools, and support timeline and compliance analysis.
---
# IPv4 Routes
> Source: https://kb.binalyze.ai/air/features/acquisition/supported-evidence/windows-collections-detail/ipv4-routes.html
## Overview
**Evidence:** IPv4 Routes
**Description:** Collect IPv4 Routes
**Category:** Network
**Platform:** windows
**Short Name:** ipv4
**Is Parsed:** Yes
**Sent to Investigation Hub:** Yes
**Collect File(s):** No
## Background
The IPv4 routing table determines how network packets are forwarded from the local system to destination networks. It contains routes to local subnets, default gateways, and any manually configured or dynamically learned routes.
Routing table modifications can indicate network manipulation, VPN usage, or routing-based attacks.
## Data Collected
This collector gathers structured data about ipv4 routes.
### IPv4 Routes Data
| Field | Description | Example |
|-------|-------------|---------|
| `Destination` | Destination network address | 0.0.0.0 |
| `Mask` | Network mask | 0.0.0.0 |
| `Policy` | Forwarding policy | 0 |
| `Adapter` | Network adapter index | 12 |
| `Type` | Route type | 3 (Indirect) |
| `Protocol` | Routing protocol | 3 (NETMGMT) |
| `Age` | Route age in seconds | 3600 |
## Collection Method
This collector uses Windows API to enumerate routes:
- `GetIpForwardTable` to retrieve routing table
- Parses each route entry
- Extracts destination, mask, and next-hop information
## Forensic Value
Routing tables reveal network topology and potential network manipulation. Investigators use this data to identify VPN or tunnel routes, detect routing table manipulation, understand network architecture, identify static routes to suspicious networks, and detect network-based persistence or C2 infrastructure.
---
# iTunes Backups
> Source: https://kb.binalyze.ai/air/features/acquisition/supported-evidence/windows-collections-detail/itunes-backups.html
## Overview
**Evidence:** iTunes Backups
**Description:** Collect iTunes Backups
**Category:** Applications
**Platform:** windows
**Short Name:** itnb
**Is Parsed:** No
**Sent to Investigation Hub:** No
**Collect File(s):** Yes
## Background
iTunes/Apple Devices stores iOS device backups in the MobileSync Backup directory. These backups contain app data, messages, photos, contacts, and device configurations from iPhones and iPads synchronized with the computer.
## Data Collected
This collector gathers structured data about itunes backups.
## Collection Method
This collector gathers iTunes backup directories from Apple application data, collecting complete or partial iOS device backups.
## Forensic Value
iTunes backups contain extensive mobile device data including messages, call logs, app data, photos, contacts, and location history. This is invaluable for mobile forensics when the physical device is unavailable, revealing communications, activities, and evidence from iOS devices.
---
# JumpList Automatic Entries
> Source: https://kb.binalyze.ai/air/features/acquisition/supported-evidence/windows-collections-detail/jumplist-automatic-entries.html
## Overview
**Evidence:** JumpList Automatic Entries
**Description:** Parse JumpList Automatic Entries
**Category:** System
**Platform:** windows
**Short Name:** jmplautoparsed
**Is Parsed:** Yes
**Sent to Investigation Hub:** Yes
**Collect File(s):** No
## Background
AutomaticDestinations parsed JumpLists combine DestList entries with LNK metadata per app. This data is essential for detailed reconstruction of file usage.
## Data Collected
This collector gathers structured data about jumplist automatic entries.
## Collection Method
This collector parses .automaticDestinations-ms files, saves a main record per file, and batches detailed entry data with LNK-derived fields into `jumplist_automatic_parsed` and `_data` tables.
## Forensic Value
This evidence is crucial for forensic investigations as it reveals interaction counts, hostnames, MACs, GUIDs, and target paths for recent items.
---
# JumpList Automatic Files
> Source: https://kb.binalyze.ai/air/features/acquisition/supported-evidence/windows-collections-detail/jumplist-automatic-files.html
## Overview
**Evidence:** JumpList Automatic Files
**Description:** Collect JumpList Automatic Files
**Category:** System
**Platform:** windows
**Short Name:** jmplautocol
**Is Parsed:** Yes
**Sent to Investigation Hub:** Yes
**Collect File(s):** Yes
## Background
AutomaticDestinations JumpLists track recent documents per application. This data is essential for reconstructing file usage and application activity.
## Data Collected
This collector gathers structured data about jumplist automatic files.
## Collection Method
This collector walks user JumpList directories, copies .automaticDestinations-ms files, and records file timestamps into `jumplist_automatic_collected_files`.
## Forensic Value
This evidence is crucial for forensic investigations as JumpLists reveal recently used files even after deletion.
---
# JumpList Custom Entries
> Source: https://kb.binalyze.ai/air/features/acquisition/supported-evidence/windows-collections-detail/jumplist-custom-entries.html
## Overview
**Evidence:** JumpList Custom Entries
**Description:** Parse JumpList Custom Entries
**Category:** System
**Platform:** windows
**Short Name:** jmplcustomparsed
**Is Parsed:** Yes
**Sent to Investigation Hub:** Yes
**Collect File(s):** No
## Background
CustomDestinations parsed JumpLists organize recent items by app-defined categories. This data is essential for analyzing user interaction with files per application.
## Data Collected
This collector gathers structured data about jumplist custom entries.
## Collection Method
This collector parses .customDestinations-ms files, saves a main record, and batches per-entry LNK-derived metadata into `jumplist_custom_parsed` and `_data` tables.
## Forensic Value
This evidence is crucial for forensic investigations as it provides categorized recent item details with timestamps and target paths.
---
# JumpList Custom Files
> Source: https://kb.binalyze.ai/air/features/acquisition/supported-evidence/windows-collections-detail/jumplist-custom-files.html
## Overview
**Evidence:** JumpList Custom Files
**Description:** Collect JumpList Custom Files
**Category:** System
**Platform:** windows
**Short Name:** jmplcustomcol
**Is Parsed:** Yes
**Sent to Investigation Hub:** Yes
**Collect File(s):** Yes
## Background
CustomDestinations JumpLists store application-specific recent items. This data is essential for reconstructing file usage and application interactions.
## Data Collected
This collector gathers structured data about jumplist custom files.
## Collection Method
This collector walks user JumpList directories, copies .customDestinations-ms files, and records file timestamps into `jumplist_custom_collected_files`.
## Forensic Value
This evidence is crucial for forensic investigations as it surfaces recent items per app even when originals are removed.
---
# Kaseya Logs
> Source: https://kb.binalyze.ai/air/features/acquisition/supported-evidence/windows-collections-detail/kaseya-logs.html
## Overview
**Evidence:** Kaseya Logs
**Description:** Collect Kaseya Logs
**Category:** Applications
**Platform:** windows
**Short Name:** kaseyalogs
**Is Parsed:** No
**Sent to Investigation Hub:** No
**Collect File(s):** Yes
## Background
Kaseya is a remote monitoring and management (RMM) platform widely used by MSPs. It maintains detailed logs of agent activity, remote sessions, and script executions. Kaseya has been targeted in supply chain attacks, most notably the 2021 ransomware incident.
## Data Collected
This collector gathers structured data about kaseya logs.
## Collection Method
This collector gathers Kaseya endpoint logs and session data from ProgramData directories, collecting agent activity and session information.
## Forensic Value
Kaseya logs are critical for investigating RMM-based attacks and supply chain compromises. They reveal remote sessions, executed scripts, deployed software, and can identify exploitation of legitimate management tools for malicious purposes including ransomware deployment.
---
# LastVisitedPidlMRU
> Source: https://kb.binalyze.ai/air/features/acquisition/supported-evidence/windows-collections-detail/lastvisitedpidlmru.html
## Overview
**Evidence:** LastVisitedPidlMRU
**Description:** Enumerate LastVisitedPidlMRU
**Category:** System
**Platform:** windows
**Short Name:** lstvstpidmru
**Is Parsed:** Yes
**Sent to Investigation Hub:** Yes
**Collect File(s):** No
## Background
LastVisitedPidlMRU tracks which folder a user last visited when using a file open/save dialog for each application. This registry artifact creates an association between executables and the folders users accessed while using those applications.
This can reveal which folders users accessed with specific programs, including applications that may have been deleted or are suspicious.
## Data Collected
This collector gathers structured data about lastvisitedpidlmru.
### LastVisitedPidlMRU Data
| Field | Description | Example |
|-------|-------------|---------|
| `KeyPath` | Registry key path | Software\Microsoft\Windows\CurrentVersion\Explorer\ComDlg32\LastVisitedPidlMRU |
| `LastWriteTime` | Registry key last write time | 2023-10-15T14:30:00 |
| `Value` | MRU value name | 0 |
| `Username` | User account name | user |
| `Path` | Folder path accessed | C:\Users\user\Documents\Confidential |
| `MRUPosition` | Position in MRU list | 0 |
| `RegPath` | Path to registry hive | Registry/ntuser.dat |
## Collection Method
This collector:
- Collects user registry hives (ntuser.dat)
- Searches for: `Software\Microsoft\Windows\CurrentVersion\Explorer\ComDlg32\LastVisitedPidlMRU`
- Parses MRUListEx binary data
- Decodes shell item list data using libfwsi
- Extracts folder paths and application associations
- Orders by MRU position
## Forensic Value
LastVisitedPidlMRU reveals application-specific folder access and can connect executables to data locations. Investigators use this data to identify which folders were accessed by specific programs, detect malware accessing sensitive directories, track file dialog operations, correlate applications with data access, prove application interaction with specific folders, and identify suspicious application-folder associations.
---
# Level Logs
> Source: https://kb.binalyze.ai/air/features/acquisition/supported-evidence/windows-collections-detail/level-logs.html
## Overview
**Evidence:** Level Logs
**Description:** Collect Level Application Specific Files and Logs
**Category:** Applications
**Platform:** windows
**Short Name:** levellgs
**Is Parsed:** No
**Sent to Investigation Hub:** No
**Collect File(s):** Yes
## Background
Level (formerly Level.io) is an MSP-focused remote monitoring and management platform that maintains logs of remote access, monitoring activities, and management operations.
## Data Collected
This collector gathers structured data about level logs.
## Collection Method
This collector gathers log files from the Level installation directory containing RMM agent activity and connection records.
## Forensic Value
Level logs help investigate RMM-based attacks and unauthorized remote management activities. They reveal remote sessions, monitoring activities, and can identify abuse of MSP tools for malicious access.
---
# LinkedIn Cache
> Source: https://kb.binalyze.ai/air/features/acquisition/supported-evidence/windows-collections-detail/linkedin-cache.html
## Overview
**Evidence:** LinkedIn Cache
**Description:** Collect LinkedIn Store Application Cache
**Category:** Applications
**Platform:** windows
**Short Name:** lnkc
**Is Parsed:** No
**Sent to Investigation Hub:** No
**Collect File(s):** Yes
## Background
LinkedIn Windows Store app caches web content, images, and profile data in its INetCache directory. This includes viewed profiles, connection information, and feed content.
## Data Collected
This collector gathers structured data about linkedin cache.
## Collection Method
This collector gathers the LinkedIn app INetCache directory containing cached web content and media.
## Forensic Value
LinkedIn cache reveals professional connections, viewed profiles, job searches, and network activity. This is valuable for investigating professional relationships, employment history, and business connections in investigations.
---
# LogMeIn Logs
> Source: https://kb.binalyze.ai/air/features/acquisition/supported-evidence/windows-collections-detail/logmein-logs.html
## Overview
**Evidence:** LogMeIn Logs
**Description:** Collect LogMeIn Logs
**Category:** Applications
**Platform:** windows
**Short Name:** lgmnl
**Is Parsed:** No
**Sent to Investigation Hub:** No
**Collect File(s):** Yes
## Background
LogMeIn is an established remote access platform that logs remote connections, file transfers, and session activities. It's used for remote support, access, and management.
## Data Collected
This collector gathers structured data about logmein logs.
## Collection Method
This collector gathers LogMeIn log files from ProgramData and temporary directories containing connection and session records.
## Forensic Value
LogMeIn logs help identify remote access sessions, establish timelines, and investigate unauthorized access. They reveal who connected remotely, when, and what actions were performed during sessions.
---
# MalwareBytes Logs
> Source: https://kb.binalyze.ai/air/features/acquisition/supported-evidence/windows-collections-detail/malwarebytes-logs.html
## Overview
**Evidence:** MalwareBytes Logs
**Description:** Collect MalwareBytes Logs
**Category:** Applications
**Platform:** windows
**Short Name:** mlwrbls
**Is Parsed:** No
**Sent to Investigation Hub:** No
**Collect File(s):** Yes
## Background
Malwarebytes is a popular anti-malware solution that maintains XML-formatted scan logs, service logs, and scan results. It includes both consumer Anti-Malware and enterprise Endpoint Agent versions with comprehensive logging.
## Data Collected
This collector gathers structured data about malwarebytes logs.
## Collection Method
This collector gathers Malwarebytes logs from multiple locations including scan logs, service logs, scan results, and endpoint agent logs from both system-wide and user-specific directories.
## Forensic Value
Malwarebytes logs are essential for malware investigation, providing detailed detection information, scan histories, quarantine actions, and threat classifications. They help reconstruct infection timelines and identify malicious software.
---
# Map Network Drive MRU
> Source: https://kb.binalyze.ai/air/features/acquisition/supported-evidence/windows-collections-detail/map-network-drive-mru.html
## Overview
**Evidence:** Map Network Drive MRU
**Description:** Enumerate Map Network Drive MRU
**Category:** System
**Platform:** windows
**Short Name:** mapnetmru
**Is Parsed:** Yes
**Sent to Investigation Hub:** Yes
**Collect File(s):** No
## Background
Windows maintains a history of network shares that users have mapped using the "Map Network Drive" feature in Windows Explorer. This MRU list records UNC paths to network shares, providing evidence of network resource access and lateral movement.
Network share mappings can reveal access to file servers, administrative shares, and other network resources that may be relevant to data exfiltration or lateral movement investigations.
## Data Collected
This collector gathers structured data about map network drive mru.
### Map Network Drive MRU Data
| Field | Description | Example |
|-------|-------------|---------|
| `KeyPath` | Registry key path | Software\Microsoft\Windows\CurrentVersion\Explorer\Map Network Drive MRU |
| `LastWriteTime` | Registry key last write time | 2023-10-15T14:30:00 |
| `Value` | MRU value name | a |
| `Username` | User account name | user |
| `FileName` | UNC path to network share | \\fileserver\share\folder |
| `MRUPosition` | Position in MRU list | 0 |
| `RegPath` | Path to registry hive | Registry/ntuser.dat |
## Collection Method
This collector:
- Collects user registry hives (ntuser.dat)
- Searches for: `Software\Microsoft\Windows\CurrentVersion\Explorer\Map Network Drive MRU`
- Parses MRUList string to determine access order
- Extracts UNC paths from registry values
- Orders by MRU position (most recent first)
## Forensic Value
Mapped network drive history reveals network resource access and can indicate lateral movement. Investigators use this data to identify accessed network shares, detect lateral movement paths, track file server access, identify administrative share usage, correlate with SMB network connections, and detect data exfiltration paths.
---
# MBR
> Source: https://kb.binalyze.ai/air/features/acquisition/supported-evidence/windows-collections-detail/mbr.html
## Overview
**Evidence:** MBR
**Description:** Collect Master Boot Record
**Category:** DiskFilesystem
**Platform:** windows
**Short Name:** mbr
**Is Parsed:** No
**Sent to Investigation Hub:** Yes
**Collect File(s):** Yes
## Background
The Master Boot Record is the first 512 bytes of a disk and contains the partition table and boot code. The MBR is critical for system boot and can be targeted by bootkits and other low-level malware.
MBR analysis can detect bootkit infections, partition manipulation, and disk tampering.
## Data Collected
This collector gathers structured data about mbr.
### MBR Data
| Field | Description | Example |
|-------|-------------|---------|
| `Type` | Boot record type | MBR |
| `StartOffset` | Starting offset in file | 0 |
| `EndOffset` | Ending offset in file | 512 |
| `FilePath` | Path to saved boot record | Disk/MBR.bin |
## Collection Method
This collector:
- Uses driver IOCTL to read the first 512 bytes of the physical disk
- Saves the raw MBR to a binary file
- Records offset information
## Forensic Value
MBR analysis is critical for detecting bootkits and disk-level threats. Investigators use this data to detect bootkit infections, analyze partition table modifications, identify malicious boot code, verify boot sector integrity, and detect disk manipulation.
---
# McAfee Logs
> Source: https://kb.binalyze.ai/air/features/acquisition/supported-evidence/windows-collections-detail/mcafee-logs.html
## Overview
**Evidence:** McAfee Logs
**Description:** Collect McAfee Logs
**Category:** Applications
**Platform:** windows
**Short Name:** mcafels
**Is Parsed:** No
**Sent to Investigation Hub:** No
**Collect File(s):** Yes
## Background
McAfee is an enterprise security suite that includes Endpoint Security, VirusScan, and Host Intrusion Prevention (HIPS). It maintains extensive logs across multiple components for virus detection, system scans, and intrusion prevention activities.
## Data Collected
This collector gathers structured data about mcafee logs.
## Collection Method
This collector gathers McAfee logs from various product components including Desktop Protection, Endpoint Security, VirusScan, and Host Intrusion Prevention across both legacy and current installations.
## Forensic Value
McAfee logs provide comprehensive security visibility including malware detections, HIPS alerts, scan results, and intrusion attempts. They're critical for investigating security incidents, understanding threat landscape, and analyzing endpoint protection effectiveness.
---
# MFT
> Source: https://kb.binalyze.ai/air/features/acquisition/supported-evidence/windows-collections-detail/mft.html
## Overview
**Evidence:** MFT
**Description:** Dump raw contents of $MFT
**Category:** DiskFilesystem
**Platform:** windows
**Short Name:** mft
**Is Parsed:** No
**Sent to Investigation Hub:** Yes
**Collect File(s):** Yes
## Background
The Master File Table ($MFT) is the core metadata file for NTFS volumes. This evidence type collects the raw binary $MFT file itself (as opposed to the parsed CSV version). The raw MFT file can be analyzed with specialized tools to extract more detailed information than the CSV export, including deleted file entries, file slack space, and advanced NTFS features.
## Data Collected
This collector gathers structured data about mft.
## Collection Method
This collector uses kernel driver NTFS raw access to read $MFT from each fixed NTFS drive. The raw MFT file is collected byte-for-byte.
## Forensic Value
Raw MFT files enable advanced NTFS forensics beyond CSV parsing. Investigators use this data for deleted file recovery from unallocated MFT entries, advanced timeline analysis, file slack analysis, NTFS attribute analysis, and deep forensic examination with specialized MFT parsers.
---
# MFT as CSV
> Source: https://kb.binalyze.ai/air/features/acquisition/supported-evidence/windows-collections-detail/mft-as-csv.html
## Overview
**Evidence:** MFT as CSV
**Description:** Dump MFT entries in CSV format
**Group:** DiskFilesystem
**Sub Group:** Disk & File System
**Platform:** windows
**Short Name:** mftcsv
**Is Parsed:** Yes
**Sent to Investigation Hub:** No
**Collect Raw File(s):** No
**Collect as CSV File:** Yes
## Background
The Master File Table (MFT) is a critical component of the NTFS file system that maintains a record of every file and directory on an NTFS volume. Each file or directory on an NTFS volume has at least one entry in the MFT, which contains metadata about the file including timestamps, attributes, size, and location information. The MFT is located at a specific location on the NTFS volume (typically at the beginning) and acts as the central directory for the entire file system. Windows uses the MFT to quickly locate files and their attributes without having to traverse the entire disk.
## Data Collected
This collector gathers structured data about mft as csv.
## Collection Method
This collector parses MFT entries directly from NTFS volumes by reading the $MFT file on each fixed NTFS drive. The data is exported to CSV format for easy analysis.
## Forensic Value
This evidence is crucial for forensic investigations as it provides a complete timeline and inventory of all files that have existed on the system. The MFT preserves information about deleted files and can reveal file system activity that isn't visible through normal file browsing. Analysts can use this information to reconstruct user actions, identify deleted files, detect data exfiltration, and establish comprehensive timelines of file activity.
---
# MFT Mirror
> Source: https://kb.binalyze.ai/air/features/acquisition/supported-evidence/windows-collections-detail/mft-mirror.html
## Overview
**Evidence:** MFT Mirror
**Description:** Dump MFT Mirror as raw
**Category:** DiskFilesystem
**Platform:** windows
**Short Name:** mftmir
**Is Parsed:** No
**Sent to Investigation Hub:** Yes
**Collect File(s):** Yes
## Background
The MFT Mirror ($MFTMIRR) is a backup copy of the first few entries of the MFT, stored in the middle of the NTFS volume. It provides redundancy for critical MFT entries and can be used to recover the MFT if it becomes corrupted. The MFT Mirror typically contains the first 4 MFT entries which describe the MFT itself and other critical system files.
## Data Collected
This collector gathers structured data about mft mirror.
## Collection Method
This collector uses kernel driver to read the raw $MFTMIRR file from each fixed NTFS drive.
## Forensic Value
MFT Mirror can help recover corrupted MFT entries or verify MFT integrity. Investigators use this data for MFT corruption analysis, MFT recovery operations, and NTFS integrity verification.
---
# Microsoft Calendar
> Source: https://kb.binalyze.ai/air/features/acquisition/supported-evidence/windows-collections-detail/microsoft-calendar.html
## Overview
**Evidence:** Microsoft Calendar
**Description:** Collect Microsoft Calendar Data
**Category:** Applications
**Platform:** windows
**Short Name:** mclndr
**Is Parsed:** No
**Sent to Investigation Hub:** No
**Collect File(s):** Yes
## Background
Microsoft Calendar app stores appointments, meetings, events, and reminders in Unistore databases. This data includes event details, attendees, locations, and timing information synchronized from connected accounts.
## Data Collected
This collector gathers structured data about microsoft calendar.
## Collection Method
This collector gathers calendar data from Unistore directories that contain event information and calendar entries.
## Forensic Value
Calendar data reveals user schedules, meetings, planned activities, and important dates. This can establish timelines, identify alibis, reveal planned actions, and show connections to other individuals through shared events.
---
# Microsoft Exchange Logs
> Source: https://kb.binalyze.ai/air/features/acquisition/supported-evidence/windows-collections-detail/microsoft-exchange-logs.html
## Overview
**Evidence:** Microsoft Exchange Logs
**Description:** Collect Microsoft Exchange Logs
**Category:** Applications
**Platform:** windows
**Short Name:** exchl
**Is Parsed:** No
**Sent to Investigation Hub:** No
**Collect File(s):** Yes
## Background
Microsoft Exchange Server logs track email message flow, client connections, transport events, and search operations. Exchange is a critical enterprise email and collaboration platform frequently targeted by attackers.
## Data Collected
This collector gathers structured data about microsoft exchange logs.
## Collection Method
This collector gathers Exchange logs from Logging directories, including transport logs, search diagnostics, ETL traces, and transport role logs.
## Forensic Value
Exchange logs are vital for investigating email-based attacks, data exfiltration, mailbox compromises, and lateral movement. They reveal message tracking, authentication attempts, and suspicious email patterns that may indicate phishing or BEC attacks.
---
# Microsoft Mail
> Source: https://kb.binalyze.ai/air/features/acquisition/supported-evidence/windows-collections-detail/microsoft-mail.html
## Overview
**Evidence:** Microsoft Mail
**Description:** Collect Microsoft Mail Emails
**Category:** Applications
**Platform:** windows
**Short Name:** mml
**Is Parsed:** No
**Sent to Investigation Hub:** No
**Collect File(s):** Yes
## Background
Microsoft Mail (Windows Live Mail and Windows 10/11 Mail app) stores email messages in EML format and ESE databases. These applications are built-in Windows email clients that sync with various email accounts including Outlook.com, Gmail, and Exchange.
## Data Collected
This collector gathers structured data about microsoft mail.
## Collection Method
This collector gathers EML email files from Windows Live Mail directories, Unistore email databases, and HXD files from the modern Windows Mail app.
## Forensic Value
Email data is critical for investigations involving communication evidence, phishing attacks, business email compromise, data exfiltration, and establishing timelines. Emails reveal correspondence, attachments, contacts, and can provide evidence of intent or planning.
---
# Microsoft Maps
> Source: https://kb.binalyze.ai/air/features/acquisition/supported-evidence/windows-collections-detail/microsoft-maps.html
## Overview
**Evidence:** Microsoft Maps
**Description:** Collect Microsoft Maps Locations
**Category:** Applications
**Platform:** windows
**Short Name:** mmps
**Is Parsed:** No
**Sent to Investigation Hub:** No
**Collect File(s):** Yes
## Background
Microsoft Maps app stores search history, saved locations, routes, and favorites in database files. This data reveals places the user has searched for, directions requested, and locations of interest.
## Data Collected
This collector gathers structured data about microsoft maps.
## Collection Method
This collector gathers database files from the Microsoft Maps app package LocalState directories, collecting location search and navigation history.
## Forensic Value
Maps data reveals user movement patterns, locations of interest, planned routes, and geographical context for investigations. This can establish connections to crime scenes, identify surveillance targets, or corroborate timelines.
---
# Microsoft Outlook
> Source: https://kb.binalyze.ai/air/features/acquisition/supported-evidence/windows-collections-detail/microsoft-outlook.html
## Overview
**Evidence:** Microsoft Outlook
**Description:** Collect Microsoft Outlook Emails
**Category:** Applications
**Platform:** windows
**Short Name:** outlk
**Is Parsed:** No
**Sent to Investigation Hub:** No
**Collect File(s):** Yes
## Background
Microsoft Outlook stores emails in PST (Personal Storage Table) and OST (Offline Storage Table) files. PST files contain local email archives, while OST files are cached copies of Exchange mailboxes. Legacy Outlook Express used DBX files.
## Data Collected
This collector gathers structured data about microsoft outlook.
## Collection Method
This collector gathers Outlook PST and OST files from AppData and Documents directories, as well as legacy Outlook Express DBX files from Identities directories.
## Forensic Value
Outlook email files are critical evidence containing correspondence, attachments, contacts, calendars, and tasks. They're essential for investigating business email compromise, phishing, data leaks, and establishing communication timelines. PST files can contain years of archived communications.
---
# Microsoft People
> Source: https://kb.binalyze.ai/air/features/acquisition/supported-evidence/windows-collections-detail/microsoft-people.html
## Overview
**Evidence:** Microsoft People
**Description:** Collect Microsoft People Data
**Category:** Applications
**Platform:** windows
**Short Name:** mppl
**Is Parsed:** No
**Sent to Investigation Hub:** No
**Collect File(s):** Yes
## Background
Microsoft People app stores contacts, contact photos, and relationship information in Unistore databases. This includes contact details, profile pictures, and integration with email accounts.
## Data Collected
This collector gathers structured data about microsoft people.
## Collection Method
This collector gathers contact data from Unistore directories, People app thumbnails, and Cortana contact configuration files.
## Forensic Value
People data reveals user contacts, communication networks, and relationships. This can identify associates, establish social connections, and provide contact information for witnesses or suspects.
---
# Microsoft Photos
> Source: https://kb.binalyze.ai/air/features/acquisition/supported-evidence/windows-collections-detail/microsoft-photos.html
## Overview
**Evidence:** Microsoft Photos
**Description:** Collect Microsoft Photos History Database
**Category:** Applications
**Platform:** windows
**Short Name:** mph
**Is Parsed:** No
**Sent to Investigation Hub:** No
**Collect File(s):** Yes
## Background
Microsoft Photos app stores viewing history, metadata, and organizational information in SQLite databases. These databases track which photos were viewed, when, and any edits or organizational changes made within the app.
## Data Collected
This collector gathers structured data about microsoft photos.
## Collection Method
This collector gathers MediaDb SQLite database files from Microsoft Photos app package directories in user AppData locations.
## Forensic Value
Photos history databases reveal which images were accessed, providing insights into user activity and interests. This can identify viewed evidence, exfiltrated images, or content related to investigations.
---
# Microsoft Sticky Notes
> Source: https://kb.binalyze.ai/air/features/acquisition/supported-evidence/windows-collections-detail/microsoft-sticky-notes.html
## Overview
**Evidence:** Microsoft Sticky Notes
**Description:** Collect Microsoft Sticky Notes
**Category:** Applications
**Platform:** windows
**Short Name:** stckyn
**Is Parsed:** No
**Sent to Investigation Hub:** No
**Collect File(s):** Yes
## Background
Microsoft Sticky Notes stores user-created notes in SQLite databases (modern version) or SNT files (legacy version). These notes can contain passwords, reminders, sensitive information, and personal or work-related content.
## Data Collected
This collector gathers structured data about microsoft sticky notes.
## Collection Method
This collector gathers plum.sqlite database files from the modern Sticky Notes app and legacy .snt files from the Roaming profile directory.
## Forensic Value
Sticky Notes often contain valuable information including passwords, account details, IP addresses, system information, and notes related to investigations. They can reveal user intentions, planned activities, and sensitive data exposure.
---
# Microsoft Store Applications List
> Source: https://kb.binalyze.ai/air/features/acquisition/supported-evidence/windows-collections-detail/microsoft-store-applications-list.html
## Overview
**Evidence:** Microsoft Store Applications List
**Description:** Collect Microsoft Store Applications List Database
**Category:** Applications
**Platform:** windows
**Short Name:** strdb
**Is Parsed:** No
**Sent to Investigation Hub:** No
**Collect File(s):** Yes
## Background
The Microsoft Store maintains a repository database of installed UWP applications, including installation details, versions, and metadata. This database tracks all Windows Store apps present on the system.
## Data Collected
This collector gathers structured data about microsoft store applications list.
## Collection Method
This collector gathers StateRepository (SRD) database files from the Windows AppRepository directory containing Microsoft Store application information.
## Forensic Value
Store application data helps identify installed UWP apps, their versions, and installation times. This is valuable for detecting malicious apps, identifying software used in incidents, and understanding application usage.
---
# Microsoft Voice Record History
> Source: https://kb.binalyze.ai/air/features/acquisition/supported-evidence/windows-collections-detail/microsoft-voice-record-history.html
## Overview
**Evidence:** Microsoft Voice Record History
**Description:** Collect Microsoft Voice Record History
**Category:** Applications
**Platform:** windows
**Short Name:** vrcdh
**Is Parsed:** No
**Sent to Investigation Hub:** No
**Collect File(s):** Yes
## Background
Windows Sound Recorder app maintains history and metadata about voice recordings made using the application. This includes recording timestamps, durations, and file references.
## Data Collected
This collector gathers structured data about microsoft voice record history.
## Collection Method
This collector gathers DAT files from the Sound Recorder app package LocalState directory containing recording history and metadata.
## Forensic Value
Voice recording history can reveal when recordings were made, their duration, and file locations. This may be relevant for identifying audio evidence, surveillance activities, or recorded conversations.
---
# MongoDB Logs
> Source: https://kb.binalyze.ai/air/features/acquisition/supported-evidence/windows-collections-detail/mongodb-logs.html
## Overview
**Evidence:** MongoDB Logs
**Description:** Collect MongoDB Logs
**Category:** Applications
**Platform:** windows
**Short Name:** mngl
**Is Parsed:** No
**Sent to Investigation Hub:** No
**Collect File(s):** Yes
## Background
MongoDB logs contain database operations, connection events, queries, and error messages. These logs are essential for monitoring database activity and identifying unauthorized access or data manipulation.
## Data Collected
This collector gathers structured data about mongodb logs.
## Collection Method
This collector gathers MongoDB log files from the standard MongoDB Server installation directory, collecting operational logs and diagnostic information.
## Forensic Value
MongoDB logs help identify unauthorized database access, data exfiltration, injection attacks, and suspicious query patterns. They reveal authentication attempts, executed queries, and database configuration changes.
---
# Mozilla Thunderbird
> Source: https://kb.binalyze.ai/air/features/acquisition/supported-evidence/windows-collections-detail/mozilla-thunderbird.html
## Overview
**Evidence:** Mozilla Thunderbird
**Description:** Collect Mozilla Thunderbird Emails
**Category:** Applications
**Platform:** windows
**Short Name:** thndr
**Is Parsed:** No
**Sent to Investigation Hub:** No
**Collect File(s):** Yes
## Background
Mozilla Thunderbird is an open-source email client that stores emails in MBOX format within profile directories. It supports POP3 (Mail folder) and IMAP (ImapMail folder) accounts, storing messages locally in the profile.
## Data Collected
This collector gathers structured data about mozilla thunderbird.
## Collection Method
This collector gathers Thunderbird email folders from user profile directories, collecting both local Mail and IMAP ImapMail directories containing email messages.
## Forensic Value
Thunderbird email data provides evidence of correspondence, attachments, and communication patterns. This is valuable for investigating email-based attacks, data leaks, and establishing communication timelines in investigations.
---
# MSSQL Logs
> Source: https://kb.binalyze.ai/air/features/acquisition/supported-evidence/windows-collections-detail/mssql-logs.html
## Overview
**Evidence:** MSSQL Logs
**Description:** Collect MSSQL Logs
**Category:** Applications
**Platform:** windows
**Short Name:** mssqll
**Is Parsed:** No
**Sent to Investigation Hub:** No
**Collect File(s):** Yes
## Background
Microsoft SQL Server logs contain database engine events, errors, warnings, and informational messages. These logs track authentication, query execution, backup operations, and configuration changes.
## Data Collected
This collector gathers structured data about mssql logs.
## Collection Method
This collector gathers MSSQL error logs and agent logs from the SQL Server installation directory, collecting server activity and diagnostic information.
## Forensic Value
MSSQL logs help identify SQL injection attacks, unauthorized database access, privilege escalation, data modification, and suspicious stored procedure execution. They reveal failed login attempts and abnormal query patterns.
---
# Network Adapters
> Source: https://kb.binalyze.ai/air/features/acquisition/supported-evidence/windows-collections-detail/network-adapters.html
## Overview
**Evidence:** Network Adapters
**Description:** Collect information about network adapters
**Category:** Network
**Platform:** windows
**Short Name:** netadp
**Is Parsed:** Yes
**Sent to Investigation Hub:** Yes
**Collect File(s):** No
## Background
Network adapters connect the system to networks (Ethernet, WiFi, VPN, etc.). Each adapter has configuration including MAC address, IP address, DHCP settings, gateway, and DNS servers.
Adapter information reveals the system's network connectivity and can indicate VPN usage, WiFi connections, or unusual network configurations.
## Data Collected
This collector gathers structured data about network adapters.
### Network Adapters Data
| Field | Description | Example |
|-------|-------------|---------|
| `Name` | Adapter name/GUID | {12345678-1234-1234-1234-123456789ABC} |
| `Description` | Adapter description | Intel(R) PRO/1000 MT Network Connection |
| `PhysicalAddress` | MAC address | 00:50:56:C0:00:08 |
| `Index` | Adapter index | 12 |
| `Type` | Adapter type | 71 (Ethernet 802.3) |
| `DHCPEnabled` | Whether DHCP is enabled | TRUE |
| `IPAddress` | IP address | 192.168.1.100 |
| `Gateway` | Default gateway | 192.168.1.1 |
| `DHCPServer` | DHCP server address | 192.168.1.1 |
## Collection Method
This collector uses Windows API to enumerate adapters:
- `GetAdaptersInfo` to retrieve all network adapters
- Parses adapter configuration
- Converts MAC addresses to readable format
## Forensic Value
Network adapter information reveals network connectivity and configuration. Investigators use this data to identify all network interfaces, detect VPN or tunnel adapters, track MAC addresses for device identification, understand DHCP vs static configuration, identify WiFi connections, and correlate with network traffic.
---
# NetworkFlow
> Source: https://kb.binalyze.ai/air/features/acquisition/supported-evidence/windows-collections-detail/networkflow.html
## Overview
**Evidence:** NetworkFlow
**Description:** Collect Network Flow
**Category:**
**Platform:** windows
**Short Name:** nf
**Is Parsed:** No
**Sent to Investigation Hub:** Yes
**Collect File(s):** No
## Data Collected
This collector gathers structured data about networkflow.
---
# Network Shares
> Source: https://kb.binalyze.ai/air/features/acquisition/supported-evidence/windows-collections-detail/network-shares.html
## Overview
**Evidence:** Network Shares
**Description:** Collect information about network shares
**Category:** Network
**Platform:** windows
**Short Name:** netshr
**Is Parsed:** Yes
**Sent to Investigation Hub:** Yes
**Collect File(s):** No
## Background
Windows systems can share folders, printers, and other resources over the network via SMB/CIFS. Each share has a name, local path, permissions, and connection information.
Share enumeration can reveal unauthorized file shares, administrative shares, and data exfiltration staging points.
## Data Collected
This collector gathers structured data about network shares.
### Network Shares Data
| Field | Description | Example |
|-------|-------------|---------|
| `Name` | Share name | SharedDocs |
| `Type` | Share type | Disk, Special, Temporary |
| `Comments` | Share description | Shared documents folder |
| `Permissions` | Share permissions | 0 |
| `Path` | Local path being shared | C:\SharedDocs |
| `Password` | Share password (if any) | |
| `Connections` | Current connection count | 3 |
## Collection Method
This collector uses Windows Network API:
- `NetShareEnum` with level 502 (detailed information)
- Enumerates all shares including hidden administrative shares
- Extracts share configuration and permissions
Share types include:
- STYPE_DISKTREE: Disk share
- STYPE_PRINTQ: Print queue
- STYPE_DEVICE: Communication device
- STYPE_IPC: Interprocess communication
- STYPE_SPECIAL: Special share (C$, ADMIN$, etc.)
- STYPE_TEMPORARY: Temporary share
## Forensic Value
Network share enumeration reveals potential data exposure and lateral movement paths. Investigators use this data to identify unauthorized file shares, detect administrative share access, track shared resource exposure, identify data exfiltration staging, detect lateral movement infrastructure, and audit share permissions and configuration.
---
# Notepad++ Sessions
> Source: https://kb.binalyze.ai/air/features/acquisition/supported-evidence/windows-collections-detail/notepad-sessions.html
## Overview
**Evidence:** Notepad++ Sessions
**Description:** Collect Notepad++ Search History & Sessions
**Category:** Applications
**Platform:** windows
**Short Name:** ntpd
**Is Parsed:** No
**Sent to Investigation Hub:** No
**Collect File(s):** Yes
## Background
Notepad++ stores session files (session.xml) with open files and tabs, configuration settings (config.xml) with search history and preferences, and backup files of unsaved documents. This data reveals editing activity and file access.
## Data Collected
This collector gathers structured data about notepad++ sessions.
## Collection Method
This collector gathers Notepad++ session XML files, configuration XML files, and backup directories from both Roaming and legacy Application Data directories.
## Forensic Value
Notepad++ artifacts reveal edited files, search queries, recently accessed documents, and unsaved content in backups. This is critical for identifying viewed/edited code, scripts, configuration files, logs, and documents that may contain evidence or reveal attacker activities.
---
# NTDS.dit
> Source: https://kb.binalyze.ai/air/features/acquisition/supported-evidence/windows-collections-detail/ntdsdit.html
## Overview
**Evidence:** NTDS.dit
**Description:** Collect Active Directory NTDS Database
**Category:** System
**Platform:** windows
**Short Name:** ntdsdit
**Is Parsed:** No
**Sent to Investigation Hub:** Yes
**Collect File(s):** Yes
## Background
NTDS.dit is the Active Directory database file that stores all Active Directory data including user accounts, passwords, groups, and domain configuration. This file is only present on Windows Domain Controllers.
The database contains password hashes, Kerberos keys, and other critical Active Directory information. Compromise of NTDS.dit is a critical security incident as it contains credentials for all domain accounts.
## Data Collected
This collector gathers structured data about ntds.dit.
### NTDS.dit Data
| Field | Description | Example |
|-------|-------------|---------|
| `Type` | File type | NTDSDatabase |
| `Name` | File name | ntds.dit |
| `SourcePath` | Original file path | C:\Windows\NTDS\ntds.dit |
| `FilePath` | Relative path in evidence | Files/ntds.dit |
| `FileSize` | File size in bytes | 10485760000 |
## Collection Method
This collector collects the Active Directory database from:
- `C:\Windows\NTDS\ntds.dit`
The file is collected using driver or NTFS raw access as it is typically locked by Active Directory services.
## Forensic Value
NTDS.dit is critical for Active Directory forensics and compromise assessment. Investigators use this data to extract domain user accounts and groups, recover password hashes for offline cracking, analyze Active Directory configuration, investigate domain compromise, track account modifications, and perform post-breach Active Directory analysis.
---
# Object Directory
> Source: https://kb.binalyze.ai/air/features/acquisition/supported-evidence/windows-collections-detail/object-directory.html
## Overview
**Evidence:** Object Directory
**Description:** Collect Object Directory Information
**Category:** System
**Platform:** windows
**Short Name:** objdirinf
**Is Parsed:** Yes
**Sent to Investigation Hub:** Yes
**Collect File(s):** No
## Background
The Windows kernel maintains object directories that contain named kernel objects like devices, drivers, symbolic links, and other kernel-mode objects. These directories are organized hierarchically and can be enumerated to understand the kernel object namespace.
Common object directories include:
- `\Driver` - Loaded driver objects
- `\Device` - Device objects
- `\Global??` - Global symbolic links and DOS device names
Enumerating these directories can reveal hidden devices, suspicious drivers, and other kernel-level artifacts.
## Data Collected
This collector gathers structured data about object directory.
### Object Directory Data
| Field | Description | Example |
|-------|-------------|---------|
| `Type` | Object type | Driver |
| `Path` | Object path | \Driver\Disk |
| `Target` | Target path (for symbolic links) | |
| `Type` | Object type | Device |
| `Path` | Object path | \Device\HarddiskVolume3 |
| `Target` | Target path (for symbolic links) | |
| `Type` | Object type | SymbolicLink |
| `Path` | Object path | \Global??\C: |
| `Target` | Target path | \Device\HarddiskVolume3 |
## Collection Method
This collector uses kernel driver IOCTL calls:
- `IoctlCreateObjectDirectorySnapshot` to snapshot the directory
- `IoctlEnumObjectDirectorySnapshot` to enumerate objects
- Processes three directories: `\Driver`, `\Device`, `\Global??`
- Creates separate tables for each directory
## Forensic Value
Object directory enumeration helps detect kernel-level threats and hidden devices. Investigators use this data to identify hidden or suspicious drivers, detect rootkit device objects, track symbolic link manipulation, identify unusual kernel objects, verify driver object presence, and correlate with loaded driver enumeration.
---
# OfficeMRU
> Source: https://kb.binalyze.ai/air/features/acquisition/supported-evidence/windows-collections-detail/officemru.html
## Overview
**Evidence:** OfficeMRU
**Description:** Enumerate OfficeMRU
**Category:** System
**Platform:** windows
**Short Name:** officemru
**Is Parsed:** Yes
**Sent to Investigation Hub:** Yes
**Collect File(s):** No
## Background
Microsoft Office applications maintain Most Recently Used (MRU) lists of documents that users have opened. These lists are stored in the user's registry and include file paths and access timestamps embedded in the registry value data.
Office MRU can reveal which documents users were working with, including documents on network shares, removable drives, and deleted files.
## Data Collected
This collector gathers structured data about officemru.
### OfficeMRU Data
| Field | Description | Example |
|-------|-------------|---------|
| `Path` | Document file path | C:\Users\user\Documents\report.docx |
| `OpenedOn` | When file was opened | 2023-10-15T14:30:00 |
| `Value` | Registry value name | Item 1 |
| `Username` | User account name | user |
| `KeyPath` | Registry key path | Software\Microsoft\Office\16.0\Word\File MRU |
| `LastWriteTime` | Registry key last write time | 2023-10-15T14:30:00 |
| `RegPath` | Path to registry hive | Registry/ntuser.dat |
## Collection Method
This collector:
- Collects user registry hives (ntuser.dat)
- Searches for Office MRU keys:
- `Software\Microsoft\Office\*\*\File MRU`
- `Software\Microsoft\Office\*\*\Place MRU`
- `Software\Microsoft\Office\*\*\User MRU\*\File MRU`
- `Software\Microsoft\Office\*\*\User MRU\*\Place MRU`
- Parses value data to extract file paths and timestamps
- Decodes embedded FILETIME values from registry data
The registry value format: `[F00000000][T01D7A5B69601F2E0]*C:\path\to\file.docx`
## Forensic Value
Office MRU provides evidence of document access and user activity with Office files. Investigators use this data to identify recently accessed sensitive documents, track document access on network shares, establish document access timelines, detect access to deleted documents, identify documents of interest, correlate with file system artifacts, and prove user interaction with specific files.
---
# Old Registry Hives
> Source: https://kb.binalyze.ai/air/features/acquisition/supported-evidence/windows-collections-detail/old-registry-hives.html
## Overview
**Evidence:** Old Registry Hives
**Description:** Dump old registry hives in upgraded operating systems
**Category:** System
**Platform:** windows
**Short Name:** hivold
**Is Parsed:** No
**Sent to Investigation Hub:** Yes
**Collect File(s):** Yes
## Background
When Windows is upgraded to a new version, the old Windows installation is preserved in the `Windows.old` folder. This includes the old registry hives from the previous Windows installation.
Old registry hives can contain valuable historical information about system configuration, user activity, and installed applications from before the upgrade.
## Data Collected
This collector gathers structured data about old registry hives.
### Old Registry Hives Data
| Field | Description | Example |
|-------|-------------|---------|
| `RegPath` | Registry path | \REGISTRY\MACHINE\SYSTEM |
| `FilePath` | Relative path in evidence | Registry/SYSTEM.old |
| `FileSize` | Size of the hive file in bytes | 12582912 |
| `FileModified` | Last modified timestamp | 2023-10-15T14:30:00 |
| `FileAccessed` | Last accessed timestamp | 2023-10-15T15:45:00 |
| `FileCreated` | Creation timestamp | 2023-10-01T10:00:00 |
| `Hash` | Hash of the hive file | SHA256:a1b2c3... |
## Collection Method
This collector gathers old registry hives from:
- `Windows.old\Windows\System32\config\*` - Old system hives
- Transaction logs (.log, .log1, .log2) for each old hive
- Old backup copies from `Windows.old\Windows\System32\config\RegBack`
The old hives are collected alongside current hives by the Registry collector.
## Forensic Value
Old registry hives provide historical system state from before a Windows upgrade. Investigators use this data to analyze pre-upgrade system configuration, recover deleted artifacts from before upgrade, compare current vs previous configuration, track changes across Windows upgrades, and investigate incidents that occurred before the upgrade.
---
# OneDrive Logs
> Source: https://kb.binalyze.ai/air/features/acquisition/supported-evidence/windows-collections-detail/onedrive-logs.html
## Overview
**Evidence:** OneDrive Logs
**Description:** Collect OneDrive Logs
**Category:** Applications
**Platform:** windows
**Short Name:** ondrvls
**Is Parsed:** No
**Sent to Investigation Hub:** No
**Collect File(s):** Yes
## Background
Microsoft OneDrive maintains comprehensive logs of synchronization activities, errors, and file operations. These logs track uploads, downloads, conflicts, and sync events for OneDrive and OneDrive for Business.
## Data Collected
This collector gathers structured data about onedrive logs.
## Collection Method
This collector gathers OneDrive log directories from both OneDrive and Windows OneDrive locations in Local AppData.
## Forensic Value
OneDrive logs reveal file synchronization activities, uploads to cloud storage, downloads, sharing events, and sync errors. This is essential for investigating data exfiltration to Microsoft cloud storage, identifying synchronized sensitive files, and establishing timelines for cloud storage activities.
---
# OpenSavePidlMRU
> Source: https://kb.binalyze.ai/air/features/acquisition/supported-evidence/windows-collections-detail/opensavepidlmru.html
## Overview
**Evidence:** OpenSavePidlMRU
**Description:** Enumerate OpenSavePidlMRU
**Category:** System
**Platform:** windows
**Short Name:** opnsvpidmru
**Is Parsed:** Yes
**Sent to Investigation Hub:** Yes
**Collect File(s):** No
## Background
OpenSavePidlMRU tracks folders and files accessed through Windows common file dialogs (Open/Save), organized by file extension. When users open or save files, Windows records the accessed locations in this registry artifact.
This provides detailed evidence of file operations, showing which folders users navigated to when working with specific file types.
## Data Collected
This collector gathers structured data about opensavepidlmru.
### OpenSavePidlMRU Data
| Field | Description | Example |
|-------|-------------|---------|
| `KeyPath` | Registry key path | Software\Microsoft\Windows\CurrentVersion\Explorer\ComDlg32\OpenSavePidlMRU\.docx |
| `LastWriteTime` | Registry key last write time | 2023-10-15T14:30:00 |
| `Value` | MRU value name | 0 |
| `Username` | User account name | user |
| `Extension` | File extension | .docx |
| `Path` | Full path accessed | C:\Users\user\Documents\Confidential\report.docx |
| `MRUPosition` | Position in MRU list | 0 |
| `RegPath` | Path to registry hive | Registry/ntuser.dat |
## Collection Method
This collector:
- Collects user registry hives (ntuser.dat)
- Searches for: `Software\Microsoft\Windows\CurrentVersion\Explorer\ComDlg32\OpenSavePidlMRU\*`
- For each extension subdirectory, parses MRUListEx
- Decodes shell item data using libfwsi
- Reconstructs full paths from shell item lists
- Orders by MRU position per extension
## Forensic Value
OpenSavePidlMRU provides granular evidence of file dialog activity organized by file type. Investigators use this data to identify files accessed via dialogs, track file operations by extension, detect access to sensitive documents, establish file access timelines, prove user interaction with specific files, correlate with application usage, and identify files on disconnected drives.
---
# OpenVPN Config
> Source: https://kb.binalyze.ai/air/features/acquisition/supported-evidence/windows-collections-detail/openvpn-config.html
## Overview
**Evidence:** OpenVPN Config
**Description:** Collect OpenVPN Config Files
**Category:** Applications
**Platform:** windows
**Short Name:** ovpn
**Is Parsed:** No
**Sent to Investigation Hub:** No
**Collect File(s):** Yes
## Background
OpenVPN stores VPN configuration files (.ovpn) containing server addresses, authentication details, encryption settings, and connection parameters. These configurations establish secure tunnels to remote networks.
## Data Collected
This collector gathers structured data about openvpn config.
## Collection Method
This collector gathers the OpenVPN config directory containing VPN configuration files and certificates.
## Forensic Value
OpenVPN configurations reveal VPN servers accessed, remote networks connected to, and connection details. This helps identify remote access patterns, data exfiltration channels, and connections to suspicious networks or locations.
---
# Opera Bookmarks
> Source: https://kb.binalyze.ai/air/features/acquisition/supported-evidence/windows-collections-detail/opera-bookmarks.html
## Overview
**Evidence:** Opera Bookmarks
**Description:** Collect Opera Bookmarks
**Category:** Applications
**Platform:** windows
**Short Name:** obkmrks
**Is Parsed:** Yes
**Sent to Investigation Hub:** Yes
**Collect File(s):** No
## Background
Browser bookmarks represent user-saved favorite websites and organizational folders. This data reveals frequently accessed sites, user interests, and potential indicators of reconnaissance, phishing targets, or suspicious infrastructure.
## Data Collected
This collector gathers structured data about opera bookmarks.
### Opera Bookmarks Data
| Field | Description | Example |
|-------|-------------|---------|
| `UserName` | User Name | Example value |
| `ProfileName` | Profile Name | Example value |
| `BrowserName` | Browser Name | Example value |
| `GUID` | GUID | Example value |
| `BookmarkID` | Bookmark ID | Example value |
| `Name` | Name | Example value |
| `Type` | Type | Example value |
| `URL` | URL | Example value |
| `ParentFolder` | Parent Folder | Example value |
| `DateAdded` | Date Added | 2023-10-15 14:30:25+03:00 |
| `DateLastUsed` | Date Last Used | 2023-10-15 14:30:25+03:00 |
| `DateModified` | Date Modified | 2023-10-15 14:30:25+03:00 |
## Collection Method
This collector parses the browser's Bookmarks file to extract saved URLs, folder structures, timestamps, and metadata.
## Forensic Value
Bookmark analysis identifies targeted websites, phishing pages, command-and-control servers, internal resources, and organizational reconnaissance patterns. Investigators can detect social engineering campaigns, credential harvesting attempts, and lateral movement preparation.
---
# Opera Browsing History
> Source: https://kb.binalyze.ai/air/features/acquisition/supported-evidence/windows-collections-detail/opera-browsing-history.html
## Overview
**Evidence:** Opera Browsing History
**Description:** Collect Visited URLs from Opera
**Category:** Applications
**Platform:** windows
**Short Name:** ohst
**Is Parsed:** Yes
**Sent to Investigation Hub:** Yes
**Collect File(s):** No
## Background
Browser history records all websites visited by users, including URLs, page titles, visit timestamps, visit counts, and transition types. This data is essential for reconstructing user activity, identifying malicious websites, and tracking lateral movement or reconnaissance activities.
## Data Collected
This collector gathers structured data about opera browsing history.
### Opera Browsing History Data
| Field | Description | Example |
|-------|-------------|---------|
| `AccessTime` | Access Time | 2023-10-15 14:30:25+03:00 |
| `AccessCount` | Access Count | 123 |
| `URL` | URL | Example value |
| `Browser` | Browser | Example value |
| `Title` | Title | Example value |
| `VisitDuration` | Visit Duration | Example value |
| `Referrer` | Referrer | Example value |
| `TypedCount` | Typed Count | 123 |
| `IsHidden` | Is Hidden | true |
| `TransitionType` | Transition Type | Example value |
| `VisitID` | Visit ID | 123 |
| `TransitionQualifiers` | Transition Qualifiers | Example value |
| `User` | User | Example value |
| `Profile` | Profile | Example value |
| `HistoryFilePath` | History File Path | Example value |
## Collection Method
This collector queries the browser's History database to extract visited URLs, timestamps, referrer information, and user interaction patterns.
## Forensic Value
Browsing history reveals phishing sites, malicious domains, command-and-control servers, data exfiltration targets, and reconnaissance activities. Analysts can identify compromised credentials, track attacker infrastructure, and correlate web activity with other security events to establish attack timelines.
---
# Opera Cookies
> Source: https://kb.binalyze.ai/air/features/acquisition/supported-evidence/windows-collections-detail/opera-cookies.html
## Overview
**Evidence:** Opera Cookies
**Description:** Collect Opera Cookies
**Category:** Applications
**Platform:** windows
**Short Name:** ocookies
**Is Parsed:** Yes
**Sent to Investigation Hub:** Yes
**Collect File(s):** No
## Background
Browser cookies store session tokens, authentication credentials, user preferences, and tracking data. This data is essential for understanding authenticated sessions, tracking user activity across websites, and identifying session hijacking or credential theft.
## Data Collected
This collector gathers structured data about opera cookies.
### Opera Cookies Data
| Field | Description | Example |
|-------|-------------|---------|
| `UserName` | User Name | Example value |
| `BrowserName` | Browser Name | Example value |
| `ProfileName` | Profile Name | Example value |
| `Domain` | Domain | Example value |
| `Name` | Name | Example value |
| `Path` | Path | Example value |
| `Value` | Value | Example value |
| `IsSecure` | Is Secure | 123 |
| `IsHTTPOnly` | Is HTTP Only | 123 |
| `HasExpires` | Has Expires | 123 |
| `IsPersistent` | Is Persistent | 123 |
| `Priority` | Priority | 123 |
| `SameSite` | Same Site | 123 |
| `SourcePort` | Source Port | 123 |
| `SourceScheme` | Source Scheme | 123 |
| `CreationTime` | Creation Time | 2023-10-15 14:30:25+03:00 |
| `ExpiresTime` | Expires Time | 2023-10-15 14:30:25+03:00 |
| `LastAccessTime` | Last Access Time | 2023-10-15 14:30:25+03:00 |
## Collection Method
This collector extracts cookies from the browser's Cookies database, including domain, name, value, path, expiration, and security flags.
## Forensic Value
Cookie analysis reveals active sessions, authentication tokens, persistent tracking identifiers, and potential session hijacking. Investigators can identify stolen credentials, unauthorized access, and cross-site tracking used for reconnaissance or targeting.
---
# Opera Downloads
> Source: https://kb.binalyze.ai/air/features/acquisition/supported-evidence/windows-collections-detail/opera-downloads.html
## Overview
**Evidence:** Opera Downloads
**Description:** Collect Opera Downloads
**Category:** Applications
**Platform:** windows
**Short Name:** odwnlds
**Is Parsed:** Yes
**Sent to Investigation Hub:** Yes
**Collect File(s):** No
## Background
Browser download history records files downloaded by users, including file paths, timestamps, URLs, referrer information, and download status. This data is essential for tracking file acquisition, identifying potentially malicious downloads, and reconstructing user activity timelines.
## Data Collected
This collector gathers structured data about opera downloads.
### Opera Downloads Data
| Field | Description | Example |
|-------|-------------|---------|
| `UserName` | User Name | Example value |
| `Browser` | Browser | Example value |
| `ProfileName` | Profile Name | Example value |
| `URL` | URL | Example value |
| `TargetPath` | Target Path | Example value |
| `CurrentPath` | Current Path | Example value |
| `Referrer` | Referrer | Example value |
| `LastModified` | Last Modified | 2023-10-15 14:30:25+03:00 |
| `DangerType` | Danger Type | 123 |
| `Opened` | Opened | 123 |
| `TabURL` | Tab URL | Example value |
| `TabReferrerURL` | Tab Referrer URL | Example value |
| `StartTime` | Start Time | 2023-10-15 14:30:25+03:00 |
| `EndTime` | End Time | 2023-10-15 14:30:25+03:00 |
| `HistoryFilePath` | History File Path | Example value |
## Collection Method
This collector queries the browser's History database to extract download records, including file paths, download times, source URLs, and security flags.
## Forensic Value
Download history reveals malware delivery vectors, data exfiltration attempts, unauthorized software installation, and user interaction with suspicious websites. Analysts can identify downloaded malicious files, track attack chains, and correlate downloads with other security events.
---
# Opera Extensions
> Source: https://kb.binalyze.ai/air/features/acquisition/supported-evidence/windows-collections-detail/opera-extensions.html
## Overview
**Evidence:** Opera Extensions
**Description:** Collect Opera Extensions
**Category:** Applications
**Platform:** windows
**Short Name:** oext
**Is Parsed:** Yes
**Sent to Investigation Hub:** Yes
**Collect File(s):** No
## Data Collected
This collector gathers structured data about opera extensions.
---
# Opera Favicons
> Source: https://kb.binalyze.ai/air/features/acquisition/supported-evidence/windows-collections-detail/opera-favicons.html
## Overview
**Evidence:** Opera Favicons
**Description:** Collect Opera Favicons
**Category:** Applications
**Platform:** windows
**Short Name:** ofico
**Is Parsed:** Yes
**Sent to Investigation Hub:** Yes
**Collect File(s):** No
## Background
Browser favicons are cached website icons that provide visual history of visited sites. This data supplements browsing history by revealing sites accessed even if history was deleted.
## Data Collected
This collector gathers structured data about opera favicons.
### Opera Favicons Data
| Field | Description | Example |
|-------|-------------|---------|
| `ID` | ID | 123 |
| `UserName` | User Name | Example value |
| `BrowserName` | Browser Name | Example value |
| `Profile` | Profile | Example value |
| `URL` | URL | Example value |
| `IconType` | Icon Type | 123 |
| `Path` | Path | Example value |
## Collection Method
This collector queries the browser's Favicons database to extract cached website icons and associated URLs.
## Forensic Value
Favicon analysis can recover evidence of deleted browsing history, identify visited sites through icon fingerprinting, and correlate with other browser artifacts to establish comprehensive activity timelines.
---
# Opera Form History
> Source: https://kb.binalyze.ai/air/features/acquisition/supported-evidence/windows-collections-detail/opera-form-history.html
## Overview
**Evidence:** Opera Form History
**Description:** Collect Opera Form History
**Category:** Applications
**Platform:** windows
**Short Name:** ofh
**Is Parsed:** Yes
**Sent to Investigation Hub:** Yes
**Collect File(s):** No
## Background
Browser form history stores previously entered form data including search queries, usernames, and other input fields. This data reveals user search patterns, account information, and potential data leakage through autofill.
## Data Collected
This collector gathers structured data about opera form history.
### Opera Form History Data
| Field | Description | Example |
|-------|-------------|---------|
| `UserName` | User Name | Example value |
| `BrowserName` | Browser Name | Example value |
| `Name` | Name | Example value |
| `Value` | Value | Example value |
| `ValueLower` | Value Lower | Example value |
| `Count` | Count | 123 |
| `Profile` | Profile | Example value |
| `Path` | Path | Example value |
| `DateCreated` | Date Created | 2023-10-15 14:30:25+03:00 |
| `DateLastUsed` | Date Last Used | 2023-10-15 14:30:25+03:00 |
## Collection Method
This collector queries the browser's form history database to extract saved form field data, search queries, and associated timestamps.
## Forensic Value
Form history exposes reconnaissance activities, credential enumeration attempts, search queries revealing attacker intent, and potentially sensitive information entered into web forms. Analysts can identify data exfiltration, account compromise indicators, and targeted search patterns.
---
# Opera Local Storage
> Source: https://kb.binalyze.ai/air/features/acquisition/supported-evidence/windows-collections-detail/opera-local-storage.html
## Overview
**Evidence:** Opera Local Storage
**Description:** Collect Opera Local Storage
**Category:** Applications
**Platform:** windows
**Short Name:** ols
**Is Parsed:** Yes
**Sent to Investigation Hub:** Yes
**Collect File(s):** No
## Background
Browser local storage contains persistent key-value data stored by websites. This data includes user preferences, session state, cached data, and potentially authentication tokens or sensitive information.
## Data Collected
This collector gathers structured data about opera local storage.
### Opera Local Storage Data
| Field | Description | Example |
|-------|-------------|---------|
| `UserName` | User Name | Example value |
| `ProfileName` | Profile Name | Example value |
| `BrowserName` | Browser Name | Example value |
| `Key` | Key | Example value |
| `Value` | Value | Example value |
| `Path` | Path | Example value |
## Collection Method
This collector extracts local storage data from browser storage databases and files.
## Forensic Value
Local storage analysis reveals stored credentials, session tokens, tracking identifiers, and application state that can indicate compromised accounts, persistent tracking, or malicious website activity. Analysts can identify credential theft, session hijacking, and data exfiltration attempts.
---
# Opera Login Data
> Source: https://kb.binalyze.ai/air/features/acquisition/supported-evidence/windows-collections-detail/opera-login-data.html
## Overview
**Evidence:** Opera Login Data
**Description:** Collect Opera Login Data
**Category:** Applications
**Platform:** windows
**Short Name:** olgd
**Is Parsed:** Yes
**Sent to Investigation Hub:** Yes
**Collect File(s):** No
## Background
Browser login data stores saved passwords and credential information. This data is critical for identifying stored credentials, password reuse patterns, and potential credential theft targets.
## Data Collected
This collector gathers structured data about opera login data.
### Opera Login Data Data
| Field | Description | Example |
|-------|-------------|---------|
| `ID` | ID | 123 |
| `UserName` | User Name | Example value |
| `BrowserName` | Browser Name | Example value |
| `OriginURL` | Origin URL | Example value |
| `SignonRealm` | Signon Realm | Example value |
| `BlacklistedByUser` | Blacklisted By User | 123 |
| `Scheme` | Scheme | Example value |
| `PasswordType` | Password Type | Example value |
| `TimesUsed` | Times Used | 123 |
| `Profile` | Profile | Example value |
| `Path` | Path | Example value |
| `DateCreated` | Date Created | 2023-10-15 14:30:25+03:00 |
| `DateLastUsed` | Date Last Used | 2023-10-15 14:30:25+03:00 |
## Collection Method
This collector extracts saved credentials from the browser's Login Data database, including URLs, usernames, and encrypted passwords.
## Forensic Value
Login data analysis reveals stored credentials, password reuse across services, targeted accounts, and potential credential harvesting. Investigators can identify compromised accounts, credential theft attempts, and unauthorized access to saved credentials by malware or attackers.
---
# Opera Sessions
> Source: https://kb.binalyze.ai/air/features/acquisition/supported-evidence/windows-collections-detail/opera-sessions.html
## Overview
**Evidence:** Opera Sessions
**Description:** Collect Opera Sessions
**Category:** Applications
**Platform:** windows
**Short Name:** opss
**Is Parsed:** Yes
**Sent to Investigation Hub:** Yes
**Collect File(s):** No
## Background
Browser sessions maintain active tab state, cookies, and authentication context. This data reveals currently active user sessions, open websites, and authenticated connections at the time of collection.
## Data Collected
This collector gathers structured data about opera sessions.
### Opera Sessions Data
| Field | Description | Example |
|-------|-------------|---------|
| `ID` | ID | 123 |
| `WindowID` | Window ID | 123 |
| `Active` | Active | true |
| `Url` | Url | Example value |
| `Title` | Title | Example value |
| `Deleted` | Deleted | true |
| `Group` | Group | Example value |
| `History` | History | [] |
| `BrowserName` | Browser Name | Example value |
## Collection Method
This collector captures browser session data including active tabs, session cookies, and authentication state.
## Forensic Value
Session analysis identifies active compromises, authenticated sessions to malicious sites, concurrent suspicious activities, and real-time indicators of ongoing attacks. Analysts can detect active C2 connections, authenticated malware communications, and live attacker sessions.
---
# Opera Thumbnails
> Source: https://kb.binalyze.ai/air/features/acquisition/supported-evidence/windows-collections-detail/opera-thumbnails.html
## Overview
**Evidence:** Opera Thumbnails
**Description:** Collect Opera Thumbnails
**Category:** Applications
**Platform:** windows
**Short Name:** othmb
**Is Parsed:** Yes
**Sent to Investigation Hub:** Yes
**Collect File(s):** No
## Background
Browser thumbnails are cached preview images of visited websites. This visual data supplements browsing history by providing screenshots of accessed pages, useful for recovering deleted history and identifying visited content.
## Data Collected
This collector gathers structured data about opera thumbnails.
### Opera Thumbnails Data
| Field | Description | Example |
|-------|-------------|---------|
| `UserName` | User Name | Example value |
| `Browser` | Browser | Example value |
| `URL` | URL | Example value |
| `URLRank` | URL Rank | 123 |
| `Title` | Title | Example value |
| `Profile` | Profile | Example value |
| `Path` | Path | Example value |
## Collection Method
This collector extracts cached thumbnail images from browser storage.
## Forensic Value
Thumbnail analysis provides visual evidence of visited websites, can recover evidence after history deletion, and helps identify phishing pages, malicious sites, or sensitive internal resources accessed by users through visual inspection.
---
# Opera User Profiles
> Source: https://kb.binalyze.ai/air/features/acquisition/supported-evidence/windows-collections-detail/opera-user-profiles.html
## Overview
**Evidence:** Opera User Profiles
**Description:** Collect Opera User Profiles
**Category:** Applications
**Platform:** windows
**Short Name:** oprfls
**Is Parsed:** Yes
**Sent to Investigation Hub:** Yes
**Collect File(s):** No
## Background
Browser user profiles store per-user browser configurations, extensions, settings, and data segregation. This data reveals multiple user accounts, profile switching patterns, and user-specific browsing behavior.
## Data Collected
This collector gathers structured data about opera user profiles.
### Opera User Profiles Data
| Field | Description | Example |
|-------|-------------|---------|
| `EndpointUserName` | Endpoint User Name | Example value |
| `Profile` | Profile | Example value |
| `ProfileUserName` | Profile User Name | Example value |
| `BrowserName` | Browser Name | Example value |
| `BackgroundApps` | Background Apps | true |
| `GoogleAccountGivenName` | Google Account Given Name | Example value |
| `GoogleAccountID` | Google Account ID | Example value |
| `GoogleAccountName` | Google Account Name | Example value |
| `PictureFileName` | Picture File Name | Example value |
| `LastDownloadedPictureURL` | Last Downloaded Picture URL | Example value |
| `HostedDomain` | Hosted Domain | Example value |
| `IsConsentedPrimaryAccount` | Is Consented Primary Account | true |
| `IsEphemeral` | Is Ephemeral | true |
## Collection Method
This collector enumerates browser user profiles and extracts profile metadata, configurations, and associated data paths.
## Forensic Value
Profile analysis identifies multiple user accounts, profile-specific extensions and configurations, shared device usage patterns, and potential privilege escalation or lateral movement using different browser profiles. Investigators can correlate activity across profiles and identify unauthorized profile creation.
---
# Opera Web Storage
> Source: https://kb.binalyze.ai/air/features/acquisition/supported-evidence/windows-collections-detail/opera-web-storage.html
## Overview
**Evidence:** Opera Web Storage
**Description:** Collect Opera Web Storage
**Category:** Applications
**Platform:** windows
**Short Name:** ows
**Is Parsed:** Yes
**Sent to Investigation Hub:** Yes
**Collect File(s):** No
## Background
Browser web storage includes both local and session storage used by websites to store client-side data. This data can contain application state, user preferences, cached content, and potentially sensitive information.
## Data Collected
This collector gathers structured data about opera web storage.
### Opera Web Storage Data
| Field | Description | Example |
|-------|-------------|---------|
| `UserName` | User Name | Example value |
| `ProfileName` | Profile Name | Example value |
| `BrowserName` | Browser Name | Example value |
| `Key` | Key | Example value |
| `Value` | Value | Example value |
| `Path` | Path | Example value |
## Collection Method
This collector extracts web storage data from browser storage locations including local storage and session storage.
## Forensic Value
Web storage analysis reveals cached application data, stored credentials, session information, and potential data exfiltration staging. Analysts can identify malicious website activity, stored authentication tokens, tracking identifiers, and sensitive data cached by compromised web applications.
---
# Page File
> Source: https://kb.binalyze.ai/air/features/acquisition/supported-evidence/windows-collections-detail/page-file.html
## Overview
**Evidence:** Page File
**Description:** Dump system page file
**Category:** Memory
**Platform:** windows
**Short Name:** pgf
**Is Parsed:** No
**Sent to Investigation Hub:** Yes
**Collect File(s):** Yes
## Background
The Windows page file (pagefile.sys) is used by the virtual memory manager to swap memory pages to disk when physical RAM is full. The pagefile can contain remnants of process memory including credentials, encryption keys, and other sensitive data that was paged out.
The pagefile persists across reboots (unless configured to clear) and can contain historical memory artifacts.
## Data Collected
This collector gathers structured data about page file.
### Page File Data
| Field | Description | Example |
|-------|-------------|---------|
| `Type` | File type | PageFile |
| `Name` | File name | pagefile.sys |
| `SourcePath` | Original file path | C:\pagefile.sys |
| `FilePath` | Relative path in evidence | Files/pagefile.sys |
| `FileSize` | File size in bytes | 8589934592 |
## Collection Method
This collector collects the pagefile from:
- `C:\pagefile.sys` (default location)
The file is collected using driver or NTFS raw access if the file is locked by the system.
## Forensic Value
Pagefiles can contain sensitive data that was swapped out of RAM. Investigators use this data for memory forensics and credential recovery, searching for passwords and keys, extracting process memory remnants, recovering network communication data, and identifying malware memory artifacts.
---
# Palo Alto Logs
> Source: https://kb.binalyze.ai/air/features/acquisition/supported-evidence/windows-collections-detail/palo-alto-logs.html
## Overview
**Evidence:** Palo Alto Logs
**Description:** Collect Palo Alto Logs
**Category:** Applications
**Platform:** windows
**Short Name:** plltl
**Is Parsed:** No
**Sent to Investigation Hub:** No
**Collect File(s):** Yes
## Background
Palo Alto Traps (formerly Cyvera) is an endpoint protection platform that prevents exploits and malware through advanced threat prevention. It maintains detailed logs of security events, blocked exploits, and threat intelligence.
## Data Collected
This collector gathers structured data about palo alto logs.
## Collection Method
This collector gathers Palo Alto Traps log files from the Cyvera directory in ProgramData, which contains comprehensive endpoint protection event data.
## Forensic Value
Palo Alto logs are critical for investigating exploit attempts, malware execution prevention, and advanced threat activities. They provide visibility into blocked attacks and help understand the threat landscape targeting the endpoint.
---
# Parse LNK Files
> Source: https://kb.binalyze.ai/air/features/acquisition/supported-evidence/windows-collections-detail/parse-lnk-files.html
## Overview
**Evidence:** Parse LNK Files
**Description:** Parse LNK Files
**Category:** System
**Platform:** windows
**Short Name:** lnks
**Is Parsed:** Yes
**Sent to Investigation Hub:** Yes
**Collect File(s):** No
## Background
Parsing Windows shortcut (.lnk) files reveals target paths, timestamps, and execution parameters. This data is essential for confirming program launches and file access.
## Data Collected
This collector gathers structured data about parse lnk files.
## Collection Method
This collector walks common paths, parses .lnk files using a structured parser, and records target metadata and LNK metadata into `lnk_files`.
## Forensic Value
This evidence is crucial for forensic investigations as .lnk contents provide strong traces of user actions and program execution.
---
# Parse SRUM Application Timeline
> Source: https://kb.binalyze.ai/air/features/acquisition/supported-evidence/windows-collections-detail/parse-srum-application-timeline.html
## Overview
**Evidence:** Parse SRUM Application Timeline
**Description:** Parse System Resource Usage Monitor (SRUM) Application Timeline data.
**Category:**
**Platform:** windows
**Short Name:** srumtimeparse
**Is Parsed:** No
**Sent to Investigation Hub:** Yes
**Collect File(s):** No
## Data Collected
This collector gathers structured data about parse srum application timeline.
### Parse SRUM Application Timeline Data
| Field | Description | Example |
|-------|-------------|---------|
| `AutoIncId` | Auto-increment ID from SRUM database | 123 |
| `Timestamp` | Timestamp | 2023-10-15 14:30:25 |
| `InFocusTimestamp` | In Focus Timestamp | 2023-10-15 14:30:25 |
| `UserInputTimestamp` | User Input Timestamp | 2023-10-15 14:30:25 |
| `InFocusS` | In Focus S | 123 |
| `PSMForegroundS` | PSM Foreground S | 123 |
| `UserInputS` | User Input S | DOMAIN\User |
| `InFocusTransitions` | In Focus Transitions | 123 |
| `AppName` | App Name | Example Name |
| `UserSid` | Windows SID in S-1-5-... format (from SRUM IdMapTable) | S-1-5-21-... |
| `UserName` | Resolved username via Windows API (LookupAccountSidW) | Example Name |
---
# Parse SRUM Application Usage
> Source: https://kb.binalyze.ai/air/features/acquisition/supported-evidence/windows-collections-detail/parse-srum-application-usage.html
## Overview
**Evidence:** Parse SRUM Application Usage
**Description:** Parse System Resource Usage Monitor (SRUM) Application Resource Usage data.
**Category:**
**Platform:** windows
**Short Name:** srumappparse
**Is Parsed:** No
**Sent to Investigation Hub:** Yes
**Collect File(s):** No
## Data Collected
This collector gathers structured data about parse srum application usage.
### Parse SRUM Application Usage Data
| Field | Description | Example |
|-------|-------------|---------|
| `AutoIncId` | Auto-increment ID from SRUM database | 123 |
| `Timestamp` | Timestamp | 2023-10-15 14:30:25 |
| `ApplicationName` | Application Name | Example Name |
| `UserSid` | Windows SID in S-1-5-... format (from SRUM IdMapTable) | S-1-5-21-... |
| `UserName` | Resolved username via Windows API (LookupAccountSidW) | Example Name |
| `ForegroundCycleTime` | Foreground Cycle Time | 2023-10-15 14:30:25 |
| `BackgroundCycleTime` | Background Cycle Time | 2023-10-15 14:30:25 |
| `Facetime` | Facetime | 2023-10-15 14:30:25 |
| `ForegroundContextSwitches` | Foreground Context Switches | 123 |
| `BackgroundContextSwitches` | Background Context Switches | 123 |
| `ForegroundBytesRead` | Foreground Bytes Read | 1024 |
| `ForegroundBytesWritten` | Foreground Bytes Written | 1024 |
| `ForegroundNumReadOperations` | Foreground Num Read Operations | 123 |
| `ForegroundNumWriteOperations` | Foreground Num Write Operations | 123 |
| `ForegroundNumberOfFlushes` | Foreground Number Of Flushes | 123 |
| `BackgroundBytesRead` | Background Bytes Read | 1024 |
| `BackgroundBytesWritten` | Background Bytes Written | 1024 |
| `BackgroundNumReadOperations` | Background Num Read Operations | 123 |
| `BackgroundNumWriteOperations` | Background Num Write Operations | 123 |
| `BackgroundNumberOfFlushes` | Background Number Of Flushes | 123 |
---
# Parse SRUM Energy Usage
> Source: https://kb.binalyze.ai/air/features/acquisition/supported-evidence/windows-collections-detail/parse-srum-energy-usage.html
## Overview
**Evidence:** Parse SRUM Energy Usage
**Description:** Parse System Resource Usage Monitor (SRUM) Energy Usage data.
**Category:**
**Platform:** windows
**Short Name:** srumengparse
**Is Parsed:** No
**Sent to Investigation Hub:** Yes
**Collect File(s):** No
## Data Collected
This collector gathers structured data about parse srum energy usage.
### Parse SRUM Energy Usage Data
| Field | Description | Example |
|-------|-------------|---------|
| `AutoIncId` | Auto-increment ID from SRUM database | 123 |
| `Timestamp` | Timestamp | 2023-10-15 14:30:25 |
| `EventTimestamp` | Event Timestamp | 2023-10-15 14:30:25 |
| `StateTransition` | State Transition | 123 |
| `FullChargedCapacity` | Full Charged Capacity | 123 |
| `DesignedCapacity` | Designed Capacity | 123 |
| `ChargeLevel` | Charge Level | 123 |
| `CycleCount` | Cycle Count | 10 |
| `ConfigurationHash` | Configuration Hash | Example value |
---
# Parse SRUM Network Connectivity
> Source: https://kb.binalyze.ai/air/features/acquisition/supported-evidence/windows-collections-detail/parse-srum-network-connectivity.html
## Overview
**Evidence:** Parse SRUM Network Connectivity
**Description:** Parse System Resource Usage Monitor (SRUM) Network Connectivity Usage data.
**Category:**
**Platform:** windows
**Short Name:** srumnetconparse
**Is Parsed:** No
**Sent to Investigation Hub:** Yes
**Collect File(s):** No
## Data Collected
This collector gathers structured data about parse srum network connectivity.
### Parse SRUM Network Connectivity Data
| Field | Description | Example |
|-------|-------------|---------|
| `AutoIncId` | Auto-increment ID from SRUM database | 123 |
| `Timestamp` | Timestamp | 2023-10-15 14:30:25 |
| `InterfaceLuid` | LUID identifier | 123 |
| `L2ProfileId` | L2 Profile Id | 123 |
| `L2ProfileFlags` | L2 Profile Flags | 123 |
| `ConnectedTime` | Connected Time | 2023-10-15 14:30:25 |
| `ConnectStartTime` | Connect Start Time | 2023-10-15 14:30:25 |
---
# Parse SRUM Network Usage
> Source: https://kb.binalyze.ai/air/features/acquisition/supported-evidence/windows-collections-detail/parse-srum-network-usage.html
## Overview
**Evidence:** Parse SRUM Network Usage
**Description:** Parse System Resource Usage Monitor (SRUM) Network Data Usage.
**Category:**
**Platform:** windows
**Short Name:** srumnetparse
**Is Parsed:** No
**Sent to Investigation Hub:** Yes
**Collect File(s):** No
## Data Collected
This collector gathers structured data about parse srum network usage.
### Parse SRUM Network Usage Data
| Field | Description | Example |
|-------|-------------|---------|
| `AutoIncId` | Auto-increment ID from SRUM database | 123 |
| `Timestamp` | Timestamp | 2023-10-15 14:30:25 |
| `ApplicationName` | Application Name | Example Name |
| `UserSid` | Windows SID in S-1-5-... format (from SRUM IdMapTable) | S-1-5-21-... |
| `UserName` | Resolved username via Windows API (LookupAccountSidW) | Example Name |
| `InterfaceLuid` | LUID identifier | 123 |
| `L2ProfileId` | L2 Profile Id | 123 |
| `L2ProfileFlags` | L2 Profile Flags | 123 |
| `BytesSent` | Bytes Sent | 1024 |
| `BytesRecvd` | Bytes Recvd | 1024 |
---
# PDB Information
> Source: https://kb.binalyze.ai/air/features/acquisition/supported-evidence/windows-collections-detail/pdb-information.html
## Overview
**Evidence:** PDB Information
**Description:** Collect Program Database Information
**Category:** System
**Platform:** windows
**Short Name:** pdbinf
**Is Parsed:** Yes
**Sent to Investigation Hub:** Yes
**Collect File(s):** No
## Background
Program Database (PDB) files contain debugging symbols for compiled binaries. PE executables and DLLs embed references to their PDB files including the PDB file name, GUID, and age. This information is used by debuggers and crash analysis tools to load the correct symbols.
PDB information can be used to verify the authenticity of system binaries and detect malware that may have corrupted or replaced system files.
## Data Collected
This collector gathers structured data about pdb information.
### PDB Information Data
| Field | Description | Example |
|-------|-------------|---------|
| `Path` | Path to binary file | C:\Windows\System32\ntoskrnl.exe |
| `Name` | PDB file name | ntkrnlmp.pdb |
| `GUID` | PDB GUID identifier | 12345678-1234-1234-1234-123456789ABC |
| `Age` | PDB age value | 1 |
## Collection Method
This collector extracts PDB information from critical system binaries:
- `C:\Windows\System32\NTOSKRNL.EXE`
- `C:\Windows\System32\NTKRNLPA.EXE`
- `C:\Windows\System32\NTKRNLMP.EXE`
- `C:\Windows\System32\NTKRPAMP.EXE`
- `C:\Windows\System32\drivers\ntfs.sys`
- `C:\Windows\System32\HAL.dll`
- `C:\Windows\System32\ntdll.dll`
- `C:\Windows\SysWOW64\ntdll.dll`
- `C:\Windows\System32\kernel32.dll`
- `C:\Windows\SysWOW64\kernel32.dll`
For each binary, it parses the PE debug directory to extract CodeView PDB information.
## Forensic Value
PDB information helps verify system binary integrity and supports advanced debugging scenarios. Investigators use this data to verify system file authenticity, detect rootkit kernel modifications, identify mismatched system files, support crash dump analysis, validate OS patch levels, and correlate with symbol servers for verification.
---
# Powershell Logs
> Source: https://kb.binalyze.ai/air/features/acquisition/supported-evidence/windows-collections-detail/powershell-logs.html
## Overview
**Evidence:** Powershell Logs
**Description:** Collect Powershell Logs
**Category:** System
**Platform:** windows
**Short Name:** pwrs
**Is Parsed:** No
**Sent to Investigation Hub:** Yes
**Collect File(s):** Yes
## Background
PowerShell transcription creates detailed logs of PowerShell sessions including all commands executed and their output. Transcription must be enabled via Group Policy or registry settings.
When enabled, transcripts are saved as text files and contain complete records of PowerShell activity, making them extremely valuable for detecting malicious PowerShell usage.
## Data Collected
This collector gathers structured data about powershell logs.
### Powershell Logs Data
| Field | Description | Example |
|-------|-------------|---------|
| `Name` | Artifact name | Powershell Log |
| `Type` | File or Folder | Folder |
| `SourcePath` | Original path | C:\Transcripts\PowerShell_transcript.DESKTOP.abc123.20231015143000.txt |
| `Path` | Relative path in evidence | Other/PowerShell_transcript... |
## Collection Method
This collector:
- Reads the transcript output directory from registry:
- `HKLM\SOFTWARE\Policies\Microsoft\Windows\PowerShell\Transcription` - OutputDirectory value
- `HKCU\SOFTWARE\Policies\Microsoft\Windows\PowerShell\Transcription` - OutputDirectory value
- Collects all files from the configured transcript directories
## Forensic Value
PowerShell transcripts provide complete visibility into PowerShell command execution. Investigators use this data to identify malicious PowerShell commands, track attacker reconnaissance activities, detect PowerShell-based lateral movement, analyze encoded or obfuscated commands, and establish complete PowerShell activity timelines.
---
# Powershell ConsoleHost History
> Source: https://kb.binalyze.ai/air/features/acquisition/supported-evidence/windows-collections-detail/powershell-consolehost-history.html
## Overview
**Evidence:** Powershell ConsoleHost History
**Description:** Collect Powershell ConsoleHost History
**Category:** System
**Platform:** windows
**Short Name:** pwrshllchhst
**Is Parsed:** Yes
**Sent to Investigation Hub:** Yes
**Collect File(s):** No
## Background
PowerShell PSReadLine history records executed commands per user profile. This data is essential for detecting malicious command execution.
## Data Collected
This collector gathers structured data about powershell consolehost history.
## Collection Method
This collector locates ConsoleHost_history.txt files per user, copies them, and parses the tail for commands.
## Forensic Value
This evidence is crucial for forensic investigations as it reveals executed commands and potential attacker behavior.
---
# Prefetch Files
> Source: https://kb.binalyze.ai/air/features/acquisition/supported-evidence/windows-collections-detail/prefetch-files.html
## Overview
**Evidence:** Prefetch Files
**Description:** Collect Prefetch Files and Parse
**Category:** System
**Platform:** windows
**Short Name:** pf
**Is Parsed:** Yes
**Sent to Investigation Hub:** Yes
**Collect File(s):** Yes
## Background
Windows Prefetch is a memory management feature that speeds up application loading by caching information about programs and their dependencies. When a program is executed, Windows creates a .pf file in `C:\Windows\Prefetch` that tracks the files and directories accessed during the program's startup.
Prefetch files are valuable forensic artifacts because they provide evidence of program execution, even after the program has been deleted. Each prefetch file contains execution timestamps, run counts, and lists of files accessed by the application.
## Data Collected
This collector gathers structured data about prefetch files.
### Prefetch Files Data
| Field | Description | Example |
|-------|-------------|---------|
| `FilePath` | Path to prefetch file | Prefetch/CHROME.EXE-12345678.pf |
| `FileSize` | Size of prefetch file | 45678 |
| `FileModified` | Last modified timestamp | 2023-10-15T14:30:00 |
| `FileAccessed` | Last accessed timestamp | 2023-10-15T15:45:00 |
| `FileCreated` | Creation timestamp | 2023-10-01T10:00:00 |
| `PrefetchRowID` | Foreign key to prefetch file | 1 |
| `FileName` | Original executable name | CHROME.EXE |
| `FilePath` | Full path to executable | C:\Program Files\Google\Chrome\Application\chrome.exe |
| `RunCount` | Number of times executed | 42 |
| `PrefetchHash` | Prefetch hash value | 12345678 |
| `Version` | Prefetch file format version | 30 |
| `LastRunTime` | Array of last run timestamps (JSON) | ["2023-10-15T14:30:00Z","2023-10-14T09:15:00Z"...] |
| `PrefetchRowID` | Foreign key to prefetch file | 1 |
| `VolumeName` | Volume device name | \Device\HarddiskVolume3 |
| `Serial` | Volume serial number | 123456789 |
| `CreationTime` | Volume creation timestamp | 2023-01-01T00:00:00 |
| `PrefetchRowID` | Foreign key to prefetch file | 1 |
| `Path` | Path to referenced file | C:\Windows\System32\kernel32.dll |
## Collection Method
This collector:
- Collects all .pf files from `C:\Windows\Prefetch`
- Parses each prefetch file using libscca library
- Extracts execution timestamps, run counts, and file references
- Resolves volume information from embedded volume serials
- Maps prefetch hashes to executable paths
## Forensic Value
Prefetch files are essential for establishing program execution timelines and detecting malware execution. Investigators use this data to prove program execution, establish execution timelines, identify deleted malware, track portable executable usage, detect lateral movement tools, identify reconnaissance utilities, and correlate file access patterns with malicious activity.
---
# Running Processes and Modules
> Source: https://kb.binalyze.ai/air/features/acquisition/supported-evidence/windows-collections-detail/running-processes-and-modules.html
## Overview
**Evidence:** Running Processes and Modules
**Description:** Collect running processes and modules list
**Category:** System
**Platform:** windows
**Short Name:** pri
**Is Parsed:** Yes
**Sent to Investigation Hub:** Yes
**Collect File(s):** No
## Background
Windows processes are instances of executing programs. Each process has its own virtual memory space, security context, and system resources. Understanding running processes is fundamental to incident response and threat hunting.
The Process Environment Block (PEB) contains important process information including command line arguments, loaded modules, and environment variables. Windows maintains detailed information about each process including creation time, parent-child relationships, and security identifiers.
## Data Collected
This collector gathers structured data about running processes and modules.
### Running Processes and Modules Data
| Field | Description | Example |
|-------|-------------|---------|
| `ProcessID` | Process identifier | 1234 |
| `ParentID` | Parent process identifier | 5678 |
| `SessionID` | Session identifier | 1 |
| `Object` | Kernel object address | 0xFFFF8A8012345678 |
| `PEB` | Process Environment Block address | 0x000000007FFD0000 |
| `BaseAddress` | Base address of the process image | 0x00007FF6ABC00000 |
| `CreationTime` | Process creation timestamp | 2023-10-15T14:30:00 |
| `Is32Bit` | Whether process is 32-bit | TRUE/FALSE |
| `SID` | Security identifier | S-1-5-21-... |
| `Username` | User account name | DOMAIN\user |
| `Name` | Process name | chrome.exe |
| `CommandLine` | Full command line | "C:\Program Files\Chrome\chrome.exe" --type=renderer |
| `ProcessPath` | Full path to executable | C:\Program Files\Chrome\chrome.exe |
| `BasePriority` | Process base priority | 8 |
| `IsVirtualProcess` | Whether process is virtual | FALSE |
| `ProcessRowID` | Foreign key to process | 1 |
| `DllPath` | Path to loaded module | C:\Windows\System32\kernel32.dll |
| `DllBase` | Base address where DLL is loaded | 0x00007FFE12340000 |
| `EntryPoint` | DLL entry point address | 0x00007FFE12341000 |
| `SizeOfImage` | Size of the loaded image | 524288 |
| `LoadCount` | Module load count | 1 |
| `ProcessRowID` | Foreign key to process | 1 |
| `ThreadID` | Thread identifier | 9876 |
| `Win32StartAddress` | Win32 start address | 0x00007FF6ABC12340 |
| `StartAddress` | Kernel start address | 0x00007FF6ABC12340 |
| `CreateTime` | Thread creation timestamp | 2023-10-15T14:30:05 |
| `StackBase` | Stack base address | 0x0000001234560000 |
| `StackLimit` | Stack limit address | 0x0000001234520000 |
| `State` | Thread state | 5 |
| `WaitReason` | Reason for waiting | 0 |
| `BasePriority` | Thread base priority | 8 |
| `Priority` | Current priority | 8 |
| `ProcessRowID` | Foreign key to process | 1 |
| `Handle` | Handle value | 0x1234 |
| `HandleType` | Type of object | File |
| `HandleName` | Name or path of object | \Device\HarddiskVolume3\Windows\System32\kernel32.dll |
| `HandleAccess` | Access rights | 0x12019F |
| `HandleAttributes` | Handle attributes | 0 |
| `HandleObject` | Kernel object address | 0xFFFF8A8012345678 |
| `ProcessRowID` | Foreign key to process | 1 |
## Collection Method
This collector uses a kernel driver to enumerate running processes and gather detailed information including:
- Process list from kernel
- Detailed process information via IOCTL calls
- Module enumeration from PEB
- Thread enumeration
- Handle enumeration
- Command line parsing to extract file paths
## Forensic Value
Process information is fundamental for incident response and threat hunting. Investigators use this data to identify malicious processes, detect process injection, analyze parent-child relationships, identify suspicious command lines, track loaded DLLs, detect thread injection, enumerate open handles to files and registry keys, and establish process execution timelines. This evidence is particularly valuable for detecting living-off-the-land attacks, fileless malware, and process manipulation techniques.
---
# Proxy List
> Source: https://kb.binalyze.ai/air/features/acquisition/supported-evidence/windows-collections-detail/proxy-list.html
## Overview
**Evidence:** Proxy List
**Description:** Collect information about proxy list
**Category:** Network
**Platform:** windows
**Short Name:** prxy
**Is Parsed:** Yes
**Sent to Investigation Hub:** Yes
**Collect File(s):** No
## Background
Windows stores HTTP proxy configuration in the registry. Proxy settings control how Windows and Internet Explorer route HTTP/HTTPS traffic through proxy servers.
Proxy configuration can indicate normal corporate policy or malicious proxy settings used for traffic interception or C2 communication.
## Data Collected
This collector gathers structured data about proxy list.
### Proxy List Data
| Field | Description | Example |
|-------|-------------|---------|
| `ProxyEnabled` | Whether proxy is enabled | FALSE |
| `ProxyAddress` | Proxy server address and port | proxy.corp.local:8080 |
## Collection Method
This evidence is collected as part of the System collector by reading:
- `HKCU\Software\Microsoft\Windows\CurrentVersion\Internet Settings` - ProxyEnable value
- `HKCU\Software\Microsoft\Windows\CurrentVersion\Internet Settings` - ProxyServer value
## Forensic Value
Proxy configuration reveals network traffic routing and can indicate traffic interception. Investigators use this data to verify legitimate proxy usage, detect malicious proxy configurations, identify traffic interception attempts, correlate with network traffic patterns, and detect C2 proxy usage.
---
# QQ Bookmarks
> Source: https://kb.binalyze.ai/air/features/acquisition/supported-evidence/windows-collections-detail/qq-bookmarks.html
## Overview
**Evidence:** QQ Bookmarks
**Description:** Collect QQ Bookmarks
**Category:** Applications
**Platform:** windows
**Short Name:** qbkmrks
**Is Parsed:** Yes
**Sent to Investigation Hub:** Yes
**Collect File(s):** No
## Background
Browser bookmarks represent user-saved favorite websites and organizational folders. This data reveals frequently accessed sites, user interests, and potential indicators of reconnaissance, phishing targets, or suspicious infrastructure.
## Data Collected
This collector gathers structured data about qq bookmarks.
### QQ Bookmarks Data
| Field | Description | Example |
|-------|-------------|---------|
| `UserName` | User Name | Example value |
| `ProfileName` | Profile Name | Example value |
| `BrowserName` | Browser Name | Example value |
| `GUID` | GUID | Example value |
| `BookmarkID` | Bookmark ID | Example value |
| `Name` | Name | Example value |
| `Type` | Type | Example value |
| `URL` | URL | Example value |
| `ParentFolder` | Parent Folder | Example value |
| `DateAdded` | Date Added | 2023-10-15 14:30:25+03:00 |
| `DateLastUsed` | Date Last Used | 2023-10-15 14:30:25+03:00 |
| `DateModified` | Date Modified | 2023-10-15 14:30:25+03:00 |
## Collection Method
This collector parses the browser's Bookmarks file to extract saved URLs, folder structures, timestamps, and metadata.
## Forensic Value
Bookmark analysis identifies targeted websites, phishing pages, command-and-control servers, internal resources, and organizational reconnaissance patterns. Investigators can detect social engineering campaigns, credential harvesting attempts, and lateral movement preparation.
---
# QQ Browsing History
> Source: https://kb.binalyze.ai/air/features/acquisition/supported-evidence/windows-collections-detail/qq-browsing-history.html
## Overview
**Evidence:** QQ Browsing History
**Description:** Collect Visited URLs from QQ
**Category:** Applications
**Platform:** windows
**Short Name:** qqhst
**Is Parsed:** Yes
**Sent to Investigation Hub:** Yes
**Collect File(s):** No
## Background
Browser history records all websites visited by users, including URLs, page titles, visit timestamps, visit counts, and transition types. This data is essential for reconstructing user activity, identifying malicious websites, and tracking lateral movement or reconnaissance activities.
## Data Collected
This collector gathers structured data about qq browsing history.
### QQ Browsing History Data
| Field | Description | Example |
|-------|-------------|---------|
| `AccessTime` | Access Time | 2023-10-15 14:30:25+03:00 |
| `AccessCount` | Access Count | 123 |
| `URL` | URL | Example value |
| `Browser` | Browser | Example value |
| `Title` | Title | Example value |
| `VisitDuration` | Visit Duration | Example value |
| `Referrer` | Referrer | Example value |
| `TypedCount` | Typed Count | 123 |
| `IsHidden` | Is Hidden | true |
| `TransitionType` | Transition Type | Example value |
| `VisitID` | Visit ID | 123 |
| `TransitionQualifiers` | Transition Qualifiers | Example value |
| `User` | User | Example value |
| `Profile` | Profile | Example value |
| `HistoryFilePath` | History File Path | Example value |
## Collection Method
This collector queries the browser's History database to extract visited URLs, timestamps, referrer information, and user interaction patterns.
## Forensic Value
Browsing history reveals phishing sites, malicious domains, command-and-control servers, data exfiltration targets, and reconnaissance activities. Analysts can identify compromised credentials, track attacker infrastructure, and correlate web activity with other security events to establish attack timelines.
---
# QQ Cookies
> Source: https://kb.binalyze.ai/air/features/acquisition/supported-evidence/windows-collections-detail/qq-cookies.html
## Overview
**Evidence:** QQ Cookies
**Description:** Collect QQ Cookies
**Category:** Applications
**Platform:** windows
**Short Name:** qcookies
**Is Parsed:** Yes
**Sent to Investigation Hub:** Yes
**Collect File(s):** No
## Background
Browser cookies store session tokens, authentication credentials, user preferences, and tracking data. This data is essential for understanding authenticated sessions, tracking user activity across websites, and identifying session hijacking or credential theft.
## Data Collected
This collector gathers structured data about qq cookies.
### QQ Cookies Data
| Field | Description | Example |
|-------|-------------|---------|
| `UserName` | User Name | Example value |
| `BrowserName` | Browser Name | Example value |
| `ProfileName` | Profile Name | Example value |
| `Domain` | Domain | Example value |
| `Name` | Name | Example value |
| `Path` | Path | Example value |
| `Value` | Value | Example value |
| `IsSecure` | Is Secure | 123 |
| `IsHTTPOnly` | Is HTTP Only | 123 |
| `HasExpires` | Has Expires | 123 |
| `IsPersistent` | Is Persistent | 123 |
| `Priority` | Priority | 123 |
| `SameSite` | Same Site | 123 |
| `SourcePort` | Source Port | 123 |
| `SourceScheme` | Source Scheme | 123 |
| `CreationTime` | Creation Time | 2023-10-15 14:30:25+03:00 |
| `ExpiresTime` | Expires Time | 2023-10-15 14:30:25+03:00 |
| `LastAccessTime` | Last Access Time | 2023-10-15 14:30:25+03:00 |
## Collection Method
This collector extracts cookies from the browser's Cookies database, including domain, name, value, path, expiration, and security flags.
## Forensic Value
Cookie analysis reveals active sessions, authentication tokens, persistent tracking identifiers, and potential session hijacking. Investigators can identify stolen credentials, unauthorized access, and cross-site tracking used for reconnaissance or targeting.
---
# QQ Downloads
> Source: https://kb.binalyze.ai/air/features/acquisition/supported-evidence/windows-collections-detail/qq-downloads.html
## Overview
**Evidence:** QQ Downloads
**Description:** Collect QQ Downloads
**Category:** Applications
**Platform:** windows
**Short Name:** qqdwnlds
**Is Parsed:** Yes
**Sent to Investigation Hub:** Yes
**Collect File(s):** No
## Background
Browser download history records files downloaded by users, including file paths, timestamps, URLs, referrer information, and download status. This data is essential for tracking file acquisition, identifying potentially malicious downloads, and reconstructing user activity timelines.
## Data Collected
This collector gathers structured data about qq downloads.
### QQ Downloads Data
| Field | Description | Example |
|-------|-------------|---------|
| `UserName` | User Name | Example value |
| `Browser` | Browser | Example value |
| `ProfileName` | Profile Name | Example value |
| `URL` | URL | Example value |
| `TargetPath` | Target Path | Example value |
| `CurrentPath` | Current Path | Example value |
| `Referrer` | Referrer | Example value |
| `LastModified` | Last Modified | 2023-10-15 14:30:25+03:00 |
| `DangerType` | Danger Type | 123 |
| `Opened` | Opened | 123 |
| `TabURL` | Tab URL | Example value |
| `TabReferrerURL` | Tab Referrer URL | Example value |
| `StartTime` | Start Time | 2023-10-15 14:30:25+03:00 |
| `EndTime` | End Time | 2023-10-15 14:30:25+03:00 |
| `HistoryFilePath` | History File Path | Example value |
## Collection Method
This collector queries the browser's History database to extract download records, including file paths, download times, source URLs, and security flags.
## Forensic Value
Download history reveals malware delivery vectors, data exfiltration attempts, unauthorized software installation, and user interaction with suspicious websites. Analysts can identify downloaded malicious files, track attack chains, and correlate downloads with other security events.
---
# QQ Extensions
> Source: https://kb.binalyze.ai/air/features/acquisition/supported-evidence/windows-collections-detail/qq-extensions.html
## Overview
**Evidence:** QQ Extensions
**Description:** Collect QQ Extensions
**Category:** Applications
**Platform:** windows
**Short Name:** qqext
**Is Parsed:** Yes
**Sent to Investigation Hub:** Yes
**Collect File(s):** No
## Data Collected
This collector gathers structured data about qq extensions.
---
# QQ Favicons
> Source: https://kb.binalyze.ai/air/features/acquisition/supported-evidence/windows-collections-detail/qq-favicons.html
## Overview
**Evidence:** QQ Favicons
**Description:** Collect QQ Favicons
**Category:** Applications
**Platform:** windows
**Short Name:** qfico
**Is Parsed:** Yes
**Sent to Investigation Hub:** Yes
**Collect File(s):** No
## Background
Browser favicons are cached website icons that provide visual history of visited sites. This data supplements browsing history by revealing sites accessed even if history was deleted.
## Data Collected
This collector gathers structured data about qq favicons.
### QQ Favicons Data
| Field | Description | Example |
|-------|-------------|---------|
| `ID` | ID | 123 |
| `UserName` | User Name | Example value |
| `BrowserName` | Browser Name | Example value |
| `Profile` | Profile | Example value |
| `URL` | URL | Example value |
| `IconType` | Icon Type | 123 |
| `Path` | Path | Example value |
## Collection Method
This collector queries the browser's Favicons database to extract cached website icons and associated URLs.
## Forensic Value
Favicon analysis can recover evidence of deleted browsing history, identify visited sites through icon fingerprinting, and correlate with other browser artifacts to establish comprehensive activity timelines.
---
# QQ Form History
> Source: https://kb.binalyze.ai/air/features/acquisition/supported-evidence/windows-collections-detail/qq-form-history.html
## Overview
**Evidence:** QQ Form History
**Description:** Collect QQ Form History
**Category:** Applications
**Platform:** windows
**Short Name:** qfh
**Is Parsed:** Yes
**Sent to Investigation Hub:** Yes
**Collect File(s):** No
## Background
Browser form history stores previously entered form data including search queries, usernames, and other input fields. This data reveals user search patterns, account information, and potential data leakage through autofill.
## Data Collected
This collector gathers structured data about qq form history.
### QQ Form History Data
| Field | Description | Example |
|-------|-------------|---------|
| `UserName` | User Name | Example value |
| `BrowserName` | Browser Name | Example value |
| `Name` | Name | Example value |
| `Value` | Value | Example value |
| `ValueLower` | Value Lower | Example value |
| `Count` | Count | 123 |
| `Profile` | Profile | Example value |
| `Path` | Path | Example value |
| `DateCreated` | Date Created | 2023-10-15 14:30:25+03:00 |
| `DateLastUsed` | Date Last Used | 2023-10-15 14:30:25+03:00 |
## Collection Method
This collector queries the browser's form history database to extract saved form field data, search queries, and associated timestamps.
## Forensic Value
Form history exposes reconnaissance activities, credential enumeration attempts, search queries revealing attacker intent, and potentially sensitive information entered into web forms. Analysts can identify data exfiltration, account compromise indicators, and targeted search patterns.
---
# QQ Local Storage
> Source: https://kb.binalyze.ai/air/features/acquisition/supported-evidence/windows-collections-detail/qq-local-storage.html
## Overview
**Evidence:** QQ Local Storage
**Description:** Collect QQ Local Storage
**Category:** Applications
**Platform:** windows
**Short Name:** qqls
**Is Parsed:** Yes
**Sent to Investigation Hub:** Yes
**Collect File(s):** No
## Background
Browser local storage contains persistent key-value data stored by websites. This data includes user preferences, session state, cached data, and potentially authentication tokens or sensitive information.
## Data Collected
This collector gathers structured data about qq local storage.
### QQ Local Storage Data
| Field | Description | Example |
|-------|-------------|---------|
| `UserName` | User Name | Example value |
| `ProfileName` | Profile Name | Example value |
| `BrowserName` | Browser Name | Example value |
| `Key` | Key | Example value |
| `Value` | Value | Example value |
| `Path` | Path | Example value |
## Collection Method
This collector extracts local storage data from browser storage databases and files.
## Forensic Value
Local storage analysis reveals stored credentials, session tokens, tracking identifiers, and application state that can indicate compromised accounts, persistent tracking, or malicious website activity. Analysts can identify credential theft, session hijacking, and data exfiltration attempts.
---
# QQ Login Data
> Source: https://kb.binalyze.ai/air/features/acquisition/supported-evidence/windows-collections-detail/qq-login-data.html
## Overview
**Evidence:** QQ Login Data
**Description:** Collect QQ Login Data
**Category:** Applications
**Platform:** windows
**Short Name:** qlgd
**Is Parsed:** Yes
**Sent to Investigation Hub:** Yes
**Collect File(s):** No
## Background
Browser login data stores saved passwords and credential information. This data is critical for identifying stored credentials, password reuse patterns, and potential credential theft targets.
## Data Collected
This collector gathers structured data about qq login data.
### QQ Login Data Data
| Field | Description | Example |
|-------|-------------|---------|
| `ID` | ID | 123 |
| `UserName` | User Name | Example value |
| `BrowserName` | Browser Name | Example value |
| `OriginURL` | Origin URL | Example value |
| `SignonRealm` | Signon Realm | Example value |
| `BlacklistedByUser` | Blacklisted By User | 123 |
| `Scheme` | Scheme | Example value |
| `PasswordType` | Password Type | Example value |
| `TimesUsed` | Times Used | 123 |
| `Profile` | Profile | Example value |
| `Path` | Path | Example value |
| `DateCreated` | Date Created | 2023-10-15 14:30:25+03:00 |
| `DateLastUsed` | Date Last Used | 2023-10-15 14:30:25+03:00 |
## Collection Method
This collector extracts saved credentials from the browser's Login Data database, including URLs, usernames, and encrypted passwords.
## Forensic Value
Login data analysis reveals stored credentials, password reuse across services, targeted accounts, and potential credential harvesting. Investigators can identify compromised accounts, credential theft attempts, and unauthorized access to saved credentials by malware or attackers.
---
# QQ Sessions
> Source: https://kb.binalyze.ai/air/features/acquisition/supported-evidence/windows-collections-detail/qq-sessions.html
## Overview
**Evidence:** QQ Sessions
**Description:** Collect QQ Sessions
**Category:** Applications
**Platform:** windows
**Short Name:** qqss
**Is Parsed:** Yes
**Sent to Investigation Hub:** Yes
**Collect File(s):** No
## Background
Browser sessions maintain active tab state, cookies, and authentication context. This data reveals currently active user sessions, open websites, and authenticated connections at the time of collection.
## Data Collected
This collector gathers structured data about qq sessions.
### QQ Sessions Data
| Field | Description | Example |
|-------|-------------|---------|
| `ID` | ID | 123 |
| `WindowID` | Window ID | 123 |
| `Active` | Active | true |
| `Url` | Url | Example value |
| `Title` | Title | Example value |
| `Deleted` | Deleted | true |
| `Group` | Group | Example value |
| `History` | History | [] |
| `BrowserName` | Browser Name | Example value |
## Collection Method
This collector captures browser session data including active tabs, session cookies, and authentication state.
## Forensic Value
Session analysis identifies active compromises, authenticated sessions to malicious sites, concurrent suspicious activities, and real-time indicators of ongoing attacks. Analysts can detect active C2 connections, authenticated malware communications, and live attacker sessions.
---
# QQ Thumbnails
> Source: https://kb.binalyze.ai/air/features/acquisition/supported-evidence/windows-collections-detail/qq-thumbnails.html
## Overview
**Evidence:** QQ Thumbnails
**Description:** Collect QQ Thumbnails
**Category:** Applications
**Platform:** windows
**Short Name:** qthmb
**Is Parsed:** Yes
**Sent to Investigation Hub:** Yes
**Collect File(s):** No
## Background
Browser thumbnails are cached preview images of visited websites. This visual data supplements browsing history by providing screenshots of accessed pages, useful for recovering deleted history and identifying visited content.
## Data Collected
This collector gathers structured data about qq thumbnails.
### QQ Thumbnails Data
| Field | Description | Example |
|-------|-------------|---------|
| `UserName` | User Name | Example value |
| `Browser` | Browser | Example value |
| `URL` | URL | Example value |
| `URLRank` | URL Rank | 123 |
| `Title` | Title | Example value |
| `Profile` | Profile | Example value |
| `Path` | Path | Example value |
## Collection Method
This collector extracts cached thumbnail images from browser storage.
## Forensic Value
Thumbnail analysis provides visual evidence of visited websites, can recover evidence after history deletion, and helps identify phishing pages, malicious sites, or sensitive internal resources accessed by users through visual inspection.
---
# QQ User Profiles
> Source: https://kb.binalyze.ai/air/features/acquisition/supported-evidence/windows-collections-detail/qq-user-profiles.html
## Overview
**Evidence:** QQ User Profiles
**Description:** Collect QQ User Profiles
**Category:** Applications
**Platform:** windows
**Short Name:** qqprfls
**Is Parsed:** Yes
**Sent to Investigation Hub:** Yes
**Collect File(s):** No
## Background
Browser user profiles store per-user browser configurations, extensions, settings, and data segregation. This data reveals multiple user accounts, profile switching patterns, and user-specific browsing behavior.
## Data Collected
This collector gathers structured data about qq user profiles.
### QQ User Profiles Data
| Field | Description | Example |
|-------|-------------|---------|
| `EndpointUserName` | Endpoint User Name | Example value |
| `Profile` | Profile | Example value |
| `ProfileUserName` | Profile User Name | Example value |
| `BrowserName` | Browser Name | Example value |
| `BackgroundApps` | Background Apps | true |
| `GoogleAccountGivenName` | Google Account Given Name | Example value |
| `GoogleAccountID` | Google Account ID | Example value |
| `GoogleAccountName` | Google Account Name | Example value |
| `PictureFileName` | Picture File Name | Example value |
| `LastDownloadedPictureURL` | Last Downloaded Picture URL | Example value |
| `HostedDomain` | Hosted Domain | Example value |
| `IsConsentedPrimaryAccount` | Is Consented Primary Account | true |
| `IsEphemeral` | Is Ephemeral | true |
## Collection Method
This collector enumerates browser user profiles and extracts profile metadata, configurations, and associated data paths.
## Forensic Value
Profile analysis identifies multiple user accounts, profile-specific extensions and configurations, shared device usage patterns, and potential privilege escalation or lateral movement using different browser profiles. Investigators can correlate activity across profiles and identify unauthorized profile creation.
---
# QQ Web Storage
> Source: https://kb.binalyze.ai/air/features/acquisition/supported-evidence/windows-collections-detail/qq-web-storage.html
## Overview
**Evidence:** QQ Web Storage
**Description:** Collect QQ Web Storage
**Category:** Applications
**Platform:** windows
**Short Name:** qqws
**Is Parsed:** Yes
**Sent to Investigation Hub:** Yes
**Collect File(s):** No
## Background
Browser web storage includes both local and session storage used by websites to store client-side data. This data can contain application state, user preferences, cached content, and potentially sensitive information.
## Data Collected
This collector gathers structured data about qq web storage.
### QQ Web Storage Data
| Field | Description | Example |
|-------|-------------|---------|
| `UserName` | User Name | Example value |
| `ProfileName` | Profile Name | Example value |
| `BrowserName` | Browser Name | Example value |
| `Key` | Key | Example value |
| `Value` | Value | Example value |
| `Path` | Path | Example value |
## Collection Method
This collector extracts web storage data from browser storage locations including local storage and session storage.
## Forensic Value
Web storage analysis reveals cached application data, stored credentials, session information, and potential data exfiltration staging. Analysts can identify malicious website activity, stored authentication tokens, tracking identifiers, and sensitive data cached by compromised web applications.
---
# Quick Assist
> Source: https://kb.binalyze.ai/air/features/acquisition/supported-evidence/windows-collections-detail/quick-assist.html
## Overview
**Evidence:** Quick Assist
**Description:** Collect Quick Assist History
**Category:** System
**Platform:** windows
**Short Name:** qas
**Is Parsed:** Yes
**Sent to Investigation Hub:** Yes
**Collect File(s):** No
## Background
Quick Assist stores browser-based history in an embedded WebView database. This data is essential for understanding remote assistance usage and potential unauthorized remote access.
## Data Collected
This collector gathers structured data about quick assist.
## Collection Method
This collector locates history SQLite files under user temp RemoteHelp paths, copies them, and queries visit URL, title, and visit time.
## Forensic Value
This evidence is crucial for forensic investigations as it indicates when and which remote sessions or pages were accessed via Quick Assist.
---
# RAM Image
> Source: https://kb.binalyze.ai/air/features/acquisition/supported-evidence/windows-collections-detail/ram-image.html
## Overview
**Evidence:** RAM Image
**Description:** Create an image of RAM
**Category:** Memory
**Platform:** windows
**Short Name:** ram
**Is Parsed:** No
**Sent to Investigation Hub:** Yes
**Collect File(s):** Yes
## Background
Physical memory (RAM) contains all actively running processes, loaded modules, network connections, decrypted data, and other volatile system state. A memory dump captures the exact state of RAM at the moment of acquisition.
Memory forensics can reveal malware that exists only in memory (fileless malware), decrypted content, passwords, encryption keys, network communications, and kernel-level rootkits that may not be detectable through file system analysis.
## Data Collected
This collector gathers structured data about ram image.
### RAM Image Data
| Field | Description | Example |
|-------|-------------|---------|
| `Path` | Path | Example value |
| `FileSize` | File Size | 123.45 |
## Collection Method
This collector uses a kernel driver to:
- Enumerate physical memory ranges via `IoctlEnumPhysicalMemoryRanges`
- Read each memory page using `IoctlReadPhysicalMemory`
- Write pages sequentially to create a raw memory image
- Fill unmapped regions with zeros to maintain proper addressing
The resulting file is a complete physical memory dump in raw format compatible with memory analysis tools like Volatility.
## Forensic Value
Memory dumps are essential for advanced malware analysis and incident response. Investigators use memory forensics to detect fileless malware, extract process memory for malware analysis, recover encryption keys and passwords, identify network connections and malware C2, analyze kernel rootkits and drivers, extract browser history and clipboard data, and identify code injection and process hollowing.
---
# RDP Cache
> Source: https://kb.binalyze.ai/air/features/acquisition/supported-evidence/windows-collections-detail/rdp-cache.html
## Overview
**Evidence:** RDP Cache
**Description:** Collect RDP Cache Files
**Category:** System
**Platform:** windows
**Short Name:** rdpc
**Is Parsed:** No
**Sent to Investigation Hub:** Yes
**Collect File(s):** Yes
## Background
The Remote Desktop client caches screen bitmaps to improve performance over slow connections. These cached bitmap tiles are stored in the user's profile and can be reconstructed to reveal what was visible on remote desktop sessions.
RDP cache files can provide visual evidence of remote desktop activity and potentially recover sensitive information viewed during RDP sessions.
## Data Collected
This collector gathers structured data about rdp cache.
### RDP Cache Data
| Field | Description | Example |
|-------|-------------|---------|
| `Name` | Artifact name | RDP Cache Files |
| `Type` | Folder | Folder |
| `SourcePath` | Original folder path | C:\Users\user\AppData\Local\Microsoft\Terminal Server Client\Cache |
| `Path` | Relative path in evidence | Other/Cache |
## Collection Method
This collector collects RDP cache directories:
- `Users\*\AppData\Local\Microsoft\Terminal Server Client\Cache`
The entire cache directory with all bitmap cache files is collected.
## Forensic Value
RDP cache can reveal visual content from remote desktop sessions. Investigators use this data to recover screen content from RDP sessions, prove remote desktop usage, identify accessed remote resources, and reconstruct user actions on remote systems.
---
# RealVNC Logs
> Source: https://kb.binalyze.ai/air/features/acquisition/supported-evidence/windows-collections-detail/realvnc-logs.html
## Overview
**Evidence:** RealVNC Logs
**Description:** Collect RealVNC Application Debug Logs
**Category:** Applications
**Platform:** windows
**Short Name:** realvncl
**Is Parsed:** No
**Sent to Investigation Hub:** No
**Collect File(s):** Yes
## Background
RealVNC is a popular remote desktop application that maintains debug logs tracking connection events, errors, and session activities. The logs record both server and client operations.
## Data Collected
This collector gathers structured data about realvnc logs.
## Collection Method
This collector gathers RealVNC service log files and backup logs from the ProgramData directory containing connection and diagnostic information.
## Forensic Value
RealVNC logs help identify remote desktop connections, troubleshoot access issues, and investigate unauthorized remote access. They reveal connection attempts, client IDs, and session timelines.
---
# RecentDocs
> Source: https://kb.binalyze.ai/air/features/acquisition/supported-evidence/windows-collections-detail/recentdocs.html
## Overview
**Evidence:** RecentDocs
**Description:** Enumerate RecentDocs
**Category:** System
**Platform:** windows
**Short Name:** recentdocs
**Is Parsed:** Yes
**Sent to Investigation Hub:** Yes
**Collect File(s):** No
## Background
The RecentDocs registry key tracks files that users have recently opened, organized by file extension. Windows maintains separate MRU lists for each file extension (e.g., .docx, .pdf, .txt) as well as a general list of all recently accessed files.
This artifact preserves evidence of file access even after files are deleted and can reveal which documents and files users were working with.
## Data Collected
This collector gathers structured data about recentdocs.
### RecentDocs Data
| Field | Description | Example |
|-------|-------------|---------|
| `KeyPath` | Registry key path | Software\Microsoft\Windows\CurrentVersion\Explorer\RecentDocs\.docx |
| `LastWriteTime` | Registry key last write time | 2023-10-15T14:30:00 |
| `Value` | MRU value name | 0 |
| `Username` | User account name | user |
| `Extension` | File extension | .docx |
| `FileName` | File name | confidential-report.docx |
| `LNKName` | Associated LNK file path | C:\Users\user\AppData\Roaming\Microsoft\Windows\Recent\confidential-report.lnk |
| `MRUPosition` | Position in MRU list | 0 |
| `RegPath` | Path to registry hive | Registry/ntuser.dat |
## Collection Method
This collector:
- Collects user registry hives (ntuser.dat)
- Searches for RecentDocs keys:
- `Software\Microsoft\Windows\CurrentVersion\Explorer\RecentDocs` (all files)
- `Software\Microsoft\Windows\CurrentVersion\Explorer\RecentDocs\*` (by extension)
- Parses MRUListEx binary data
- Decodes shell item data using libfwsi
- Extracts file names and LNK file references
- Orders by MRU position (most recent first)
## Forensic Value
RecentDocs reveals which files users recently accessed and can persist after file deletion. Investigators use this data to identify recently accessed documents, track file access by extension type, detect access to sensitive or classified files, establish document access timelines, prove user interaction with specific files, correlate with LNK files and JumpLists, and identify files of interest that may have been deleted.
---
# Recent File Cache
> Source: https://kb.binalyze.ai/air/features/acquisition/supported-evidence/windows-collections-detail/recent-file-cache.html
## Overview
**Evidence:** Recent File Cache
**Description:** Collect recent file cache files
**Category:** System
**Platform:** windows
**Short Name:** rfc
**Is Parsed:** No
**Sent to Investigation Hub:** Yes
**Collect File(s):** Yes
## Background
RecentFileCache.bcf is a binary file maintained by the Windows Application Compatibility infrastructure. It caches information about recently executed programs and can provide execution evidence.
This file complements other execution artifacts like prefetch, amcache, and appcompatcache.
## Data Collected
This collector gathers structured data about recent file cache.
### Recent File Cache Data
| Field | Description | Example |
|-------|-------------|---------|
| `Type` | File type | RecentFileCache |
| `Name` | File name | RecentFileCache.bcf |
| `SourcePath` | Original file path | C:\Windows\AppCompat\Programs\RecentFileCache.bcf |
| `FilePath` | Relative path in evidence | Files/RecentFileCache.bcf |
| `FileSize` | File size in bytes | 524288 |
## Collection Method
This collector collects the file from:
- `C:\Windows\AppCompat\Programs\RecentFileCache.bcf`
## Forensic Value
RecentFileCache can provide additional program execution evidence. Investigators use this data to supplement execution artifact analysis and correlate with other execution evidence sources.
---
# Recycle Bin Information
> Source: https://kb.binalyze.ai/air/features/acquisition/supported-evidence/windows-collections-detail/recycle-bin-information.html
## Overview
**Evidence:** Recycle Bin Information
**Description:** Collect information about items in recycle bin
**Category:** System
**Platform:** windows
**Short Name:** rbi
**Is Parsed:** Yes
**Sent to Investigation Hub:** Yes
**Collect File(s):** No
## Background
When files are deleted through Windows Explorer, they are moved to the Recycle Bin. Windows creates two files for each deleted item:
- $I file: Contains metadata (original path, deletion time, file size)
- $R file: Contains the actual file content
The $I metadata files can reveal what files were deleted, when, by whom, and their original locations.
## Data Collected
This collector gathers structured data about recycle bin information.
### Recycle Bin Information Data
| Field | Description | Example |
|-------|-------------|---------|
| `FileName` | Original file name | document.docx |
| `OriginalPath` | Original file path before deletion | C:\Users\user\Documents\document.docx |
| `SID` | User SID who deleted the file | S-1-5-21-... |
| `Username` | Username who deleted the file | DOMAIN\user |
| `Type` | Whether File or Folder | File |
| `Attributes` | File attributes | 32 |
| `DeletionTime` | When file was deleted | 2023-10-15T14:30:00 |
| `OriginalSize` | Original file size before deletion | 1048576 |
## Collection Method
This collector:
- Searches for `$Recycle.Bin\*` folders on all drives
- Enumerates $I* files (metadata files)
- Parses $I file format (Version 1 or Version 2)
- Extracts deletion metadata
- References corresponding $R files (recovered content)
- Resolves user SIDs to usernames
## Forensic Value
Recycle Bin analysis is fundamental for recovering deleted evidence and establishing deletion timelines. Investigators use this data to recover deleted files, establish file deletion timelines, identify who deleted files, prove file existence before deletion, track data destruction attempts, and correlate deletions with user activity.
---
# Registry Hives
> Source: https://kb.binalyze.ai/air/features/acquisition/supported-evidence/windows-collections-detail/registry-hives.html
## Overview
**Evidence:** Registry Hives
**Description:** Dump registry hives
**Category:** System
**Platform:** windows
**Short Name:** hiv
**Is Parsed:** No
**Sent to Investigation Hub:** Yes
**Collect File(s):** Yes
## Background
The Windows Registry is a hierarchical database that stores configuration settings and options for the operating system, hardware, installed applications, and user preferences. The registry is stored in several files called hives, each containing a specific branch of the registry tree.
Registry hives are critical system files that Windows loads at boot time and keeps open while the system is running. Each hive file may have associated transaction log files (.log, .log1, .log2) that help maintain consistency during registry writes.
## Data Collected
This collector gathers structured data about registry hives.
### Registry Hives Data
| Field | Description | Example |
|-------|-------------|---------|
| `RegPath` | Registry path being collected | \REGISTRY\MACHINE\SYSTEM |
| `FilePath` | Relative path in the evidence package | Registry/SYSTEM |
| `FileSize` | Size of the hive file in bytes | 12582912 |
| `FileModified` | Last modified timestamp | 2023-10-15T14:30:00 |
| `FileAccessed` | Last accessed timestamp | 2023-10-15T15:45:00 |
| `FileCreated` | Creation timestamp | 2023-10-01T10:00:00 |
| `Hash` | Hash of the hive file | SHA256:a1b2c3... |
## Collection Method
This collector gathers registry hive files from multiple locations:
- Active hives from `HKEY_LOCAL_MACHINE\SYSTEM\CurrentControlSet\Control\hivelist`
- User hives: `Users\*\ntuser.dat`
- User class hives: `Users\*\AppData\Local\Microsoft\Windows\UsrClass.dat`
- Default user hive: `Windows\System32\config\default`
- Transaction logs (.log, .log1, .log2) for each hive
- Backup copies from `Windows\System32\config\RegBack`
The registry is flushed before collection to ensure all data is written to disk.
**Note:** For old registry hives from Windows.old, see [Old Registry Hives](./old-registry-hives).
## Forensic Value
Registry hives are essential for forensic investigations as they contain vast amounts of system and user activity data. This evidence helps investigators reconstruct system configuration, user behavior, installed applications, network connections, USB device history, recent file access, and persistence mechanisms. Analysts can use registry analysis to identify malware persistence, user activity patterns, application usage, system modifications, and attacker tradecraft.
---
# Registry Items
> Source: https://kb.binalyze.ai/air/features/acquisition/supported-evidence/windows-collections-detail/registry-items.html
## Overview
**Evidence:** Registry Items
**Description:** Enumerate Registry Items
**Category:** System
**Platform:** windows
**Short Name:** rgstrpr
**Is Parsed:** Yes
**Sent to Investigation Hub:** Yes
**Collect File(s):** Yes
## Background
Windows registry contains numerous locations where programs can register themselves to run automatically at system startup, user logon, or specific events. Attackers commonly abuse these registry keys to establish persistence.
The collector examines dozens of known autorun registry locations used by both legitimate software and malware for persistence.
## Data Collected
This collector gathers structured data about registry items.
### Registry Items Data
| Field | Description | Example |
|-------|-------------|---------|
| `KeyPath` | Full registry key path | HKLM\Software\Microsoft\Windows\CurrentVersion\Run |
| `View` | Registry view (32-bit or 64-bit) | 256 |
| `LastWriteTime` | Registry key last write time | 2023-10-15T14:30:00 |
| `Is32Bit` | Whether this is 32-bit registry view | TRUE |
| `EntryName` | Registry value or entry name | GoogleUpdate |
| `CommandLine` | Command line to execute | "C:\Program Files\Google\Update\GoogleUpdate.exe" /c |
| `AutorunsRegistryRowID` | Foreign key to main entry | 1 |
## Collection Method
This collector:
- Loads autorun definitions from embedded JSON resource
- Searches for registry keys matching patterns
- Examines both 32-bit and 64-bit registry views
- Parses command lines to extract executables and arguments
- Resolves CLSID references to file paths
- Collects file information for all referenced executables
Common persistence locations include:
- `HKLM/HKCU\Software\Microsoft\Windows\CurrentVersion\Run`
- `HKLM/HKCU\Software\Microsoft\Windows\CurrentVersion\RunOnce`
- Shell extensions and explorer add-ons
- Winlogon registry keys
- Active Setup entries
- And many other documented persistence locations
## Forensic Value
Registry persistence enumeration is essential for detecting malware and unauthorized software. Investigators use this data to identify malicious autoruns, detect persistence mechanisms, track installed software that runs at startup, identify suspicious registry modifications, correlate persistence with malware execution, detect Living Off the Land binaries, and validate system baseline configurations.
---
# RemComSvc Logs
> Source: https://kb.binalyze.ai/air/features/acquisition/supported-evidence/windows-collections-detail/remcomsvc-logs.html
## Overview
**Evidence:** RemComSvc Logs
**Description:** Collect RemComSvc Logs
**Category:** Applications
**Platform:** windows
**Short Name:** rmcmsvcl
**Is Parsed:** No
**Sent to Investigation Hub:** No
**Collect File(s):** Yes
## Background
RemCom is a remote command execution tool (similar to PsExec) that maintains service logs tracking remote command executions and connections. The tool is used for remote administration but can be abused by attackers.
## Data Collected
This collector gathers structured data about remcomsvc logs.
## Collection Method
This collector gathers RemComSvc log files from the Windows system directories tracking remote command execution and service activity.
## Forensic Value
RemCom logs are critical for investigating lateral movement, remote command execution, and privilege escalation. They reveal commands executed remotely, connection sources, and can identify attacker activity during post-exploitation phases.
---
# Remote Utilities Logs
> Source: https://kb.binalyze.ai/air/features/acquisition/supported-evidence/windows-collections-detail/remote-utilities-logs.html
## Overview
**Evidence:** Remote Utilities Logs
**Description:** Collect Remote Utilities Application Logs
**Category:** Applications
**Platform:** windows
**Short Name:** remotulgs
**Is Parsed:** No
**Sent to Investigation Hub:** No
**Collect File(s):** Yes
## Background
Remote Utilities is a remote desktop and support application that maintains HTML-formatted logs and standard log files tracking remote connections and session activities.
## Data Collected
This collector gathers structured data about remote utilities logs.
## Collection Method
This collector gathers HTML log files and standard logs from the Remote Utilities ProgramData directory containing connection and session information.
## Forensic Value
Remote Utilities logs reveal remote desktop sessions, connection details, and user activities during remote access. This helps identify unauthorized access, data theft, and lateral movement through remote tools.
---
# RogueKiller Reports
> Source: https://kb.binalyze.ai/air/features/acquisition/supported-evidence/windows-collections-detail/roguekiller-reports.html
## Overview
**Evidence:** RogueKiller Reports
**Description:** Collect RogueKiller Reports
**Category:** Applications
**Platform:** windows
**Short Name:** rgkllrp
**Is Parsed:** No
**Sent to Investigation Hub:** No
**Collect File(s):** Yes
## Background
RogueKiller is an anti-malware tool by Adlice that specializes in detecting and removing advanced threats, rootkits, and PUPs (Potentially Unwanted Programs). It generates JSON-formatted reports with detailed scan findings.
## Data Collected
This collector gathers structured data about roguekiller reports.
## Collection Method
This collector gathers RogueKiller's AdliceReport JSON files from the logs directory in ProgramData, which contain comprehensive scan results and threat analysis.
## Forensic Value
RogueKiller reports provide detailed information about rootkits, advanced malware, registry modifications, and PUPs. They're valuable for investigating complex infections and understanding system compromises that traditional antivirus might miss.
---
# RunMRU
> Source: https://kb.binalyze.ai/air/features/acquisition/supported-evidence/windows-collections-detail/runmru.html
## Overview
**Evidence:** RunMRU
**Description:** Enumerate RunMRU
**Category:** System
**Platform:** windows
**Short Name:** runmru
**Is Parsed:** Yes
**Sent to Investigation Hub:** Yes
**Collect File(s):** No
## Background
The Windows Run dialog (launched with Win+R) maintains a history of commands that users have typed and executed. This MRU (Most Recently Used) list is stored in the registry and preserves evidence of command execution, file paths, and applications launched.
Run dialog history can reveal sophisticated user knowledge, administrative commands, malware execution, and lateral movement activities.
## Data Collected
This collector gathers structured data about runmru.
### RunMRU Data
| Field | Description | Example |
|-------|-------------|---------|
| `KeyPath` | Registry key path | Software\Microsoft\Windows\CurrentVersion\Explorer\RunMRU |
| `LastWriteTime` | Registry key last write time | 2023-10-15T14:30:00 |
| `Value` | MRU value name | a |
| `Username` | User account name | user |
| `FileName` | Command or path entered | cmd.exe /c powershell.exe -enc ... |
| `MRUPosition` | Position in MRU list | 0 |
| `RegPath` | Path to registry hive | Registry/ntuser.dat |
## Collection Method
This collector:
- Collects user registry hives (ntuser.dat)
- Searches for: `Software\Microsoft\Windows\CurrentVersion\Explorer\RunMRU`
- Parses MRUList string to determine access order
- Extracts command strings from registry values
- Orders by MRU position (most recent first)
## Forensic Value
Run dialog history reveals commands users have executed and can indicate administrative activity or malicious behavior. Investigators use this data to identify PowerShell or cmd.exe execution, detect lateral movement commands, track administrative tool usage, identify malware execution, prove user knowledge of specific commands, detect privilege escalation attempts, and correlate with process execution evidence.
---
# SAM Users and Groups
> Source: https://kb.binalyze.ai/air/features/acquisition/supported-evidence/windows-collections-detail/sam-users-and-groups.html
## Overview
**Evidence:** SAM Users and Groups
**Description:** Collect SAM Users and Groups
**Category:** System
**Platform:** windows
**Short Name:** sam
**Is Parsed:** Yes
**Sent to Investigation Hub:** Yes
**Collect File(s):** No
## Background
The Security Account Manager (SAM) hive stores local user and group account information. This data is essential for enumerating accounts, SIDs, and group memberships.
## Data Collected
This collector gathers structured data about sam users and groups.
## Collection Method
This collector parses SAM and related hives to enumerate local users and groups, resolving group memberships into `sam_users` and `sam_groups`.
## Forensic Value
This evidence is crucial for forensic investigations as it identifies local accounts and privileges, supporting lateral movement and persistence analysis.
---
# Scheduled Tasks
> Source: https://kb.binalyze.ai/air/features/acquisition/supported-evidence/windows-collections-detail/scheduled-tasks.html
## Overview
**Evidence:** Scheduled Tasks
**Description:** Enumerate Scheduled Tasks
**Category:** System
**Platform:** windows
**Short Name:** schldpr
**Is Parsed:** Yes
**Sent to Investigation Hub:** Yes
**Collect File(s):** Yes
## Background
Windows Task Scheduler allows programs to be executed at specific times or in response to system events. Scheduled tasks are a common persistence mechanism used by both legitimate software and malware.
Tasks can be configured to run at logon, on schedule, or when specific events occur. The Task Scheduler maintains both legacy .job files (Windows XP) and modern XML-based tasks (Windows Vista+).
## Data Collected
This collector gathers structured data about scheduled tasks.
### Scheduled Tasks Data
| Field | Description | Example |
|-------|-------------|---------|
| `Name` | Task name or path | \Microsoft\Windows\MyTask |
| `Enabled` | Whether task is enabled | TRUE |
| `Status` | Task status | Ready |
| `CommandLine` | Full command line | C:\Windows\System32\cmd.exe /c script.bat |
| `Triggers` | Trigger types (comma-separated) | 0,1,2 |
| `LastRunTime` | Last execution time | 2023-10-15T14:30:00 |
| `Author` | Task author | DOMAIN\Administrator |
| `CreationTime` | Task creation time | 2023-10-01T10:00:00 |
| `AutorunsScheduledTasksRowID` | Foreign key to task entry | 1 |
## Collection Method
This collector:
- Collects task files from:
- `Windows\System32\Tasks` (Windows Vista+)
- `Windows\Tasks\*.job` (Windows XP)
- Uses Task Scheduler COM API to enumerate tasks:
- `ITaskScheduler` interface for legacy tasks (v1)
- `ITaskService` interface for modern tasks (v2)
- Extracts task actions (EXEC and COM_HANDLER types)
- Parses command lines and arguments
- Resolves CLSID references for COM handler tasks
- Collects file information for all executables
## Forensic Value
Scheduled task enumeration is critical for detecting persistence and automated malicious activity. Investigators use this data to identify malicious scheduled tasks, detect persistence mechanisms, track automated attack execution, identify lateral movement tools, detect data exfiltration schedules, verify legitimate administrative tasks, and correlate task execution with system events.
---
# ScreenConnect (ConnectWise Control) Application Data
> Source: https://kb.binalyze.ai/air/features/acquisition/supported-evidence/windows-collections-detail/screenconnect-connectwise-control-application-data.html
## Overview
**Evidence:** ScreenConnect (ConnectWise Control) Application Data
**Description:** Collect Various Types of ScreenConnect (ConnectWise Control) Application Data
**Category:** Applications
**Platform:** windows
**Short Name:** scrncnppadt
**Is Parsed:** No
**Sent to Investigation Hub:** No
**Collect File(s):** Yes
## Background
ScreenConnect (now ConnectWise Control) is a remote support and access platform widely used by MSPs and IT departments. It stores configuration files, session databases, user data, and security settings. The software has been targeted by threat actors for initial access and persistence.
## Data Collected
This collector gathers structured data about screenconnect (connectwise control) application data.
## Collection Method
This collector gathers ScreenConnect configuration files, user XML files, session databases, security databases, extensions, and temporary data from multiple installation and data directories.
## Forensic Value
ScreenConnect data is critical for investigating remote access incidents, as the platform is frequently exploited by ransomware groups and APTs. The data reveals remote sessions, user accounts, client connections, transferred files, and can identify unauthorized use of legitimate remote access tools for malicious purposes.
---
# Search History
> Source: https://kb.binalyze.ai/air/features/acquisition/supported-evidence/windows-collections-detail/search-history.html
## Overview
**Evidence:** Search History
**Description:** Collect Windows Start Menu Search History
**Category:** Applications
**Platform:** windows
**Short Name:** srch
**Is Parsed:** No
**Sent to Investigation Hub:** No
**Collect File(s):** Yes
## Background
Windows Start Menu and search bar maintain history of user searches, including files searched for, applications launched, and web queries. This data is stored in the ConnectedSearch directory.
## Data Collected
This collector gathers structured data about search history.
## Collection Method
This collector gathers files from the Windows ConnectedSearch History directory containing search queries and interaction history.
## Forensic Value
Search history reveals user intent, files accessed, applications used, and information sought. This can identify attempts to find specific files, delete evidence, or search for security tools and anti-forensics software.
---
# SentinelOne Logs
> Source: https://kb.binalyze.ai/air/features/acquisition/supported-evidence/windows-collections-detail/sentinelone-logs.html
## Overview
**Evidence:** SentinelOne Logs
**Description:** Collect SentinelOne Logs
**Category:** Applications
**Platform:** windows
**Short Name:** sntlnls
**Is Parsed:** No
**Sent to Investigation Hub:** No
**Collect File(s):** Yes
## Background
SentinelOne is an advanced AI-powered EDR platform that provides autonomous endpoint protection with behavioral detection and automated response capabilities. It maintains comprehensive logs of threats, processes, and security events.
## Data Collected
This collector gathers structured data about sentinelone logs.
## Collection Method
This collector gathers SentinelOne log files from the Sentinel directory in ProgramData, containing EDR events, threat detections, and autonomous response actions.
## Forensic Value
SentinelOne logs are critical for EDR investigations, providing AI-detected threats, behavioral analysis, process execution chains, and automated remediation actions. They offer detailed visibility into advanced attacks and zero-day threats.
---
# Service List
> Source: https://kb.binalyze.ai/air/features/acquisition/supported-evidence/windows-collections-detail/service-list.html
## Overview
**Evidence:** Service List
**Description:** Enumerate Service List
**Category:** System
**Platform:** windows
**Short Name:** srvcpr
**Is Parsed:** Yes
**Sent to Investigation Hub:** Yes
**Collect File(s):** Yes
## Background
Windows Services are background processes that run without user interaction, often with SYSTEM privileges. Services are a common persistence mechanism for both legitimate software and malware.
Services are configured in the registry under `HKLM\SYSTEM\CurrentControlSet\Services`. Each service has an ImagePath or ServiceDll that specifies what code to execute.
## Data Collected
This collector gathers structured data about service list.
### Service List Data
| Field | Description | Example |
|-------|-------------|---------|
| `KeyPath` | Registry key path | SYSTEM\CurrentControlSet\Services\MyService |
| `LastWriteTime` | Registry key last write time | 2023-10-15T14:30:00 |
| `EntryName` | Service name | MyService |
| `StartType` | Service start type (0=Boot, 1=System, 2=Automatic, 3=Manual, 4=Disabled) | 2 |
| `SourcePath` | Command line (ImagePath or ServiceDll) | C:\Windows\System32\svchost.exe -k netsvcs |
| `AutorunsServicesRowID` | Foreign key to service entry | 1 |
## Collection Method
This collector:
- Enumerates all keys under `HKLM\SYSTEM\CurrentControlSet\Services\*`
- Reads service configuration:
- `ImagePath` - Path to service executable
- `ServiceDll` (from Parameters subkey) - DLL for svchost-hosted services
- `Start` - Service start type
- `Type` - Service type (kernel driver, user-mode service, etc.)
- `WOW64` - Whether service is 32-bit
- Parses command lines and extracts file paths
- Resolves CLSID references if present
- Handles both 32-bit and 64-bit registry views
## Forensic Value
Service enumeration is critical for detecting persistent threats and system compromises. Investigators use this data to identify malicious services, detect unauthorized service installations, track service configuration changes, identify suspicious service names, verify service executables and DLLs, detect DLL hijacking in svchost, and correlate services with process execution.
---
# Shadow Copy as CSV
> Source: https://kb.binalyze.ai/air/features/acquisition/supported-evidence/windows-collections-detail/shadow-copy-as-csv.html
## Overview
**Evidence:** Shadow Copy as CSV
**Description:** Dump Latest Shadow Copy Files Information in CSV Format
**Category:** DiskFilesystem
**Platform:** windows
**Short Name:** shdwcopy
**Is Parsed:** Yes
**Sent to Investigation Hub:** Yes
**Collect File(s):** No
## Background
Volume Shadow Copy Service (VSS) creates point-in-time snapshots of volumes. These snapshots preserve the state of files at the time the snapshot was created, allowing access to previous versions of files even if they have been modified or deleted.
Shadow copies can contain previous versions of files before ransomware encryption, deleted files, and historical system state. They provide a way to recover data and analyze system state from a specific point in time.
## Data Collected
This collector gathers structured data about shadow copy as csv.
### Shadow Copy as CSV Data
| Field | Description | Example |
|-------|-------------|---------|
| `Modified` | File modification timestamp | 2023-10-15T14:30:00Z |
| `Accessed` | File access timestamp | 2023-10-15T15:45:00Z |
| `Created` | File creation timestamp | 2023-10-01T10:00:00Z |
| `IsDirectory` | Whether entry is directory | + or empty |
| `FileSize` | File size in bytes | 1048576 |
| `Attributes` | File attributes (R=ReadOnly, H=Hidden, S=System, C=Compressed, E=Encrypted) | RHS |
| `FilePath` | Full path within shadow copy | \\?\HarddiskVolumeShadowCopy1\Users\user\Documents\file.txt |
## Collection Method
This collector:
- Identifies the most recent shadow copy using `GetLatestSnapshotDeviceName`
- Enumerates all files recursively in the shadow copy
- Captures file metadata (timestamps, size, attributes)
- Exports to CSV format for analysis
Shadow copies are accessed via special device paths like `\\?\HarddiskVolumeShadowCopy{N}\`.
## Forensic Value
Shadow copies are invaluable for recovering evidence and analyzing historical system state. Investigators use this data to recover files before ransomware encryption, access deleted files preserved in snapshots, analyze previous system configurations, compare current state with historical snapshots, recover overwritten evidence, and establish what files existed at snapshot time.
---
# ShellBags
> Source: https://kb.binalyze.ai/air/features/acquisition/supported-evidence/windows-collections-detail/shellbags.html
## Overview
**Evidence:** ShellBags
**Description:** Enumerate ShellBags
**Category:** System
**Platform:** windows
**Short Name:** sbgs
**Is Parsed:** Yes
**Sent to Investigation Hub:** Yes
**Collect File(s):** No
## Background
ShellBags are Windows Registry artifacts that track folder access and view preferences in Windows Explorer. When a user opens a folder in Explorer, Windows creates a ShellBag entry to remember the folder's view settings (icon size, column sort order, etc.).
ShellBags persist even after folders are deleted, providing evidence of folder access including folders on external drives, network shares, and deleted directories.
## Data Collected
This collector gathers structured data about shellbags.
### ShellBags Data
| Field | Description | Example |
|-------|-------------|---------|
| `Username` | User account name | user |
| `DomainName` | Domain name | WORKSTATION01 |
| `KeyPath` | Registry key path | Software\Microsoft\Windows\Shell\BagMRU\0\1 |
| `Value` | Registry value name | 2 |
| `Type` | Shell item type | 49 |
| `View` | View type | 0 |
| `CachedFileModified` | Cached modification time | 2023-10-15T14:30:00 |
| `CachedFileAccessed` | Cached access time | 2023-10-15T15:45:00 |
| `CachedFileCreated` | Cached creation time | 2023-10-01T10:00:00 |
| `Path` | Full folder path | C:\Users\user\Documents\Project |
| `SlotModifiedTime` | Slot modification time | 2023-10-15T16:00:00 |
| `MFTEntry` | MFT entry number | 12345 |
| `MFTSequence` | MFT sequence number | 1 |
| `FileExists` | Whether folder currently exists | TRUE |
| `FileModified` | Current modification time | 2023-10-15T14:30:00 |
| `FileAccessed` | Current access time | 2023-10-15T15:45:00 |
| `FileCreated` | Current creation time | 2023-10-01T10:00:00 |
| `RegPath` | Path to source registry hive | Registry/ntuser.dat |
## Collection Method
This collector:
- Collects user registry hives (ntuser.dat, UsrClass.dat)
- Searches for ShellBag registry keys in various locations:
- `Software\Microsoft\Windows\Shell\BagMRU`
- `Software\Microsoft\Windows\ShellNoRoam\BagMRU`
- `Software\Classes\Local Settings\Software\Microsoft\Windows\Shell\BagMRU`
- `Local Settings\Software\Microsoft\Windows\Shell\BagMRU`
- Parses binary shell item data using libfwsi
- Recursively processes nested ShellBag entries
- Compares cached timestamps with current file system state
## Forensic Value
ShellBags provide evidence of folder access that persists even after deletion. Investigators use this data to prove folder access on external drives, establish user interaction with specific directories, detect access to deleted folders, identify network share usage, track folder access on removable media, reconstruct user navigation patterns, and correlate folder access with other user activity.
---
# ShellFolders
> Source: https://kb.binalyze.ai/air/features/acquisition/supported-evidence/windows-collections-detail/shellfolders.html
## Overview
**Evidence:** ShellFolders
**Description:** Enumerate ShellFolders
**Category:** System
**Platform:** windows
**Short Name:** shelldirs
**Is Parsed:** Yes
**Sent to Investigation Hub:** Yes
**Collect File(s):** No
## Background
Windows Shell Folders are special directories that have specific purposes in the operating system (e.g., Desktop, Documents, Start Menu, AppData). Windows stores the configured paths for these folders in the registry, and users or applications can customize these locations.
Tracking these paths is important for forensic analysis because evidence artifacts may be in non-default locations if users have redirected their shell folders.
## Data Collected
This collector gathers structured data about shellfolders.
### ShellFolders Data
| Field | Description | Example |
|-------|-------------|---------|
| `Folder` | Shell folder name | Personal |
| `Path` | Configured folder path | C:\Users\user\Documents |
| `Username` | User account name | user |
| `KeyPath` | Registry key path | Software\Microsoft\Windows\CurrentVersion\Explorer\Shell Folders |
| `LastWriteTime` | Registry key last write time | 2023-10-15T14:30:00 |
| `RegPath` | Path to registry hive | Registry/ntuser.dat |
## Collection Method
This collector:
- Collects user registry hives (ntuser.dat)
- Searches for shell folder keys:
- `Software\Microsoft\Windows\CurrentVersion\Explorer\Shell Folders`
- `Software\Microsoft\Windows\CurrentVersion\Explorer\User Shell Folders`
- Enumerates all folder name-path pairs
- Records configured paths for each shell folder
Common shell folders include: Desktop, Personal (Documents), AppData, Start Menu, Favorites, SendTo, Recent, Startup, and many others.
## Forensic Value
Shell folder paths are essential for locating user artifacts in correct locations. Investigators use this data to identify custom artifact locations (non-default), track folder redirection policies, locate user data on network shares, find redirected AppData or Desktop locations, and understand user profile configuration.
---
# SDB
> Source: https://kb.binalyze.ai/air/features/acquisition/supported-evidence/windows-collections-detail/sdb.html
## Overview
**Evidence:** SDB
**Description:** Collect SDB
**Category:** System
**Platform:** windows
**Short Name:** sdb
**Is Parsed:** No
**Sent to Investigation Hub:** Yes
**Collect File(s):** Yes
## Background
Windows Application Compatibility infrastructure uses shim databases (.sdb files) to apply compatibility fixes to applications. Custom shim databases can be created to modify application behavior, redirect file access, inject DLLs, and perform other compatibility fixes.
Attackers have abused shim databases as a persistence mechanism and to inject malicious code into legitimate processes (similar to DLL search order hijacking).
## Data Collected
This collector gathers structured data about sdb.
### SDB Data
| Field | Description | Example |
|-------|-------------|---------|
| `Name` | Artifact name | SDB |
| `Type` | File | File |
| `SourcePath` | Original file path | C:\Windows\AppPatch\Custom\malicious.sdb |
| `Path` | Relative path in evidence | Other/malicious.sdb |
## Collection Method
This collector collects shim database files from:
- `Windows\apppatch\Custom\*.sdb` - Custom 32-bit shim databases
- `Windows\apppatch\Custom\Custom64\*.sdb` - Custom 64-bit shim databases
- `Windows\apppatch\*.sdb` - System shim databases
## Forensic Value
Shim databases can reveal application compatibility fixes and potential abuse for persistence or code injection. Investigators use this data to detect malicious shim persistence (MITRE T1546.011), identify DLL injection via shims, track custom compatibility fixes, and detect application behavior modifications.
---
# Skype Databases
> Source: https://kb.binalyze.ai/air/features/acquisition/supported-evidence/windows-collections-detail/skype-databases.html
## Overview
**Evidence:** Skype Databases
**Description:** Collect Skype Databases
**Category:** Applications
**Platform:** windows
**Short Name:** skypdb
**Is Parsed:** No
**Sent to Investigation Hub:** No
**Collect File(s):** Yes
## Background
Skype stores chat messages, call history, contacts, and configuration data in SQLite databases (main.db, skype.db) and XML files. Both classic Skype and modern UWP versions maintain these databases with message history and metadata.
## Data Collected
This collector gathers structured data about skype databases.
## Collection Method
This collector gathers Skype database files from Roaming, LocalState app packages, and legacy Application Data directories, collecting message databases, shared XML files, configuration files, and chat sync data.
## Forensic Value
Skype databases contain chat messages, call logs, contact lists, file transfer records, and user activities. This is essential for investigating communications, establishing timelines, identifying contacts, and recovering conversation evidence.
---
# Skype Media
> Source: https://kb.binalyze.ai/air/features/acquisition/supported-evidence/windows-collections-detail/skype-media.html
## Overview
**Evidence:** Skype Media
**Description:** Collect Skype Media
**Category:** Applications
**Platform:** windows
**Short Name:** skpym
**Is Parsed:** No
**Sent to Investigation Hub:** No
**Collect File(s):** Yes
## Background
Skype caches media files including profile avatars, thumbnails, copied/pasted images, and files sent/received through the application. These media files are stored in various cache and storage directories.
## Data Collected
This collector gathers structured data about skype media.
## Collection Method
This collector gathers Skype media directories including copy/paste image cache, avatars, thumbnails, general media, and send/receive storage folders from both UWP and classic Skype locations.
## Forensic Value
Skype media contains visual evidence from conversations including shared images, profile pictures, and transferred files. This helps identify participants, recover shared content, and understand the context of communications.
---
# Sophos Logs
> Source: https://kb.binalyze.ai/air/features/acquisition/supported-evidence/windows-collections-detail/sophos-logs.html
## Overview
**Evidence:** Sophos Logs
**Description:** Collect Sophos Logs
**Category:** Applications
**Platform:** windows
**Short Name:** sphsls
**Is Parsed:** No
**Sent to Investigation Hub:** No
**Collect File(s):** Yes
## Background
Sophos is a comprehensive endpoint security suite that includes antivirus, anti-malware, and network threat protection. It maintains logs across multiple components for various security functions including real-time protection and network monitoring.
## Data Collected
This collector gathers structured data about sophos logs.
## Collection Method
This collector gathers Sophos logs from multiple product components including antivirus, anti-malware, and network threat protection across both legacy and current installations.
## Forensic Value
Sophos logs provide extensive security event data including malware detections, network threat blocks, scan results, and intrusion attempts. They're essential for investigating multi-vector attacks and understanding comprehensive threat landscape.
---
# Sourcefire FireAMP Logs
> Source: https://kb.binalyze.ai/air/features/acquisition/supported-evidence/windows-collections-detail/sourcefire-fireamp-logs.html
## Overview
**Evidence:** Sourcefire FireAMP Logs
**Description:** Collect Sourcefire FireAMP Logs
**Category:** Applications
**Platform:** windows
**Short Name:** srcfrmpl
**Is Parsed:** No
**Sent to Investigation Hub:** No
**Collect File(s):** Yes
## Background
Sourcefire FireAMP is the legacy version of Cisco AMP for Endpoints, providing advanced malware protection and continuous analysis. It maintains database files with threat detection data and endpoint activity logs.
## Data Collected
This collector gathers structured data about sourcefire fireamp logs.
## Collection Method
This collector gathers Sourcefire FireAMP database files from the legacy Program Files installation directory, containing historical threat detection and endpoint monitoring data.
## Forensic Value
Sourcefire FireAMP databases provide legacy advanced malware detection data, file trajectory information, and retrospective analysis capabilities. They're valuable for investigating historical security incidents in environments with older Cisco security deployments.
---
# Splashtop Logs
> Source: https://kb.binalyze.ai/air/features/acquisition/supported-evidence/windows-collections-detail/splashtop-logs.html
## Overview
**Evidence:** Splashtop Logs
**Description:** Collect Splashtop Application Logs
**Category:** Applications
**Platform:** windows
**Short Name:** splstthwndlgs
**Is Parsed:** No
**Sent to Investigation Hub:** No
**Collect File(s):** Yes
## Background
Splashtop is a remote desktop and support application that maintains detailed logs of remote sessions, connections, and streaming activities. It's widely used for remote access and support.
## Data Collected
This collector gathers structured data about splashtop logs.
## Collection Method
This collector gathers Splashtop log files from ProgramData temp directories and installation directories, collecting connection and session records.
## Forensic Value
Splashtop logs reveal remote access sessions, connection times, user activities, and can identify unauthorized remote access or data exfiltration through remote desktop tools.
---
# Spotify Cache
> Source: https://kb.binalyze.ai/air/features/acquisition/supported-evidence/windows-collections-detail/spotify-cache.html
## Overview
**Evidence:** Spotify Cache
**Description:** Collect Spotify Cache
**Category:** Applications
**Platform:** windows
**Short Name:** sptfyc
**Is Parsed:** No
**Sent to Investigation Hub:** No
**Collect File(s):** Yes
## Background
Spotify caches web content, album artwork, and application data in its browser cache directory. This includes visual assets and cached data from the Spotify web player interface.
## Data Collected
This collector gathers structured data about spotify cache.
## Collection Method
This collector gathers the Spotify Browser Cache directory containing cached web content and media assets.
## Forensic Value
Spotify cache can reveal viewed content, album artwork, and application usage patterns. This supports user activity analysis and timeline reconstruction.
---
# Spotify Recently Played List
> Source: https://kb.binalyze.ai/air/features/acquisition/supported-evidence/windows-collections-detail/spotify-recently-played-list.html
## Overview
**Evidence:** Spotify Recently Played List
**Description:** Collect Spotify Recently Played List & Social Manager
**Category:** Applications
**Platform:** windows
**Short Name:** sptfyl
**Is Parsed:** No
**Sent to Investigation Hub:** No
**Collect File(s):** Yes
## Background
Spotify stores recently played tracks and social manager data in BNK (bank) files within user profiles. These files track listening history and social interactions within Spotify.
## Data Collected
This collector gathers structured data about spotify recently played list.
## Collection Method
This collector gathers Spotify recently_played.bnk and social_manager.bnk files from user profile directories containing playback history and social data.
## Forensic Value
Spotify listening history reveals user preferences, activity patterns, and timing information. This can establish user presence, create behavioral profiles, and support timeline analysis in investigations.
---
# SRUM
> Source: https://kb.binalyze.ai/air/features/acquisition/supported-evidence/windows-collections-detail/srum.html
## Overview
**Evidence:** SRUM
**Description:** Collect SRUM and Parse
**Category:** System
**Platform:** windows
**Short Name:** srum
**Is Parsed:** Yes
**Sent to Investigation Hub:** Yes
**Collect File(s):** Yes
## Background
The System Resource Usage Monitor (SRUM) is a Windows feature introduced in Windows 8 that tracks application resource usage, network data consumption, and energy usage over time. The data is stored in an ESE database at `C:\Windows\System32\SRU\SRUDB.dat`.
SRUM provides historical information about application execution, network usage per application, and user activity patterns. This data persists for up to 60 days (configurable) and survives reboots.
## Data Collected
This collector gathers structured data about srum.
### SRUM Data
| Field | Description | Example |
|-------|-------------|---------|
| `AutoInc` | Auto-increment ID | 1 |
| `Timestamp` | Time of the resource usage sample | 2023-10-15T14:30:00 |
| `ApplicationName` | Path to application | C:\Program Files\Chrome\chrome.exe |
| `UserSID` | User security identifier | S-1-5-21-... |
| `Username` | Username | DOMAIN\user |
| `ForegroundCycleTime` | CPU time in foreground | 12345678 |
| `BackgroundCycleTime` | CPU time in background | 5678901 |
| `FaceTime` | Time application was in focus | 3600000 |
| `ForegroundContextSwitches` | Context switches while foreground | 1234 |
| `BackgroundContextSwitches` | Context switches while background | 5678 |
| `ForegroundBytesRead` | Bytes read in foreground | 1048576 |
| `ForegroundBytesWritten` | Bytes written in foreground | 524288 |
| `ForegroundNumReadOperations` | Read operations in foreground | 100 |
| `ForegroundNumWriteOperations` | Write operations in foreground | 50 |
| `ForegroundNumberOfFlushes` | Flush operations in foreground | 10 |
| `BackgroundBytesRead` | Bytes read in background | 2097152 |
| `BackgroundBytesWritten` | Bytes written in background | 1048576 |
| `BackgroundNumReadOperations` | Read operations in background | 200 |
| `BackgroundNumWriteOperations` | Write operations in background | 100 |
| `BackgroundNumberOfFlushes` | Flush operations in background | 20 |
| `AutoInc` | Auto-increment ID | 1 |
| `Timestamp` | Time of the network usage sample | 2023-10-15T14:30:00 |
| `ApplicationName` | Path to application | C:\Program Files\Chrome\chrome.exe |
| `UserSID` | User security identifier | S-1-5-21-... |
| `Username` | Username | DOMAIN\user |
| `InterfaceLuid` | Network interface LUID | 123456789 |
| `ProfileID` | Network profile identifier | 1 |
| `ProfileFlags` | Profile flags | 0 |
| `BytesSent` | Bytes sent over network | 10485760 |
| `BytesRecvd` | Bytes received over network | 52428800 |
## Collection Method
This collector:
- Collects the SRUM database: `Windows\System32\SRU\SRUDB.dat`
- Uses the libesedb library to parse the ESE database format
- Extracts application resource usage records
- Extracts network data usage records
- Resolves SIDs to usernames
## Forensic Value
SRUM provides unique historical visibility into application behavior and network usage patterns. Investigators use this data to establish application execution timelines (up to 60 days), identify data exfiltration volumes, track network usage per application, detect unauthorized application usage, correlate user activity with network traffic, identify resource-intensive malware, and establish baseline application behavior.
---
# Startup Items
> Source: https://kb.binalyze.ai/air/features/acquisition/supported-evidence/windows-collections-detail/startup-items.html
## Overview
**Evidence:** Startup Items
**Description:** Enumerate Startup Items
**Category:** System
**Platform:** windows
**Short Name:** strtppr
**Is Parsed:** Yes
**Sent to Investigation Hub:** Yes
**Collect File(s):** Yes
## Background
Windows Startup folders contain programs and shortcuts that run automatically when a user logs on. There are per-user and all-users startup folders that Windows processes during logon.
This is one of the most common persistence mechanisms and is easily accessible to users and malware. Startup folder contents can include executables, scripts, and LNK (shortcut) files.
## Data Collected
This collector gathers structured data about startup items.
### Startup Items Data
| Field | Description | Example |
|-------|-------------|---------|
| `Entry` | Path to startup item | C:\Users\user\AppData\Roaming\Microsoft\Windows\Start Menu\Programs\Startup\malware.lnk |
| `LNKHash` | Hash of LNK file | SHA256:a1b2c3... |
| `LNKFileModified` | LNK file modified time | 2023-10-15T14:30:00 |
| `LNKFileAccessed` | LNK file accessed time | 2023-10-15T15:45:00 |
| `LNKFileCreated` | LNK file creation time | 2023-10-15T14:00:00 |
| `CommandLine` | Target command line | C:\Temp\malware.exe --hidden |
| `AutorunsStartupFolderRowID` | Foreign key to startup entry | 1 |
## Collection Method
This collector searches startup folders:
- `Users\*\AppData\Roaming\Microsoft\Windows\Start Menu\Programs\Startup`
- `ProgramData\Microsoft\Windows\Start Menu\Programs\StartUp`
For each file found:
- If it's a LNK file, parses it to extract target path and arguments
- Calculates hash of the LNK file
- Extracts LNK timestamps
- Parses command line for executables and arguments
- If not a LNK file, treats the file itself as the startup item
## Forensic Value
Startup folder analysis is fundamental for detecting persistence mechanisms. Investigators use this data to identify malicious startup items, detect unauthorized persistence, track legitimate startup applications, identify suspicious LNK files, verify startup item legitimacy, correlate with malware execution, and detect persistence via shortcuts.
---
# Sublime Text Sessions
> Source: https://kb.binalyze.ai/air/features/acquisition/supported-evidence/windows-collections-detail/sublime-text-sessions.html
## Overview
**Evidence:** Sublime Text Sessions
**Description:** Collect Sublime Text Sessions & Contents
**Category:** Applications
**Platform:** windows
**Short Name:** sblm
**Is Parsed:** No
**Sent to Investigation Hub:** No
**Collect File(s):** Yes
## Background
Sublime Text stores session files containing open files, cursor positions, edit history, and workspace state. These session files maintain the editor state between sessions.
## Data Collected
This collector gathers structured data about sublime text sessions.
## Collection Method
This collector gathers Sublime Text session files from the Roaming profile Local directory containing workspace and editor state information.
## Forensic Value
Sublime Text sessions reveal files being edited, code projects, file paths, and editing history. This is valuable for identifying accessed code, configuration files, scripts, or documents of interest in investigations.
---
# SUPERAntiSpyware Logs
> Source: https://kb.binalyze.ai/air/features/acquisition/supported-evidence/windows-collections-detail/superantispyware-logs.html
## Overview
**Evidence:** SUPERAntiSpyware Logs
**Description:** Collect SUPERAntiSpyware Logs
**Category:** Applications
**Platform:** windows
**Short Name:** sprasprls
**Is Parsed:** No
**Sent to Investigation Hub:** No
**Collect File(s):** Yes
## Background
SUPERAntiSpyware is a specialized anti-spyware and anti-malware tool that focuses on removing spyware, adware, trojans, and other threats. It maintains user-specific logs of scan activities and detections.
## Data Collected
This collector gathers structured data about superantispyware logs.
## Collection Method
This collector gathers SUPERAntiSpyware log files from user-specific AppData Roaming directories, which contain scan histories and detection records.
## Forensic Value
SUPERAntiSpyware logs help identify spyware, adware, and tracking components that may compromise privacy and security. They provide evidence of potentially unwanted programs and surveillance software.
---
# Superfetch
> Source: https://kb.binalyze.ai/air/features/acquisition/supported-evidence/windows-collections-detail/superfetch.html
## Overview
**Evidence:** Superfetch
**Description:** Collect Superfetch Files
**Category:** System
**Platform:** windows
**Short Name:** sprf
**Is Parsed:** No
**Sent to Investigation Hub:** Yes
**Collect File(s):** Yes
## Background
SuperFetch (now called SysMain in Windows 10) is a Windows service that analyzes application usage patterns to optimize system performance by preloading frequently used applications into memory. The service maintains database files (Ag*.db) that track application usage patterns.
These database files can provide historical information about application execution and usage patterns.
## Data Collected
This collector gathers structured data about superfetch.
### Superfetch Data
| Field | Description | Example |
|-------|-------------|---------|
| `Name` | Artifact name | SuperFetch |
| `Type` | File | File |
| `SourcePath` | Original file path | C:\Windows\Prefetch\AgAppLaunch.db |
| `Path` | Relative path in evidence | Other/AgAppLaunch.db |
## Collection Method
This collector collects SuperFetch files from:
- `Windows\Prefetch\Ag*.db`
- `Windows\Prefetch\Ag*.db.trx` (transaction files)
## Forensic Value
SuperFetch databases can provide historical application usage information. Investigators use this data to track application execution patterns, identify frequently used applications, and analyze system performance characteristics.
---
# Supremo Remote Desktop Logs
> Source: https://kb.binalyze.ai/air/features/acquisition/supported-evidence/windows-collections-detail/supremo-remote-desktop-logs.html
## Overview
**Evidence:** Supremo Remote Desktop Logs
**Description:** Collect Supremo Remote Desktop Application Logs
**Category:** Applications
**Platform:** windows
**Short Name:** sprmdsklg
**Is Parsed:** No
**Sent to Investigation Hub:** No
**Collect File(s):** Yes
## Background
Supremo is a remote desktop application that maintains detailed logs of remote connections, file transfers, and user activities during remote sessions.
## Data Collected
This collector gathers structured data about supremo remote desktop logs.
## Collection Method
This collector gathers log files from the SupremoRemoteDesktop Log directory containing connection and session information.
## Forensic Value
Supremo logs help identify remote access sessions, file transfers, and user activities during remote control. This is crucial for detecting unauthorized access, data exfiltration, and lateral movement through remote desktop tools.
---
# Swap File
> Source: https://kb.binalyze.ai/air/features/acquisition/supported-evidence/windows-collections-detail/swap-file.html
## Overview
**Evidence:** Swap File
**Description:** Dump system swap file
**Category:** Memory
**Platform:** windows
**Short Name:** swp
**Is Parsed:** No
**Sent to Investigation Hub:** Yes
**Collect File(s):** Yes
## Background
The swap file (swapfile.sys) was introduced in Windows 8 to support Modern/Metro apps and improve performance. It works similarly to the pagefile but is specifically optimized for Windows Store apps and suspended app state.
Like the pagefile, the swap file can contain memory remnants including sensitive data that was swapped out.
## Data Collected
This collector gathers structured data about swap file.
### Swap File Data
| Field | Description | Example |
|-------|-------------|---------|
| `Type` | File type | SwapFile |
| `Name` | File name | swapfile.sys |
| `SourcePath` | Original file path | C:\swapfile.sys |
| `FilePath` | Relative path in evidence | Files/swapfile.sys |
| `FileSize` | File size in bytes | 268435456 |
## Collection Method
This collector collects the swap file from:
- `C:\swapfile.sys` (default location)
The file is collected using driver or NTFS raw access if locked.
## Forensic Value
Swap files can contain sensitive data from Windows Store apps and suspended processes. Investigators use this data for memory forensics on Windows 8+ systems, recovering app state information, extracting credentials from Modern apps, and analyzing suspended process memory.
---
# Symantec Logs
> Source: https://kb.binalyze.ai/air/features/acquisition/supported-evidence/windows-collections-detail/symantec-logs.html
## Overview
**Evidence:** Symantec Logs
**Description:** Collect Symantec Logs
**Category:** Applications
**Platform:** windows
**Short Name:** symntcls
**Is Parsed:** No
**Sent to Investigation Hub:** No
**Collect File(s):** Yes
## Background
Symantec Endpoint Protection is an enterprise security solution providing antivirus, anti-malware, firewall, and intrusion prevention. It maintains extensive logs, EVTX event logs, quarantine data, and SDK communication logs across multiple directories.
## Data Collected
This collector gathers structured data about symantec logs.
## Collection Method
This collector gathers Symantec logs from multiple locations including AV logs, user-specific logs, Windows event logs, quarantine directories, and client communication SDK logs across legacy and current installations.
## Forensic Value
Symantec logs provide comprehensive security visibility including virus detections, quarantined files, intrusion prevention alerts, and client-server communications. They're critical for enterprise security investigations and understanding threat distribution across endpoints.
---
# System Restore Points Information
> Source: https://kb.binalyze.ai/air/features/acquisition/supported-evidence/windows-collections-detail/system-restore-points-information.html
## Overview
**Evidence:** System Restore Points Information
**Description:** Collect information about system restore points
**Category:** System
**Platform:** windows
**Short Name:** rpi
**Is Parsed:** Yes
**Sent to Investigation Hub:** Yes
**Collect File(s):** No
## Background
System Restore creates restore points that snapshot system configuration and registry state. These snapshots allow Windows to revert to a previous state if problems occur.
Restore point metadata includes creation time, description, and type information. While the actual restore point data (in System Volume Information) is not collected, the metadata provides evidence of system state changes and potential restoration events.
## Data Collected
This collector gathers structured data about system restore points information.
### System Restore Points Information Data
| Field | Description | Example |
|-------|-------------|---------|
| `Description` | Restore point description | Automatic Restore Point |
| `CreationTime` | When restore point was created | 2023-10-01T10:00:00 |
| `RestorePointType` | Type of restore point | 12 |
| `EventType` | Event type | 100 |
## Collection Method
This collector queries WMI for restore point information:
- WMI namespace: `ROOT\DEFAULT`
- WMI query: `SELECT * FROM SystemRestore`
The query returns all restore points with their metadata.
## Forensic Value
Restore point information helps track system configuration changes and potential malware installation timeframes. Investigators use this data to identify when system changes occurred, correlate with malware installation, track software installation events, and identify potential restoration attempts.
---
# Tanium Logs
> Source: https://kb.binalyze.ai/air/features/acquisition/supported-evidence/windows-collections-detail/tanium-logs.html
## Overview
**Evidence:** Tanium Logs
**Description:** Collect Tanium Logs
**Category:** Applications
**Platform:** windows
**Short Name:** tnml
**Is Parsed:** No
**Sent to Investigation Hub:** No
**Collect File(s):** Yes
## Background
Tanium is an enterprise endpoint management and security platform that provides real-time visibility and control. The monitor.db database contains endpoint monitoring data, system state information, and client activity logs.
## Data Collected
This collector gathers structured data about tanium logs.
## Collection Method
This collector gathers the Tanium Client monitor database from Program Files, which contains comprehensive endpoint monitoring and management data.
## Forensic Value
Tanium's monitor database provides critical endpoint visibility including system inventory, deployed software, running processes, and security posture. It's valuable for investigating endpoint activities and understanding enterprise security state.
---
# TCP Table
> Source: https://kb.binalyze.ai/air/features/acquisition/supported-evidence/windows-collections-detail/tcp-table.html
## Overview
**Evidence:** TCP Table
**Description:** Collect TCP Table
**Category:** Network
**Platform:** windows
**Short Name:** tcpt
**Is Parsed:** Yes
**Sent to Investigation Hub:** Yes
**Collect File(s):** No
## Background
Windows maintains a table of all active TCP connections including local/remote addresses, ports, connection state, and the process ID that owns each connection.
Active TCP connections can reveal malware C2 communications, lateral movement, data exfiltration, and unauthorized network access in progress.
## Data Collected
This collector gathers structured data about tcp table.
### TCP Table Data
| Field | Description | Example |
|-------|-------------|---------|
| `State` | Connection state | 5 (ESTABLISHED) |
| `Local` | Local IP address | 192.168.1.100 |
| `LocalPort` | Local port number | 49152 |
| `Remote` | Remote IP address | 93.184.216.34 |
| `RemotePort` | Remote port number | 443 |
| `ProcessID` | Owning process ID | 1234 |
## Collection Method
This collector uses Windows API to enumerate TCP connections:
- `GetExtendedTcpTable` with `TCP_TABLE_OWNER_PID_ALL` flag
- Includes all TCP connection states
- Associates connections with process IDs
TCP states include: CLOSED, LISTEN, SYN_SENT, SYN_RECEIVED, ESTABLISHED, FIN_WAIT_1, FIN_WAIT_2, CLOSE_WAIT, CLOSING, LAST_ACK, TIME_WAIT.
## Forensic Value
Active TCP connections can reveal ongoing malicious activity. Investigators use this data to identify active C2 communications, detect data exfiltration in progress, track lateral movement connections, identify unauthorized remote access, correlate network activity with processes, and detect suspicious port usage.
---
# Teamviewer Logs
> Source: https://kb.binalyze.ai/air/features/acquisition/supported-evidence/windows-collections-detail/teamviewer-logs.html
## Overview
**Evidence:** Teamviewer Logs
**Description:** Collect Teamviewer Connection Logs
**Category:** Applications
**Platform:** windows
**Short Name:** tml
**Is Parsed:** No
**Sent to Investigation Hub:** No
**Collect File(s):** Yes
## Background
TeamViewer is a widely-used remote desktop and support software. It maintains extensive logs of connections, file transfers, and recent connections (MRU). Connection logs contain partner IDs, session times, and access details.
## Data Collected
This collector gathers structured data about teamviewer logs.
## Collection Method
This collector gathers TeamViewer logs, connection text files, and MRU (Most Recently Used) connection history from both installation and user profile directories.
## Forensic Value
TeamViewer logs are critical for investigating unauthorized remote access, as the software is frequently abused by attackers for initial access and persistence. Logs reveal connection partners, session times, file transfers, and can link to specific TeamViewer IDs used by threat actors.
---
# Telegram Desktop Data
> Source: https://kb.binalyze.ai/air/features/acquisition/supported-evidence/windows-collections-detail/telegram-desktop-data.html
## Overview
**Evidence:** Telegram Desktop Data
**Description:** Collect Telegram Desktop Data
**Category:** Applications
**Platform:** windows
**Short Name:** tlgrmdd
**Is Parsed:** No
**Sent to Investigation Hub:** No
**Collect File(s):** Yes
## Background
Telegram Desktop stores chat messages, media, cache, and configuration data in its application directory. This includes encrypted message databases, cached files, and user settings.
## Data Collected
This collector gathers structured data about telegram desktop data.
## Collection Method
This collector gathers the entire Telegram Desktop directory from the Roaming profile, collecting messages, media, and configuration data.
## Forensic Value
Telegram data contains chat messages, shared media, contact information, and channel subscriptions. This is valuable for investigating communications, shared content, and connections to groups or channels involved in investigations.
---
# Telegram Desktop Download
> Source: https://kb.binalyze.ai/air/features/acquisition/supported-evidence/windows-collections-detail/telegram-desktop-download.html
## Overview
**Evidence:** Telegram Desktop Download
**Description:** Collect Telegram Desktop Download Folder
**Category:** Applications
**Platform:** windows
**Short Name:** tlgrmdf
**Is Parsed:** No
**Sent to Investigation Hub:** No
**Collect File(s):** Yes
## Background
Telegram Desktop downloads files shared in chats to a dedicated folder in the user's Downloads directory. This includes documents, images, videos, and other media shared through the application.
## Data Collected
This collector gathers structured data about telegram desktop download.
## Collection Method
This collector gathers the Telegram Desktop downloads folder from the user's Downloads directory containing files received through Telegram.
## Forensic Value
Telegram downloads contain files shared in conversations, which may include evidence, malicious files, documents, or media relevant to investigations. File timestamps show when content was received.
---
# Thumbcache
> Source: https://kb.binalyze.ai/air/features/acquisition/supported-evidence/windows-collections-detail/thumbcache.html
## Overview
**Evidence:** Thumbcache
**Description:** Collect Thumbcache
**Category:** System
**Platform:** windows
**Short Name:** tc
**Is Parsed:** No
**Sent to Investigation Hub:** Yes
**Collect File(s):** Yes
## Background
Windows creates thumbnail images of pictures, videos, and documents for display in Explorer. These thumbnails are cached in database files (thumbcache_*.db) to improve performance.
Thumbnail caches can preserve images of files even after the original files are deleted, providing visual evidence of file content and user activity.
## Data Collected
This collector gathers structured data about thumbcache.
### Thumbcache Data
| Field | Description | Example |
|-------|-------------|---------|
| `Name` | Artifact name | Thumbcache |
| `Type` | File | File |
| `SourcePath` | Original file path | C:\Users\user\AppData\Local\Microsoft\Windows\Explorer\thumbcache_256.db |
| `Path` | Relative path in evidence | Other/thumbcache_256.db |
## Collection Method
This collector collects thumbcache files from:
- `Users\*\AppData\Local\Microsoft\Windows\Explorer\thumbcache_*.db`
Multiple database files exist for different thumbnail sizes (32, 96, 256, 1024, etc.).
## Forensic Value
Thumbnail caches can recover visual evidence from deleted images and documents. Investigators use this data to recover thumbnail images from deleted files, prove user access to images/documents, identify viewed media content, and establish visual evidence of file content.
---
# TightVNC Logs
> Source: https://kb.binalyze.ai/air/features/acquisition/supported-evidence/windows-collections-detail/tightvnc-logs.html
## Overview
**Evidence:** TightVNC Logs
**Description:** Collect TightVNC Application Logs
**Category:** Applications
**Platform:** windows
**Short Name:** tthtvnclg
**Is Parsed:** No
**Sent to Investigation Hub:** No
**Collect File(s):** Yes
## Background
TightVNC is an open-source remote desktop software that logs server connections and session activity. These logs track which clients connected, when, and what actions were performed during remote sessions.
## Data Collected
This collector gathers structured data about tightvnc logs.
## Collection Method
This collector gathers TightVNC server log files from the ProgramData directory containing connection and session records.
## Forensic Value
TightVNC logs help identify unauthorized remote access, track remote session activity, and establish timelines for remote desktop connections. This is useful for detecting compromised systems and lateral movement.
---
# Tortoise Git Logs
> Source: https://kb.binalyze.ai/air/features/acquisition/supported-evidence/windows-collections-detail/tortoise-git-logs.html
## Overview
**Evidence:** Tortoise Git Logs
**Description:** Collect Tortoise Git Synchronization Logs
**Category:** Applications
**Platform:** windows
**Short Name:** trtl
**Is Parsed:** No
**Sent to Investigation Hub:** No
**Collect File(s):** Yes
## Background
TortoiseGit is a Windows Shell Interface to Git that maintains logs of Git operations including commits, pulls, pushes, and synchronization activities with remote repositories.
## Data Collected
This collector gathers structured data about tortoise git logs.
## Collection Method
This collector gathers TortoiseGit log files from the Local AppData directory containing Git operation history.
## Forensic Value
TortoiseGit logs reveal Git repository operations, commit activities, repository URLs, and synchronization events. This helps identify code repositories accessed, commits made, and can reveal unauthorized repository access or intellectual property theft.
---
# TotalAv Logs
> Source: https://kb.binalyze.ai/air/features/acquisition/supported-evidence/windows-collections-detail/totalav-logs.html
## Overview
**Evidence:** TotalAv Logs
**Description:** Collect TotalAv Logs
**Category:** Applications
**Platform:** windows
**Short Name:** ttlals
**Is Parsed:** No
**Sent to Investigation Hub:** No
**Collect File(s):** Yes
## Background
TotalAV is a consumer antivirus solution that maintains logs of malware detections, system scans, real-time protection events, and security activities in dedicated log directories within both program files and program data.
## Data Collected
This collector gathers structured data about totalav logs.
## Collection Method
This collector gathers TotalAV log files from both Program Files installation directory and ProgramData locations, capturing comprehensive antivirus activity logs.
## Forensic Value
TotalAV logs provide evidence of malware detections, scan histories, real-time protection events, and user security actions. They're useful for investigating consumer endpoint compromises and understanding threat exposure.
---
# Trend Micro Logs
> Source: https://kb.binalyze.ai/air/features/acquisition/supported-evidence/windows-collections-detail/trend-micro-logs.html
## Overview
**Evidence:** Trend Micro Logs
**Description:** Collect Trend Micro Logs
**Category:** Applications
**Platform:** windows
**Short Name:** trmcrls
**Is Parsed:** No
**Sent to Investigation Hub:** No
**Collect File(s):** Yes
## Background
Trend Micro is an enterprise security solution including OfficeScan, Worry-Free Business Security, and Apex One. It maintains detailed logs across multiple components including security agent reports, connection logs, and personal firewall logs.
## Data Collected
This collector gathers structured data about trend micro logs.
## Collection Method
This collector gathers Trend Micro logs from ProgramData and Program Files including Security Agent reports, connection logs, and Personal Firewall (PFW) logs across different product versions.
## Forensic Value
Trend Micro logs are essential for enterprise security investigations, providing malware detections, agent communications, firewall blocks, and threat intelligence. They help reconstruct attack timelines and analyze endpoint security posture.
---
# Twitter Cache
> Source: https://kb.binalyze.ai/air/features/acquisition/supported-evidence/windows-collections-detail/twitter-cache.html
## Overview
**Evidence:** Twitter Cache
**Description:** Collect Twitter Store Application Cache
**Category:** Applications
**Platform:** windows
**Short Name:** twtc
**Is Parsed:** No
**Sent to Investigation Hub:** No
**Collect File(s):** Yes
## Background
Twitter caches web content, images, and media in the INetCache directory. This includes profile pictures, tweet images, and other visual content viewed through the app.
## Data Collected
This collector gathers structured data about twitter cache.
## Collection Method
This collector gathers the Twitter app INetCache directory containing cached web content and media files.
## Forensic Value
Twitter cache contains visual evidence including profile pictures, tweeted images, and viewed content. This helps recover media, identify viewed profiles, and understand user interactions on the platform.
---
# Twitter Databases
> Source: https://kb.binalyze.ai/air/features/acquisition/supported-evidence/windows-collections-detail/twitter-databases.html
## Overview
**Evidence:** Twitter Databases
**Description:** Collect Twitter Store Application Databases
**Category:** Applications
**Platform:** windows
**Short Name:** twtdb
**Is Parsed:** No
**Sent to Investigation Hub:** No
**Collect File(s):** Yes
## Background
Twitter (X) Windows Store app maintains SQLite databases containing timeline data, messages, user information, and cached content. These databases store local data from the Twitter service.
## Data Collected
This collector gathers structured data about twitter databases.
## Collection Method
This collector gathers SQLite database files from the Twitter app package LocalState directory containing app data and cached information.
## Forensic Value
Twitter databases reveal user activity, followed accounts, direct messages, timeline interactions, and cached tweets. This helps investigate social media activity, communications, and connections to other users or events.
---
# TypedPaths
> Source: https://kb.binalyze.ai/air/features/acquisition/supported-evidence/windows-collections-detail/typedpaths.html
## Overview
**Evidence:** TypedPaths
**Description:** Enumerate TypedPaths
**Category:** System
**Platform:** windows
**Short Name:** typedpaths
**Is Parsed:** Yes
**Sent to Investigation Hub:** Yes
**Collect File(s):** No
## Background
Windows Explorer maintains a history of paths that users manually type into the Explorer address bar. This registry artifact tracks folder navigation through typing rather than clicking, providing evidence of deliberate user navigation to specific locations.
This can reveal user knowledge of specific file locations, hidden folders, network shares, and administrative directories.
## Data Collected
This collector gathers structured data about typedpaths.
### TypedPaths Data
| Field | Description | Example |
|-------|-------------|---------|
| `Value` | Registry value name | url1 |
| `Path` | Typed path | C:\Users\user\AppData\Local\Temp\suspicious |
| `Username` | User account name | user |
| `KeyPath` | Registry key path | Software\Microsoft\Windows\CurrentVersion\Explorer\TypedPaths |
| `LastWriteTime` | Registry key last write time | 2023-10-15T14:30:00 |
| `RegPath` | Path to registry hive | Registry/ntuser.dat |
## Collection Method
This collector:
- Collects user registry hives (ntuser.dat)
- Searches for: `Software\Microsoft\Windows\CurrentVersion\Explorer\TypedPaths`
- Enumerates all values under the key
- Extracts the typed path strings
- Records registry key last write time
## Forensic Value
Typed paths reveal deliberate user navigation and knowledge of specific locations. Investigators use this data to prove user knowledge of hidden folders, identify access to suspicious directories, track network share navigation, detect attempts to access admin folders, establish intent through manual navigation, and identify typed paths to malware locations.
---
# TypedURLs
> Source: https://kb.binalyze.ai/air/features/acquisition/supported-evidence/windows-collections-detail/typedurls.html
## Overview
**Evidence:** TypedURLs
**Description:** Enumerate TypedURLs
**Category:** System
**Platform:** windows
**Short Name:** typedurls
**Is Parsed:** Yes
**Sent to Investigation Hub:** Yes
**Collect File(s):** No
## Background
Internet Explorer maintains a list of URLs that users manually type into the address bar (as opposed to clicking links). This registry artifact provides evidence of deliberate navigation to specific websites and can indicate user intent or knowledge.
TypedURLs are stored in the user's registry hive along with optional timestamp information in the TypedURLsTime key (Windows 7+).
## Data Collected
This collector gathers structured data about typedurls.
### TypedURLs Data
| Field | Description | Example |
|-------|-------------|---------|
| `URL` | Typed URL | https://www.example.com |
| `AccessTime` | When URL was typed (if available) | 2023-10-15T14:30:00 |
| `Username` | User account name | user |
| `KeyPath` | Registry key path | Software\Microsoft\Internet Explorer\TypedURLs |
| `LastWriteTime` | Registry key last write time | 2023-10-15T14:30:00 |
| `RegPath` | Path to registry hive | Registry/ntuser.dat |
## Collection Method
This collector:
- Collects user registry hives (ntuser.dat)
- Searches for: `Software\Microsoft\Internet Explorer\TypedURLs`
- Reads URL values (url1, url2, etc.)
- Reads corresponding timestamps from `TypedURLsTime` key (if available)
- Converts FILETIME values to readable timestamps
## Forensic Value
Typed URLs reveal deliberate user navigation and can indicate intent or knowledge. Investigators use this data to identify manually entered malicious URLs, detect phishing site visits, prove user knowledge of specific websites, track direct navigation to C2 infrastructure, establish user intent through URL typing, and correlate with browser history and downloads.
---
# UDP Table
> Source: https://kb.binalyze.ai/air/features/acquisition/supported-evidence/windows-collections-detail/udp-table.html
## Overview
**Evidence:** UDP Table
**Description:** Collect UDP Table
**Category:** Network
**Platform:** windows
**Short Name:** udpt
**Is Parsed:** Yes
**Sent to Investigation Hub:** Yes
**Collect File(s):** No
## Background
Windows maintains a table of all UDP endpoints (listening ports) including the local address, port, and process ID that owns each endpoint. Unlike TCP, UDP is connectionless, so only local endpoints are tracked.
UDP is commonly used for DNS, DHCP, and various application protocols. Malware may also use UDP for C2 communications or data exfiltration.
## Data Collected
This collector gathers structured data about udp table.
### UDP Table Data
| Field | Description | Example |
|-------|-------------|---------|
| `Local` | Local IP address | 0.0.0.0 |
| `LocalPort` | Local UDP port number | 137 |
| `ProcessID` | Owning process ID | 4 |
## Collection Method
This collector uses Windows API to enumerate UDP endpoints:
- `GetExtendedUdpTable` with `UDP_TABLE_OWNER_PID` flag
- Returns all UDP listening ports
- Associates endpoints with process IDs
## Forensic Value
UDP endpoints can reveal services and potential backdoors. Investigators use this data to identify listening UDP services, detect unusual UDP ports, track DNS client activity, correlate UDP usage with processes, and identify potential UDP-based C2 channels.
---
# Ultraviewer Logs
> Source: https://kb.binalyze.ai/air/features/acquisition/supported-evidence/windows-collections-detail/ultraviewer-logs.html
## Overview
**Evidence:** Ultraviewer Logs
**Description:** Collect Ultraviewer Logs
**Category:** Applications
**Platform:** windows
**Short Name:** ltrl
**Is Parsed:** No
**Sent to Investigation Hub:** No
**Collect File(s):** Yes
## Background
UltraViewer is a remote desktop application that stores logs, configuration data, and chat logs. The software has been observed in tech support scams and unauthorized remote access incidents.
## Data Collected
This collector gathers structured data about ultraviewer logs.
## Collection Method
This collector gathers UltraViewer application data, log files, text files, and chat logs from installation and user profile directories.
## Forensic Value
UltraViewer artifacts are valuable for investigating tech support scams, unauthorized remote access, and social engineering attacks. Chat logs can reveal conversations between attackers and victims, and logs show remote session details.
---
# UltraVNC Logs
> Source: https://kb.binalyze.ai/air/features/acquisition/supported-evidence/windows-collections-detail/ultravnc-logs.html
## Overview
**Evidence:** UltraVNC Logs
**Description:** Collect UltraVNC Application Specific Log Files
**Category:** Applications
**Platform:** windows
**Short Name:** ultravnclgs
**Is Parsed:** No
**Sent to Investigation Hub:** No
**Collect File(s):** Yes
## Background
UltraVNC is an open-source remote desktop application that logs connection events, authentication attempts, and session activities. It's commonly used for remote support and administration.
## Data Collected
This collector gathers structured data about ultravnc logs.
## Collection Method
This collector gathers UltraVNC log files from ProgramData directories containing connection and session information.
## Forensic Value
UltraVNC logs help identify remote desktop sessions, authentication attempts, and connection patterns. They're valuable for investigating unauthorized remote access and lateral movement.
---
# USB Storage History
> Source: https://kb.binalyze.ai/air/features/acquisition/supported-evidence/windows-collections-detail/usb-storage-history.html
## Overview
**Evidence:** USB Storage History
**Description:** Collect USB Storage History
**Category:** DiskFilesystem
**Platform:** windows
**Short Name:** usbmsc
**Is Parsed:** Yes
**Sent to Investigation Hub:** Yes
**Collect File(s):** No
## Background
Windows tracks all USB mass storage devices that connect to the system in the registry. This includes USB flash drives, external hard drives, and MTP devices. The registry maintains connection timestamps, device identifiers, and device descriptions.
This information persists even after the device is removed, providing historical evidence of USB device usage that can indicate data exfiltration or unauthorized device connections.
## Data Collected
This collector gathers structured data about usb storage history.
### USB Storage History Data
| Field | Description | Example |
|-------|-------------|---------|
| `FriendlyName` | Device friendly name | SanDisk Ultra USB Device |
| `DeviceDesc` | Device description | USB Mass Storage Device |
| `Serial` | Device serial number | 123456789ABCDEF |
| `VendorID` | USB vendor ID | 0781 |
| `ProductID` | USB product ID | 5581 |
| `Install` | Installation timestamp | 2023-10-01T14:00:00 |
| `FirstInstall` | First installation timestamp | 2023-09-15T10:00:00 |
| `LastArrival` | Last connection timestamp | 2023-10-15T09:00:00 |
| `LastRemoval` | Last disconnection timestamp | 2023-10-15T17:00:00 |
| `RegistryTime1` | First registry modification time | 2023-09-15T10:00:00 |
| `RegistryTime2` | Second registry modification time | 2023-10-15T17:00:00 |
## Collection Method
This collector parses the offline SYSTEM registry hive to extract USB device information from:
- `ControlSet*\Enum\USB\*\*` - USB device entries
- `ControlSet*\Enum\USBSTOR\*\*` - USB storage device entries
- `ControlSet*\Control\DeviceClasses\{a5dcbf10-6530-11d2-901f-00c04fb951ed}` - Device class timestamps
The collector correlates information across multiple registry keys to build complete device profiles with accurate timestamps.
## Forensic Value
USB device history is critical for data exfiltration investigations and insider threat detection. Investigators use this data to identify unauthorized USB devices, establish device connection timelines, detect data theft via USB drives, track specific devices across multiple systems, correlate device usage with user activity, and identify devices used for malware delivery.
---
# User Access Logs (UAL)
> Source: https://kb.binalyze.ai/air/features/acquisition/supported-evidence/windows-collections-detail/user-access-logs-ual.html
## Overview
**Evidence:** User Access Logs (UAL)
**Description:** Collect and Parse User Access Logs
**Category:** System
**Platform:** windows
**Short Name:** ual
**Is Parsed:** Yes
**Sent to Investigation Hub:** Yes
**Collect File(s):** Yes
## Background
User Access Logs (UAL/SUM) databases record authenticated user accesses to roles/services, including addresses and counts. This data is essential for auditing remote access and service usage.
## Data Collected
This collector gathers structured data about user access logs (ual).
## Collection Method
This collector collects SystemIdentity.mdb and Current.mdb files, reads SystemIdentity.mdb to resolve roles and chained databases, then parses SUM .mdb files to extract client access records into `user_access_logs`.
## Forensic Value
This evidence is crucial for forensic investigations as it reveals who accessed what and when, aiding in lateral movement and unauthorized access analysis.
---
# User Folders
> Source: https://kb.binalyze.ai/air/features/acquisition/supported-evidence/windows-collections-detail/user-folders.html
## Overview
**Evidence:** User Folders
**Description:** Collect User Folders Information
**Category:** System
**Platform:** windows
**Short Name:** usrfldrs
**Is Parsed:** Yes
**Sent to Investigation Hub:** Yes
**Collect File(s):** No
## Background
Windows creates a profile folder for each user account under `C:\Users`. Each user folder contains subfolders for Documents, Desktop, AppData, and other user-specific data. The timestamps on these folders can indicate when user accounts were created, last accessed, or modified.
User folder enumeration provides a complete inventory of user accounts that have logged on to the system and can reveal dormant, deleted, or unauthorized accounts.
## Data Collected
This collector gathers structured data about user folders.
### User Folders Data
| Field | Description | Example |
|-------|-------------|---------|
| `Path` | Full path to user folder | C:\Users\user |
| `FileModified` | Folder modification timestamp | 2023-10-15T14:30:00 |
| `FileAccessed` | Folder access timestamp | 2023-10-15T15:45:00 |
| `FileCreated` | Folder creation timestamp | 2023-10-01T10:00:00 |
## Collection Method
This collector:
- Searches for all folders under `Users\*`
- Filters to only include directories (not files)
- Retrieves MAC timestamps for each folder
- Records full folder paths
## Forensic Value
User folder timestamps help identify user account activity and profile creation. Investigators use this data to enumerate all user accounts on the system, identify when accounts were created, detect dormant or unused accounts, track recent user activity, identify deleted user profiles, and establish user account timelines.
---
# UserAssist
> Source: https://kb.binalyze.ai/air/features/acquisition/supported-evidence/windows-collections-detail/userassist.html
## Overview
**Evidence:** UserAssist
**Description:** Enumerate UserAssist
**Category:** System
**Platform:** windows
**Short Name:** userassist
**Is Parsed:** Yes
**Sent to Investigation Hub:** Yes
**Collect File(s):** No
## Background
UserAssist is a Windows registry artifact that tracks GUI-based program execution via Windows Explorer. When users launch programs from the desktop, Start menu, or Explorer, Windows records execution statistics in the UserAssist registry key.
The data is stored in ROT13-encoded value names and contains execution counts, last execution timestamps, and focus time. This provides user-specific evidence of program usage.
## Data Collected
This collector gathers structured data about userassist.
### UserAssist Data
| Field | Description | Example |
|-------|-------------|---------|
| `Username` | User account name | user |
| `Path` | Program path (ROT13 decoded) | C:\Program Files\Google\Chrome\Application\chrome.exe |
| `RunCount` | Number of times executed | 42 |
| `LastRunTime` | Last execution timestamp | 2023-10-15T14:30:00 |
| `FocusCount` | Number of times focused (Version 5 only) | 35 |
| `FocusTime` | Total focus time in milliseconds (Version 5 only) | 3600000 |
| `KeyPath` | Registry key path | Software\Microsoft\Windows\CurrentVersion\Explorer\UserAssist\{GUID}\Count |
| `LastWriteTime` | Registry key last write time | 2023-10-15T14:30:00 |
| `RegPath` | Path to registry hive | Registry/ntuser.dat |
## Collection Method
This collector:
- Collects user registry hives (ntuser.dat)
- Searches for UserAssist keys: `Software\Microsoft\Windows\CurrentVersion\Explorer\UserAssist\*`
- Reads version number to determine data structure (Version 3 or Version 5)
- Decodes ROT13-encoded value names
- Parses binary data structures to extract statistics
Version 3 (Windows 7): Contains execution count and last execution time
Version 5 (Windows 8+): Adds focus count and focus duration
## Forensic Value
UserAssist provides user-specific program execution evidence for GUI applications. Investigators use this data to establish program usage patterns per user, prove user interaction with specific programs, track execution frequency and recency, identify programs launched from Explorer, detect suspicious user activity, and correlate program usage with other user artifacts.
---
# Users
> Source: https://kb.binalyze.ai/air/features/acquisition/supported-evidence/windows-collections-detail/users.html
## Overview
**Evidence:** Users
**Description:** Collect Users
**Category:** System
**Platform:** windows
**Short Name:** users
**Is Parsed:** Yes
**Sent to Investigation Hub:** Yes
**Collect File(s):** No
## Background
Windows user account and profile directories provide context on local users and their home folders. This data is essential for understanding access and detecting unauthorized accounts.
## Data Collected
This collector gathers structured data about users.
## Collection Method
This collector enumerates local users and profiles, reading directory timestamps for created, accessed, and modified times.
## Forensic Value
This evidence is crucial for forensic investigations to identify accounts, profile paths, and timeline of profile activity.
---
# USN Journal as CSV
> Source: https://kb.binalyze.ai/air/features/acquisition/supported-evidence/windows-collections-detail/usn-journal-as-csv.html
## Overview
**Evidence:** USN Journal as CSV
**Description:** Parse USN Journal Entries in CSV Format
**Category:** DiskFilesystem
**Platform:** windows
**Short Name:** usncsv
**Is Parsed:** Yes
**Sent to Investigation Hub:** Yes
**Collect File(s):** No
## Background
The Update Sequence Number (USN) Journal is an NTFS feature that logs all changes made to files and directories on a volume. Every file system operation (create, delete, modify, rename) generates a USN record.
The USN Journal provides a comprehensive timeline of file system activity and can track changes that occurred before the system acquisition. It's particularly valuable for detecting file manipulation, identifying deleted files, and reconstructing attacker activity.
## Data Collected
This collector gathers structured data about usn journal as csv.
### USN Journal as CSV Data
| Field | Description | Example |
|-------|-------------|---------|
| `FileName` | File or directory name | document.docx |
| `UpdateSequenceNumber` | Unique sequence number | 123456789 |
| `UpdateDateTime` | When the change occurred | 2023-10-15T14:30:00Z |
| `UpdateReasonFlags` | Type of change | FILE_CREATE+DATA_EXTEND |
| `MftFileReference` | MFT entry number | 12345 |
| `MftFileReferenceSequence` | MFT sequence number | 1 |
| `MftParentFileReference` | Parent directory MFT entry | 5 |
| `MftParentFileReferenceSequence` | Parent sequence number | 1 |
| `FileAttributeFlags` | File attributes | READ_ONLY+ARCHIVE |
| `UpdateSourceFlags` | Source of update | DATA_MANAGEMENT |
## Collection Method
This collector:
- Reads the USN Journal from all fixed NTFS drives
- Parses each USN record using `NtfsEnumerateUSNEntries`
- Exports records to CSV format
- Converts reason flags, source flags, and attribute flags to human-readable format
This parsed collector already enumerates only records that still exist in $J. Sparse (deallocated) regions of the $UsnJrnl:$J stream contain no journal records. The raw [USN Journal](./usn-journal) collector likewise collects only allocated ranges of $J.
Update Reason Flags include: DATA_OVERWRITE, DATA_EXTEND, FILE_CREATE, FILE_DELETE, RENAME_OLD_NAME, RENAME_NEW_NAME, SECURITY_CHANGE, and many others.
## Forensic Value
The USN Journal provides unparalleled visibility into file system activity and is essential for timeline reconstruction. Investigators use this data to reconstruct complete file activity timelines, detect mass file deletions or encryption (ransomware), identify file renaming operations, track file modifications by timestamp, detect data staging for exfiltration, identify temporary file usage, and correlate file system changes with other events.
---
# USN Journal $Max
> Source: https://kb.binalyze.ai/air/features/acquisition/supported-evidence/windows-collections-detail/usn-journal-max.html
## Overview
**Evidence:** USN Journal $Max
**Description:** Dump Contents of $UsnJrnl:$Max
**Category:** DiskFilesystem
**Platform:** windows
**Short Name:** usnjrnmax
**Is Parsed:** No
**Sent to Investigation Hub:** Yes
**Collect File(s):** Yes
## Background
The $UsnJrnl:$Max stream is part of the USN Journal system and contains metadata about the journal itself, including the maximum USN value and journal configuration. While less frequently used than the $J stream, it provides important context about the journal's state and can be useful for forensic analysis.
## Data Collected
This collector gathers structured data about usn journal $max.
### USN Journal $Max Data
| Field | Description | Example |
|-------|-------------|---------|
| `Type` | File type | UsnJournalMax |
| `Name` | File name | $UsnJrnl:$Max |
| `SourcePath` | Original path | C:\$Extend\$UsnJrnl:$Max |
| `FilePath` | Path in evidence | NTFSFiles/$UsnJrnl_$Max |
| `FileSize` | File size in bytes | 256 |
## Collection Method
This collector uses kernel driver NTFS raw access to read $UsnJrnl:$Max from each fixed NTFS drive.
## Forensic Value
The $Max stream provides journal metadata that can help investigators understand the journal's configuration, capacity, and current state. This information is useful for determining if the journal has wrapped, identifying gaps in the timeline, and understanding the journal's retention policy.
---
# USN Journal
> Source: https://kb.binalyze.ai/air/features/acquisition/supported-evidence/windows-collections-detail/usn-journal.html
## Overview
**Evidence:** USN Journal
**Description:** Dump Allocated Contents of $UsnJrnl:$J
**Category:** DiskFilesystem
**Platform:** windows
**Short Name:** usnjrn
**Is Parsed:** No
**Sent to Investigation Hub:** Yes
**Collect File(s):** Yes
## Background
The Update Sequence Number (USN) Journal is a feature of NTFS that provides a persistent log of all changes made to files on the volume. Each file change is assigned a unique USN and recorded with metadata including the type of change, filename, and timestamp. The journal is stored in the $UsnJrnl:$J alternate data stream.
$J is a sparse stream by design. As the journal grows, NTFS trims the oldest records at the head and deallocates those clusters. Only the tail — the newest records that still exist — remains physically allocated. The logical size of $J grows monotonically, while the real on-disk data is only that allocated tail.
## Data Collected
This collector gathers structured data about the collected USN Journal dump.
### USN Journal Data
| Field | Description | Example |
|-------|-------------|---------|
| `Type` | File type | UsnJournal |
| `Name` | File name | $UsnJrnl:$J |
| `SourcePath` | Original path | C:\$Extend\$UsnJrnl:$J |
| `FilePath` | Path in evidence | NTFSFiles/$UsnJrnl_$J |
| `FileSize` | Allocated size of the collected dump, in bytes | 33554432 |
## Collection Method
This collector uses kernel driver NTFS raw access to read $UsnJrnl:$J from each fixed NTFS drive. It collects only the allocated (non-sparse) ranges of the stream and writes a compact allocated-only dump. Sparse holes are not read.
That is the complete journal that still exists on disk. Sparse regions are not skipped journal records: those clusters have already been returned to the volume's free space, and reading them yields zeros synthesized by the filesystem. Windows' own journal API (`FSCTL_READ_USN_JOURNAL`) also returns only records that still exist.
Collecting the full logical size would therefore add no forensic value. On some hosts it is also impossible: the logical size of $J can exceed disk capacity (for example 1.8 TB logical on a 255 GB disk). Even a typical 3.5 GB logical $J may contain only tens of megabytes of allocated data, with the rest zeros.
## Sparse Collection and Offsets
In the live $J stream, a record's USN value equals that record's byte offset. The collected dump concatenates allocated ranges back-to-back, so byte offsets in the output file are compacted and no longer match the original USN values.
This does not drop records. Every `USN_RECORD` carries its own `Usn` field, so well-written parsers remain correct. Tools that assume `offset == USN` in the collected file must use the embedded `Usn` value instead.
The SHA-256 hash verifies the collected allocated-only dump. It will not match a hash of a full logical copy that includes filesystem-synthesized zeros. Compare hashes only between artifacts produced the same way. $J is also a live stream and can change during collection.
## Forensic Value
The USN Journal provides a comprehensive timeline of file system activity including file creation, deletion, modification, and renaming. It can reveal deleted files, track file movements, and establish detailed user activity timelines. Particularly valuable for detecting data exfiltration, tracking malware activity, and reconstructing user actions over extended periods.
Records that have already been trimmed from $J are not in the file anymore. Recovering them requires different techniques, such as unallocated-space carving for USN record signatures or Volume Shadow Copies that may hold older copies of $J. Those are separate capabilities; they cannot be obtained by reading the full logical size of $J.
---
# VIPRE Logs
> Source: https://kb.binalyze.ai/air/features/acquisition/supported-evidence/windows-collections-detail/vipre-logs.html
## Overview
**Evidence:** VIPRE Logs
**Description:** Collect VIPRE Logs
**Category:** Applications
**Platform:** windows
**Short Name:** vprls
**Is Parsed:** No
**Sent to Investigation Hub:** No
**Collect File(s):** Yes
## Background
VIPRE (formerly GFI AntiMalware and Sunbelt AntiMalware) is a business security solution that maintains logs across multiple product iterations. It stores logs in both system-wide ProgramData and user-specific AppData locations.
## Data Collected
This collector gathers structured data about vipre logs.
## Collection Method
This collector gathers VIPRE logs from current and legacy installations including VIPRE Business Agent, GFI Software AntiMalware, and Sunbelt Software AntiMalware directories.
## Forensic Value
VIPRE logs provide evidence of malware detections, business endpoint security events, and threat activities across different product versions. They're valuable for investigating security incidents in business environments.
---
# Visual Studio Team Explorer Config
> Source: https://kb.binalyze.ai/air/features/acquisition/supported-evidence/windows-collections-detail/visual-studio-team-explorer-config.html
## Overview
**Evidence:** Visual Studio Team Explorer Config
**Description:** Collect Visual Studio Team Explorer Config
**Category:** Applications
**Platform:** windows
**Short Name:** vstm
**Is Parsed:** No
**Sent to Investigation Hub:** No
**Collect File(s):** Yes
## Background
Visual Studio Team Explorer stores configuration files for source control connections, Team Foundation Server (TFS), and Azure DevOps connections. These configs contain server URLs, project information, and connection settings.
## Data Collected
This collector gathers structured data about visual studio team explorer config.
## Collection Method
This collector gathers Team Explorer configuration files from Visual Studio Roaming profile directories.
## Forensic Value
Team Explorer configs reveal source control repositories accessed, TFS/Azure DevOps servers, project names, and development activities. This helps identify code repositories, development environments, and intellectual property access.
---
# Vivaldi Bookmarks
> Source: https://kb.binalyze.ai/air/features/acquisition/supported-evidence/windows-collections-detail/vivaldi-bookmarks.html
## Overview
**Evidence:** Vivaldi Bookmarks
**Description:** Collect Vivaldi Bookmarks
**Category:** Applications
**Platform:** windows
**Short Name:** vbkmrks
**Is Parsed:** Yes
**Sent to Investigation Hub:** Yes
**Collect File(s):** No
## Background
Browser bookmarks represent user-saved favorite websites and organizational folders. This data reveals frequently accessed sites, user interests, and potential indicators of reconnaissance, phishing targets, or suspicious infrastructure.
## Data Collected
This collector gathers structured data about vivaldi bookmarks.
### Vivaldi Bookmarks Data
| Field | Description | Example |
|-------|-------------|---------|
| `UserName` | User Name | Example value |
| `ProfileName` | Profile Name | Example value |
| `BrowserName` | Browser Name | Example value |
| `GUID` | GUID | Example value |
| `BookmarkID` | Bookmark ID | Example value |
| `Name` | Name | Example value |
| `Type` | Type | Example value |
| `URL` | URL | Example value |
| `ParentFolder` | Parent Folder | Example value |
| `DateAdded` | Date Added | 2023-10-15 14:30:25+03:00 |
| `DateLastUsed` | Date Last Used | 2023-10-15 14:30:25+03:00 |
| `DateModified` | Date Modified | 2023-10-15 14:30:25+03:00 |
## Collection Method
This collector parses the browser's Bookmarks file to extract saved URLs, folder structures, timestamps, and metadata.
## Forensic Value
Bookmark analysis identifies targeted websites, phishing pages, command-and-control servers, internal resources, and organizational reconnaissance patterns. Investigators can detect social engineering campaigns, credential harvesting attempts, and lateral movement preparation.
---
# Vivaldi Browsing History
> Source: https://kb.binalyze.ai/air/features/acquisition/supported-evidence/windows-collections-detail/vivaldi-browsing-history.html
## Overview
**Evidence:** Vivaldi Browsing History
**Description:** Collect Visited URLs from Vivaldi
**Category:** Applications
**Platform:** windows
**Short Name:** vhst
**Is Parsed:** Yes
**Sent to Investigation Hub:** Yes
**Collect File(s):** No
## Background
Browser history records all websites visited by users, including URLs, page titles, visit timestamps, visit counts, and transition types. This data is essential for reconstructing user activity, identifying malicious websites, and tracking lateral movement or reconnaissance activities.
## Data Collected
This collector gathers structured data about vivaldi browsing history.
### Vivaldi Browsing History Data
| Field | Description | Example |
|-------|-------------|---------|
| `AccessTime` | Access Time | 2023-10-15 14:30:25+03:00 |
| `AccessCount` | Access Count | 123 |
| `URL` | URL | Example value |
| `Browser` | Browser | Example value |
| `Title` | Title | Example value |
| `VisitDuration` | Visit Duration | Example value |
| `Referrer` | Referrer | Example value |
| `TypedCount` | Typed Count | 123 |
| `IsHidden` | Is Hidden | true |
| `TransitionType` | Transition Type | Example value |
| `VisitID` | Visit ID | 123 |
| `TransitionQualifiers` | Transition Qualifiers | Example value |
| `User` | User | Example value |
| `Profile` | Profile | Example value |
| `HistoryFilePath` | History File Path | Example value |
## Collection Method
This collector queries the browser's History database to extract visited URLs, timestamps, referrer information, and user interaction patterns.
## Forensic Value
Browsing history reveals phishing sites, malicious domains, command-and-control servers, data exfiltration targets, and reconnaissance activities. Analysts can identify compromised credentials, track attacker infrastructure, and correlate web activity with other security events to establish attack timelines.
---
# Vivaldi Cookies
> Source: https://kb.binalyze.ai/air/features/acquisition/supported-evidence/windows-collections-detail/vivaldi-cookies.html
## Overview
**Evidence:** Vivaldi Cookies
**Description:** Collect Vivaldi Cookies
**Category:** Applications
**Platform:** windows
**Short Name:** vcookies
**Is Parsed:** Yes
**Sent to Investigation Hub:** Yes
**Collect File(s):** No
## Background
Browser cookies store session tokens, authentication credentials, user preferences, and tracking data. This data is essential for understanding authenticated sessions, tracking user activity across websites, and identifying session hijacking or credential theft.
## Data Collected
This collector gathers structured data about vivaldi cookies.
### Vivaldi Cookies Data
| Field | Description | Example |
|-------|-------------|---------|
| `UserName` | User Name | Example value |
| `BrowserName` | Browser Name | Example value |
| `ProfileName` | Profile Name | Example value |
| `Domain` | Domain | Example value |
| `Name` | Name | Example value |
| `Path` | Path | Example value |
| `Value` | Value | Example value |
| `IsSecure` | Is Secure | 123 |
| `IsHTTPOnly` | Is HTTP Only | 123 |
| `HasExpires` | Has Expires | 123 |
| `IsPersistent` | Is Persistent | 123 |
| `Priority` | Priority | 123 |
| `SameSite` | Same Site | 123 |
| `SourcePort` | Source Port | 123 |
| `SourceScheme` | Source Scheme | 123 |
| `CreationTime` | Creation Time | 2023-10-15 14:30:25+03:00 |
| `ExpiresTime` | Expires Time | 2023-10-15 14:30:25+03:00 |
| `LastAccessTime` | Last Access Time | 2023-10-15 14:30:25+03:00 |
## Collection Method
This collector extracts cookies from the browser's Cookies database, including domain, name, value, path, expiration, and security flags.
## Forensic Value
Cookie analysis reveals active sessions, authentication tokens, persistent tracking identifiers, and potential session hijacking. Investigators can identify stolen credentials, unauthorized access, and cross-site tracking used for reconnaissance or targeting.
---
# Vivaldi Downloads
> Source: https://kb.binalyze.ai/air/features/acquisition/supported-evidence/windows-collections-detail/vivaldi-downloads.html
## Overview
**Evidence:** Vivaldi Downloads
**Description:** Collect Vivaldi Downloads
**Category:** Applications
**Platform:** windows
**Short Name:** vdwnlds
**Is Parsed:** Yes
**Sent to Investigation Hub:** Yes
**Collect File(s):** No
## Background
Browser download history records files downloaded by users, including file paths, timestamps, URLs, referrer information, and download status. This data is essential for tracking file acquisition, identifying potentially malicious downloads, and reconstructing user activity timelines.
## Data Collected
This collector gathers structured data about vivaldi downloads.
### Vivaldi Downloads Data
| Field | Description | Example |
|-------|-------------|---------|
| `UserName` | User Name | Example value |
| `Browser` | Browser | Example value |
| `ProfileName` | Profile Name | Example value |
| `URL` | URL | Example value |
| `TargetPath` | Target Path | Example value |
| `CurrentPath` | Current Path | Example value |
| `Referrer` | Referrer | Example value |
| `LastModified` | Last Modified | 2023-10-15 14:30:25+03:00 |
| `DangerType` | Danger Type | 123 |
| `Opened` | Opened | 123 |
| `TabURL` | Tab URL | Example value |
| `TabReferrerURL` | Tab Referrer URL | Example value |
| `StartTime` | Start Time | 2023-10-15 14:30:25+03:00 |
| `EndTime` | End Time | 2023-10-15 14:30:25+03:00 |
| `HistoryFilePath` | History File Path | Example value |
## Collection Method
This collector queries the browser's History database to extract download records, including file paths, download times, source URLs, and security flags.
## Forensic Value
Download history reveals malware delivery vectors, data exfiltration attempts, unauthorized software installation, and user interaction with suspicious websites. Analysts can identify downloaded malicious files, track attack chains, and correlate downloads with other security events.
---
# Vivaldi Extensions
> Source: https://kb.binalyze.ai/air/features/acquisition/supported-evidence/windows-collections-detail/vivaldi-extensions.html
## Overview
**Evidence:** Vivaldi Extensions
**Description:** Collect Vivaldi Extensions
**Category:** Applications
**Platform:** windows
**Short Name:** vext
**Is Parsed:** Yes
**Sent to Investigation Hub:** Yes
**Collect File(s):** No
## Data Collected
This collector gathers structured data about vivaldi extensions.
---
# Vivaldi Favicons
> Source: https://kb.binalyze.ai/air/features/acquisition/supported-evidence/windows-collections-detail/vivaldi-favicons.html
## Overview
**Evidence:** Vivaldi Favicons
**Description:** Collect Vivaldi Favicons
**Category:** Applications
**Platform:** windows
**Short Name:** vfico
**Is Parsed:** Yes
**Sent to Investigation Hub:** Yes
**Collect File(s):** No
## Background
Browser favicons are cached website icons that provide visual history of visited sites. This data supplements browsing history by revealing sites accessed even if history was deleted.
## Data Collected
This collector gathers structured data about vivaldi favicons.
### Vivaldi Favicons Data
| Field | Description | Example |
|-------|-------------|---------|
| `ID` | ID | 123 |
| `UserName` | User Name | Example value |
| `BrowserName` | Browser Name | Example value |
| `Profile` | Profile | Example value |
| `URL` | URL | Example value |
| `IconType` | Icon Type | 123 |
| `Path` | Path | Example value |
## Collection Method
This collector queries the browser's Favicons database to extract cached website icons and associated URLs.
## Forensic Value
Favicon analysis can recover evidence of deleted browsing history, identify visited sites through icon fingerprinting, and correlate with other browser artifacts to establish comprehensive activity timelines.
---
# Vivaldi Form History
> Source: https://kb.binalyze.ai/air/features/acquisition/supported-evidence/windows-collections-detail/vivaldi-form-history.html
## Overview
**Evidence:** Vivaldi Form History
**Description:** Collect Vivaldi Form History
**Category:** Applications
**Platform:** windows
**Short Name:** vfh
**Is Parsed:** Yes
**Sent to Investigation Hub:** Yes
**Collect File(s):** No
## Background
Browser form history stores previously entered form data including search queries, usernames, and other input fields. This data reveals user search patterns, account information, and potential data leakage through autofill.
## Data Collected
This collector gathers structured data about vivaldi form history.
### Vivaldi Form History Data
| Field | Description | Example |
|-------|-------------|---------|
| `UserName` | User Name | Example value |
| `BrowserName` | Browser Name | Example value |
| `Name` | Name | Example value |
| `Value` | Value | Example value |
| `ValueLower` | Value Lower | Example value |
| `Count` | Count | 123 |
| `Profile` | Profile | Example value |
| `Path` | Path | Example value |
| `DateCreated` | Date Created | 2023-10-15 14:30:25+03:00 |
| `DateLastUsed` | Date Last Used | 2023-10-15 14:30:25+03:00 |
## Collection Method
This collector queries the browser's form history database to extract saved form field data, search queries, and associated timestamps.
## Forensic Value
Form history exposes reconnaissance activities, credential enumeration attempts, search queries revealing attacker intent, and potentially sensitive information entered into web forms. Analysts can identify data exfiltration, account compromise indicators, and targeted search patterns.
---
# Vivaldi Local Storage
> Source: https://kb.binalyze.ai/air/features/acquisition/supported-evidence/windows-collections-detail/vivaldi-local-storage.html
## Overview
**Evidence:** Vivaldi Local Storage
**Description:** Collect Vivaldi Local Storage
**Category:** Applications
**Platform:** windows
**Short Name:** vls
**Is Parsed:** Yes
**Sent to Investigation Hub:** Yes
**Collect File(s):** No
## Background
Browser local storage contains persistent key-value data stored by websites. This data includes user preferences, session state, cached data, and potentially authentication tokens or sensitive information.
## Data Collected
This collector gathers structured data about vivaldi local storage.
### Vivaldi Local Storage Data
| Field | Description | Example |
|-------|-------------|---------|
| `UserName` | User Name | Example value |
| `ProfileName` | Profile Name | Example value |
| `BrowserName` | Browser Name | Example value |
| `Key` | Key | Example value |
| `Value` | Value | Example value |
| `Path` | Path | Example value |
## Collection Method
This collector extracts local storage data from browser storage databases and files.
## Forensic Value
Local storage analysis reveals stored credentials, session tokens, tracking identifiers, and application state that can indicate compromised accounts, persistent tracking, or malicious website activity. Analysts can identify credential theft, session hijacking, and data exfiltration attempts.
---
# Vivaldi Login Data
> Source: https://kb.binalyze.ai/air/features/acquisition/supported-evidence/windows-collections-detail/vivaldi-login-data.html
## Overview
**Evidence:** Vivaldi Login Data
**Description:** Collect Vivaldi Login Data
**Category:** Applications
**Platform:** windows
**Short Name:** vlgd
**Is Parsed:** Yes
**Sent to Investigation Hub:** Yes
**Collect File(s):** No
## Background
Browser login data stores saved passwords and credential information. This data is critical for identifying stored credentials, password reuse patterns, and potential credential theft targets.
## Data Collected
This collector gathers structured data about vivaldi login data.
### Vivaldi Login Data Data
| Field | Description | Example |
|-------|-------------|---------|
| `ID` | ID | 123 |
| `UserName` | User Name | Example value |
| `BrowserName` | Browser Name | Example value |
| `OriginURL` | Origin URL | Example value |
| `SignonRealm` | Signon Realm | Example value |
| `BlacklistedByUser` | Blacklisted By User | 123 |
| `Scheme` | Scheme | Example value |
| `PasswordType` | Password Type | Example value |
| `TimesUsed` | Times Used | 123 |
| `Profile` | Profile | Example value |
| `Path` | Path | Example value |
| `DateCreated` | Date Created | 2023-10-15 14:30:25+03:00 |
| `DateLastUsed` | Date Last Used | 2023-10-15 14:30:25+03:00 |
## Collection Method
This collector extracts saved credentials from the browser's Login Data database, including URLs, usernames, and encrypted passwords.
## Forensic Value
Login data analysis reveals stored credentials, password reuse across services, targeted accounts, and potential credential harvesting. Investigators can identify compromised accounts, credential theft attempts, and unauthorized access to saved credentials by malware or attackers.
---
# Vivaldi Sessions
> Source: https://kb.binalyze.ai/air/features/acquisition/supported-evidence/windows-collections-detail/vivaldi-sessions.html
## Overview
**Evidence:** Vivaldi Sessions
**Description:** Collect Vivaldi Sessions
**Category:** Applications
**Platform:** windows
**Short Name:** vvss
**Is Parsed:** Yes
**Sent to Investigation Hub:** Yes
**Collect File(s):** No
## Background
Browser sessions maintain active tab state, cookies, and authentication context. This data reveals currently active user sessions, open websites, and authenticated connections at the time of collection.
## Data Collected
This collector gathers structured data about vivaldi sessions.
### Vivaldi Sessions Data
| Field | Description | Example |
|-------|-------------|---------|
| `ID` | ID | 123 |
| `WindowID` | Window ID | 123 |
| `Active` | Active | true |
| `Url` | Url | Example value |
| `Title` | Title | Example value |
| `Deleted` | Deleted | true |
| `Group` | Group | Example value |
| `History` | History | [] |
| `BrowserName` | Browser Name | Example value |
## Collection Method
This collector captures browser session data including active tabs, session cookies, and authentication state.
## Forensic Value
Session analysis identifies active compromises, authenticated sessions to malicious sites, concurrent suspicious activities, and real-time indicators of ongoing attacks. Analysts can detect active C2 connections, authenticated malware communications, and live attacker sessions.
---
# Vivaldi Thumbnails
> Source: https://kb.binalyze.ai/air/features/acquisition/supported-evidence/windows-collections-detail/vivaldi-thumbnails.html
## Overview
**Evidence:** Vivaldi Thumbnails
**Description:** Collect Vivaldi Thumbnails
**Category:** Applications
**Platform:** windows
**Short Name:** vthmb
**Is Parsed:** Yes
**Sent to Investigation Hub:** Yes
**Collect File(s):** No
## Background
Browser thumbnails are cached preview images of visited websites. This visual data supplements browsing history by providing screenshots of accessed pages, useful for recovering deleted history and identifying visited content.
## Data Collected
This collector gathers structured data about vivaldi thumbnails.
### Vivaldi Thumbnails Data
| Field | Description | Example |
|-------|-------------|---------|
| `UserName` | User Name | Example value |
| `Browser` | Browser | Example value |
| `URL` | URL | Example value |
| `URLRank` | URL Rank | 123 |
| `Title` | Title | Example value |
| `Profile` | Profile | Example value |
| `Path` | Path | Example value |
## Collection Method
This collector extracts cached thumbnail images from browser storage.
## Forensic Value
Thumbnail analysis provides visual evidence of visited websites, can recover evidence after history deletion, and helps identify phishing pages, malicious sites, or sensitive internal resources accessed by users through visual inspection.
---
# Vivaldi User Profiles
> Source: https://kb.binalyze.ai/air/features/acquisition/supported-evidence/windows-collections-detail/vivaldi-user-profiles.html
## Overview
**Evidence:** Vivaldi User Profiles
**Description:** Collect Vivaldi User Profiles
**Category:** Applications
**Platform:** windows
**Short Name:** vprfls
**Is Parsed:** Yes
**Sent to Investigation Hub:** Yes
**Collect File(s):** No
## Background
Browser user profiles store per-user browser configurations, extensions, settings, and data segregation. This data reveals multiple user accounts, profile switching patterns, and user-specific browsing behavior.
## Data Collected
This collector gathers structured data about vivaldi user profiles.
### Vivaldi User Profiles Data
| Field | Description | Example |
|-------|-------------|---------|
| `EndpointUserName` | Endpoint User Name | Example value |
| `Profile` | Profile | Example value |
| `ProfileUserName` | Profile User Name | Example value |
| `BrowserName` | Browser Name | Example value |
| `BackgroundApps` | Background Apps | true |
| `GoogleAccountGivenName` | Google Account Given Name | Example value |
| `GoogleAccountID` | Google Account ID | Example value |
| `GoogleAccountName` | Google Account Name | Example value |
| `PictureFileName` | Picture File Name | Example value |
| `LastDownloadedPictureURL` | Last Downloaded Picture URL | Example value |
| `HostedDomain` | Hosted Domain | Example value |
| `IsConsentedPrimaryAccount` | Is Consented Primary Account | true |
| `IsEphemeral` | Is Ephemeral | true |
## Collection Method
This collector enumerates browser user profiles and extracts profile metadata, configurations, and associated data paths.
## Forensic Value
Profile analysis identifies multiple user accounts, profile-specific extensions and configurations, shared device usage patterns, and potential privilege escalation or lateral movement using different browser profiles. Investigators can correlate activity across profiles and identify unauthorized profile creation.
---
# Vivaldi Web Storage
> Source: https://kb.binalyze.ai/air/features/acquisition/supported-evidence/windows-collections-detail/vivaldi-web-storage.html
## Overview
**Evidence:** Vivaldi Web Storage
**Description:** Collect Vivaldi Web Storage
**Category:** Applications
**Platform:** windows
**Short Name:** vws
**Is Parsed:** Yes
**Sent to Investigation Hub:** Yes
**Collect File(s):** No
## Background
Browser web storage includes both local and session storage used by websites to store client-side data. This data can contain application state, user preferences, cached content, and potentially sensitive information.
## Data Collected
This collector gathers structured data about vivaldi web storage.
### Vivaldi Web Storage Data
| Field | Description | Example |
|-------|-------------|---------|
| `UserName` | User Name | Example value |
| `ProfileName` | Profile Name | Example value |
| `BrowserName` | Browser Name | Example value |
| `Key` | Key | Example value |
| `Value` | Value | Example value |
| `Path` | Path | Example value |
## Collection Method
This collector extracts web storage data from browser storage locations including local storage and session storage.
## Forensic Value
Web storage analysis reveals cached application data, stored credentials, session information, and potential data exfiltration staging. Analysts can identify malicious website activity, stored authentication tokens, tracking identifiers, and sensitive data cached by compromised web applications.
---
# VMware Config
> Source: https://kb.binalyze.ai/air/features/acquisition/supported-evidence/windows-collections-detail/vmware-config.html
## Overview
**Evidence:** VMware Config
**Description:** Collect VMware Config
**Category:** Applications
**Platform:** windows
**Short Name:** vmc
**Is Parsed:** No
**Sent to Investigation Hub:** No
**Collect File(s):** Yes
## Background
VMware Workstation stores configuration files including recent virtual machine lists (VMLS files) and settings (INI files). These files track which VMs were accessed and user preferences.
## Data Collected
This collector gathers structured data about vmware config.
## Collection Method
This collector gathers VMware VMLS and INI configuration files from the Roaming profile containing VM access history and settings.
## Forensic Value
VMware config files reveal which virtual machines were run, their locations, and usage patterns. This helps identify VMs used for testing malware, accessing isolated environments, or hiding activities.
---
# VMware Drag and Drop Files
> Source: https://kb.binalyze.ai/air/features/acquisition/supported-evidence/windows-collections-detail/vmware-drag-and-drop-files.html
## Overview
**Evidence:** VMware Drag and Drop Files
**Description:** Collect VMware Drag and Drop Files
**Category:** Applications
**Platform:** windows
**Short Name:** vmdd
**Is Parsed:** No
**Sent to Investigation Hub:** No
**Collect File(s):** Yes
## Background
VMware temporarily caches files dragged and dropped between the host and guest virtual machines in the VMwareDnD directory. These files remain cached during the VM session.
## Data Collected
This collector gathers structured data about vmware drag and drop files.
## Collection Method
This collector gathers VMware drag-and-drop cache directories from temporary directories containing files transferred between host and VM.
## Forensic Value
VMware drag-and-drop files reveal data transfers between host and virtual machines, which can identify malware analysis activities, data staging, or file exfiltration through VMs.
---
# VMware Logs
> Source: https://kb.binalyze.ai/air/features/acquisition/supported-evidence/windows-collections-detail/vmware-logs.html
## Overview
**Evidence:** VMware Logs
**Description:** Collect VMware Logs
**Category:** Applications
**Platform:** windows
**Short Name:** vml
**Is Parsed:** No
**Sent to Investigation Hub:** No
**Collect File(s):** Yes
## Background
VMware maintains log files tracking VM operations, errors, and activities during virtual machine execution. These logs record VM lifecycle events and operational details.
## Data Collected
This collector gathers structured data about vmware logs.
## Collection Method
This collector gathers VMware log files from temporary directories containing VM operational logs and diagnostic information.
## Forensic Value
VMware logs reveal VM usage times, operations performed, errors encountered, and can help establish timelines for VM-based activities including malware analysis or environment evasion.
---
# Volumes Information
> Source: https://kb.binalyze.ai/air/features/acquisition/supported-evidence/windows-collections-detail/volumes-information.html
## Overview
**Evidence:** Volumes Information
**Description:** Collect information about volumes
**Category:** DiskFilesystem
**Platform:** windows
**Short Name:** voli
**Is Parsed:** Yes
**Sent to Investigation Hub:** Yes
**Collect File(s):** No
## Background
Windows organizes storage into logical volumes (drive letters). Each volume has properties including file system type, capacity, free space, volume label, and serial number.
Volume serial numbers are particularly important for forensic analysis as they appear in various artifacts (prefetch, LNK files, shellbags) and can be used to correlate evidence from removable drives.
## Data Collected
This collector gathers structured data about volumes information.
### Volumes Information Data
| Field | Description | Example |
|-------|-------------|---------|
| `Letter` | Drive letter | C |
| `Type` | Volume type | Fixed |
| `Label` | Volume label | System |
| `FileSystem` | File system type | NTFS |
| `FSFlags` | File system flags | 0x700FF |
| `TotalSize` | Total volume size in bytes | 500000000000 |
| `FreeSpace` | Available free space in bytes | 250000000000 |
| `Serial` | Volume serial number | 0x12345678 |
## Collection Method
This collector:
- Enumerates all logical drives using `GetLogicalDrives`
- For each drive letter (A-Z):
- Gets drive type via `GetDriveType`
- Retrieves volume information if mounted
- Records volume properties even if not mounted
Volume types: Fixed, Removable, Remote, CDRom, RamDisk, NotMounted, Unknown.
## Forensic Value
Volume information is essential for understanding storage configuration and correlating artifacts. Investigators use this data to identify all storage devices, track volume serial numbers for correlation, detect encrypted or unmounted volumes, understand disk capacity and usage, correlate with USB device history, and identify network or removable drives.
---
# WBEM
> Source: https://kb.binalyze.ai/air/features/acquisition/supported-evidence/windows-collections-detail/wbem.html
## Overview
**Evidence:** WBEM
**Description:** Collect WBEM Files
**Category:** System
**Platform:** windows
**Short Name:** wbem
**Is Parsed:** No
**Sent to Investigation Hub:** Yes
**Collect File(s):** Yes
## Background
Windows Management Instrumentation (WMI) uses the WBEM (Web-Based Enterprise Management) repository to store WMI class definitions, instances, and configuration. The repository and associated logs can contain evidence of WMI usage, persistence, and system management activities.
The WBEM repository has been abused by attackers for persistence and reconnaissance, making these files valuable for forensic analysis.
## Data Collected
This collector gathers structured data about wbem.
### WBEM Data
| Field | Description | Example |
|-------|-------------|---------|
| `Name` | Artifact name | WBEM |
| `Type` | Folder | Folder |
| `SourcePath` | Original folder path | C:\Windows\System32\wbem\Repository |
| `Path` | Relative path in evidence | Other/Repository |
## Collection Method
This collector collects WBEM-related directories:
- `Windows\System32\wbem\Repository` - WMI repository
- `Windows\System32\wbem\Logs` - WMI log files
- `Windows\System32\wbem\AutoRecover` - Auto-recovery MOFs
## Forensic Value
WBEM files can reveal WMI persistence mechanisms and system management activity. Investigators use this data to detect WMI-based persistence, analyze WMI repository modifications, track system management activities, and investigate WMI abuse by attackers.
---
# Webroot Logs
> Source: https://kb.binalyze.ai/air/features/acquisition/supported-evidence/windows-collections-detail/webroot-logs.html
## Overview
**Evidence:** Webroot Logs
**Description:** Collect Webroot Logs
**Category:** Applications
**Platform:** windows
**Short Name:** wbrtls
**Is Parsed:** No
**Sent to Investigation Hub:** No
**Collect File(s):** Yes
## Background
Webroot SecureAnywhere is a cloud-based antivirus solution that maintains a local log file (WRLog.log) and database files containing threat intelligence, scan results, and cloud-based analysis data.
## Data Collected
This collector gathers structured data about webroot logs.
## Collection Method
This collector gathers Webroot's main log file and associated database files from the WRData directory in ProgramData, which contain local security event data.
## Forensic Value
Webroot logs provide insights into cloud-based threat detections, behavioral analysis, and security events. The database files contain threat classification and system monitoring data valuable for investigations.
---
# WhatsApp Desktop Cache
> Source: https://kb.binalyze.ai/air/features/acquisition/supported-evidence/windows-collections-detail/whatsapp-desktop-cache.html
## Overview
**Evidence:** WhatsApp Desktop Cache
**Description:** Collect WhatsApp Desktop Cache
**Category:** Applications
**Platform:** windows
**Short Name:** whtc
**Is Parsed:** No
**Sent to Investigation Hub:** No
**Collect File(s):** Yes
## Background
WhatsApp Desktop stores cached images, media, and web content in cache directories. These files include profile pictures, shared images, videos, and other media exchanged in conversations.
## Data Collected
This collector gathers structured data about whatsapp desktop cache.
## Collection Method
This collector gathers WhatsApp cache directories from app packages and Roaming directories, collecting cached media and web content.
## Forensic Value
WhatsApp cache contains visual evidence from conversations including shared images, profile pictures, and media files. This helps recover deleted content, identify participants, and understand the context of communications in investigations.
---
# WhatsApp Desktop Cookie
> Source: https://kb.binalyze.ai/air/features/acquisition/supported-evidence/windows-collections-detail/whatsapp-desktop-cookie.html
## Overview
**Evidence:** WhatsApp Desktop Cookie
**Description:** Collect WhatsApp Desktop Cookie
**Category:** Applications
**Platform:** windows
**Short Name:** whtck
**Is Parsed:** No
**Sent to Investigation Hub:** No
**Collect File(s):** Yes
## Background
WhatsApp Desktop stores session cookies and authentication data in cookie files. These files maintain the connection between the desktop app and the mobile device.
## Data Collected
This collector gathers structured data about whatsapp desktop cookie.
## Collection Method
This collector gathers WhatsApp cookie files from app package and Roaming directories containing session and authentication data.
## Forensic Value
WhatsApp cookies can reveal active sessions, authentication details, and help establish when the application was actively used. This supports timeline analysis and user activity reconstruction.
---
# Windows Defender Logs
> Source: https://kb.binalyze.ai/air/features/acquisition/supported-evidence/windows-collections-detail/windows-defender-logs.html
## Overview
**Evidence:** Windows Defender Logs
**Description:** Collect Windows Defender Logs
**Category:** Applications
**Platform:** windows
**Short Name:** wnddfndrls
**Is Parsed:** No
**Sent to Investigation Hub:** No
**Collect File(s):** Yes
## Background
Windows Defender (now Microsoft Defender) is the built-in antivirus solution in Windows. It maintains support logs, EVTX event logs, and MpCmdRun command-line scan logs across current and legacy Windows installations.
## Data Collected
This collector gathers structured data about windows defender logs.
## Collection Method
This collector gathers Windows Defender support logs, event logs from both current and Windows.old installations, and MpCmdRun logs from Microsoft AntiMalware and Windows Defender directories.
## Forensic Value
Windows Defender logs are critical for investigating malware detections on Windows systems, providing scan results, real-time protection events, threat intelligence, and command-line scan activities. They're often the primary source of antivirus data on modern Windows endpoints.
---
# Windows Error Reporting Files
> Source: https://kb.binalyze.ai/air/features/acquisition/supported-evidence/windows-collections-detail/windows-error-reporting-files.html
## Overview
**Evidence:** Windows Error Reporting Files
**Description:** Collect WER Files
**Category:** System
**Platform:** windows
**Short Name:** wrrfls
**Is Parsed:** No
**Sent to Investigation Hub:** No
**Collect File(s):** Yes
## Background
Windows Error Reporting (WER) files contain crash reports and error diagnostics from applications and system components. These files are stored when an application crashes or encounters an error, providing detailed information about the failure.
## Data Collected
This collector gathers structured data about windows error reporting files.
## Collection Method
This collector gathers WER files from the ReportArchive directory, which contains archived error reports with crash dumps and diagnostic information.
## Forensic Value
WER files are valuable for identifying application crashes, system instability, and potential exploitation attempts. They can reveal malicious software behavior, vulnerable application versions, and system compromise indicators.
---
# Windows Index Search
> Source: https://kb.binalyze.ai/air/features/acquisition/supported-evidence/windows-collections-detail/windows-index-search.html
## Overview
**Evidence:** Windows Index Search
**Description:** Collect Windows Index Search Database
**Category:** System
**Platform:** windows
**Short Name:** indxs
**Is Parsed:** No
**Sent to Investigation Hub:** Yes
**Collect File(s):** Yes
## Background
Windows Search maintains an index database (Windows.edb) that catalogs file content, properties, and metadata to enable fast searching. The index contains information about files, emails (if Outlook is installed), and other indexed content.
The search index can contain remnants of deleted files, email content, and document metadata that may not be available elsewhere.
## Data Collected
This collector gathers structured data about windows index search.
### Windows Index Search Data
| Field | Description | Example |
|-------|-------------|---------|
| `Name` | Artifact name | Windows Index Search |
| `Type` | File | File |
| `SourcePath` | Original file path | C:\ProgramData\Microsoft\Search\Data\Applications\Windows\Windows.edb |
| `Path` | Relative path in evidence | Other/Windows.edb |
## Collection Method
This collector collects the Windows Search database from:
- `ProgramData\Microsoft\Search\Data\Applications\Windows\Windows.edb`
- `Documents and Settings\Application Data\All Users\Microsoft\Search\Data\Applications\Windows\Windows.edb` (legacy path)
## Forensic Value
The Windows Search index can reveal file content and metadata including indexed emails and documents. Investigators use this data to recover deleted file metadata, search indexed email content, find document keywords and properties, track user search activity, and identify files that were indexed before deletion.
---
# Windows Live Mail User Settings
> Source: https://kb.binalyze.ai/air/features/acquisition/supported-evidence/windows-collections-detail/windows-live-mail-user-settings.html
## Overview
**Evidence:** Windows Live Mail User Settings
**Description:** Collect Windows Live Mail User Settings
**Category:** Applications
**Platform:** windows
**Short Name:** wndml
**Is Parsed:** No
**Sent to Investigation Hub:** No
**Collect File(s):** Yes
## Background
Windows Live Mail stores email account configuration and settings in .oeaccount files. These files contain account details, server settings, and user preferences for configured email accounts.
## Data Collected
This collector gathers structured data about windows live mail user settings.
## Collection Method
This collector gathers .oeaccount files from Windows Live Mail directories containing email account configuration data.
## Forensic Value
Windows Live Mail account settings reveal configured email accounts, server addresses, usernames, and account types. This helps identify email accounts used by the user and establish email communication channels.
---
# Window Screenshots
> Source: https://kb.binalyze.ai/air/features/acquisition/supported-evidence/windows-collections-detail/window-screenshots.html
## Overview
**Evidence:** Window Screenshots
**Description:** Capture Screenshot of Application Windows
**Category:**
**Platform:** windows
**Short Name:** scr
**Is Parsed:** No
**Sent to Investigation Hub:** Yes
**Collect File(s):** Yes
## Background
Screenshots capture the visual state of the desktop at the time of acquisition. This can provide valuable context about what the user was doing, what applications were running, and what content was visible on screen.
Windows maintains multiple desktop windows simultaneously, and each window can be captured individually. This collector enumerates all visible windows and captures their content as PNG images.
## Data Collected
This collector gathers structured data about window screenshots.
### Window Screenshots Data
| Field | Description | Example |
|-------|-------------|---------|
| `FilePath` | Path to screenshot image | Screenshots/p1234-t5678-w90.png |
| `ProcessID` | Process ID owning the window | 1234 |
| `ThreadID` | Thread ID that created the window | 5678 |
| `Handle` | Window handle | 0x12345678 |
## Collection Method
This collector:
- Opens the input desktop
- Enumerates all desktop windows
- Filters out invisible or transparent windows
- Captures each visible window as a PNG image
- Names files with pattern: `p{PID}-t{TID}-w{HWND}.png`
## Forensic Value
Screenshots provide immediate visual context for investigations, revealing user activity, open applications, visible documents, browser tabs, chat conversations, and potential evidence of data exfiltration or unauthorized access. This evidence is particularly valuable for insider threat investigations, data breach response, and documenting user actions at the time of acquisition.
---
# Windows Notification History
> Source: https://kb.binalyze.ai/air/features/acquisition/supported-evidence/windows-collections-detail/windows-notification-history.html
## Overview
**Evidence:** Windows Notification History
**Description:** Collect Windows Notification History
**Category:** Applications
**Platform:** windows
**Short Name:** ntfh
**Is Parsed:** No
**Sent to Investigation Hub:** No
**Collect File(s):** Yes
## Background
Windows Action Center stores notification history from applications and system components. These databases contain messages, alerts, and notifications displayed to the user, including timestamps and content.
## Data Collected
This collector gathers structured data about windows notification history.
## Collection Method
This collector gathers Appdb.dat and wpndatabase.db files from the Windows Notifications directory containing notification history and push notification data.
## Forensic Value
Notification history reveals application activity, received messages, alerts, and system events. This can identify application usage, communication patterns, security warnings, and user interactions with various services.
---
# Windows Timeline
> Source: https://kb.binalyze.ai/air/features/acquisition/supported-evidence/windows-collections-detail/windows-timeline.html
## Overview
**Evidence:** Windows Timeline
**Description:** Collect Windows Timeline
**Category:** System
**Platform:** windows
**Short Name:** tmln
**Is Parsed:** Yes
**Sent to Investigation Hub:** Yes
**Collect File(s):** Yes
## Background
Windows Timeline (ActivitiesCache.db) tracks user activities like app usage and file access. This data is essential for reconstructing user behavior and sequences of actions.
## Data Collected
This collector gathers structured data about windows timeline.
## Collection Method
This collector copies ActivitiesCache.db from user profiles, queries the Activity table, and records normalized fields into `timeline`.
## Forensic Value
This evidence is crucial for forensic investigations as it provides rich user activity telemetry for timeline analysis.
---
# WinRAR History
> Source: https://kb.binalyze.ai/air/features/acquisition/supported-evidence/windows-collections-detail/winrar-history.html
## Overview
**Evidence:** WinRAR History
**Description:** Enumerate WinRAR History
**Category:** Applications
**Platform:** windows
**Short Name:** wnrrhst
**Is Parsed:** Yes
**Sent to Investigation Hub:** Yes
**Collect File(s):** No
## Background
WinRAR registry values track archived, extracted, opened archives and last folders. This data is essential for understanding archive usage and potential data exfiltration.
## Data Collected
This collector gathers structured data about winrar history.
## Collection Method
This collector enumerates WinRAR-related registry keys under HKLM/HKU per SID, across views, recording values and key last write times into WinRAR sections.
## Forensic Value
This evidence is crucial for forensic investigations as it reveals user interactions with archives, including paths and timelines.
---
# Wireless Connection History
> Source: https://kb.binalyze.ai/air/features/acquisition/supported-evidence/windows-collections-detail/wireless-connection-history.html
## Overview
**Evidence:** Wireless Connection History
**Description:** Enumerate Wireless Connection History
**Category:** Network
**Platform:** windows
**Short Name:** wrlsshst
**Is Parsed:** Yes
**Sent to Investigation Hub:** Yes
**Collect File(s):** No
## Background
Windows network profiles store SSIDs and connection metadata (first/last connected, category, managed). This data is essential for tracking network access.
## Data Collected
This collector gathers structured data about wireless connection history.
## Collection Method
This collector reads HKLM\...\NetworkList\Profiles for each profile, extracting timestamps and attributes into `wireless_history`.
## Forensic Value
This evidence is crucial for forensic investigations to link hosts to networks over time and identify suspicious connections.
---
# WordWheelQuery
> Source: https://kb.binalyze.ai/air/features/acquisition/supported-evidence/windows-collections-detail/wordwheelquery.html
## Overview
**Evidence:** WordWheelQuery
**Description:** Enumerate WordWheelQuery
**Category:** System
**Platform:** windows
**Short Name:** wordwheel
**Is Parsed:** Yes
**Sent to Investigation Hub:** Yes
**Collect File(s):** No
## Background
WordWheelQuery records search terms that users type into the Windows Explorer search box. This registry artifact maintains a history of search queries, providing evidence of what files, folders, or content users were looking for on the system.
Search terms can reveal user intent, knowledge of specific files, or attempts to locate sensitive data.
## Data Collected
This collector gathers structured data about wordwheelquery.
### WordWheelQuery Data
| Field | Description | Example |
|-------|-------------|---------|
| `KeyPath` | Registry key path | Software\Microsoft\Windows\CurrentVersion\Explorer\WordWheelQuery |
| `LastWriteTime` | Registry key last write time | 2023-10-15T14:30:00 |
| `Value` | MRU value name | 0 |
| `Username` | User account name | user |
| `Term` | Search term | confidential passwords |
| `MRUPosition` | Position in MRU list | 0 |
| `RegPath` | Path to registry hive | Registry/ntuser.dat |
## Collection Method
This collector:
- Collects user registry hives (ntuser.dat)
- Searches for: `Software\Microsoft\Windows\CurrentVersion\Explorer\WordWheelQuery`
- Parses MRUListEx binary structure
- Extracts search term strings
- Orders by MRU position (most recent first)
## Forensic Value
Search terms reveal what users were looking for and can indicate intent or knowledge. Investigators use this data to identify searches for sensitive files, detect user attempts to locate evidence, prove knowledge of hidden files or folders, track user interest in specific topics, identify anti-forensic awareness (searches for "delete history"), and correlate search terms with file access.
---
# WSL
> Source: https://kb.binalyze.ai/air/features/acquisition/supported-evidence/windows-collections-detail/wsl.html
## Overview
**Evidence:** WSL
**Description:** Collect Windows Subsystem for Linux Files
**Category:** Applications
**Platform:** windows
**Short Name:** wsl
**Is Parsed:** No
**Sent to Investigation Hub:** No
**Collect File(s):** Yes
## Background
Windows Subsystem for Linux (WSL) stores Linux user files including bash history, bash configuration, and logout scripts in the WSL distribution's file system. These files track Linux command history and shell configurations.
## Data Collected
This collector gathers structured data about wsl.
## Collection Method
This collector gathers bash history, bashrc configuration, and bash logout files from WSL distribution packages in LocalState directories.
## Forensic Value
WSL files reveal Linux commands executed, scripts run, development activities, and potentially malicious commands issued through the Linux subsystem. Bash history is critical for identifying attacker activities, privilege escalation attempts, and data exfiltration through WSL.
---
# Xeox Logs
> Source: https://kb.binalyze.ai/air/features/acquisition/supported-evidence/windows-collections-detail/xeox-logs.html
## Overview
**Evidence:** Xeox Logs
**Description:** Collect Xeox Application Specific Log Files
**Category:** Applications
**Platform:** windows
**Short Name:** xeoxlgs
**Is Parsed:** No
**Sent to Investigation Hub:** No
**Collect File(s):** Yes
## Background
Xeox is a remote desktop and support software that maintains activity logs. These logs track remote connections, user sessions, and system access events.
## Data Collected
This collector gathers structured data about xeox logs.
## Collection Method
This collector gathers log files from the XEOX installation directory containing connection and activity records.
## Forensic Value
Xeox logs help identify remote access sessions, determine who accessed the system remotely, and establish timelines for remote support activities. This is critical for investigating unauthorized access and insider threats.
---
# ZohoAssist Logs
> Source: https://kb.binalyze.ai/air/features/acquisition/supported-evidence/windows-collections-detail/zohoassist-logs.html
## Overview
**Evidence:** ZohoAssist Logs
**Description:** Collect ZohoAssist Application Specific Logs
**Category:** Applications
**Platform:** windows
**Short Name:** zohoasstlg
**Is Parsed:** No
**Sent to Investigation Hub:** No
**Collect File(s):** Yes
## Background
ZohoAssist is a remote support software that logs remote desktop sessions, screen sharing activities, and connection events. These logs track technical support sessions and remote access.
## Data Collected
This collector gathers structured data about zohoassist logs.
## Collection Method
This collector gathers log files from ZohoMeeting directories in both system-wide ProgramData and user-specific AppData locations.
## Forensic Value
ZohoAssist logs reveal remote support sessions, connection times, technician access, and remote control events. This is vital for investigating unauthorized remote access, data theft during support sessions, and insider threats.
---
# Zoom Databases
> Source: https://kb.binalyze.ai/air/features/acquisition/supported-evidence/windows-collections-detail/zoom-databases.html
## Overview
**Evidence:** Zoom Databases
**Description:** Collect Zoom Databases
**Category:** Applications
**Platform:** windows
**Short Name:** zmdb
**Is Parsed:** No
**Sent to Investigation Hub:** No
**Collect File(s):** Yes
## Background
Zoom video conferencing application stores chat messages, meeting history, contacts, and configuration data in SQLite databases. These databases track meetings attended, participants, chat conversations, and shared files.
## Data Collected
This collector gathers structured data about zoom databases.
## Collection Method
This collector gathers SQLite database files from the Zoom user data directory, collecting chat, contacts, and meeting history databases.
## Forensic Value
Zoom databases reveal meeting participation, chat communications, file transfers, and contact lists. This is valuable for investigating unauthorized meetings, data leaks, insider threats, and establishing communication timelines in corporate investigations.
---
# Zoom Media
> Source: https://kb.binalyze.ai/air/features/acquisition/supported-evidence/windows-collections-detail/zoom-media.html
## Overview
**Evidence:** Zoom Media
**Description:** Collect Zoom Media Files & Link Previews
**Category:** Applications
**Platform:** windows
**Short Name:** zmm
**Is Parsed:** No
**Sent to Investigation Hub:** No
**Collect File(s):** Yes
## Background
Zoom stores cached images, link previews, and media files shared during meetings and chats. These files include profile pictures, shared images, and previews of linked content.
## Data Collected
This collector gathers structured data about zoom media.
## Collection Method
This collector gathers media files and link preview images from the Zoom data directory, collecting cached visual content from meetings and chats.
## Forensic Value
Zoom media files can reveal shared content, profile pictures, and visual evidence from meetings. This helps identify participants, recover shared images, and understand the context of communications.
---
# macOS Collections
> Source: https://kb.binalyze.ai/air/features/acquisition/supported-evidence/macos-collections.html
## **macOS Evidence List**
---
# AI Agent Events
> Source: https://kb.binalyze.ai/air/features/acquisition/supported-evidence/macos-collections-detail/ai-agent-events.html
## Overview
**Evidence:** AI Agent Events
**Description:** Parse AI agent transcripts to extract a hash-chained event timeline
**Category:** AI
**Platform:** macos
**Short Name:** aievt
**Is Parsed:** Yes
**Sent to Investigation Hub:** Yes
**Collect File(s):** No
## Background
AI coding assistants and agent frameworks persist prompts, tool calls, approvals, and execution results in JSONL or JSON transcripts. Those records show what an agent was asked to do, which tools it invoked, and whether a user approved the action.
## Data Collected
This collector gathers structured data about AI agent events, including prompts, assistant messages, tool calls, MCP server names, approval states, exit codes, and source hashes.
## Collection Method
Transcripts from AI tools are parsed with explicit size limits. Each event is hash-chained using the previous hash and source offset so analysts can detect gaps or tampering. Prompt text is stored as a bounded redacted excerpt with SHA-256.
## Forensic Value
Reconstructs what an AI agent did on the host: which commands it ran, which files it referenced, which MCP tools it called, and whether the user approved or denied those actions. Risk flags highlight prompt injection, dangerous commands, credential access, and transcript integrity gaps.
---
# AI Agents
> Source: https://kb.binalyze.ai/air/features/acquisition/supported-evidence/macos-collections-detail/ai-agents.html
## Overview
**Evidence:** AI Agents
**Description:** Parse custom AI agent definitions and autonomy settings
**Category:** AI
**Platform:** macos
**Short Name:** aiagent
**Is Parsed:** Yes
**Sent to Investigation Hub:** Yes
**Collect File(s):** No
## Background
Claude Code, Cursor, and similar tools store custom agent definitions that control tools, permission modes, MCP servers, and standing instructions. A poisoned agent definition can grant broad tool access or persist hidden automation.
## Data Collected
This collector gathers structured data about custom AI agent definitions, including agent path, tools, permission mode, MCP servers, and bounded instruction excerpts.
## Collection Method
This collector parses YAML frontmatter and bounded markdown bodies from project and global agent directories, preserving raw sources in Content.
## Forensic Value
Identifies custom agents with broad tool access, permission bypass, embedded hooks, or malicious instructions that can steer AI tool execution without an interactive prompt.
---
# AI Artifacts
> Source: https://kb.binalyze.ai/air/features/acquisition/supported-evidence/macos-collections-detail/ai-artifacts.html
## Overview
**Evidence:** AI Artifacts
**Description:** Inventory AI tool files (configs, transcripts, databases, MCP definitions)
**Category:** AI
**Platform:** macos
**Short Name:** aiart
**Is Parsed:** No
**Sent to Investigation Hub:** Yes
**Collect File(s):** Yes
## Background
AI coding tools leave configs, transcripts, state databases, and MCP definitions under user homes and project directories such as .cursor/, .claude/, and .codex/. An inventory of those files establishes which tools were present and where their evidence lives.
## Data Collected
This collector gathers structured inventory data about AI tool artifacts, including path, SHA-256, size, modification time, tool name, and artifact type, and collects the matching files.
## Collection Method
This collector walks user homes and development directories to discover AI tool artifacts in known and project-local locations, recording file metadata without deep-parsing content.
## Forensic Value
Provides a filesystem inventory of AI tool presence on the host. Paths, hashes, and timestamps support timeline correlation with other collectors and tamper detection across acquisitions.
---
# AI Commands
> Source: https://kb.binalyze.ai/air/features/acquisition/supported-evidence/macos-collections-detail/ai-commands.html
## Overview
**Evidence:** AI Commands
**Description:** Parse custom AI slash-command definitions
**Category:** AI
**Platform:** macos
**Short Name:** aicmd
**Is Parsed:** Yes
**Sent to Investigation Hub:** Yes
**Collect File(s):** No
## Background
Claude Code and Cursor allow project and user custom slash-command markdown files. Those commands can embed shell instructions, automation, or prompt text that runs whenever an operator invokes them.
## Data Collected
This collector gathers structured data about custom AI slash-command definitions, including command path, name, and bounded redacted excerpts.
## Collection Method
This collector parses command frontmatter and bounded excerpts from project and user command directories while preserving raw files in Content.
## Forensic Value
Identifies custom commands that embed dangerous shell instructions, prompt injection, or hidden automation that can execute during AI-assisted work.
---
# AI Configs
> Source: https://kb.binalyze.ai/air/features/acquisition/supported-evidence/macos-collections-detail/ai-configs.html
## Overview
**Evidence:** AI Configs
**Description:** Parse AI tool configuration files for provider, model, and permission metadata
**Category:** AI
**Platform:** macos
**Short Name:** aicfg
**Is Parsed:** Yes
**Sent to Investigation Hub:** Yes
**Collect File(s):** No
## Background
AI tools store provider, model, permission, and trust settings in files such as claude.json, settings.json, and cli-config.json. Those settings determine which models are used and whether the agent can act without approval.
## Data Collected
This collector gathers structured data about AI tool configurations, including provider, model, permission mode, trust overrides, and secret-like value indicators.
## Collection Method
This collector scans per-user and project-scope config files and parses JSON content to extract provider, model, and permission metadata and to flag risky configurations.
## Forensic Value
Reveals which AI providers and models are configured, whether auto-approve or manual permission modes are in use, and whether configs contain secret-like values. Risk flags highlight permission bypasses and broad tool allowlists.
---
# AI Hooks
> Source: https://kb.binalyze.ai/air/features/acquisition/supported-evidence/macos-collections-detail/ai-hooks.html
## Overview
**Evidence:** AI Hooks
**Description:** Parse AI hook definitions that auto-execute commands on agent events
**Category:** AI
**Platform:** macos
**Short Name:** aihook
**Is Parsed:** Yes
**Sent to Investigation Hub:** Yes
**Collect File(s):** No
## Background
Cursor hooks.json and Claude settings can bind shell commands to AI tool events such as session start, prompt submit, or file edit. Hooks run automatically and are a high-risk persistence and remote-code-execution surface.
## Data Collected
This collector gathers structured data about AI hook definitions, including event, matcher, command, referenced script hashes, and source config paths.
## Collection Method
This collector parses hook event, matcher, and command entries from Cursor and Claude hook configs, hashes referenced scripts, and preserves source configs.
## Forensic Value
Hooks can run shell commands before or after AI tool events without an interactive prompt. They are a high-risk persistence and code-execution surface during AI-assisted investigations.
---
# AI MCP
> Source: https://kb.binalyze.ai/air/features/acquisition/supported-evidence/macos-collections-detail/ai-mcp.html
## Overview
**Evidence:** AI MCP
**Description:** Extract MCP server definitions and execution surface from AI tool configs
**Category:** AI
**Platform:** macos
**Short Name:** aimcp
**Is Parsed:** Yes
**Sent to Investigation Hub:** Yes
**Collect File(s):** No
## Background
Model Context Protocol (MCP) servers are the execution bridge between AI agents and external systems. Configured servers can launch local commands, expose environment variables, or connect to remote endpoints.
## Data Collected
This collector gathers structured data about MCP servers, including server name, launch command and arguments, environment-variable names, transport, URL host, and risk flags.
## Collection Method
This collector scans claude_desktop_config.json, .mcp.json, and mcp.json in per-user and per-project scope and extracts each defined MCP server.
## Forensic Value
Inventories every MCP server configured on the host. Risk flags highlight remote servers, risky launchers, broad environment exposure, and suspicious command patterns that can extend an agent's reach.
---
# AI Models
> Source: https://kb.binalyze.ai/air/features/acquisition/supported-evidence/macos-collections-detail/ai-models.html
## Overview
**Evidence:** AI Models
**Description:** Inventory Ollama, Hugging Face, and signature-confirmed local model components
**Category:** AI
**Platform:** macos
**Short Name:** aimodel
**Is Parsed:** Yes
**Sent to Investigation Hub:** Yes
**Collect File(s):** No
## Background
Local model runtimes such as Ollama and Hugging Face caches store model revisions and component files on disk. Presence of a model is not proof it was executed; inventory still shows which components were referenced locally.
## Data Collected
This collector gathers structured data about local model-component references, including model key, revision, component role, locator, capture mode, digest provenance, verification status, size, and timestamps where available.
## Collection Method
This collector parses bounded Ollama manifests, Hugging Face cache refs and snapshot metadata, and recognized model metadata inside signature-confirmed project roots. Large model-content files remain metadata-only.
## Forensic Value
Shows which model revisions and components were referenced locally, preserving declared and physically computed digest provenance without treating a downloaded model as proof of execution.
---
# AI Rules
> Source: https://kb.binalyze.ai/air/features/acquisition/supported-evidence/macos-collections-detail/ai-rules.html
## Overview
**Evidence:** AI Rules
**Description:** Parse AI tool rules, instructions, and ignore/indexing files
**Category:** AI
**Platform:** macos
**Short Name:** airule
**Is Parsed:** Yes
**Sent to Investigation Hub:** Yes
**Collect File(s):** No
## Background
Instruction files such as CLAUDE.md, AGENTS.md, .cursorrules, Copilot instructions, and AI ignore/indexing files persist standing guidance for coding assistants. They can inject attacker-controlled directives or hide files from AI review.
## Data Collected
This collector gathers structured data about AI rules and instruction files, including path, type, SHA-256, size, and a bounded redacted excerpt.
## Collection Method
This collector uses the AI artifact scanner across user homes and development roots. Full rule bodies are copied to Content; Case.db stores metadata plus a bounded redacted excerpt.
## Forensic Value
Surfaces persistent prompt-injection directives and anti-forensics exclusions that can hide malicious files from AI review or steer agent behavior across sessions.
---
# AI Secrets
> Source: https://kb.binalyze.ai/air/features/acquisition/supported-evidence/macos-collections-detail/ai-secrets.html
## Overview
**Evidence:** AI Secrets
**Description:** Hunt credentials exposed in AI prompts, responses, tool output, and configs
**Category:** AI
**Platform:** macos
**Short Name:** aisec
**Is Parsed:** Yes
**Sent to Investigation Hub:** Yes
**Collect File(s):** No
## Background
Developers paste tokens, keys, and credentials into AI prompts. Agents can also echo secrets back or receive them from tool output and config stores. Those findings are a credential-exposure lead, not proof of theft.
## Data Collected
This collector gathers structured data about redacted credential findings, including detector, category, surface, location, and links back to the originating session or event. Cleartext is not stored in Case.db.
## Collection Method
This collector reuses the AI artifact scanner and transcript/config parsers. A two-stage detector emits redacted findings with their surface and location. Cleartext is never written to Case.db.
## Forensic Value
Reveals secrets a developer pasted into an AI tool, that an agent echoed back, or that a tool returned. Findings link to the originating session, event, and preserved raw source for follow-up.
---
# AI Sessions
> Source: https://kb.binalyze.ai/air/features/acquisition/supported-evidence/macos-collections-detail/ai-sessions.html
## Overview
**Evidence:** AI Sessions
**Description:** Parse AI agent transcripts to extract session timeline headers
**Category:** AI
**Platform:** macos
**Short Name:** aisess
**Is Parsed:** Yes
**Sent to Investigation Hub:** Yes
**Collect File(s):** No
## Background
AI coding tools persist conversation sessions as JSONL transcripts and workspace files. Session headers show when an agent ran, which project it targeted, and how many prompts or tool calls occurred.
## Data Collected
This collector gathers structured data about AI agent sessions, including project path, timestamps, message counts, tool-call counts, and session-level risk flags.
## Collection Method
This collector scans per-user transcript directories and workspace storage. JSONL transcripts are parsed for session metadata; workspace files map workspace IDs to project paths.
## Forensic Value
Reconstructs the timeline of AI agent sessions: when they ran, in which projects, and how many prompts and tool calls occurred. Risk flags surface sessions with dangerous commands, prompt injection indicators, or transcript integrity gaps.
---
# AI Skills
> Source: https://kb.binalyze.ai/air/features/acquisition/supported-evidence/macos-collections-detail/ai-skills.html
## Overview
**Evidence:** AI Skills
**Description:** Parse AI skill definitions and bundled script inventory
**Category:** AI
**Platform:** macos
**Short Name:** aiskill
**Is Parsed:** Yes
**Sent to Investigation Hub:** Yes
**Collect File(s):** No
## Background
AI tools load SKILL.md definitions and bundled scripts that extend agent capabilities. A malicious skill can inject dynamic context or execute bundled payloads during an agent run.
## Data Collected
This collector gathers structured data about AI skills and bundled skill files, including skill path, tools, SHA-256, size, and inventoried script metadata.
## Collection Method
This collector parses skill frontmatter and body excerpts, inventories bundled scripts by path, hash, and size, and copies raw files to Content.
## Forensic Value
Surfaces executable skill payloads and dynamic context injection that can steer or compromise AI agent execution beyond the interactive prompt.
---
# AnyDesk Logs
> Source: https://kb.binalyze.ai/air/features/acquisition/supported-evidence/macos-collections-detail/anydesk-logs.html
## Overview
**Evidence:** AnyDesk Logs
**Description:** Collect AnyDesk Logs
**Category:** Applications
**Platform:** macos
**Short Name:** adsl
**Is Parsed:** No
**Sent to Investigation Hub:** No
**Collect File(s):** Yes
## Background
AnyDesk is a remote desktop application that maintains trace logs of connections, sessions, file transfers, and user activities. Logs are stored in both user-specific directories and system-wide locations, including custom deployment prefixes.
## Data Collected
This collector gathers structured data about anydesk logs.
## Collection Method
This collector gathers AnyDesk trace files from user home directories (.anydesk folders with optional custom prefixes), system logs in /var/log, and Application Support directories.
## Forensic Value
AnyDesk logs are critical for investigating unauthorized remote access, data exfiltration, lateral movement, and insider threats. They reveal connection times, remote IP addresses, file transfers, and session activities often used in ransomware and data theft incidents.
---
# Apache Logs
> Source: https://kb.binalyze.ai/air/features/acquisition/supported-evidence/macos-collections-detail/apache-logs.html
## Overview
**Evidence:** Apache Logs
**Description:** Collect Apache Logs
**Category:** Applications
**Platform:** macos
**Short Name:** apcl
**Is Parsed:** No
**Sent to Investigation Hub:** No
**Collect File(s):** Yes
## Background
Apache HTTP Server logs on macOS record web server access, errors, and activities. These logs are found in various locations depending on installation method (system, Homebrew Intel, Homebrew Apple Silicon).
## Data Collected
This collector gathers structured data about apache logs.
## Collection Method
This collector gathers Apache/httpd logs from multiple possible locations including system directories (/var/log/apache2), Homebrew installations (/usr/local, /opt/homebrew), and user-specific Homebrew logs.
## Forensic Value
Apache logs are critical for investigating web application attacks, unauthorized access attempts, data exfiltration, web shell activities, and understanding web server compromise. Access logs reveal attacker IP addresses, request patterns, and attack vectors.
---
# Apple Audit Logs
> Source: https://kb.binalyze.ai/air/features/acquisition/supported-evidence/macos-collections-detail/apple-audit-logs.html
## Overview
**Evidence:** Apple Audit Logs
**Description:** Collect Apple Audit Logs
**Category:** System
**Platform:** macos
**Short Name:** audl
**Is Parsed:** Yes
**Sent to Investigation Hub:** Yes
**Collect File(s):** No
## Background
Apple audit logs record security-relevant events including execs, auth, and file operations. This data is essential for deep incident response and attribution.
## Data Collected
This collector gathers structured data about apple audit logs.
### Apple Audit Logs Data
| Field | Description | Example |
|-------|-------------|---------|
| `AuditLogFile` | Audit Log File | Example value |
| `Version` | Version | 123 |
| `Event` | Event | Example value |
| `Modifier` | Modifier | 123 |
| `Time` | Time | 2023-10-15 14:30:25+03:00 |
| `Msec` | Msec | 123 |
| `AuditUID` | Audit UID | Example value |
| `UID` | UID | Example value |
| `GID` | GID | Example value |
| `RUID` | RUID | Example value |
| `RGID` | RGID | Example value |
| `PID` | PID | 123 |
| `SID` | SID | 123 |
| `TID` | TID | Example value |
| `Errval` | Errval | Example value |
| `Retval` | Retval | 123 |
| `SignerType` | Signer Type | 123 |
| `SigningID` | Signing ID | Example value |
| `TeamID` | Team ID | Example value |
| `CDHash` | CD Hash | Example value |
| `ExecArgs` | Exec Args | Example value |
| `FullPath` | Full Path | Example value |
| `Path` | Path | Example value |
## Collection Method
This collector copies `/private/var/audit/*` files and parses them using `praudit -x -l`, recording results into `audit_log`.
## Forensic Value
This evidence is crucial for forensic investigations as it provides authoritative, structured audit records with process and identity context.
---
# Apple System Logs (ASL)
> Source: https://kb.binalyze.ai/air/features/acquisition/supported-evidence/macos-collections-detail/apple-system-logs-asl.html
## Overview
**Evidence:** Apple System Logs (ASL)
**Description:** Collect Apple System Logs (ASL)
**Category:** System
**Platform:** macos
**Short Name:** asl
**Is Parsed:** Yes
**Sent to Investigation Hub:** Yes
**Collect File(s):** No
## Background
Apple System Logs (ASL) provide historical system and application log entries prior to Unified Logging. This data is essential for legacy system investigations and timeline reconstruction.
## Data Collected
This collector gathers structured data about apple system logs (asl).
### Apple System Logs (ASL) Data
| Field | Description | Example |
|-------|-------------|---------|
| `PID` | PID | 123 |
| `Sender` | Sender | Example value |
| `Facility` | Facility | Example value |
| `Message` | Message | Example value |
| `Level` | Level | Example value |
| `Time` | Time | 2023-10-15 14:30:25+03:00 |
## Collection Method
This collector copies `/private/var/log/asl/*.asl` files, converts them via `syslog -f -F xml`, and records entries into `asl`.
## Forensic Value
This evidence is crucial for forensic investigations as it can reveal authentication events, errors, and system activities captured by ASL.
---
# Application In Focus
> Source: https://kb.binalyze.ai/air/features/acquisition/supported-evidence/macos-collections-detail/application-in-focus.html
## Overview
**Evidence:** Application In Focus
**Description:** Collect Application In Focus
**Category:** System
**Platform:** macos
**Short Name:** appfocus
**Is Parsed:** Yes
**Sent to Investigation Hub:** Yes
**Collect File(s):** No
## Background
The KnowledgeC in-focus stream records which application held foreground focus and for how long. This is distinct from generic application usage and pinpoints the app the user was actively interacting with at a given moment.
## Data Collected
This collector gathers structured data about which application was in the foreground, including timing and duration. Results are recorded in `app_in_focus`.
## Collection Method
This collector reads KnowledgeC databases under user profiles and records application in-focus events into `app_in_focus`.
## Forensic Value
This evidence reconstructs precise user interaction timelines, revealing which app was front-most during an incident and aiding anomaly detection.
---
# Application Intents
> Source: https://kb.binalyze.ai/air/features/acquisition/supported-evidence/macos-collections-detail/application-intents.html
## Overview
**Evidence:** Application Intents
**Description:** Collect Application Intents
**Category:** System
**Platform:** macos
**Short Name:** appint
**Is Parsed:** Yes
**Sent to Investigation Hub:** Yes
**Collect File(s):** No
## Background
The KnowledgeC app intents stream records app intents and Siri-donated user actions, capturing the owning application together with the intent class and verb, for example sending a message, starting a call, or playing media.
## Data Collected
This collector gathers structured data about donated app intents, including the application, intent class and verb, and timing. Results are recorded in `app_intents`.
## Collection Method
This collector reads KnowledgeC databases under user profiles and records application intent events into `app_intents`.
## Forensic Value
Donated app intents reveal user actions such as messaging, calling, and media playback even when the originating app's own logs are unavailable, aiding activity timeline reconstruction.
---
# Application Media Usage
> Source: https://kb.binalyze.ai/air/features/acquisition/supported-evidence/macos-collections-detail/application-media-usage.html
## Overview
**Evidence:** Application Media Usage
**Description:** Collect Application Media Usage
**Category:** System
**Platform:** macos
**Short Name:** appmedia
**Is Parsed:** Yes
**Sent to Investigation Hub:** Yes
**Collect File(s):** No
## Background
The KnowledgeC media usage stream records per-application media playback and consumption, including the owning application, playback duration, and, where available, the media URL behind the playback.
## Data Collected
This collector gathers structured data about application media playback, including the application, media metadata, and timing. Results are recorded in `app_media_usage`.
## Collection Method
This collector reads KnowledgeC databases under user profiles and records application media usage into `app_media_usage`.
## Forensic Value
This evidence ties a user to media content consumed at specific times, helping reconstruct activity timelines and revealing applications and content in use during an incident window.
---
# Application Usage
> Source: https://kb.binalyze.ai/air/features/acquisition/supported-evidence/macos-collections-detail/application-usage.html
## Overview
**Evidence:** Application Usage
**Description:** Collect Application Usage
**Category:** System
**Platform:** macos
**Short Name:** appusg
**Is Parsed:** Yes
**Sent to Investigation Hub:** Yes
**Collect File(s):** No
## Background
Application usage events from KnowledgeC track app foreground activity durations. This data is essential for reconstructing user activity, triage timelines, and identifying suspicious usage patterns.
## Data Collected
This collector gathers structured data about application usage.
## Collection Method
This collector reads KnowledgeC databases under user profiles and runs the application usage query, recording results into `app_usage`.
## Forensic Value
This evidence is crucial for forensic investigations as it shows which apps were active, when, and for how long, aiding timeline reconstruction and anomaly detection.
---
# Application Web Usage
> Source: https://kb.binalyze.ai/air/features/acquisition/supported-evidence/macos-collections-detail/application-web-usage.html
## Overview
**Evidence:** Application Web Usage
**Description:** Collect Application Web Usage
**Category:** System
**Platform:** macos
**Short Name:** appweb
**Is Parsed:** Yes
**Sent to Investigation Hub:** Yes
**Collect File(s):** No
## Background
The KnowledgeC web usage stream records web domains visited through Safari and other apps along with the owning application and usage duration. It captures browsing activity even when browser history has been cleared.
## Data Collected
This collector gathers structured data about application web usage, including the application, domain, and timing. Results are recorded in `app_web_usage`.
## Collection Method
This collector reads KnowledgeC databases under user profiles and records application web usage into `app_web_usage`.
## Forensic Value
This evidence ties users to visited web domains and durations, surviving browser history deletion and aiding exfiltration and command-and-control analysis.
---
# Arc Bookmarks
> Source: https://kb.binalyze.ai/air/features/acquisition/supported-evidence/macos-collections-detail/arc-bookmarks.html
## Overview
**Evidence:** Arc Bookmarks
**Description:** Collect Arc Bookmarks
**Category:** Applications
**Platform:** macos
**Short Name:** abkmrks
**Is Parsed:** Yes
**Sent to Investigation Hub:** Yes
**Collect File(s):** No
## Background
Browser bookmarks represent user-saved favorite websites and organizational folders. This data reveals frequently accessed sites, user interests, and potential indicators of reconnaissance, phishing targets, or suspicious infrastructure.
## Data Collected
This collector gathers structured data about arc bookmarks.
### Arc Bookmarks Data
| Field | Description | Example |
|-------|-------------|---------|
| `UserName` | User Name | Example value |
| `ProfileName` | Profile Name | Example value |
| `BrowserName` | Browser Name | Example value |
| `GUID` | GUID | Example value |
| `BookmarkID` | Bookmark ID | Example value |
| `Name` | Name | Example value |
| `Type` | Type | Example value |
| `URL` | URL | Example value |
| `ParentFolder` | Parent Folder | Example value |
| `DateAdded` | Date Added | 2023-10-15 14:30:25+03:00 |
| `DateLastUsed` | Date Last Used | 2023-10-15 14:30:25+03:00 |
| `DateModified` | Date Modified | 2023-10-15 14:30:25+03:00 |
## Collection Method
This collector parses the browser's Bookmarks file to extract saved URLs, folder structures, timestamps, and metadata.
## Forensic Value
Bookmark analysis identifies targeted websites, phishing pages, command-and-control servers, internal resources, and organizational reconnaissance patterns. Investigators can detect social engineering campaigns, credential harvesting attempts, and lateral movement preparation.
---
# Arc Browsing History
> Source: https://kb.binalyze.ai/air/features/acquisition/supported-evidence/macos-collections-detail/arc-browsing-history.html
## Overview
**Evidence:** Arc Browsing History
**Description:** Collect visited URLs from Arc
**Category:** Applications
**Platform:** macos
**Short Name:** ahst
**Is Parsed:** Yes
**Sent to Investigation Hub:** Yes
**Collect File(s):** No
## Background
Browser history records all websites visited by users, including URLs, page titles, visit timestamps, visit counts, and transition types. This data is essential for reconstructing user activity, identifying malicious websites, and tracking lateral movement or reconnaissance activities.
## Data Collected
This collector gathers structured data about arc browsing history.
### Arc Browsing History Data
| Field | Description | Example |
|-------|-------------|---------|
| `AccessTime` | Access Time | 2023-10-15 14:30:25+03:00 |
| `AccessCount` | Access Count | 123 |
| `URL` | URL | Example value |
| `Browser` | Browser | Example value |
| `Title` | Title | Example value |
| `VisitDuration` | Visit Duration | Example value |
| `Referrer` | Referrer | Example value |
| `TypedCount` | Typed Count | 123 |
| `IsHidden` | Is Hidden | true |
| `TransitionType` | Transition Type | Example value |
| `VisitID` | Visit ID | 123 |
| `TransitionQualifiers` | Transition Qualifiers | Example value |
| `User` | User | Example value |
| `Profile` | Profile | Example value |
| `HistoryFilePath` | History File Path | Example value |
## Collection Method
This collector queries the browser's History database to extract visited URLs, timestamps, referrer information, and user interaction patterns.
## Forensic Value
Browsing history reveals phishing sites, malicious domains, command-and-control servers, data exfiltration targets, and reconnaissance activities. Analysts can identify compromised credentials, track attacker infrastructure, and correlate web activity with other security events to establish attack timelines.
---
# Arc Cookies
> Source: https://kb.binalyze.ai/air/features/acquisition/supported-evidence/macos-collections-detail/arc-cookies.html
## Overview
**Evidence:** Arc Cookies
**Description:** Collect Arc Cookies
**Category:** Applications
**Platform:** macos
**Short Name:** acookies
**Is Parsed:** Yes
**Sent to Investigation Hub:** Yes
**Collect File(s):** No
## Background
Browser cookies store session tokens, authentication credentials, user preferences, and tracking data. This data is essential for understanding authenticated sessions, tracking user activity across websites, and identifying session hijacking or credential theft.
## Data Collected
This collector gathers structured data about arc cookies.
### Arc Cookies Data
| Field | Description | Example |
|-------|-------------|---------|
| `UserName` | User Name | Example value |
| `BrowserName` | Browser Name | Example value |
| `ProfileName` | Profile Name | Example value |
| `Domain` | Domain | Example value |
| `Name` | Name | Example value |
| `Path` | Path | Example value |
| `Value` | Value | Example value |
| `IsSecure` | Is Secure | 123 |
| `IsHTTPOnly` | Is HTTP Only | 123 |
| `HasExpires` | Has Expires | 123 |
| `IsPersistent` | Is Persistent | 123 |
| `Priority` | Priority | 123 |
| `SameSite` | Same Site | 123 |
| `SourcePort` | Source Port | 123 |
| `SourceScheme` | Source Scheme | 123 |
| `CreationTime` | Creation Time | 2023-10-15 14:30:25+03:00 |
| `ExpiresTime` | Expires Time | 2023-10-15 14:30:25+03:00 |
| `LastAccessTime` | Last Access Time | 2023-10-15 14:30:25+03:00 |
## Collection Method
This collector extracts cookies from the browser's Cookies database, including domain, name, value, path, expiration, and security flags.
## Forensic Value
Cookie analysis reveals active sessions, authentication tokens, persistent tracking identifiers, and potential session hijacking. Investigators can identify stolen credentials, unauthorized access, and cross-site tracking used for reconnaissance or targeting.
---
# Arc Downloads
> Source: https://kb.binalyze.ai/air/features/acquisition/supported-evidence/macos-collections-detail/arc-downloads.html
## Overview
**Evidence:** Arc Downloads
**Description:** Collect Arc Downloads
**Category:** Applications
**Platform:** macos
**Short Name:** adwnlds
**Is Parsed:** Yes
**Sent to Investigation Hub:** Yes
**Collect File(s):** No
## Background
Browser download history records files downloaded by users, including file paths, timestamps, URLs, referrer information, and download status. This data is essential for tracking file acquisition, identifying potentially malicious downloads, and reconstructing user activity timelines.
## Data Collected
This collector gathers structured data about arc downloads.
### Arc Downloads Data
| Field | Description | Example |
|-------|-------------|---------|
| `UserName` | User Name | Example value |
| `Browser` | Browser | Example value |
| `ProfileName` | Profile Name | Example value |
| `URL` | URL | Example value |
| `TargetPath` | Target Path | Example value |
| `CurrentPath` | Current Path | Example value |
| `Referrer` | Referrer | Example value |
| `LastModified` | Last Modified | 2023-10-15 14:30:25+03:00 |
| `DangerType` | Danger Type | 123 |
| `Opened` | Opened | 123 |
| `TabURL` | Tab URL | Example value |
| `TabReferrerURL` | Tab Referrer URL | Example value |
| `StartTime` | Start Time | 2023-10-15 14:30:25+03:00 |
| `EndTime` | End Time | 2023-10-15 14:30:25+03:00 |
| `HistoryFilePath` | History File Path | Example value |
## Collection Method
This collector queries the browser's History database to extract download records, including file paths, download times, source URLs, and security flags.
## Forensic Value
Download history reveals malware delivery vectors, data exfiltration attempts, unauthorized software installation, and user interaction with suspicious websites. Analysts can identify downloaded malicious files, track attack chains, and correlate downloads with other security events.
---
# Arc Favicons
> Source: https://kb.binalyze.ai/air/features/acquisition/supported-evidence/macos-collections-detail/arc-favicons.html
## Overview
**Evidence:** Arc Favicons
**Description:** Collect Arc Favicons
**Category:** Applications
**Platform:** macos
**Short Name:** afico
**Is Parsed:** Yes
**Sent to Investigation Hub:** Yes
**Collect File(s):** No
## Background
Browser favicons are cached website icons that provide visual history of visited sites. This data supplements browsing history by revealing sites accessed even if history was deleted.
## Data Collected
This collector gathers structured data about arc favicons.
### Arc Favicons Data
| Field | Description | Example |
|-------|-------------|---------|
| `ID` | ID | 123 |
| `UserName` | User Name | Example value |
| `BrowserName` | Browser Name | Example value |
| `Profile` | Profile | Example value |
| `URL` | URL | Example value |
| `IconType` | Icon Type | 123 |
| `Path` | Path | Example value |
## Collection Method
This collector queries the browser's Favicons database to extract cached website icons and associated URLs.
## Forensic Value
Favicon analysis can recover evidence of deleted browsing history, identify visited sites through icon fingerprinting, and correlate with other browser artifacts to establish comprehensive activity timelines.
---
# Arc Form History
> Source: https://kb.binalyze.ai/air/features/acquisition/supported-evidence/macos-collections-detail/arc-form-history.html
## Overview
**Evidence:** Arc Form History
**Description:** Collect Arc Form History
**Category:** Applications
**Platform:** macos
**Short Name:** afh
**Is Parsed:** Yes
**Sent to Investigation Hub:** Yes
**Collect File(s):** No
## Background
Browser form history stores previously entered form data including search queries, usernames, and other input fields. This data reveals user search patterns, account information, and potential data leakage through autofill.
## Data Collected
This collector gathers structured data about arc form history.
### Arc Form History Data
| Field | Description | Example |
|-------|-------------|---------|
| `UserName` | User Name | Example value |
| `BrowserName` | Browser Name | Example value |
| `Name` | Name | Example value |
| `Value` | Value | Example value |
| `ValueLower` | Value Lower | Example value |
| `Count` | Count | 123 |
| `Profile` | Profile | Example value |
| `Path` | Path | Example value |
| `DateCreated` | Date Created | 2023-10-15 14:30:25+03:00 |
| `DateLastUsed` | Date Last Used | 2023-10-15 14:30:25+03:00 |
## Collection Method
This collector queries the browser's form history database to extract saved form field data, search queries, and associated timestamps.
## Forensic Value
Form history exposes reconnaissance activities, credential enumeration attempts, search queries revealing attacker intent, and potentially sensitive information entered into web forms. Analysts can identify data exfiltration, account compromise indicators, and targeted search patterns.
---
# Arc Local Storage
> Source: https://kb.binalyze.ai/air/features/acquisition/supported-evidence/macos-collections-detail/arc-local-storage.html
## Overview
**Evidence:** Arc Local Storage
**Description:** Collect Arc Local Storage
**Category:** Applications
**Platform:** macos
**Short Name:** als
**Is Parsed:** Yes
**Sent to Investigation Hub:** Yes
**Collect File(s):** No
## Background
Browser local storage contains persistent key-value data stored by websites. This data includes user preferences, session state, cached data, and potentially authentication tokens or sensitive information.
## Data Collected
This collector gathers structured data about arc local storage.
### Arc Local Storage Data
| Field | Description | Example |
|-------|-------------|---------|
| `UserName` | User Name | Example value |
| `ProfileName` | Profile Name | Example value |
| `BrowserName` | Browser Name | Example value |
| `Key` | Key | Example value |
| `Value` | Value | Example value |
| `Path` | Path | Example value |
## Collection Method
This collector extracts local storage data from browser storage databases and files.
## Forensic Value
Local storage analysis reveals stored credentials, session tokens, tracking identifiers, and application state that can indicate compromised accounts, persistent tracking, or malicious website activity. Analysts can identify credential theft, session hijacking, and data exfiltration attempts.
---
# Arc Login Data
> Source: https://kb.binalyze.ai/air/features/acquisition/supported-evidence/macos-collections-detail/arc-login-data.html
## Overview
**Evidence:** Arc Login Data
**Description:** Collect Arc Login Data
**Category:** Applications
**Platform:** macos
**Short Name:** arclgd
**Is Parsed:** Yes
**Sent to Investigation Hub:** Yes
**Collect File(s):** No
## Background
Browser login data stores saved passwords and credential information. This data is critical for identifying stored credentials, password reuse patterns, and potential credential theft targets.
## Data Collected
This collector gathers structured data about arc login data.
### Arc Login Data Data
| Field | Description | Example |
|-------|-------------|---------|
| `ID` | ID | 123 |
| `UserName` | User Name | Example value |
| `BrowserName` | Browser Name | Example value |
| `OriginURL` | Origin URL | Example value |
| `SignonRealm` | Signon Realm | Example value |
| `BlacklistedByUser` | Blacklisted By User | 123 |
| `Scheme` | Scheme | Example value |
| `PasswordType` | Password Type | Example value |
| `TimesUsed` | Times Used | 123 |
| `Profile` | Profile | Example value |
| `Path` | Path | Example value |
| `DateCreated` | Date Created | 2023-10-15 14:30:25+03:00 |
| `DateLastUsed` | Date Last Used | 2023-10-15 14:30:25+03:00 |
## Collection Method
This collector extracts saved credentials from the browser's Login Data database, including URLs, usernames, and encrypted passwords.
## Forensic Value
Login data analysis reveals stored credentials, password reuse across services, targeted accounts, and potential credential harvesting. Investigators can identify compromised accounts, credential theft attempts, and unauthorized access to saved credentials by malware or attackers.
---
# Arc Sessions
> Source: https://kb.binalyze.ai/air/features/acquisition/supported-evidence/macos-collections-detail/arc-sessions.html
## Overview
**Evidence:** Arc Sessions
**Description:** Collect Arc Sessions
**Category:** Applications
**Platform:** macos
**Short Name:** arcss
**Is Parsed:** Yes
**Sent to Investigation Hub:** Yes
**Collect File(s):** No
## Background
Browser sessions maintain active tab state, cookies, and authentication context. This data reveals currently active user sessions, open websites, and authenticated connections at the time of collection.
## Data Collected
This collector gathers structured data about arc sessions.
### Arc Sessions Data
| Field | Description | Example |
|-------|-------------|---------|
| `ID` | ID | 123 |
| `WindowID` | Window ID | 123 |
| `Active` | Active | true |
| `Url` | Url | Example value |
| `Title` | Title | Example value |
| `Deleted` | Deleted | true |
| `Group` | Group | Example value |
| `History` | History | [] |
| `BrowserName` | Browser Name | Example value |
## Collection Method
This collector captures browser session data including active tabs, session cookies, and authentication state.
## Forensic Value
Session analysis identifies active compromises, authenticated sessions to malicious sites, concurrent suspicious activities, and real-time indicators of ongoing attacks. Analysts can detect active C2 connections, authenticated malware communications, and live attacker sessions.
---
# Arc Thumbnails
> Source: https://kb.binalyze.ai/air/features/acquisition/supported-evidence/macos-collections-detail/arc-thumbnails.html
## Overview
**Evidence:** Arc Thumbnails
**Description:** Collect Arc Thumbnails
**Category:** Applications
**Platform:** macos
**Short Name:** athmb
**Is Parsed:** Yes
**Sent to Investigation Hub:** Yes
**Collect File(s):** No
## Background
Browser thumbnails are cached preview images of visited websites. This visual data supplements browsing history by providing screenshots of accessed pages, useful for recovering deleted history and identifying visited content.
## Data Collected
This collector gathers structured data about arc thumbnails.
### Arc Thumbnails Data
| Field | Description | Example |
|-------|-------------|---------|
| `UserName` | User Name | Example value |
| `Browser` | Browser | Example value |
| `URL` | URL | Example value |
| `URLRank` | URL Rank | 123 |
| `Title` | Title | Example value |
| `Profile` | Profile | Example value |
| `Path` | Path | Example value |
## Collection Method
This collector extracts cached thumbnail images from browser storage.
## Forensic Value
Thumbnail analysis provides visual evidence of visited websites, can recover evidence after history deletion, and helps identify phishing pages, malicious sites, or sensitive internal resources accessed by users through visual inspection.
---
# Arc User Profiles
> Source: https://kb.binalyze.ai/air/features/acquisition/supported-evidence/macos-collections-detail/arc-user-profiles.html
## Overview
**Evidence:** Arc User Profiles
**Description:** Collect Arc User Profiles
**Category:** Applications
**Platform:** macos
**Short Name:** aprfls
**Is Parsed:** Yes
**Sent to Investigation Hub:** Yes
**Collect File(s):** No
## Background
Browser user profiles store per-user browser configurations, extensions, settings, and data segregation. This data reveals multiple user accounts, profile switching patterns, and user-specific browsing behavior.
## Data Collected
This collector gathers structured data about arc user profiles.
### Arc User Profiles Data
| Field | Description | Example |
|-------|-------------|---------|
| `EndpointUserName` | Endpoint User Name | Example value |
| `Profile` | Profile | Example value |
| `ProfileUserName` | Profile User Name | Example value |
| `BrowserName` | Browser Name | Example value |
| `BackgroundApps` | Background Apps | true |
| `GoogleAccountGivenName` | Google Account Given Name | Example value |
| `GoogleAccountID` | Google Account ID | Example value |
| `GoogleAccountName` | Google Account Name | Example value |
| `PictureFileName` | Picture File Name | Example value |
| `LastDownloadedPictureURL` | Last Downloaded Picture URL | Example value |
| `HostedDomain` | Hosted Domain | Example value |
| `IsConsentedPrimaryAccount` | Is Consented Primary Account | true |
| `IsEphemeral` | Is Ephemeral | true |
## Collection Method
This collector enumerates browser user profiles and extracts profile metadata, configurations, and associated data paths.
## Forensic Value
Profile analysis identifies multiple user accounts, profile-specific extensions and configurations, shared device usage patterns, and potential privilege escalation or lateral movement using different browser profiles. Investigators can correlate activity across profiles and identify unauthorized profile creation.
---
# Arc Web Storage
> Source: https://kb.binalyze.ai/air/features/acquisition/supported-evidence/macos-collections-detail/arc-web-storage.html
## Overview
**Evidence:** Arc Web Storage
**Description:** Collect Arc Web Storage
**Category:** Applications
**Platform:** macos
**Short Name:** aws
**Is Parsed:** Yes
**Sent to Investigation Hub:** Yes
**Collect File(s):** No
## Background
Browser web storage includes both local and session storage used by websites to store client-side data. This data can contain application state, user preferences, cached content, and potentially sensitive information.
## Data Collected
This collector gathers structured data about arc web storage.
### Arc Web Storage Data
| Field | Description | Example |
|-------|-------------|---------|
| `UserName` | User Name | Example value |
| `ProfileName` | Profile Name | Example value |
| `BrowserName` | Browser Name | Example value |
| `Key` | Key | Example value |
| `Value` | Value | Example value |
| `Path` | Path | Example value |
## Collection Method
This collector extracts web storage data from browser storage locations including local storage and session storage.
## Forensic Value
Web storage analysis reveals cached application data, stored credentials, session information, and potential data exfiltration staging. Analysts can identify malicious website activity, stored authentication tokens, tracking identifiers, and sensitive data cached by compromised web applications.
---
# Audio Output Route
> Source: https://kb.binalyze.ai/air/features/acquisition/supported-evidence/macos-collections-detail/audio-output-route.html
## Overview
**Evidence:** Audio Output Route
**Description:** Collect Audio Output Route
**Category:** System
**Platform:** macos
**Short Name:** audout
**Is Parsed:** Yes
**Sent to Investigation Hub:** Yes
**Collect File(s):** No
## Background
The KnowledgeC audio output route stream records the active audio output device over time, including built-in speakers, headphones, and Bluetooth audio devices such as AirPods.
## Data Collected
This collector gathers structured data about the active audio output route, including route name, type, and timing. Results are recorded in `audio_output_route`.
## Collection Method
This collector reads KnowledgeC databases under user profiles and records audio output route events into `audio_output_route`.
## Forensic Value
Audio routing to external or wireless devices can indicate covert listening, presence of paired peripherals, and user activity patterns.
---
# Auto Loaded Processes
> Source: https://kb.binalyze.ai/air/features/acquisition/supported-evidence/macos-collections-detail/auto-loaded-processes.html
## Overview
**Evidence:** Auto Loaded Processes
**Description:** Collect info on autoloaded processes
**Category:** System
**Platform:** macos
**Short Name:** autoproc
**Is Parsed:** Yes
**Sent to Investigation Hub:** Yes
**Collect File(s):** No
## Background
Launchd manages auto-loaded processes (daemons and agents) on macOS. This data is essential for identifying persistence mechanisms, startup items, and potentially malicious services.
## Data Collected
This collector gathers structured data about auto loaded processes.
## Collection Method
This collector queries the `launchd` table via osquery and captures associated plist metadata and file hashes when possible.
## Forensic Value
This evidence is crucial for forensic investigations as it reveals auto-starting processes, aiding detection of persistence, privilege abuse, and unauthorized services.
---
# Block Devices
> Source: https://kb.binalyze.ai/air/features/acquisition/supported-evidence/macos-collections-detail/block-devices.html
## Overview
**Evidence:** Block Devices
**Description:** Collect Block Devices
**Category:** DiskFilesystem
**Platform:** macos
**Short Name:** blkd
**Is Parsed:** Yes
**Sent to Investigation Hub:** Yes
**Collect File(s):** No
## Background
Block devices represent storage devices attached to the system, including internal disks, external drives, USB devices, and virtual disks. Understanding block device inventory is essential for identifying unauthorized storage access, data exfiltration vectors, and storage-based persistence mechanisms.
## Data Collected
This collector gathers structured data about block devices.
### Block Devices Data
| Field | Description | Example |
|-------|-------------|---------|
| `Name` | Name | Example value |
| `Parent` | Parent | Example value |
| `Vendor` | Vendor | Example value |
| `Model` | Model | Example value |
| `Size` | Size | 123 |
| `BlockSize` | Block Size | 123 |
| `UUID` | UUID | Example value |
| `Type` | Type | Example value |
| `Label` | Label | Example value |
## Collection Method
This collector queries the block_devices table via osquery to retrieve information about all attached block devices, including their names, vendors, models, sizes, UUIDs, and parent-child relationships.
## Forensic Value
Block device information reveals storage infrastructure and potential data transfer paths. Unexpected devices may indicate unauthorized USB storage use, external drive connections for data exfiltration, or attacker-controlled storage devices. This evidence helps identify data theft vectors, unauthorized access points, and storage-based command and control mechanisms.
---
# Bluetooth Connections
> Source: https://kb.binalyze.ai/air/features/acquisition/supported-evidence/macos-collections-detail/bluetooth-connections.html
## Overview
**Evidence:** Bluetooth Connections
**Description:** Collect Bluetooth Connections
**Category:** System
**Platform:** macos
**Short Name:** bluconn
**Is Parsed:** Yes
**Sent to Investigation Hub:** Yes
**Collect File(s):** No
## Background
KnowledgeC stores Bluetooth connection events with device names and MAC addresses. This data is essential for identifying connected peripherals and potential data exfiltration paths.
## Data Collected
This collector gathers structured data about bluetooth connections.
## Collection Method
This collector reads KnowledgeC databases and queries the bluetooth connection stream, recording into `bluetooth_connections`.
## Forensic Value
This evidence is crucial for forensic investigations as it ties users to external devices and timestamps connections.
---
# Brave Bookmarks
> Source: https://kb.binalyze.ai/air/features/acquisition/supported-evidence/macos-collections-detail/brave-bookmarks.html
## Overview
**Evidence:** Brave Bookmarks
**Description:** Collect Brave Bookmarks
**Category:** Applications
**Platform:** macos
**Short Name:** bbkmrks
**Is Parsed:** Yes
**Sent to Investigation Hub:** Yes
**Collect File(s):** No
## Background
Browser bookmarks represent user-saved favorite websites and organizational folders. This data reveals frequently accessed sites, user interests, and potential indicators of reconnaissance, phishing targets, or suspicious infrastructure.
## Data Collected
This collector gathers structured data about brave bookmarks.
### Brave Bookmarks Data
| Field | Description | Example |
|-------|-------------|---------|
| `UserName` | User Name | Example value |
| `ProfileName` | Profile Name | Example value |
| `BrowserName` | Browser Name | Example value |
| `GUID` | GUID | Example value |
| `BookmarkID` | Bookmark ID | Example value |
| `Name` | Name | Example value |
| `Type` | Type | Example value |
| `URL` | URL | Example value |
| `ParentFolder` | Parent Folder | Example value |
| `DateAdded` | Date Added | 2023-10-15 14:30:25+03:00 |
| `DateLastUsed` | Date Last Used | 2023-10-15 14:30:25+03:00 |
| `DateModified` | Date Modified | 2023-10-15 14:30:25+03:00 |
## Collection Method
This collector parses the browser's Bookmarks file to extract saved URLs, folder structures, timestamps, and metadata.
## Forensic Value
Bookmark analysis identifies targeted websites, phishing pages, command-and-control servers, internal resources, and organizational reconnaissance patterns. Investigators can detect social engineering campaigns, credential harvesting attempts, and lateral movement preparation.
---
# Brave Browsing History
> Source: https://kb.binalyze.ai/air/features/acquisition/supported-evidence/macos-collections-detail/brave-browsing-history.html
## Overview
**Evidence:** Brave Browsing History
**Description:** Collect visited URLs from Brave
**Category:** Applications
**Platform:** macos
**Short Name:** bhst
**Is Parsed:** Yes
**Sent to Investigation Hub:** Yes
**Collect File(s):** No
## Background
Browser history records all websites visited by users, including URLs, page titles, visit timestamps, visit counts, and transition types. This data is essential for reconstructing user activity, identifying malicious websites, and tracking lateral movement or reconnaissance activities.
## Data Collected
This collector gathers structured data about brave browsing history.
### Brave Browsing History Data
| Field | Description | Example |
|-------|-------------|---------|
| `AccessTime` | Access Time | 2023-10-15 14:30:25+03:00 |
| `AccessCount` | Access Count | 123 |
| `URL` | URL | Example value |
| `Browser` | Browser | Example value |
| `Title` | Title | Example value |
| `VisitDuration` | Visit Duration | Example value |
| `Referrer` | Referrer | Example value |
| `TypedCount` | Typed Count | 123 |
| `IsHidden` | Is Hidden | true |
| `TransitionType` | Transition Type | Example value |
| `VisitID` | Visit ID | 123 |
| `TransitionQualifiers` | Transition Qualifiers | Example value |
| `User` | User | Example value |
| `Profile` | Profile | Example value |
| `HistoryFilePath` | History File Path | Example value |
## Collection Method
This collector queries the browser's History database to extract visited URLs, timestamps, referrer information, and user interaction patterns.
## Forensic Value
Browsing history reveals phishing sites, malicious domains, command-and-control servers, data exfiltration targets, and reconnaissance activities. Analysts can identify compromised credentials, track attacker infrastructure, and correlate web activity with other security events to establish attack timelines.
---
# Brave Cookies
> Source: https://kb.binalyze.ai/air/features/acquisition/supported-evidence/macos-collections-detail/brave-cookies.html
## Overview
**Evidence:** Brave Cookies
**Description:** Collect Brave Cookies
**Category:** Applications
**Platform:** macos
**Short Name:** bcookies
**Is Parsed:** Yes
**Sent to Investigation Hub:** Yes
**Collect File(s):** No
## Background
Browser cookies store session tokens, authentication credentials, user preferences, and tracking data. This data is essential for understanding authenticated sessions, tracking user activity across websites, and identifying session hijacking or credential theft.
## Data Collected
This collector gathers structured data about brave cookies.
### Brave Cookies Data
| Field | Description | Example |
|-------|-------------|---------|
| `UserName` | User Name | Example value |
| `BrowserName` | Browser Name | Example value |
| `ProfileName` | Profile Name | Example value |
| `Domain` | Domain | Example value |
| `Name` | Name | Example value |
| `Path` | Path | Example value |
| `Value` | Value | Example value |
| `IsSecure` | Is Secure | 123 |
| `IsHTTPOnly` | Is HTTP Only | 123 |
| `HasExpires` | Has Expires | 123 |
| `IsPersistent` | Is Persistent | 123 |
| `Priority` | Priority | 123 |
| `SameSite` | Same Site | 123 |
| `SourcePort` | Source Port | 123 |
| `SourceScheme` | Source Scheme | 123 |
| `CreationTime` | Creation Time | 2023-10-15 14:30:25+03:00 |
| `ExpiresTime` | Expires Time | 2023-10-15 14:30:25+03:00 |
| `LastAccessTime` | Last Access Time | 2023-10-15 14:30:25+03:00 |
## Collection Method
This collector extracts cookies from the browser's Cookies database, including domain, name, value, path, expiration, and security flags.
## Forensic Value
Cookie analysis reveals active sessions, authentication tokens, persistent tracking identifiers, and potential session hijacking. Investigators can identify stolen credentials, unauthorized access, and cross-site tracking used for reconnaissance or targeting.
---
# Brave Downloads
> Source: https://kb.binalyze.ai/air/features/acquisition/supported-evidence/macos-collections-detail/brave-downloads.html
## Overview
**Evidence:** Brave Downloads
**Description:** Collect Brave Downloads
**Category:** Applications
**Platform:** macos
**Short Name:** bdwnlds
**Is Parsed:** Yes
**Sent to Investigation Hub:** Yes
**Collect File(s):** No
## Background
Browser download history records files downloaded by users, including file paths, timestamps, URLs, referrer information, and download status. This data is essential for tracking file acquisition, identifying potentially malicious downloads, and reconstructing user activity timelines.
## Data Collected
This collector gathers structured data about brave downloads.
### Brave Downloads Data
| Field | Description | Example |
|-------|-------------|---------|
| `UserName` | User Name | Example value |
| `Browser` | Browser | Example value |
| `ProfileName` | Profile Name | Example value |
| `URL` | URL | Example value |
| `TargetPath` | Target Path | Example value |
| `CurrentPath` | Current Path | Example value |
| `Referrer` | Referrer | Example value |
| `LastModified` | Last Modified | 2023-10-15 14:30:25+03:00 |
| `DangerType` | Danger Type | 123 |
| `Opened` | Opened | 123 |
| `TabURL` | Tab URL | Example value |
| `TabReferrerURL` | Tab Referrer URL | Example value |
| `StartTime` | Start Time | 2023-10-15 14:30:25+03:00 |
| `EndTime` | End Time | 2023-10-15 14:30:25+03:00 |
| `HistoryFilePath` | History File Path | Example value |
## Collection Method
This collector queries the browser's History database to extract download records, including file paths, download times, source URLs, and security flags.
## Forensic Value
Download history reveals malware delivery vectors, data exfiltration attempts, unauthorized software installation, and user interaction with suspicious websites. Analysts can identify downloaded malicious files, track attack chains, and correlate downloads with other security events.
---
# Brave Favicons
> Source: https://kb.binalyze.ai/air/features/acquisition/supported-evidence/macos-collections-detail/brave-favicons.html
## Overview
**Evidence:** Brave Favicons
**Description:** Collect Brave Favicons
**Category:** Applications
**Platform:** macos
**Short Name:** bfico
**Is Parsed:** Yes
**Sent to Investigation Hub:** Yes
**Collect File(s):** No
## Background
Browser favicons are cached website icons that provide visual history of visited sites. This data supplements browsing history by revealing sites accessed even if history was deleted.
## Data Collected
This collector gathers structured data about brave favicons.
### Brave Favicons Data
| Field | Description | Example |
|-------|-------------|---------|
| `ID` | ID | 123 |
| `UserName` | User Name | Example value |
| `BrowserName` | Browser Name | Example value |
| `Profile` | Profile | Example value |
| `URL` | URL | Example value |
| `IconType` | Icon Type | 123 |
| `Path` | Path | Example value |
## Collection Method
This collector queries the browser's Favicons database to extract cached website icons and associated URLs.
## Forensic Value
Favicon analysis can recover evidence of deleted browsing history, identify visited sites through icon fingerprinting, and correlate with other browser artifacts to establish comprehensive activity timelines.
---
# Brave Form History
> Source: https://kb.binalyze.ai/air/features/acquisition/supported-evidence/macos-collections-detail/brave-form-history.html
## Overview
**Evidence:** Brave Form History
**Description:** Collect Brave Form History
**Category:** Applications
**Platform:** macos
**Short Name:** bfh
**Is Parsed:** Yes
**Sent to Investigation Hub:** Yes
**Collect File(s):** No
## Background
Browser form history stores previously entered form data including search queries, usernames, and other input fields. This data reveals user search patterns, account information, and potential data leakage through autofill.
## Data Collected
This collector gathers structured data about brave form history.
### Brave Form History Data
| Field | Description | Example |
|-------|-------------|---------|
| `UserName` | User Name | Example value |
| `BrowserName` | Browser Name | Example value |
| `Name` | Name | Example value |
| `Value` | Value | Example value |
| `ValueLower` | Value Lower | Example value |
| `Count` | Count | 123 |
| `Profile` | Profile | Example value |
| `Path` | Path | Example value |
| `DateCreated` | Date Created | 2023-10-15 14:30:25+03:00 |
| `DateLastUsed` | Date Last Used | 2023-10-15 14:30:25+03:00 |
## Collection Method
This collector queries the browser's form history database to extract saved form field data, search queries, and associated timestamps.
## Forensic Value
Form history exposes reconnaissance activities, credential enumeration attempts, search queries revealing attacker intent, and potentially sensitive information entered into web forms. Analysts can identify data exfiltration, account compromise indicators, and targeted search patterns.
---
# Brave Local Storage
> Source: https://kb.binalyze.ai/air/features/acquisition/supported-evidence/macos-collections-detail/brave-local-storage.html
## Overview
**Evidence:** Brave Local Storage
**Description:** Collect Brave Local Storage
**Category:** Applications
**Platform:** macos
**Short Name:** bls
**Is Parsed:** Yes
**Sent to Investigation Hub:** Yes
**Collect File(s):** No
## Background
Browser local storage contains persistent key-value data stored by websites. This data includes user preferences, session state, cached data, and potentially authentication tokens or sensitive information.
## Data Collected
This collector gathers structured data about brave local storage.
### Brave Local Storage Data
| Field | Description | Example |
|-------|-------------|---------|
| `UserName` | User Name | Example value |
| `ProfileName` | Profile Name | Example value |
| `BrowserName` | Browser Name | Example value |
| `Key` | Key | Example value |
| `Value` | Value | Example value |
| `Path` | Path | Example value |
## Collection Method
This collector extracts local storage data from browser storage databases and files.
## Forensic Value
Local storage analysis reveals stored credentials, session tokens, tracking identifiers, and application state that can indicate compromised accounts, persistent tracking, or malicious website activity. Analysts can identify credential theft, session hijacking, and data exfiltration attempts.
---
# Brave Login Data
> Source: https://kb.binalyze.ai/air/features/acquisition/supported-evidence/macos-collections-detail/brave-login-data.html
## Overview
**Evidence:** Brave Login Data
**Description:** Collect Brave Login Data
**Category:** Applications
**Platform:** macos
**Short Name:** blgd
**Is Parsed:** Yes
**Sent to Investigation Hub:** Yes
**Collect File(s):** No
## Background
Browser login data stores saved passwords and credential information. This data is critical for identifying stored credentials, password reuse patterns, and potential credential theft targets.
## Data Collected
This collector gathers structured data about brave login data.
### Brave Login Data Data
| Field | Description | Example |
|-------|-------------|---------|
| `ID` | ID | 123 |
| `UserName` | User Name | Example value |
| `BrowserName` | Browser Name | Example value |
| `OriginURL` | Origin URL | Example value |
| `SignonRealm` | Signon Realm | Example value |
| `BlacklistedByUser` | Blacklisted By User | 123 |
| `Scheme` | Scheme | Example value |
| `PasswordType` | Password Type | Example value |
| `TimesUsed` | Times Used | 123 |
| `Profile` | Profile | Example value |
| `Path` | Path | Example value |
| `DateCreated` | Date Created | 2023-10-15 14:30:25+03:00 |
| `DateLastUsed` | Date Last Used | 2023-10-15 14:30:25+03:00 |
## Collection Method
This collector extracts saved credentials from the browser's Login Data database, including URLs, usernames, and encrypted passwords.
## Forensic Value
Login data analysis reveals stored credentials, password reuse across services, targeted accounts, and potential credential harvesting. Investigators can identify compromised accounts, credential theft attempts, and unauthorized access to saved credentials by malware or attackers.
---
# Brave Sessions
> Source: https://kb.binalyze.ai/air/features/acquisition/supported-evidence/macos-collections-detail/brave-sessions.html
## Overview
**Evidence:** Brave Sessions
**Description:** Collect Brave Sessions
**Category:** Applications
**Platform:** macos
**Short Name:** brvss
**Is Parsed:** Yes
**Sent to Investigation Hub:** Yes
**Collect File(s):** No
## Background
Browser sessions maintain active tab state, cookies, and authentication context. This data reveals currently active user sessions, open websites, and authenticated connections at the time of collection.
## Data Collected
This collector gathers structured data about brave sessions.
### Brave Sessions Data
| Field | Description | Example |
|-------|-------------|---------|
| `ID` | ID | 123 |
| `WindowID` | Window ID | 123 |
| `Active` | Active | true |
| `Url` | Url | Example value |
| `Title` | Title | Example value |
| `Deleted` | Deleted | true |
| `Group` | Group | Example value |
| `History` | History | [] |
| `BrowserName` | Browser Name | Example value |
## Collection Method
This collector captures browser session data including active tabs, session cookies, and authentication state.
## Forensic Value
Session analysis identifies active compromises, authenticated sessions to malicious sites, concurrent suspicious activities, and real-time indicators of ongoing attacks. Analysts can detect active C2 connections, authenticated malware communications, and live attacker sessions.
---
# Brave Thumbnails
> Source: https://kb.binalyze.ai/air/features/acquisition/supported-evidence/macos-collections-detail/brave-thumbnails.html
## Overview
**Evidence:** Brave Thumbnails
**Description:** Collect Brave Thumbnails
**Category:** Applications
**Platform:** macos
**Short Name:** bthmb
**Is Parsed:** Yes
**Sent to Investigation Hub:** Yes
**Collect File(s):** No
## Background
Browser thumbnails are cached preview images of visited websites. This visual data supplements browsing history by providing screenshots of accessed pages, useful for recovering deleted history and identifying visited content.
## Data Collected
This collector gathers structured data about brave thumbnails.
### Brave Thumbnails Data
| Field | Description | Example |
|-------|-------------|---------|
| `UserName` | User Name | Example value |
| `Browser` | Browser | Example value |
| `URL` | URL | Example value |
| `URLRank` | URL Rank | 123 |
| `Title` | Title | Example value |
| `Profile` | Profile | Example value |
| `Path` | Path | Example value |
## Collection Method
This collector extracts cached thumbnail images from browser storage.
## Forensic Value
Thumbnail analysis provides visual evidence of visited websites, can recover evidence after history deletion, and helps identify phishing pages, malicious sites, or sensitive internal resources accessed by users through visual inspection.
---
# Brave User Profiles
> Source: https://kb.binalyze.ai/air/features/acquisition/supported-evidence/macos-collections-detail/brave-user-profiles.html
## Overview
**Evidence:** Brave User Profiles
**Description:** Collect Brave User Profiles
**Category:** Applications
**Platform:** macos
**Short Name:** bprfls
**Is Parsed:** Yes
**Sent to Investigation Hub:** Yes
**Collect File(s):** No
## Background
Browser user profiles store per-user browser configurations, extensions, settings, and data segregation. This data reveals multiple user accounts, profile switching patterns, and user-specific browsing behavior.
## Data Collected
This collector gathers structured data about brave user profiles.
### Brave User Profiles Data
| Field | Description | Example |
|-------|-------------|---------|
| `EndpointUserName` | Endpoint User Name | Example value |
| `Profile` | Profile | Example value |
| `ProfileUserName` | Profile User Name | Example value |
| `BrowserName` | Browser Name | Example value |
| `BackgroundApps` | Background Apps | true |
| `GoogleAccountGivenName` | Google Account Given Name | Example value |
| `GoogleAccountID` | Google Account ID | Example value |
| `GoogleAccountName` | Google Account Name | Example value |
| `PictureFileName` | Picture File Name | Example value |
| `LastDownloadedPictureURL` | Last Downloaded Picture URL | Example value |
| `HostedDomain` | Hosted Domain | Example value |
| `IsConsentedPrimaryAccount` | Is Consented Primary Account | true |
| `IsEphemeral` | Is Ephemeral | true |
## Collection Method
This collector enumerates browser user profiles and extracts profile metadata, configurations, and associated data paths.
## Forensic Value
Profile analysis identifies multiple user accounts, profile-specific extensions and configurations, shared device usage patterns, and potential privilege escalation or lateral movement using different browser profiles. Investigators can correlate activity across profiles and identify unauthorized profile creation.
---
# Brave Web Storage
> Source: https://kb.binalyze.ai/air/features/acquisition/supported-evidence/macos-collections-detail/brave-web-storage.html
## Overview
**Evidence:** Brave Web Storage
**Description:** Collect Brave Web Storage
**Category:** Applications
**Platform:** macos
**Short Name:** bws
**Is Parsed:** Yes
**Sent to Investigation Hub:** Yes
**Collect File(s):** No
## Background
Browser web storage includes both local and session storage used by websites to store client-side data. This data can contain application state, user preferences, cached content, and potentially sensitive information.
## Data Collected
This collector gathers structured data about brave web storage.
### Brave Web Storage Data
| Field | Description | Example |
|-------|-------------|---------|
| `UserName` | User Name | Example value |
| `ProfileName` | Profile Name | Example value |
| `BrowserName` | Browser Name | Example value |
| `Key` | Key | Example value |
| `Value` | Value | Example value |
| `Path` | Path | Example value |
## Collection Method
This collector extracts web storage data from browser storage locations including local storage and session storage.
## Forensic Value
Web storage analysis reveals cached application data, stored credentials, session information, and potential data exfiltration staging. Analysts can identify malicious website activity, stored authentication tokens, tracking identifiers, and sensitive data cached by compromised web applications.
---
# Chrome Bookmarks
> Source: https://kb.binalyze.ai/air/features/acquisition/supported-evidence/macos-collections-detail/chrome-bookmarks.html
## Overview
**Evidence:** Chrome Bookmarks
**Description:** Collect Chrome Bookmarks
**Category:** Applications
**Platform:** macos
**Short Name:** cbkmrks
**Is Parsed:** Yes
**Sent to Investigation Hub:** Yes
**Collect File(s):** No
## Background
Browser bookmarks represent user-saved favorite websites and organizational folders. This data reveals frequently accessed sites, user interests, and potential indicators of reconnaissance, phishing targets, or suspicious infrastructure.
## Data Collected
This collector gathers structured data about chrome bookmarks.
### Chrome Bookmarks Data
| Field | Description | Example |
|-------|-------------|---------|
| `UserName` | User Name | Example value |
| `ProfileName` | Profile Name | Example value |
| `BrowserName` | Browser Name | Example value |
| `GUID` | GUID | Example value |
| `BookmarkID` | Bookmark ID | Example value |
| `Name` | Name | Example value |
| `Type` | Type | Example value |
| `URL` | URL | Example value |
| `ParentFolder` | Parent Folder | Example value |
| `DateAdded` | Date Added | 2023-10-15 14:30:25+03:00 |
| `DateLastUsed` | Date Last Used | 2023-10-15 14:30:25+03:00 |
| `DateModified` | Date Modified | 2023-10-15 14:30:25+03:00 |
## Collection Method
This collector parses the browser's Bookmarks file to extract saved URLs, folder structures, timestamps, and metadata.
## Forensic Value
Bookmark analysis identifies targeted websites, phishing pages, command-and-control servers, internal resources, and organizational reconnaissance patterns. Investigators can detect social engineering campaigns, credential harvesting attempts, and lateral movement preparation.
---
# Chrome Browsing History
> Source: https://kb.binalyze.ai/air/features/acquisition/supported-evidence/macos-collections-detail/chrome-browsing-history.html
## Overview
**Evidence:** Chrome Browsing History
**Description:** Collect visited URLs from Google Chrome
**Category:** Applications
**Platform:** macos
**Short Name:** chst
**Is Parsed:** Yes
**Sent to Investigation Hub:** Yes
**Collect File(s):** No
## Background
Browser history records all websites visited by users, including URLs, page titles, visit timestamps, visit counts, and transition types. This data is essential for reconstructing user activity, identifying malicious websites, and tracking lateral movement or reconnaissance activities.
## Data Collected
This collector gathers structured data about chrome browsing history.
### Chrome Browsing History Data
| Field | Description | Example |
|-------|-------------|---------|
| `AccessTime` | Access Time | 2023-10-15 14:30:25+03:00 |
| `AccessCount` | Access Count | 123 |
| `URL` | URL | Example value |
| `Browser` | Browser | Example value |
| `Title` | Title | Example value |
| `VisitDuration` | Visit Duration | Example value |
| `Referrer` | Referrer | Example value |
| `TypedCount` | Typed Count | 123 |
| `IsHidden` | Is Hidden | true |
| `TransitionType` | Transition Type | Example value |
| `VisitID` | Visit ID | 123 |
| `TransitionQualifiers` | Transition Qualifiers | Example value |
| `User` | User | Example value |
| `Profile` | Profile | Example value |
| `HistoryFilePath` | History File Path | Example value |
## Collection Method
This collector queries the browser's History database to extract visited URLs, timestamps, referrer information, and user interaction patterns.
## Forensic Value
Browsing history reveals phishing sites, malicious domains, command-and-control servers, data exfiltration targets, and reconnaissance activities. Analysts can identify compromised credentials, track attacker infrastructure, and correlate web activity with other security events to establish attack timelines.
---
# Chrome Cookies
> Source: https://kb.binalyze.ai/air/features/acquisition/supported-evidence/macos-collections-detail/chrome-cookies.html
## Overview
**Evidence:** Chrome Cookies
**Description:** Collect Chrome Cookies
**Category:** Applications
**Platform:** macos
**Short Name:** ccookies
**Is Parsed:** Yes
**Sent to Investigation Hub:** Yes
**Collect File(s):** No
## Background
Browser cookies store session tokens, authentication credentials, user preferences, and tracking data. This data is essential for understanding authenticated sessions, tracking user activity across websites, and identifying session hijacking or credential theft.
## Data Collected
This collector gathers structured data about chrome cookies.
### Chrome Cookies Data
| Field | Description | Example |
|-------|-------------|---------|
| `UserName` | User Name | Example value |
| `BrowserName` | Browser Name | Example value |
| `ProfileName` | Profile Name | Example value |
| `Domain` | Domain | Example value |
| `Name` | Name | Example value |
| `Path` | Path | Example value |
| `Value` | Value | Example value |
| `IsSecure` | Is Secure | 123 |
| `IsHTTPOnly` | Is HTTP Only | 123 |
| `HasExpires` | Has Expires | 123 |
| `IsPersistent` | Is Persistent | 123 |
| `Priority` | Priority | 123 |
| `SameSite` | Same Site | 123 |
| `SourcePort` | Source Port | 123 |
| `SourceScheme` | Source Scheme | 123 |
| `CreationTime` | Creation Time | 2023-10-15 14:30:25+03:00 |
| `ExpiresTime` | Expires Time | 2023-10-15 14:30:25+03:00 |
| `LastAccessTime` | Last Access Time | 2023-10-15 14:30:25+03:00 |
## Collection Method
This collector extracts cookies from the browser's Cookies database, including domain, name, value, path, expiration, and security flags.
## Forensic Value
Cookie analysis reveals active sessions, authentication tokens, persistent tracking identifiers, and potential session hijacking. Investigators can identify stolen credentials, unauthorized access, and cross-site tracking used for reconnaissance or targeting.
---
# Chrome Downloads
> Source: https://kb.binalyze.ai/air/features/acquisition/supported-evidence/macos-collections-detail/chrome-downloads.html
## Overview
**Evidence:** Chrome Downloads
**Description:** Collect Chrome Downloads
**Category:** Applications
**Platform:** macos
**Short Name:** cdwnlds
**Is Parsed:** Yes
**Sent to Investigation Hub:** Yes
**Collect File(s):** No
## Background
Browser download history records files downloaded by users, including file paths, timestamps, URLs, referrer information, and download status. This data is essential for tracking file acquisition, identifying potentially malicious downloads, and reconstructing user activity timelines.
## Data Collected
This collector gathers structured data about chrome downloads.
### Chrome Downloads Data
| Field | Description | Example |
|-------|-------------|---------|
| `UserName` | User Name | Example value |
| `Browser` | Browser | Example value |
| `ProfileName` | Profile Name | Example value |
| `URL` | URL | Example value |
| `TargetPath` | Target Path | Example value |
| `CurrentPath` | Current Path | Example value |
| `Referrer` | Referrer | Example value |
| `LastModified` | Last Modified | 2023-10-15 14:30:25+03:00 |
| `DangerType` | Danger Type | 123 |
| `Opened` | Opened | 123 |
| `TabURL` | Tab URL | Example value |
| `TabReferrerURL` | Tab Referrer URL | Example value |
| `StartTime` | Start Time | 2023-10-15 14:30:25+03:00 |
| `EndTime` | End Time | 2023-10-15 14:30:25+03:00 |
| `HistoryFilePath` | History File Path | Example value |
## Collection Method
This collector queries the browser's History database to extract download records, including file paths, download times, source URLs, and security flags.
## Forensic Value
Download history reveals malware delivery vectors, data exfiltration attempts, unauthorized software installation, and user interaction with suspicious websites. Analysts can identify downloaded malicious files, track attack chains, and correlate downloads with other security events.
---
# Chrome Extensions
> Source: https://kb.binalyze.ai/air/features/acquisition/supported-evidence/macos-collections-detail/chrome-extensions.html
## Overview
**Evidence:** Chrome Extensions
**Description:** Collect Chrome Extensions
**Category:** Applications
**Platform:** macos
**Short Name:** chrext
**Is Parsed:** Yes
**Sent to Investigation Hub:** Yes
**Collect File(s):** No
## Background
Browser extensions enhance browser functionality but can pose significant security risks. Malicious extensions can steal credentials, inject ads, track browsing activity, exfiltrate data, and modify web content. Understanding installed extensions is crucial for detecting browser-based attacks and unauthorized access.
## Data Collected
This collector gathers structured data about chrome extensions.
## Collection Method
This collector queries the browser's Extensions database or manifest files to extract installed extension information including names, IDs, versions, permissions, and installation sources.
## Forensic Value
Browser extensions provide insight into potential compromise vectors and data exfiltration paths. Malicious or suspicious extensions may indicate phishing attacks, credential theft, adware infections, or privacy violations. This evidence helps identify attack entry points, persistence mechanisms, and unauthorized browser modifications.
---
# Chrome Favicons
> Source: https://kb.binalyze.ai/air/features/acquisition/supported-evidence/macos-collections-detail/chrome-favicons.html
## Overview
**Evidence:** Chrome Favicons
**Description:** Collect Chrome Favicons
**Category:** Applications
**Platform:** macos
**Short Name:** cfico
**Is Parsed:** Yes
**Sent to Investigation Hub:** Yes
**Collect File(s):** No
## Background
Browser favicons are cached website icons that provide visual history of visited sites. This data supplements browsing history by revealing sites accessed even if history was deleted.
## Data Collected
This collector gathers structured data about chrome favicons.
### Chrome Favicons Data
| Field | Description | Example |
|-------|-------------|---------|
| `ID` | ID | 123 |
| `UserName` | User Name | Example value |
| `BrowserName` | Browser Name | Example value |
| `Profile` | Profile | Example value |
| `URL` | URL | Example value |
| `IconType` | Icon Type | 123 |
| `Path` | Path | Example value |
## Collection Method
This collector queries the browser's Favicons database to extract cached website icons and associated URLs.
## Forensic Value
Favicon analysis can recover evidence of deleted browsing history, identify visited sites through icon fingerprinting, and correlate with other browser artifacts to establish comprehensive activity timelines.
---
# Chrome Form History
> Source: https://kb.binalyze.ai/air/features/acquisition/supported-evidence/macos-collections-detail/chrome-form-history.html
## Overview
**Evidence:** Chrome Form History
**Description:** Collect Chrome Form History
**Category:** Applications
**Platform:** macos
**Short Name:** cfh
**Is Parsed:** Yes
**Sent to Investigation Hub:** Yes
**Collect File(s):** No
## Background
Browser form history stores previously entered form data including search queries, usernames, and other input fields. This data reveals user search patterns, account information, and potential data leakage through autofill.
## Data Collected
This collector gathers structured data about chrome form history.
### Chrome Form History Data
| Field | Description | Example |
|-------|-------------|---------|
| `UserName` | User Name | Example value |
| `BrowserName` | Browser Name | Example value |
| `Name` | Name | Example value |
| `Value` | Value | Example value |
| `ValueLower` | Value Lower | Example value |
| `Count` | Count | 123 |
| `Profile` | Profile | Example value |
| `Path` | Path | Example value |
| `DateCreated` | Date Created | 2023-10-15 14:30:25+03:00 |
| `DateLastUsed` | Date Last Used | 2023-10-15 14:30:25+03:00 |
## Collection Method
This collector queries the browser's form history database to extract saved form field data, search queries, and associated timestamps.
## Forensic Value
Form history exposes reconnaissance activities, credential enumeration attempts, search queries revealing attacker intent, and potentially sensitive information entered into web forms. Analysts can identify data exfiltration, account compromise indicators, and targeted search patterns.
---
# Chrome Local Storage
> Source: https://kb.binalyze.ai/air/features/acquisition/supported-evidence/macos-collections-detail/chrome-local-storage.html
## Overview
**Evidence:** Chrome Local Storage
**Description:** Collect Chrome Local Storage
**Category:** Applications
**Platform:** macos
**Short Name:** chrls
**Is Parsed:** Yes
**Sent to Investigation Hub:** Yes
**Collect File(s):** No
## Background
Browser local storage contains persistent key-value data stored by websites. This data includes user preferences, session state, cached data, and potentially authentication tokens or sensitive information.
## Data Collected
This collector gathers structured data about chrome local storage.
### Chrome Local Storage Data
| Field | Description | Example |
|-------|-------------|---------|
| `UserName` | User Name | Example value |
| `ProfileName` | Profile Name | Example value |
| `BrowserName` | Browser Name | Example value |
| `Key` | Key | Example value |
| `Value` | Value | Example value |
| `Path` | Path | Example value |
## Collection Method
This collector extracts local storage data from browser storage databases and files.
## Forensic Value
Local storage analysis reveals stored credentials, session tokens, tracking identifiers, and application state that can indicate compromised accounts, persistent tracking, or malicious website activity. Analysts can identify credential theft, session hijacking, and data exfiltration attempts.
---
# Chrome Login Data
> Source: https://kb.binalyze.ai/air/features/acquisition/supported-evidence/macos-collections-detail/chrome-login-data.html
## Overview
**Evidence:** Chrome Login Data
**Description:** Collect Chrome Login Data
**Category:** Applications
**Platform:** macos
**Short Name:** chrlgd
**Is Parsed:** Yes
**Sent to Investigation Hub:** Yes
**Collect File(s):** No
## Background
Browser login data stores saved passwords and credential information. This data is critical for identifying stored credentials, password reuse patterns, and potential credential theft targets.
## Data Collected
This collector gathers structured data about chrome login data.
### Chrome Login Data Data
| Field | Description | Example |
|-------|-------------|---------|
| `ID` | ID | 123 |
| `UserName` | User Name | Example value |
| `BrowserName` | Browser Name | Example value |
| `OriginURL` | Origin URL | Example value |
| `SignonRealm` | Signon Realm | Example value |
| `BlacklistedByUser` | Blacklisted By User | 123 |
| `Scheme` | Scheme | Example value |
| `PasswordType` | Password Type | Example value |
| `TimesUsed` | Times Used | 123 |
| `Profile` | Profile | Example value |
| `Path` | Path | Example value |
| `DateCreated` | Date Created | 2023-10-15 14:30:25+03:00 |
| `DateLastUsed` | Date Last Used | 2023-10-15 14:30:25+03:00 |
## Collection Method
This collector extracts saved credentials from the browser's Login Data database, including URLs, usernames, and encrypted passwords.
## Forensic Value
Login data analysis reveals stored credentials, password reuse across services, targeted accounts, and potential credential harvesting. Investigators can identify compromised accounts, credential theft attempts, and unauthorized access to saved credentials by malware or attackers.
---
# Chrome Sessions
> Source: https://kb.binalyze.ai/air/features/acquisition/supported-evidence/macos-collections-detail/chrome-sessions.html
## Overview
**Evidence:** Chrome Sessions
**Description:** Collect Chrome Sessions
**Category:** Applications
**Platform:** macos
**Short Name:** chrss
**Is Parsed:** Yes
**Sent to Investigation Hub:** Yes
**Collect File(s):** No
## Background
Browser sessions maintain active tab state, cookies, and authentication context. This data reveals currently active user sessions, open websites, and authenticated connections at the time of collection.
## Data Collected
This collector gathers structured data about chrome sessions.
### Chrome Sessions Data
| Field | Description | Example |
|-------|-------------|---------|
| `ID` | ID | 123 |
| `WindowID` | Window ID | 123 |
| `Active` | Active | true |
| `Url` | Url | Example value |
| `Title` | Title | Example value |
| `Deleted` | Deleted | true |
| `Group` | Group | Example value |
| `History` | History | [] |
| `BrowserName` | Browser Name | Example value |
## Collection Method
This collector captures browser session data including active tabs, session cookies, and authentication state.
## Forensic Value
Session analysis identifies active compromises, authenticated sessions to malicious sites, concurrent suspicious activities, and real-time indicators of ongoing attacks. Analysts can detect active C2 connections, authenticated malware communications, and live attacker sessions.
---
# Chrome Thumbnails
> Source: https://kb.binalyze.ai/air/features/acquisition/supported-evidence/macos-collections-detail/chrome-thumbnails.html
## Overview
**Evidence:** Chrome Thumbnails
**Description:** Collect Chrome Thumbnails
**Category:** Applications
**Platform:** macos
**Short Name:** cthmb
**Is Parsed:** Yes
**Sent to Investigation Hub:** Yes
**Collect File(s):** No
## Background
Browser thumbnails are cached preview images of visited websites. This visual data supplements browsing history by providing screenshots of accessed pages, useful for recovering deleted history and identifying visited content.
## Data Collected
This collector gathers structured data about chrome thumbnails.
### Chrome Thumbnails Data
| Field | Description | Example |
|-------|-------------|---------|
| `UserName` | User Name | Example value |
| `Browser` | Browser | Example value |
| `URL` | URL | Example value |
| `URLRank` | URL Rank | 123 |
| `Title` | Title | Example value |
| `Profile` | Profile | Example value |
| `Path` | Path | Example value |
## Collection Method
This collector extracts cached thumbnail images from browser storage.
## Forensic Value
Thumbnail analysis provides visual evidence of visited websites, can recover evidence after history deletion, and helps identify phishing pages, malicious sites, or sensitive internal resources accessed by users through visual inspection.
---
# Chrome User Profiles
> Source: https://kb.binalyze.ai/air/features/acquisition/supported-evidence/macos-collections-detail/chrome-user-profiles.html
## Overview
**Evidence:** Chrome User Profiles
**Description:** Collect Chrome User Profiles
**Category:** Applications
**Platform:** macos
**Short Name:** cprfls
**Is Parsed:** Yes
**Sent to Investigation Hub:** Yes
**Collect File(s):** No
## Background
Browser user profiles store per-user browser configurations, extensions, settings, and data segregation. This data reveals multiple user accounts, profile switching patterns, and user-specific browsing behavior.
## Data Collected
This collector gathers structured data about chrome user profiles.
### Chrome User Profiles Data
| Field | Description | Example |
|-------|-------------|---------|
| `EndpointUserName` | Endpoint User Name | Example value |
| `Profile` | Profile | Example value |
| `ProfileUserName` | Profile User Name | Example value |
| `BrowserName` | Browser Name | Example value |
| `BackgroundApps` | Background Apps | true |
| `GoogleAccountGivenName` | Google Account Given Name | Example value |
| `GoogleAccountID` | Google Account ID | Example value |
| `GoogleAccountName` | Google Account Name | Example value |
| `PictureFileName` | Picture File Name | Example value |
| `LastDownloadedPictureURL` | Last Downloaded Picture URL | Example value |
| `HostedDomain` | Hosted Domain | Example value |
| `IsConsentedPrimaryAccount` | Is Consented Primary Account | true |
| `IsEphemeral` | Is Ephemeral | true |
## Collection Method
This collector enumerates browser user profiles and extracts profile metadata, configurations, and associated data paths.
## Forensic Value
Profile analysis identifies multiple user accounts, profile-specific extensions and configurations, shared device usage patterns, and potential privilege escalation or lateral movement using different browser profiles. Investigators can correlate activity across profiles and identify unauthorized profile creation.
---
# Chrome Web Storage
> Source: https://kb.binalyze.ai/air/features/acquisition/supported-evidence/macos-collections-detail/chrome-web-storage.html
## Overview
**Evidence:** Chrome Web Storage
**Description:** Collect Chrome Web Storage
**Category:** Applications
**Platform:** macos
**Short Name:** cws
**Is Parsed:** Yes
**Sent to Investigation Hub:** Yes
**Collect File(s):** No
## Background
Browser web storage includes both local and session storage used by websites to store client-side data. This data can contain application state, user preferences, cached content, and potentially sensitive information.
## Data Collected
This collector gathers structured data about chrome web storage.
### Chrome Web Storage Data
| Field | Description | Example |
|-------|-------------|---------|
| `UserName` | User Name | Example value |
| `ProfileName` | Profile Name | Example value |
| `BrowserName` | Browser Name | Example value |
| `Key` | Key | Example value |
| `Value` | Value | Example value |
| `Path` | Path | Example value |
## Collection Method
This collector extracts web storage data from browser storage locations including local storage and session storage.
## Forensic Value
Web storage analysis reveals cached application data, stored credentials, session information, and potential data exfiltration staging. Analysts can identify malicious website activity, stored authentication tokens, tracking identifiers, and sensitive data cached by compromised web applications.
---
# Command Line Activity
> Source: https://kb.binalyze.ai/air/features/acquisition/supported-evidence/macos-collections-detail/command-line-activity.html
## Overview
**Evidence:** Command Line Activity
**Description:** Filter command line activity run with elevated privileges
**Category:** System
**Platform:** macos
**Short Name:** cla
**Is Parsed:** Yes
**Sent to Investigation Hub:** Yes
**Collect File(s):** No
## Background
The sudo command allows authorized users to execute commands with elevated privileges. Unified logs capture sudo invocations including the user, target user, working directory, and command executed. This predicate filters for privilege escalation to root, excluding routine system operations.
## Data Collected
This collector gathers structured data about command line activity.
## Collection Method
This collector uses the macOS 'log' command with predicate-based filtering to extract sudo process events where users elevate to root privileges over the last 3 days. Log entries are parsed from JSON format and stored in the unified_logs table with PredicateType='Command Line Activity'.
## Forensic Value
Sudo logs are critical for investigating privilege escalation, unauthorized administrative actions, malicious command execution, and insider threats. They reveal what commands were run with elevated privileges, by whom, and when, helping identify suspicious administrative activities and policy violations.
---
# Crashes
> Source: https://kb.binalyze.ai/air/features/acquisition/supported-evidence/macos-collections-detail/crashes.html
## Overview
**Evidence:** Crashes
**Description:** Collect Crashes
**Category:** System
**Platform:** macos
**Short Name:** crsh
**Is Parsed:** Yes
**Sent to Investigation Hub:** Yes
**Collect File(s):** No
## Background
macOS automatically generates crash reports when applications or system processes terminate unexpectedly. These reports are stored in ~/Library/Logs/DiagnosticReports and /Library/Logs/DiagnosticReports, containing detailed information about the crash including stack traces, exception codes, register states, and responsible processes. Crash reports provide critical forensic evidence for understanding system stability, identifying malicious behavior, and detecting exploitation attempts.
## Data Collected
This collector gathers structured data about crashes.
### Crashes Data
| Field | Description | Example |
|-------|-------------|---------|
| `Type` | Type | Example value |
| `PID` | PID | 123 |
| `Path` | Path | Example value |
| `CrashPath` | Crash Path | Example value |
| `Identifier` | Identifier | Example value |
| `Version` | Version | 123 |
| `Parent` | Parent | 123 |
| `Responsible` | Responsible | Example value |
| `UID` | UID | 123 |
| `DateTime` | Date Time | 2023-10-15 14:30:25+03:00 |
| `CrashedThread` | Crashed Thread | 123 |
| `StackTrace` | Stack Trace | Example value |
| `ExceptionType` | Exception Type | Example value |
| `ExceptionCodes` | Exception Codes | Example value |
| `ExceptionNotes` | Exception Notes | Example value |
| `Registers` | Registers | Example value |
## Collection Method
This collector uses osquery to query the crashes table, which parses crash report files from diagnostic report directories. It joins crash data with user information to provide comprehensive crash analysis including process details, crash paths, timestamps, exception types, stack traces, and registers. The collector captures both user-level and system-level crashes.
## Forensic Value
Crash reports are essential for detecting exploitation attempts, identifying unstable or malicious software, understanding system reliability issues, and reconstructing incident timelines. Stack traces can reveal code execution paths and potential vulnerabilities. Exception codes and types help identify specific failure conditions. This evidence is particularly valuable for malware analysis, exploit detection, and investigating system compromises or denial-of-service conditions.
---
# Cron Jobs
> Source: https://kb.binalyze.ai/air/features/acquisition/supported-evidence/macos-collections-detail/cron-jobs.html
## Overview
**Evidence:** Cron Jobs
**Description:** Collect Cron Jobs
**Category:** System
**Platform:** macos
**Short Name:** cronj
**Is Parsed:** Yes
**Sent to Investigation Hub:** Yes
**Collect File(s):** No
## Background
This collector gathers cron jobs information from the macOS system. This data is essential for understanding system activity, detecting persistence, and investigating scheduled task misuse.
## Data Collected
This collector gathers structured data about cron jobs.
### Cron Jobs Data
| Field | Description | Example |
|-------|-------------|---------|
| `Event` | Event | Example value |
| `Minute` | Minute | Example value |
| `Hour` | Hour | Example value |
| `DayOfMonth` | Day Of Month | Example value |
| `Month` | Month | Example value |
| `DayOfWeek` | Day Of Week | Example value |
| `Command` | Command | Example value |
| `Path` | Path | Example value |
## Collection Method
This collector queries the `crontab` table via osquery; if a `path` is present for an entry, the underlying file is collected.
## Forensic Value
This evidence is crucial for forensic investigations as it reveals scheduled tasks that can indicate persistence mechanisms, data exfiltration schedules, or malicious automation.
---
# Default Browser
> Source: https://kb.binalyze.ai/air/features/acquisition/supported-evidence/macos-collections-detail/default-browser.html
## Overview
**Evidence:** Default Browser
**Description:** Collect Default Browser
**Category:** Applications
**Platform:** macos
**Short Name:** dbrws
**Is Parsed:** Yes
**Sent to Investigation Hub:** Yes
**Collect File(s):** No
## Background
The default browser setting reveals user preferences and potential attack surfaces. Malware and persistence mechanisms may change the default browser to hijack web traffic, inject malicious extensions, or redirect users to phishing sites. Tracking changes to this setting helps detect browser hijacking and unauthorized modifications.
## Data Collected
This collector gathers structured data about default browser.
### Default Browser Data
| Field | Description | Example |
|-------|-------------|---------|
| `DefaultBrowser` | Default Browser | Example value |
## Collection Method
This collector queries the operating system's default application registry to identify which browser is configured as the default handler for HTTP/HTTPS protocols.
## Forensic Value
Default browser configuration is crucial for understanding user behavior patterns and detecting browser-based attacks. Unexpected changes may indicate malware activity, persistence mechanisms, or social engineering attacks. This evidence helps establish timelines for browser-related compromise and identify attack vectors.
---
# Dependency Manifests
> Source: https://kb.binalyze.ai/air/features/acquisition/supported-evidence/macos-collections-detail/dependency-manifests.html
## Overview
**Evidence:** Dependency Manifests
**Description:** Collect developer dependency manifests
**Category:** Applications
**Platform:** macos
**Short Name:** depman
**Is Parsed:** Yes
**Sent to Investigation Hub:** Yes
**Collect File(s):** No
## Background
Developer dependency manifests and lockfiles define declared and resolved third-party packages used by software projects. Covered formats include package.json, package-lock.json, yarn.lock, pnpm-lock.yaml, bun.lock, go.mod, requirements.txt, Pipfile.lock, pyproject.toml, poetry.lock, Cargo.toml, pom.xml, composer.json, Gemfile, Gemfile.lock, Gradle files, and NuGet project files. These files are primary targets for supply chain attacks including dependency confusion, typosquatting, and known-malicious package injection.
## Data Collected
This collector gathers structured data about declared and resolved dependencies, including package names, version constraints, resolved versions, source registries, integrity hashes, direct or transitive status, and whether a lock file is present. Results are recorded in `dependency_manifests`.
## Collection Method
This collector scans user home directories and common development paths for dependency manifest and lock files. Each file is parsed to extract package metadata. Directories such as node_modules, vendor, and .git are skipped for performance.
## Forensic Value
Dependency manifest data is critical for detecting supply chain compromises. Investigators can identify known-malicious packages, typosquatted dependencies, dependency confusion attacks, and missing lock files that indicate insecure dependency resolution.
---
# Device Battery Percentage
> Source: https://kb.binalyze.ai/air/features/acquisition/supported-evidence/macos-collections-detail/device-battery-percentage.html
## Overview
**Evidence:** Device Battery Percentage
**Description:** Collect Device Battery Percentage
**Category:** System
**Platform:** macos
**Short Name:** devbat
**Is Parsed:** Yes
**Sent to Investigation Hub:** Yes
**Collect File(s):** No
## Background
The KnowledgeC battery percentage stream records the device battery charge level over time, producing a fine-grained power timeline alongside other activity streams.
## Data Collected
This collector gathers structured data about device battery charge level and timing. Results are recorded in `device_battery`.
## Collection Method
This collector reads KnowledgeC databases under user profiles and records battery percentage events into `device_battery`.
## Forensic Value
Battery level trends help establish whether the device was actively used or idle during an incident window and corroborate other timeline artifacts.
---
# Device Locked State
> Source: https://kb.binalyze.ai/air/features/acquisition/supported-evidence/macos-collections-detail/device-locked-state.html
## Overview
**Evidence:** Device Locked State
**Description:** Collect Device Locked State
**Category:** System
**Platform:** macos
**Short Name:** devlock
**Is Parsed:** Yes
**Sent to Investigation Hub:** Yes
**Collect File(s):** No
## Background
The KnowledgeC device locked stream records when the device screen was locked or unlocked over time, building a timeline of physical presence at the machine.
## Data Collected
This collector gathers structured data about device lock and unlock state and timing. Results are recorded in `device_locked`.
## Collection Method
This collector reads KnowledgeC databases under user profiles and records device lock state events into `device_locked`.
## Forensic Value
This evidence shows when a user was physically present and interacting with the device, corroborating or contradicting other activity during an incident window.
---
# Device Plugged In State
> Source: https://kb.binalyze.ai/air/features/acquisition/supported-evidence/macos-collections-detail/device-plugged-in-state.html
## Overview
**Evidence:** Device Plugged In State
**Description:** Collect Device Plugged In State
**Category:** System
**Platform:** macos
**Short Name:** devplug
**Is Parsed:** Yes
**Sent to Investigation Hub:** Yes
**Collect File(s):** No
## Background
The KnowledgeC plugged-in stream records when the device was connected to or disconnected from power, building a charging timeline that reflects physical location and usage habits.
## Data Collected
This collector gathers structured data about whether the device was plugged into power and the associated timing. Results are recorded in `device_plugged_in`.
## Collection Method
This collector reads KnowledgeC databases under user profiles and records device power-state events into `device_plugged_in`.
## Forensic Value
Power state transitions correlate with the user being at a desk or travelling, helping place the device and user on a timeline.
---
# DHCP Settings
> Source: https://kb.binalyze.ai/air/features/acquisition/supported-evidence/macos-collections-detail/dhcp-settings.html
## Overview
**Evidence:** DHCP Settings
**Description:** Collect DHCP (Dynamic Host Configuration Protocol) Settings
**Category:** Network
**Platform:** macos
**Short Name:** dhcpset
**Is Parsed:** Yes
**Sent to Investigation Hub:** Yes
**Collect File(s):** No
## Background
DHCP client leases record IP configuration and router details per interface. This data is essential for reconstructing network assignments and connectivity history.
## Data Collected
This collector gathers structured data about dhcp settings.
## Collection Method
This collector parses plist leases under `/private/var/db/dhcpclient/leases` and records them into `dhcp_settings`.
## Forensic Value
This evidence is crucial for forensic investigations as it links devices to networks and IP addresses over time.
---
# Discord Desktop Cache
> Source: https://kb.binalyze.ai/air/features/acquisition/supported-evidence/macos-collections-detail/discord-desktop-cache.html
## Overview
**Evidence:** Discord Desktop Cache
**Description:** Collect Discord Desktop Cache
**Category:** Applications
**Platform:** macos
**Short Name:** dscrd
**Is Parsed:** No
**Sent to Investigation Hub:** No
**Collect File(s):** Yes
## Background
Discord is a communication platform with desktop applications that cache messages, media, and other content locally. The cache contains recent communications, shared files, and user interactions stored in the Application Support directory.
## Data Collected
This collector gathers structured data about discord desktop cache.
## Collection Method
This collector gathers Discord desktop cache data from user-specific Library/Application Support/discord directories, which contains cached messages, images, and communication content.
## Forensic Value
Discord cache is valuable for investigating communications, file sharing, malware distribution through Discord, data leaks, and coordinated attacks. It can reveal conversations, shared malicious files, command and control communications, and threat actor coordination.
---
# Disk Encryption
> Source: https://kb.binalyze.ai/air/features/acquisition/supported-evidence/macos-collections-detail/disk-encryption.html
## Overview
**Evidence:** Disk Encryption
**Description:** Collect Disk Encryption status
**Category:** DiskFilesystem
**Platform:** macos
**Short Name:** diskenc
**Is Parsed:** Yes
**Sent to Investigation Hub:** Yes
**Collect File(s):** No
## Background
Disk encryption is a fundamental security control that protects data at rest. FileVault on macOS provides full-disk encryption using XTS-AES-128 encryption. Understanding encryption status is essential for compliance verification, security policy enforcement, and detecting potential data protection gaps.
## Data Collected
This collector gathers structured data about disk encryption.
### Disk Encryption Data
| Field | Description | Example |
|-------|-------------|---------|
| `Name` | Name | Example value |
| `UUID` | UUID | Example value |
| `Encrypted` | Encrypted | 123 |
| `Type` | Type | Example value |
| `EncryptionStatus` | Encryption Status | Example value |
| `UID` | UID | Example value |
| `UserUID` | User UID | Example value |
| `FileVaultStatus` | File Vault Status | Example value |
## Collection Method
This collector queries the disk_encryption table via osquery to retrieve encryption status for all volumes, including FileVault status, encryption types, and associated user credentials.
## Forensic Value
Disk encryption status reveals security posture and potential data exposure risks. Unencrypted volumes may indicate policy violations, attacker attempts to bypass security controls, or system misconfigurations. This evidence helps assess data protection compliance and identify unauthorized disk access.
---
# DMG File Opened
> Source: https://kb.binalyze.ai/air/features/acquisition/supported-evidence/macos-collections-detail/dmg-file-opened.html
## Overview
**Evidence:** DMG File Opened
**Description:** Collects previously opened DMG files.
**Category:** DiskFilesystem
**Platform:** macos
**Short Name:** dmgf
**Is Parsed:** Yes
**Sent to Investigation Hub:** Yes
**Collect File(s):** No
## Background
DMG (disk image) files are commonly used on macOS for software distribution and data storage. When a DMG file is opened, macOS stores extended attributes (xattrs) including fsck information and recent checksums on the file. These attributes provide forensic evidence of DMG file access, helping investigators identify software installations, data transfers, or malicious payloads delivered via DMG files.
## Data Collected
This collector gathers structured data about dmg file opened.
### DMG File Opened Data
| Field | Description | Example |
|-------|-------------|---------|
| `ID` | ID | 123 |
| `Path` | Path | Example value |
| `Username` | Username | Example value |
| `Fsck` | Fsck | Example value |
| `RecentCksumDate` | Recent Cksum Date | 2023-10-15 14:30:25+03:00 |
| `RecentCksumType` | Recent Cksum Type | Example value |
| `RecentCksum` | Recent Cksum | Example value |
## Collection Method
This collector scans the file system for DMG files and extracts extended attributes (com.apple.diskimages.fsck and com.apple.diskimages.recentcksum) to identify which DMG files were previously opened. It parses the recentcksum attribute to extract timestamps, checksum types, and checksum values, providing a timeline of DMG file access.
## Forensic Value
DMG file access history is valuable for identifying software installations, detecting unauthorized application deployments, tracking malware delivery mechanisms, and establishing file access timelines. The checksum information can be used to verify file integrity and correlate DMG files across multiple systems. This evidence is particularly useful for detecting supply chain attacks, insider threats, and unauthorized software installations.
---
# DNS Resolvers
> Source: https://kb.binalyze.ai/air/features/acquisition/supported-evidence/macos-collections-detail/dns-resolvers.html
## Overview
**Evidence:** DNS Resolvers
**Description:** Collect DNS Resolvers
**Category:** Network
**Platform:** macos
**Short Name:** dnsr
**Is Parsed:** Yes
**Sent to Investigation Hub:** Yes
**Collect File(s):** No
## Background
This collector gathers DNS resolver configuration from macOS. This data is essential for understanding name resolution paths, detecting DNS-based attacks, and investigating connectivity issues.
## Data Collected
This collector gathers structured data about dns resolvers.
### DNS Resolvers Data
| Field | Description | Example |
|-------|-------------|---------|
| `AddressTypeIndex` | Address Type Index | 123 |
| `AddressType` | Address Type | Example value |
| `Address` | Address | Example value |
| `NetMask` | Net Mask | Example value |
| `Options` | Options | 123 |
## Collection Method
This collector queries the `dns_resolvers` table via osquery and records results into the `dns_resolvers` table.
## Forensic Value
This evidence is crucial for forensic investigations as it reveals DNS servers, netmask/search configuration, and options that can indicate misconfigurations or malicious redirection.
---
# Dock Items
> Source: https://kb.binalyze.ai/air/features/acquisition/supported-evidence/macos-collections-detail/dock-items.html
## Overview
**Evidence:** Dock Items
**Description:** Collect Dock Items
**Category:** System
**Platform:** macos
**Short Name:** dckitms
**Is Parsed:** Yes
**Sent to Investigation Hub:** Yes
**Collect File(s):** No
## Background
Dock preferences record persistent apps, folders, and recent items displayed in the macOS Dock. This data is essential for understanding user activity and potential persistence via Dock items.
## Data Collected
This collector gathers structured data about dock items.
### Dock Items Data
| Field | Description | Example |
|-------|-------------|---------|
| `GUID` | GUID | 123 |
| `User` | User | Example value |
| `FileLabel` | File Label | Example value |
| `ParentModified` | Parent Modified | 2023-10-15 14:30:25+03:00 |
| `FileModified` | File Modified | 2023-10-15 14:30:25+03:00 |
| `RecentlyUsed` | Recently Used | true |
| `FileType` | File Type | 123 |
| `FileTypeName` | File Type Name | Example value |
| `FilePath` | File Path | Example value |
| `Source` | Source | Example value |
## Collection Method
This collector reads users' `com.apple.dock.plist` files, decodes entries, and records items into the `dock_items` table.
## Forensic Value
This evidence is crucial for forensic investigations as it reveals recently used and pinned applications, supporting timeline and behavior analysis.
---
# Docker Changes
> Source: https://kb.binalyze.ai/air/features/acquisition/supported-evidence/macos-collections-detail/docker-changes.html
## Overview
**Evidence:** Docker Changes
**Description:** Collect Docker Changes
**Category:** Applications
**Platform:** macos
**Short Name:** dockchanges
**Is Parsed:** Yes
**Sent to Investigation Hub:** Yes
**Collect File(s):** No
## Background
Docker filesystem changes track modifications made to container filesystems since container creation. These changes reveal files added, modified, or deleted, essential for detecting malware installation, data tampering, or unauthorized access.
## Data Collected
This collector gathers structured data about docker changes.
## Collection Method
This collector queries the Docker daemon via Docker Engine API to retrieve filesystem changes for each container. It lists file paths and change types (added, modified, deleted) since the container was created from its base image.
## Forensic Value
Filesystem changes expose malware droppers, backdoor installations, log tampering, credential theft, or data exfiltration staging. Investigators can identify suspicious file modifications, detect persistence mechanisms, and trace attacker activities within compromised containers.
---
# Docker Container Logs
> Source: https://kb.binalyze.ai/air/features/acquisition/supported-evidence/macos-collections-detail/docker-container-logs.html
## Overview
**Evidence:** Docker Container Logs
**Description:** Collect Docker Container Logs
**Category:** Applications
**Platform:** macos
**Short Name:** dcl
**Is Parsed:** Yes
**Sent to Investigation Hub:** Yes
**Collect File(s):** No
## Background
Docker container logs capture stdout/stderr output from containerized applications. Log data provides runtime behavior, error messages, access patterns, and potential indicators of compromise within container workloads.
## Data Collected
This collector gathers structured data about docker container logs.
## Collection Method
This collector queries the Docker daemon via Docker Engine API to retrieve logs from each container. It captures stdout and stderr output with timestamps for forensic analysis of application behavior and security events.
## Forensic Value
Container logs reveal application errors, authentication attempts, command execution, data access patterns, and exploitation attempts. Analyzing logs helps identify suspicious activities, trace attacker actions, detect data exfiltration, and reconstruct incident timelines in containerized environments.
---
# Docker Containers
> Source: https://kb.binalyze.ai/air/features/acquisition/supported-evidence/macos-collections-detail/docker-containers.html
## Overview
**Evidence:** Docker Containers
**Description:** Collect Docker Containers
**Category:** Applications
**Platform:** macos
**Short Name:** dockcontainers
**Is Parsed:** Yes
**Sent to Investigation Hub:** Yes
**Collect File(s):** No
## Background
Docker containers are isolated runtime environments that package applications and their dependencies. Container metadata reveals running services, exposed ports, mounted volumes, and runtime configurations, essential for identifying malicious containers, unauthorized deployments, and security misconfigurations.
## Data Collected
This collector gathers structured data about docker containers.
## Collection Method
This collector queries the Docker daemon via Docker Engine API to enumerate all containers (running and stopped). It extracts container ID, name, image, state, created time, ports, mounts, network settings, labels, and environment variables for forensic analysis.
## Forensic Value
Container data helps investigators identify suspicious containers, detect cryptominers, backdoors, or data exfiltration tools running in containerized environments. Configuration details reveal privilege escalation, volume mounts to sensitive host paths, and network exposure that may indicate compromise or policy violations.
---
# Docker Image History
> Source: https://kb.binalyze.ai/air/features/acquisition/supported-evidence/macos-collections-detail/docker-image-history.html
## Overview
**Evidence:** Docker Image History
**Description:** Collect Docker Image History
**Category:** Applications
**Platform:** macos
**Short Name:** dockimagehist
**Is Parsed:** Yes
**Sent to Investigation Hub:** Yes
**Collect File(s):** No
## Background
Docker image history shows the layered build steps and commands used to construct an image. This forensic data reveals how an image was built, what software was installed, files added, and configuration changes made during image creation.
## Data Collected
This collector gathers structured data about docker image history.
## Collection Method
This collector queries the Docker daemon via Docker Engine API to retrieve the build history of each image. It extracts layer ID, created time, created by command, size, and tags for each layer in the image's history.
## Forensic Value
Image history exposes malicious commands embedded in image layers, such as backdoor installations, credential theft scripts, or cryptominer deployments. Investigators can identify suspicious layers, trace image lineage, and detect tampering or supply chain attacks in containerized environments.
---
# Docker Images
> Source: https://kb.binalyze.ai/air/features/acquisition/supported-evidence/macos-collections-detail/docker-images.html
## Overview
**Evidence:** Docker Images
**Description:** Collect Docker Images
**Category:** Applications
**Platform:** macos
**Short Name:** dockimages
**Is Parsed:** Yes
**Sent to Investigation Hub:** Yes
**Collect File(s):** No
## Background
Docker images are templates used to create containers, consisting of layered filesystems and metadata. Image inventories reveal deployed applications, base operating systems, vulnerabilities, and potentially malicious or unauthorized images in the environment.
## Data Collected
This collector gathers structured data about docker images.
## Collection Method
This collector queries the Docker daemon via Docker Engine API to list all images (tagged and untagged). It extracts image ID, repository tags, size, creation time, and layer information for each image stored locally.
## Forensic Value
Image data helps identify vulnerable base images, unauthorized images pulled from untrusted registries, backdoored images, or bloated images that may hide malicious payloads. Tracking image provenance and tags assists in supply chain security investigations and compliance audits.
---
# Docker Info
> Source: https://kb.binalyze.ai/air/features/acquisition/supported-evidence/macos-collections-detail/docker-info.html
## Overview
**Evidence:** Docker Info
**Description:** Collect Docker Info
**Category:** Applications
**Platform:** macos
**Short Name:** dockinfo
**Is Parsed:** Yes
**Sent to Investigation Hub:** Yes
**Collect File(s):** No
## Background
Docker system information provides configuration details about the Docker daemon including storage driver, kernel version, operating system, total containers/images, and resource limits. This metadata is crucial for understanding the Docker environment configuration and detecting anomalies.
## Data Collected
This collector gathers structured data about docker info.
## Collection Method
This collector queries the Docker daemon via Docker Engine API to retrieve system-wide information including version, storage driver, logging driver, plugins, security options, and resource constraints.
## Forensic Value
System-level Docker configuration reveals potential security weaknesses such as insecure registries, disabled security features, or resource exhaustion. This data helps investigators understand the Docker deployment model and identify misconfigurations that attackers may exploit.
---
# Docker Logs
> Source: https://kb.binalyze.ai/air/features/acquisition/supported-evidence/macos-collections-detail/docker-logs.html
## Overview
**Evidence:** Docker Logs
**Description:** Collect Docker Logs on Filesystem
**Category:** Applications
**Platform:** macos
**Short Name:** dckl
**Is Parsed:** No
**Sent to Investigation Hub:** No
**Collect File(s):** Yes
## Background
Docker Desktop for Mac stores logs for both the VM and host components within user Library containers. These logs capture Docker daemon activities, container operations, networking events, and system interactions.
## Data Collected
This collector gathers structured data about docker logs.
## Collection Method
This collector gathers Docker logs from user-specific Library/Containers directories, including both VM logs (Linux VM running containers) and host logs (Docker Desktop application on macOS).
## Forensic Value
Docker logs are valuable for investigating containerized application activities, suspicious container deployments, privilege escalation attempts, network communications, and understanding container-based attacks or data exfiltration.
---
# Docker Networks
> Source: https://kb.binalyze.ai/air/features/acquisition/supported-evidence/macos-collections-detail/docker-networks.html
## Overview
**Evidence:** Docker Networks
**Description:** Collect Docker Networks
**Category:** Applications
**Platform:** macos
**Short Name:** docknetworks
**Is Parsed:** Yes
**Sent to Investigation Hub:** Yes
**Collect File(s):** No
## Background
Docker networks define how containers communicate with each other and external systems. Network configuration reveals bridge networks, overlay networks, host networking modes, and IP address allocations critical for understanding container connectivity and isolation.
## Data Collected
This collector gathers structured data about docker networks.
## Collection Method
This collector queries the Docker daemon via Docker Engine API to enumerate all Docker networks. It extracts network ID, name, driver type, scope, subnet configuration, gateway, connected containers, and network options.
## Forensic Value
Network data identifies containers exposed to the host network (potential privilege escalation), custom networks used for lateral movement, or misconfigured network isolation. Analyzing network attachments helps map container communication paths and detect unauthorized network access or data exfiltration channels.
---
# Docker Processes
> Source: https://kb.binalyze.ai/air/features/acquisition/supported-evidence/macos-collections-detail/docker-processes.html
## Overview
**Evidence:** Docker Processes
**Description:** Collect Docker Processes
**Category:** Applications
**Platform:** macos
**Short Name:** docktops
**Is Parsed:** Yes
**Sent to Investigation Hub:** Yes
**Collect File(s):** No
## Background
Docker container processes show which processes are running inside each container. This data reveals the actual workload, potential process injection, privilege escalation, and unauthorized process execution within containerized environments.
## Data Collected
This collector gathers structured data about docker processes.
## Collection Method
This collector queries the Docker daemon via Docker Engine API to execute 'top' command for each container. It lists processes, PIDs, user, CPU usage, memory usage, and command line for processes running in containers.
## Forensic Value
Process data within containers identifies cryptominers, reverse shells, suspicious child processes, or privilege escalation attempts. Comparing running processes against expected workload helps detect compromised containers, malware, or unauthorized access to containerized applications.
---
# Docker Volumes
> Source: https://kb.binalyze.ai/air/features/acquisition/supported-evidence/macos-collections-detail/docker-volumes.html
## Overview
**Evidence:** Docker Volumes
**Description:** Collect Docker Volumes
**Category:** Applications
**Platform:** macos
**Short Name:** dockvolumes
**Is Parsed:** Yes
**Sent to Investigation Hub:** Yes
**Collect File(s):** No
## Background
Docker volumes provide persistent storage for containers, allowing data to persist beyond container lifecycle. Volume metadata reveals mount paths, drivers, and which containers have access to shared data, critical for data exfiltration and persistence investigations.
## Data Collected
This collector gathers structured data about docker volumes.
## Collection Method
This collector queries the Docker daemon via Docker Engine API to list all volumes. It extracts volume name, driver, mount point, labels, and scope information for each volume in the system.
## Forensic Value
Volume data exposes sensitive data storage locations, shared volumes between containers (lateral movement risk), and host path mounts that may grant container access to sensitive host files. Investigators can identify data staging locations, credential stores, or malicious persistence mechanisms using volumes.
---
# Document Revisions
> Source: https://kb.binalyze.ai/air/features/acquisition/supported-evidence/macos-collections-detail/document-revisions.html
## Overview
**Evidence:** Document Revisions
**Description:** Collect Document Revisions
**Category:** System
**Platform:** macos
**Short Name:** drvs
**Is Parsed:** Yes
**Sent to Investigation Hub:** Yes
**Collect File(s):** No
## Background
macOS DocumentRevisions-V100 stores prior versions of documents for autosave. This data is essential for recovering prior content and tracking edits over time.
## Data Collected
This collector gathers structured data about document revisions.
### Document Revisions Data
| Field | Description | Example |
|-------|-------------|---------|
| `FileINode` | File I Node | 123 |
| `StorageID` | Storage ID | 123 |
| `FilePath` | File Path | Example value |
| `ExistsOnDisk` | Exists On Disk | true |
| `FileLastSeen` | File Last Seen | 2023-10-15 14:30:25+03:00 |
| `GenerationAdded` | Generation Added | 2023-10-15 14:30:25+03:00 |
| `GenerationPath` | Generation Path | Example value |
| `Source` | Source | Example value |
## Collection Method
This collector copies the DocumentRevisions database and queries for files and generations, recording into `document_revisions`.
## Forensic Value
This evidence is crucial for forensic investigations as it can reveal previous versions of altered or deleted documents.
---
# Downloaded Files Information
> Source: https://kb.binalyze.ai/air/features/acquisition/supported-evidence/macos-collections-detail/downloaded-files-information.html
## Overview
**Evidence:** Downloaded Files Information
**Description:** Collect information about downloaded files
**Category:** System
**Platform:** macos
**Short Name:** dwnlds
**Is Parsed:** Yes
**Sent to Investigation Hub:** Yes
**Collect File(s):** No
## Background
Downloaded files in user profiles provide visibility into initial access vectors and user activity. This data is essential for tracking suspicious downloads and verifying code signing and provenance.
## Data Collected
This collector gathers structured data about downloaded files information.
## Collection Method
This collector enumerates users’ Downloads folders, extracts file metadata, hashes small files, and parses WhereFrom URLs and quarantine flags.
## Forensic Value
This evidence is crucial for forensic investigations as it links files to sources and timestamps, aiding detection of phishing payloads and drive‑by downloads.
---
# .DS_Store Files
> Source: https://kb.binalyze.ai/air/features/acquisition/supported-evidence/macos-collections-detail/ds-store-files.html
## Overview
**Evidence:** .DS_Store Files
**Description:** Collect information about .DS_Store files.
**Category:** DiskFilesystem
**Platform:** macos
**Short Name:** dsstr
**Is Parsed:** Yes
**Sent to Investigation Hub:** Yes
**Collect File(s):** No
## Background
.DS_Store files store Finder metadata for directories. This data is essential for evidencing file presence and user interactions even after deletions.
## Data Collected
This collector gathers structured data about .ds_store files.
### .DS_Store Files Data
| Field | Description | Example |
|-------|-------------|---------|
| `Path` | Path | Example value |
| `ModificationTime` | Modification Time | 2023-10-15 14:30:25+03:00 |
| `AccessTime` | Access Time | 2023-10-15 14:30:25+03:00 |
| `CreationTime` | Creation Time | 2023-10-15 14:30:25+03:00 |
| `FileName` | File Name | Example value |
| `StructureType` | Structure Type | Example value |
| `DataType` | Data Type | Example value |
## Collection Method
This collector discovers `.DS_Store` files under user directories, parses entries, and records them into `ds_store`.
## Forensic Value
This evidence is crucial for forensic investigations as it can indicate files that existed and how they were displayed in Finder.
---
# Dump Arc Indexed DB
> Source: https://kb.binalyze.ai/air/features/acquisition/supported-evidence/macos-collections-detail/dump-arc-indexed-db.html
## Overview
**Evidence:** Dump Arc Indexed DB
**Description:** Dump Arc Indexed DB
**Category:** Applications
**Platform:** macos
**Short Name:** aidxdb
**Is Parsed:** Yes
**Sent to Investigation Hub:** Yes
**Collect File(s):** No
## Background
Browser IndexedDB is a client-side database used by web applications to store structured data. This data can contain application state, cached content, user data, and potentially sensitive information stored by web applications.
## Data Collected
This collector gathers structured data about dump arc indexed db.
## Collection Method
This collector extracts IndexedDB databases and records from browser storage locations.
## Forensic Value
IndexedDB analysis reveals web application data, cached credentials, offline application state, and potential data exfiltration staging areas. Investigators can identify malicious web application activity, stored authentication tokens, and sensitive data cached by compromised websites.
---
# Dump Brave Indexed DB
> Source: https://kb.binalyze.ai/air/features/acquisition/supported-evidence/macos-collections-detail/dump-brave-indexed-db.html
## Overview
**Evidence:** Dump Brave Indexed DB
**Description:** Dump Brave Indexed DB
**Category:** Applications
**Platform:** macos
**Short Name:** bidxdb
**Is Parsed:** Yes
**Sent to Investigation Hub:** Yes
**Collect File(s):** No
## Background
Browser IndexedDB is a client-side database used by web applications to store structured data. This data can contain application state, cached content, user data, and potentially sensitive information stored by web applications.
## Data Collected
This collector gathers structured data about dump brave indexed db.
## Collection Method
This collector extracts IndexedDB databases and records from browser storage locations.
## Forensic Value
IndexedDB analysis reveals web application data, cached credentials, offline application state, and potential data exfiltration staging areas. Investigators can identify malicious web application activity, stored authentication tokens, and sensitive data cached by compromised websites.
---
# Dump Chrome Indexed DB
> Source: https://kb.binalyze.ai/air/features/acquisition/supported-evidence/macos-collections-detail/dump-chrome-indexed-db.html
## Overview
**Evidence:** Dump Chrome Indexed DB
**Description:** Dump Chrome Indexed DB
**Category:** Applications
**Platform:** macos
**Short Name:** cidxdb
**Is Parsed:** Yes
**Sent to Investigation Hub:** Yes
**Collect File(s):** No
## Background
Browser IndexedDB is a client-side database used by web applications to store structured data. This data can contain application state, cached content, user data, and potentially sensitive information stored by web applications.
## Data Collected
This collector gathers structured data about dump chrome indexed db.
## Collection Method
This collector extracts IndexedDB databases and records from browser storage locations.
## Forensic Value
IndexedDB analysis reveals web application data, cached credentials, offline application state, and potential data exfiltration staging areas. Investigators can identify malicious web application activity, stored authentication tokens, and sensitive data cached by compromised websites.
---
# Dump Edge Indexed DB
> Source: https://kb.binalyze.ai/air/features/acquisition/supported-evidence/macos-collections-detail/dump-edge-indexed-db.html
## Overview
**Evidence:** Dump Edge Indexed DB
**Description:** Dump Edge Indexed DB
**Category:** Applications
**Platform:** macos
**Short Name:** eidxdb
**Is Parsed:** Yes
**Sent to Investigation Hub:** Yes
**Collect File(s):** No
## Background
Browser IndexedDB is a client-side database used by web applications to store structured data. This data can contain application state, cached content, user data, and potentially sensitive information stored by web applications.
## Data Collected
This collector gathers structured data about dump edge indexed db.
## Collection Method
This collector extracts IndexedDB databases and records from browser storage locations.
## Forensic Value
IndexedDB analysis reveals web application data, cached credentials, offline application state, and potential data exfiltration staging areas. Investigators can identify malicious web application activity, stored authentication tokens, and sensitive data cached by compromised websites.
---
# Dump Opera Indexed DB
> Source: https://kb.binalyze.ai/air/features/acquisition/supported-evidence/macos-collections-detail/dump-opera-indexed-db.html
## Overview
**Evidence:** Dump Opera Indexed DB
**Description:** Dump Opera Indexed DB
**Category:** Applications
**Platform:** macos
**Short Name:** oidxdb
**Is Parsed:** Yes
**Sent to Investigation Hub:** Yes
**Collect File(s):** No
## Background
Browser IndexedDB is a client-side database used by web applications to store structured data. This data can contain application state, cached content, user data, and potentially sensitive information stored by web applications.
## Data Collected
This collector gathers structured data about dump opera indexed db.
## Collection Method
This collector extracts IndexedDB databases and records from browser storage locations.
## Forensic Value
IndexedDB analysis reveals web application data, cached credentials, offline application state, and potential data exfiltration staging areas. Investigators can identify malicious web application activity, stored authentication tokens, and sensitive data cached by compromised websites.
---
# Dump QQ Indexed DB
> Source: https://kb.binalyze.ai/air/features/acquisition/supported-evidence/macos-collections-detail/dump-qq-indexed-db.html
## Overview
**Evidence:** Dump QQ Indexed DB
**Description:** Dump QQ Indexed DB
**Category:** Applications
**Platform:** macos
**Short Name:** qidxdb
**Is Parsed:** Yes
**Sent to Investigation Hub:** Yes
**Collect File(s):** No
## Background
Browser IndexedDB is a client-side database used by web applications to store structured data. This data can contain application state, cached content, user data, and potentially sensitive information stored by web applications.
## Data Collected
This collector gathers structured data about dump qq indexed db.
## Collection Method
This collector extracts IndexedDB databases and records from browser storage locations.
## Forensic Value
IndexedDB analysis reveals web application data, cached credentials, offline application state, and potential data exfiltration staging areas. Investigators can identify malicious web application activity, stored authentication tokens, and sensitive data cached by compromised websites.
---
# Dump Vivaldi Indexed DB
> Source: https://kb.binalyze.ai/air/features/acquisition/supported-evidence/macos-collections-detail/dump-vivaldi-indexed-db.html
## Overview
**Evidence:** Dump Vivaldi Indexed DB
**Description:** Dump Vivaldi Indexed DB
**Category:** Applications
**Platform:** macos
**Short Name:** vidxdb
**Is Parsed:** Yes
**Sent to Investigation Hub:** Yes
**Collect File(s):** No
## Background
Browser IndexedDB is a client-side database used by web applications to store structured data. This data can contain application state, cached content, user data, and potentially sensitive information stored by web applications.
## Data Collected
This collector gathers structured data about dump vivaldi indexed db.
## Collection Method
This collector extracts IndexedDB databases and records from browser storage locations.
## Forensic Value
IndexedDB analysis reveals web application data, cached credentials, offline application state, and potential data exfiltration staging areas. Investigators can identify malicious web application activity, stored authentication tokens, and sensitive data cached by compromised websites.
---
# Edge Bookmarks
> Source: https://kb.binalyze.ai/air/features/acquisition/supported-evidence/macos-collections-detail/edge-bookmarks.html
## Overview
**Evidence:** Edge Bookmarks
**Description:** Collect Edge Bookmarks
**Category:** Applications
**Platform:** macos
**Short Name:** ebkmrks
**Is Parsed:** Yes
**Sent to Investigation Hub:** Yes
**Collect File(s):** No
## Background
Browser bookmarks represent user-saved favorite websites and organizational folders. This data reveals frequently accessed sites, user interests, and potential indicators of reconnaissance, phishing targets, or suspicious infrastructure.
## Data Collected
This collector gathers structured data about edge bookmarks.
### Edge Bookmarks Data
| Field | Description | Example |
|-------|-------------|---------|
| `UserName` | User Name | Example value |
| `ProfileName` | Profile Name | Example value |
| `BrowserName` | Browser Name | Example value |
| `GUID` | GUID | Example value |
| `BookmarkID` | Bookmark ID | Example value |
| `Name` | Name | Example value |
| `Type` | Type | Example value |
| `URL` | URL | Example value |
| `ParentFolder` | Parent Folder | Example value |
| `DateAdded` | Date Added | 2023-10-15 14:30:25+03:00 |
| `DateLastUsed` | Date Last Used | 2023-10-15 14:30:25+03:00 |
| `DateModified` | Date Modified | 2023-10-15 14:30:25+03:00 |
## Collection Method
This collector parses the browser's Bookmarks file to extract saved URLs, folder structures, timestamps, and metadata.
## Forensic Value
Bookmark analysis identifies targeted websites, phishing pages, command-and-control servers, internal resources, and organizational reconnaissance patterns. Investigators can detect social engineering campaigns, credential harvesting attempts, and lateral movement preparation.
---
# Edge Browsing History
> Source: https://kb.binalyze.ai/air/features/acquisition/supported-evidence/macos-collections-detail/edge-browsing-history.html
## Overview
**Evidence:** Edge Browsing History
**Description:** Collect visited URLs from Microsoft Edge
**Category:** Applications
**Platform:** macos
**Short Name:** ehst
**Is Parsed:** Yes
**Sent to Investigation Hub:** Yes
**Collect File(s):** No
## Background
Browser history records all websites visited by users, including URLs, page titles, visit timestamps, visit counts, and transition types. This data is essential for reconstructing user activity, identifying malicious websites, and tracking lateral movement or reconnaissance activities.
## Data Collected
This collector gathers structured data about edge browsing history.
### Edge Browsing History Data
| Field | Description | Example |
|-------|-------------|---------|
| `AccessTime` | Access Time | 2023-10-15 14:30:25+03:00 |
| `AccessCount` | Access Count | 123 |
| `URL` | URL | Example value |
| `Browser` | Browser | Example value |
| `Title` | Title | Example value |
| `VisitDuration` | Visit Duration | Example value |
| `Referrer` | Referrer | Example value |
| `TypedCount` | Typed Count | 123 |
| `IsHidden` | Is Hidden | true |
| `TransitionType` | Transition Type | Example value |
| `VisitID` | Visit ID | 123 |
| `TransitionQualifiers` | Transition Qualifiers | Example value |
| `User` | User | Example value |
| `Profile` | Profile | Example value |
| `HistoryFilePath` | History File Path | Example value |
## Collection Method
This collector queries the browser's History database to extract visited URLs, timestamps, referrer information, and user interaction patterns.
## Forensic Value
Browsing history reveals phishing sites, malicious domains, command-and-control servers, data exfiltration targets, and reconnaissance activities. Analysts can identify compromised credentials, track attacker infrastructure, and correlate web activity with other security events to establish attack timelines.
---
# Edge Cookies
> Source: https://kb.binalyze.ai/air/features/acquisition/supported-evidence/macos-collections-detail/edge-cookies.html
## Overview
**Evidence:** Edge Cookies
**Description:** Collect Edge Cookies
**Category:** Applications
**Platform:** macos
**Short Name:** ecookies
**Is Parsed:** Yes
**Sent to Investigation Hub:** Yes
**Collect File(s):** No
## Background
Browser cookies store session tokens, authentication credentials, user preferences, and tracking data. This data is essential for understanding authenticated sessions, tracking user activity across websites, and identifying session hijacking or credential theft.
## Data Collected
This collector gathers structured data about edge cookies.
### Edge Cookies Data
| Field | Description | Example |
|-------|-------------|---------|
| `UserName` | User Name | Example value |
| `BrowserName` | Browser Name | Example value |
| `ProfileName` | Profile Name | Example value |
| `Domain` | Domain | Example value |
| `Name` | Name | Example value |
| `Path` | Path | Example value |
| `Value` | Value | Example value |
| `IsSecure` | Is Secure | 123 |
| `IsHTTPOnly` | Is HTTP Only | 123 |
| `HasExpires` | Has Expires | 123 |
| `IsPersistent` | Is Persistent | 123 |
| `Priority` | Priority | 123 |
| `SameSite` | Same Site | 123 |
| `SourcePort` | Source Port | 123 |
| `SourceScheme` | Source Scheme | 123 |
| `CreationTime` | Creation Time | 2023-10-15 14:30:25+03:00 |
| `ExpiresTime` | Expires Time | 2023-10-15 14:30:25+03:00 |
| `LastAccessTime` | Last Access Time | 2023-10-15 14:30:25+03:00 |
## Collection Method
This collector extracts cookies from the browser's Cookies database, including domain, name, value, path, expiration, and security flags.
## Forensic Value
Cookie analysis reveals active sessions, authentication tokens, persistent tracking identifiers, and potential session hijacking. Investigators can identify stolen credentials, unauthorized access, and cross-site tracking used for reconnaissance or targeting.
---
# Edge Downloads
> Source: https://kb.binalyze.ai/air/features/acquisition/supported-evidence/macos-collections-detail/edge-downloads.html
## Overview
**Evidence:** Edge Downloads
**Description:** Collect Edge Downloads
**Category:** Applications
**Platform:** macos
**Short Name:** edwnlds
**Is Parsed:** Yes
**Sent to Investigation Hub:** Yes
**Collect File(s):** No
## Background
Browser download history records files downloaded by users, including file paths, timestamps, URLs, referrer information, and download status. This data is essential for tracking file acquisition, identifying potentially malicious downloads, and reconstructing user activity timelines.
## Data Collected
This collector gathers structured data about edge downloads.
### Edge Downloads Data
| Field | Description | Example |
|-------|-------------|---------|
| `UserName` | User Name | Example value |
| `Browser` | Browser | Example value |
| `ProfileName` | Profile Name | Example value |
| `URL` | URL | Example value |
| `TargetPath` | Target Path | Example value |
| `CurrentPath` | Current Path | Example value |
| `Referrer` | Referrer | Example value |
| `LastModified` | Last Modified | 2023-10-15 14:30:25+03:00 |
| `DangerType` | Danger Type | 123 |
| `Opened` | Opened | 123 |
| `TabURL` | Tab URL | Example value |
| `TabReferrerURL` | Tab Referrer URL | Example value |
| `StartTime` | Start Time | 2023-10-15 14:30:25+03:00 |
| `EndTime` | End Time | 2023-10-15 14:30:25+03:00 |
| `HistoryFilePath` | History File Path | Example value |
## Collection Method
This collector queries the browser's History database to extract download records, including file paths, download times, source URLs, and security flags.
## Forensic Value
Download history reveals malware delivery vectors, data exfiltration attempts, unauthorized software installation, and user interaction with suspicious websites. Analysts can identify downloaded malicious files, track attack chains, and correlate downloads with other security events.
---
# Edge Extensions
> Source: https://kb.binalyze.ai/air/features/acquisition/supported-evidence/macos-collections-detail/edge-extensions.html
## Overview
**Evidence:** Edge Extensions
**Description:** Collect Edge Extensions
**Category:** Applications
**Platform:** macos
**Short Name:** eext
**Is Parsed:** Yes
**Sent to Investigation Hub:** Yes
**Collect File(s):** No
## Background
Browser extensions enhance browser functionality but can pose significant security risks. Malicious extensions can steal credentials, inject ads, track browsing activity, exfiltrate data, and modify web content. Understanding installed extensions is crucial for detecting browser-based attacks and unauthorized access.
## Data Collected
This collector gathers structured data about edge extensions.
## Collection Method
This collector queries the browser's Extensions database or manifest files to extract installed extension information including names, IDs, versions, permissions, and installation sources.
## Forensic Value
Browser extensions provide insight into potential compromise vectors and data exfiltration paths. Malicious or suspicious extensions may indicate phishing attacks, credential theft, adware infections, or privacy violations. This evidence helps identify attack entry points, persistence mechanisms, and unauthorized browser modifications.
---
# Edge Favicons
> Source: https://kb.binalyze.ai/air/features/acquisition/supported-evidence/macos-collections-detail/edge-favicons.html
## Overview
**Evidence:** Edge Favicons
**Description:** Collect Edge Favicons
**Category:** Applications
**Platform:** macos
**Short Name:** efico
**Is Parsed:** Yes
**Sent to Investigation Hub:** Yes
**Collect File(s):** No
## Background
Browser favicons are cached website icons that provide visual history of visited sites. This data supplements browsing history by revealing sites accessed even if history was deleted.
## Data Collected
This collector gathers structured data about edge favicons.
### Edge Favicons Data
| Field | Description | Example |
|-------|-------------|---------|
| `ID` | ID | 123 |
| `UserName` | User Name | Example value |
| `BrowserName` | Browser Name | Example value |
| `Profile` | Profile | Example value |
| `URL` | URL | Example value |
| `IconType` | Icon Type | 123 |
| `Path` | Path | Example value |
## Collection Method
This collector queries the browser's Favicons database to extract cached website icons and associated URLs.
## Forensic Value
Favicon analysis can recover evidence of deleted browsing history, identify visited sites through icon fingerprinting, and correlate with other browser artifacts to establish comprehensive activity timelines.
---
# Edge Form History
> Source: https://kb.binalyze.ai/air/features/acquisition/supported-evidence/macos-collections-detail/edge-form-history.html
## Overview
**Evidence:** Edge Form History
**Description:** Collect Edge Form History
**Category:** Applications
**Platform:** macos
**Short Name:** efh
**Is Parsed:** Yes
**Sent to Investigation Hub:** Yes
**Collect File(s):** No
## Background
Browser form history stores previously entered form data including search queries, usernames, and other input fields. This data reveals user search patterns, account information, and potential data leakage through autofill.
## Data Collected
This collector gathers structured data about edge form history.
### Edge Form History Data
| Field | Description | Example |
|-------|-------------|---------|
| `UserName` | User Name | Example value |
| `BrowserName` | Browser Name | Example value |
| `Name` | Name | Example value |
| `Value` | Value | Example value |
| `ValueLower` | Value Lower | Example value |
| `Count` | Count | 123 |
| `Profile` | Profile | Example value |
| `Path` | Path | Example value |
| `DateCreated` | Date Created | 2023-10-15 14:30:25+03:00 |
| `DateLastUsed` | Date Last Used | 2023-10-15 14:30:25+03:00 |
## Collection Method
This collector queries the browser's form history database to extract saved form field data, search queries, and associated timestamps.
## Forensic Value
Form history exposes reconnaissance activities, credential enumeration attempts, search queries revealing attacker intent, and potentially sensitive information entered into web forms. Analysts can identify data exfiltration, account compromise indicators, and targeted search patterns.
---
# Edge Local Storage
> Source: https://kb.binalyze.ai/air/features/acquisition/supported-evidence/macos-collections-detail/edge-local-storage.html
## Overview
**Evidence:** Edge Local Storage
**Description:** Collect Edge Local Storage
**Category:** Applications
**Platform:** macos
**Short Name:** els
**Is Parsed:** Yes
**Sent to Investigation Hub:** Yes
**Collect File(s):** No
## Background
Browser local storage contains persistent key-value data stored by websites. This data includes user preferences, session state, cached data, and potentially authentication tokens or sensitive information.
## Data Collected
This collector gathers structured data about edge local storage.
### Edge Local Storage Data
| Field | Description | Example |
|-------|-------------|---------|
| `UserName` | User Name | Example value |
| `ProfileName` | Profile Name | Example value |
| `BrowserName` | Browser Name | Example value |
| `Key` | Key | Example value |
| `Value` | Value | Example value |
| `Path` | Path | Example value |
## Collection Method
This collector extracts local storage data from browser storage databases and files.
## Forensic Value
Local storage analysis reveals stored credentials, session tokens, tracking identifiers, and application state that can indicate compromised accounts, persistent tracking, or malicious website activity. Analysts can identify credential theft, session hijacking, and data exfiltration attempts.
---
# Edge Login Data
> Source: https://kb.binalyze.ai/air/features/acquisition/supported-evidence/macos-collections-detail/edge-login-data.html
## Overview
**Evidence:** Edge Login Data
**Description:** Collect Edge Login Data
**Category:** Applications
**Platform:** macos
**Short Name:** elgd
**Is Parsed:** Yes
**Sent to Investigation Hub:** Yes
**Collect File(s):** No
## Background
Browser login data stores saved passwords and credential information. This data is critical for identifying stored credentials, password reuse patterns, and potential credential theft targets.
## Data Collected
This collector gathers structured data about edge login data.
### Edge Login Data Data
| Field | Description | Example |
|-------|-------------|---------|
| `ID` | ID | 123 |
| `UserName` | User Name | Example value |
| `BrowserName` | Browser Name | Example value |
| `OriginURL` | Origin URL | Example value |
| `SignonRealm` | Signon Realm | Example value |
| `BlacklistedByUser` | Blacklisted By User | 123 |
| `Scheme` | Scheme | Example value |
| `PasswordType` | Password Type | Example value |
| `TimesUsed` | Times Used | 123 |
| `Profile` | Profile | Example value |
| `Path` | Path | Example value |
| `DateCreated` | Date Created | 2023-10-15 14:30:25+03:00 |
| `DateLastUsed` | Date Last Used | 2023-10-15 14:30:25+03:00 |
## Collection Method
This collector extracts saved credentials from the browser's Login Data database, including URLs, usernames, and encrypted passwords.
## Forensic Value
Login data analysis reveals stored credentials, password reuse across services, targeted accounts, and potential credential harvesting. Investigators can identify compromised accounts, credential theft attempts, and unauthorized access to saved credentials by malware or attackers.
---
# Edge Sessions
> Source: https://kb.binalyze.ai/air/features/acquisition/supported-evidence/macos-collections-detail/edge-sessions.html
## Overview
**Evidence:** Edge Sessions
**Description:** Collect Edge Sessions
**Category:** Applications
**Platform:** macos
**Short Name:** edss
**Is Parsed:** Yes
**Sent to Investigation Hub:** Yes
**Collect File(s):** No
## Background
Browser sessions maintain active tab state, cookies, and authentication context. This data reveals currently active user sessions, open websites, and authenticated connections at the time of collection.
## Data Collected
This collector gathers structured data about edge sessions.
### Edge Sessions Data
| Field | Description | Example |
|-------|-------------|---------|
| `ID` | ID | 123 |
| `WindowID` | Window ID | 123 |
| `Active` | Active | true |
| `Url` | Url | Example value |
| `Title` | Title | Example value |
| `Deleted` | Deleted | true |
| `Group` | Group | Example value |
| `History` | History | [] |
| `BrowserName` | Browser Name | Example value |
## Collection Method
This collector captures browser session data including active tabs, session cookies, and authentication state.
## Forensic Value
Session analysis identifies active compromises, authenticated sessions to malicious sites, concurrent suspicious activities, and real-time indicators of ongoing attacks. Analysts can detect active C2 connections, authenticated malware communications, and live attacker sessions.
---
# Edge Thumbnails
> Source: https://kb.binalyze.ai/air/features/acquisition/supported-evidence/macos-collections-detail/edge-thumbnails.html
## Overview
**Evidence:** Edge Thumbnails
**Description:** Collect Edge Thumbnails
**Category:** Applications
**Platform:** macos
**Short Name:** ethmb
**Is Parsed:** Yes
**Sent to Investigation Hub:** Yes
**Collect File(s):** No
## Background
Browser thumbnails are cached preview images of visited websites. This visual data supplements browsing history by providing screenshots of accessed pages, useful for recovering deleted history and identifying visited content.
## Data Collected
This collector gathers structured data about edge thumbnails.
### Edge Thumbnails Data
| Field | Description | Example |
|-------|-------------|---------|
| `UserName` | User Name | Example value |
| `Browser` | Browser | Example value |
| `URL` | URL | Example value |
| `URLRank` | URL Rank | 123 |
| `Title` | Title | Example value |
| `Profile` | Profile | Example value |
| `Path` | Path | Example value |
## Collection Method
This collector extracts cached thumbnail images from browser storage.
## Forensic Value
Thumbnail analysis provides visual evidence of visited websites, can recover evidence after history deletion, and helps identify phishing pages, malicious sites, or sensitive internal resources accessed by users through visual inspection.
---
# Edge User Profiles
> Source: https://kb.binalyze.ai/air/features/acquisition/supported-evidence/macos-collections-detail/edge-user-profiles.html
## Overview
**Evidence:** Edge User Profiles
**Description:** Collect Edge User Profiles
**Category:** Applications
**Platform:** macos
**Short Name:** eprfls
**Is Parsed:** Yes
**Sent to Investigation Hub:** Yes
**Collect File(s):** No
## Background
Browser user profiles store per-user browser configurations, extensions, settings, and data segregation. This data reveals multiple user accounts, profile switching patterns, and user-specific browsing behavior.
## Data Collected
This collector gathers structured data about edge user profiles.
### Edge User Profiles Data
| Field | Description | Example |
|-------|-------------|---------|
| `EndpointUserName` | Endpoint User Name | Example value |
| `Profile` | Profile | Example value |
| `ProfileUserName` | Profile User Name | Example value |
| `BrowserName` | Browser Name | Example value |
| `BackgroundApps` | Background Apps | true |
| `GoogleAccountGivenName` | Google Account Given Name | Example value |
| `GoogleAccountID` | Google Account ID | Example value |
| `GoogleAccountName` | Google Account Name | Example value |
| `PictureFileName` | Picture File Name | Example value |
| `LastDownloadedPictureURL` | Last Downloaded Picture URL | Example value |
| `HostedDomain` | Hosted Domain | Example value |
| `IsConsentedPrimaryAccount` | Is Consented Primary Account | true |
| `IsEphemeral` | Is Ephemeral | true |
## Collection Method
This collector enumerates browser user profiles and extracts profile metadata, configurations, and associated data paths.
## Forensic Value
Profile analysis identifies multiple user accounts, profile-specific extensions and configurations, shared device usage patterns, and potential privilege escalation or lateral movement using different browser profiles. Investigators can correlate activity across profiles and identify unauthorized profile creation.
---
# Edge Web Storage
> Source: https://kb.binalyze.ai/air/features/acquisition/supported-evidence/macos-collections-detail/edge-web-storage.html
## Overview
**Evidence:** Edge Web Storage
**Description:** Collect Edge Web Storage
**Category:** Applications
**Platform:** macos
**Short Name:** ews
**Is Parsed:** Yes
**Sent to Investigation Hub:** Yes
**Collect File(s):** No
## Background
Browser web storage includes both local and session storage used by websites to store client-side data. This data can contain application state, user preferences, cached content, and potentially sensitive information.
## Data Collected
This collector gathers structured data about edge web storage.
### Edge Web Storage Data
| Field | Description | Example |
|-------|-------------|---------|
| `UserName` | User Name | Example value |
| `ProfileName` | Profile Name | Example value |
| `BrowserName` | Browser Name | Example value |
| `Key` | Key | Example value |
| `Value` | Value | Example value |
| `Path` | Path | Example value |
## Collection Method
This collector extracts web storage data from browser storage locations including local storage and session storage.
## Forensic Value
Web storage analysis reveals cached application data, stored credentials, session information, and potential data exfiltration staging. Analysts can identify malicious website activity, stored authentication tokens, tracking identifiers, and sensitive data cached by compromised web applications.
---
# Emond Clients
> Source: https://kb.binalyze.ai/air/features/acquisition/supported-evidence/macos-collections-detail/emond-clients.html
## Overview
**Evidence:** Emond Clients
**Description:** Collect Emond Clients
**Category:** System
**Platform:** macos
**Short Name:** emnd
**Is Parsed:** Yes
**Sent to Investigation Hub:** Yes
**Collect File(s):** No
## Background
Emond (event monitor daemon) can execute client scripts based on rules. This data is essential for detecting persistence via emond client files.
## Data Collected
This collector gathers structured data about emond clients.
### Emond Clients Data
| Field | Description | Example |
|-------|-------------|---------|
| `FileName` | File Name | Example value |
| `FullPath` | Full Path | Example value |
| `Hash` | Hash | Example value |
| `FileSize` | File Size | 123 |
| `Modified` | Modified | 2023-10-15 14:30:25+03:00 |
| `Accessed` | Accessed | 2023-10-15 14:30:25+03:00 |
| `Changed` | Changed | 2023-10-15 14:30:25+03:00 |
## Collection Method
This collector enumerates `/private/var/db/emondClients/` and records file metadata and hashes into `emond_clients`.
## Forensic Value
This evidence is crucial for forensic investigations as emond clients have been used by malware for persistence.
---
# ETC Files
> Source: https://kb.binalyze.ai/air/features/acquisition/supported-evidence/macos-collections-detail/etc-files.html
## Overview
**Evidence:** ETC Files
**Description:** Collect all files in etc directories
**Category:** System
**Platform:** macos
**Short Name:** etcf
**Is Parsed:** No
**Sent to Investigation Hub:** Yes
**Collect File(s):** Yes
## Background
The /private/etc directory on macOS contains system configuration files that define services, networking, authentication, and other OS behavior. Reviewing these files provides visibility into security posture and configuration drift.
## Data Collected
This collector gathers structured data about etc files.
## Collection Method
This collector walks the /private/etc directory, captures metadata (times, modes, sizes) and copies regular files into the case content for preservation and review.
## Forensic Value
Configuration files reveal service enablement, policy changes, malicious tampering, and indicators of persistence. They are essential for baselining and detecting unauthorized modifications.
---
# ETC Hosts
> Source: https://kb.binalyze.ai/air/features/acquisition/supported-evidence/macos-collections-detail/etc-hosts.html
## Overview
**Evidence:** ETC Hosts
**Description:** Collect ETC Hosts
**Category:** Network
**Platform:** macos
**Short Name:** etch
**Is Parsed:** Yes
**Sent to Investigation Hub:** Yes
**Collect File(s):** No
## Background
This collector gathers hosts file entries from macOS. This data is essential for understanding static hostname mappings, detecting malicious overrides, and investigating network resolution issues.
## Data Collected
This collector gathers structured data about etc hosts.
## Collection Method
This collector queries osquery’s `etc_hosts` table and records rows into the `etc_hosts` table.
## Forensic Value
This evidence is crucial for forensic investigations as it reveals local DNS overrides that can indicate redirection, exfiltration paths, or misconfigurations.
---
# ETC Protocols
> Source: https://kb.binalyze.ai/air/features/acquisition/supported-evidence/macos-collections-detail/etc-protocols.html
## Overview
**Evidence:** ETC Protocols
**Description:** Collect ETC Protocols
**Category:** Network
**Platform:** macos
**Short Name:** etcpr
**Is Parsed:** Yes
**Sent to Investigation Hub:** Yes
**Collect File(s):** No
## Background
`/etc/protocols` maps protocol numbers to names. This data is essential for protocol identification, aiding packet analysis and incident response.
## Data Collected
This collector gathers structured data about etc protocols.
## Collection Method
This collector queries the `etc_protocols` table via osquery and records entries into `etc_protocols`.
## Forensic Value
This evidence helps contextualize network events by mapping numeric protocol fields to names during analysis.
---
# ETC Services
> Source: https://kb.binalyze.ai/air/features/acquisition/supported-evidence/macos-collections-detail/etc-services.html
## Overview
**Evidence:** ETC Services
**Description:** Collect ETC Services
**Category:** Network
**Platform:** macos
**Short Name:** etcsrv
**Is Parsed:** Yes
**Sent to Investigation Hub:** Yes
**Collect File(s):** No
## Background
`/etc/services` maps service names to ports and protocols. This data is essential for validating service configurations and troubleshooting network behavior.
## Data Collected
This collector gathers structured data about etc services.
## Collection Method
This collector queries the `etc_services` table via osquery and records entries into `etc_services`.
## Forensic Value
This evidence supports investigations by documenting expected service-port mappings, aiding anomaly detection.
---
# Event Taps
> Source: https://kb.binalyze.ai/air/features/acquisition/supported-evidence/macos-collections-detail/event-taps.html
## Overview
**Evidence:** Event Taps
**Description:** Collect Event Taps
**Category:** System
**Platform:** macos
**Short Name:** evtps
**Is Parsed:** Yes
**Sent to Investigation Hub:** Yes
**Collect File(s):** No
## Background
Event Taps are a macOS mechanism that allows applications to monitor and modify system-wide input events such as keyboard presses, mouse movements, and clicks. While legitimate applications use Event Taps for accessibility features and input monitoring, malicious software often abuses this capability for keylogging, credential theft, and surveillance. Monitoring active Event Taps is crucial for detecting potentially malicious activity and privacy violations.
## Data Collected
This collector gathers structured data about event taps.
### Event Taps Data
| Field | Description | Example |
|-------|-------------|---------|
| `EventTapped` | Event Tapped | Example value |
| `Identifier` | Identifier | Example value |
| `Signed` | Signed | 123 |
| `TeamIdentifier` | Team Identifier | Example value |
| `Authority` | Authority | Example value |
## Collection Method
This collector queries osquery's event_taps table joined with process and signature information to identify all active Event Taps. It filters out common system processes (ViewBridgeAuxiliary, universalaccessd, AXVisualSupportAgent) and captures the tapped events, process identifier, code signing status, team identifier, and signing authority. This provides visibility into which applications are monitoring system events.
## Forensic Value
Event Tap monitoring is critical for detecting keyloggers, spyware, credential theft tools, and surveillance malware. Unsigned or suspicious Event Taps often indicate malicious activity. This evidence helps identify privacy violations, data exfiltration mechanisms, and persistent monitoring tools. The signing information allows investigators to assess legitimacy and track malicious software across systems. Event Taps are a common technique used by advanced persistent threats and commercial spyware.
---
# Extended Attributes
> Source: https://kb.binalyze.ai/air/features/acquisition/supported-evidence/macos-collections-detail/extended-attributes.html
## Overview
**Evidence:** Extended Attributes
**Description:** Collect Extended File Attributes
**Category:** DiskFilesystem
**Platform:** macos
**Short Name:** extattr
**Is Parsed:** Yes
**Sent to Investigation Hub:** Yes
**Collect File(s):** No
## Background
Extended attributes (xattr) are name-value pairs associated with files and directories that store additional metadata beyond standard file attributes. On macOS, these attributes are extensively used to track file quarantine status, download sources, Finder information, and DMG file metadata. This data is essential for understanding file provenance, detecting suspicious downloads, and investigating file-based incidents.
## Data Collected
This collector gathers structured data about extended attributes.
### Extended Attributes Data
| Field | Description | Example |
|-------|-------------|---------|
| `Path` | Path | Example value |
| `AttributeName` | Attribute Name | Example value |
| `AttributeValue` | Attribute Value | Example value |
| `AttributeSize` | Attribute Size | 123 |
| `AttributeValueHex` | Attribute Value Hex | Example value |
| `FileExists` | File Exists | true |
| `FileSize` | File Size | 123 |
| `FileModificationTime` | File Modification Time | 2023-10-15 14:30:25+03:00 |
| `QuarantineFlags` | Quarantine Flags | Example value |
| `QuarantineAgent` | Quarantine Agent | Example value |
| `QuarantineTimestamp` | Quarantine Timestamp | 2023-10-15 14:30:25+03:00 |
| `QuarantineUUID` | Quarantine UUID | Example value |
| `WhereFromsURLs` | Where Froms UR Ls | Example value |
| `FinderInfoHex` | Finder Info Hex | Example value |
| `DMGChecksumType` | DMG Checksum Type | Example value |
| `DMGChecksum` | DMG Checksum | Example value |
| `DMGChecksumTimestamp` | DMG Checksum Timestamp | 2023-10-15 14:30:25+03:00 |
## Collection Method
This collector recursively scans configurable directories (default: /Users, /Applications) and uses the xattr package to retrieve all extended attributes for each file. It parses common macOS-specific attributes including quarantine information, download sources (kMDItemWhereFroms), Finder metadata, and DMG checksums. Results are stored in the `extended_attributes` table with both raw and parsed attribute values.
## Forensic Value
This evidence is crucial for forensic investigations as it reveals file download history, quarantine status, source URLs, and file handling metadata. It helps identify potentially malicious downloaded files, trace the origin of files, detect quarantine bypass attempts, and understand file interactions with system features like Gatekeeper.
---
# Failed Sudo
> Source: https://kb.binalyze.ai/air/features/acquisition/supported-evidence/macos-collections-detail/failed-sudo.html
## Overview
**Evidence:** Failed Sudo
**Description:** Filter failed sudo events
**Category:** System
**Platform:** macos
**Short Name:** fsu
**Is Parsed:** Yes
**Sent to Investigation Hub:** Yes
**Collect File(s):** No
## Background
Failed sudo attempts occur when users provide incorrect passwords while trying to execute commands with elevated privileges. macOS logs these failures after multiple incorrect attempts, which can indicate brute force attacks, privilege escalation attempts, or unauthorized access efforts.
## Data Collected
This collector gathers structured data about failed sudo.
## Collection Method
This collector uses the macOS 'log' command with predicate-based filtering to extract sudo events with 3 consecutive failed password attempts over the last 3 days. Log entries are parsed from JSON format and stored in the unified_logs table with PredicateType='Failed Sudo'.
## Forensic Value
Failed sudo events are critical indicators of privilege escalation attempts, brute force attacks against user credentials, insider threat activities, and unauthorized administrative access attempts. They help identify compromised accounts, policy violations, and potential security breaches before they succeed.
---
# File Last Used
> Source: https://kb.binalyze.ai/air/features/acquisition/supported-evidence/macos-collections-detail/file-last-used.html
## Overview
**Evidence:** File Last Used
**Description:** Collects files with last access times via Finder or open command.
**Category:** DiskFilesystem
**Platform:** macos
**Short Name:** fls
**Is Parsed:** Yes
**Sent to Investigation Hub:** Yes
**Collect File(s):** No
## Background
macOS tracks last usage metadata for files through extended attributes (e.g., com.apple.lastuseddate#PS) updated by Finder and certain application interactions. These timestamps help understand user interaction with files beyond standard atime semantics.
## Data Collected
This collector gathers structured data about file last used.
### File Last Used Data
| Field | Description | Example |
|-------|-------------|---------|
| `ID` | ID | 123 |
| `Username` | Username | Example value |
| `Path` | Path | Example value |
| `Time` | Time | 2023-10-15 14:30:25+03:00 |
## Collection Method
This collector enumerates user directories and extracts the com.apple.lastuseddate#PS extended attribute for files, decoding it into timestamps and mapping them to the owning user.
## Forensic Value
Last used timestamps help reconstruct user activity on documents, reveal recently interacted files, and support timeline building even when traditional access times are unreliable due to filesystem settings.
---
# File System Enumeration
> Source: https://kb.binalyze.ai/air/features/acquisition/supported-evidence/macos-collections-detail/file-system-enumeration.html
## Overview
**Evidence:** File System Enumeration
**Description:** Dump file and folder information as CSV
**Group:** DiskFilesystem
**Sub Group:** Disk & File System
**Platform:** macos
**Short Name:** fsenum
**Is Parsed:** Yes
**Sent to Investigation Hub:** No
**Collect Raw File(s):** No
**Collect as CSV File:** Yes
## Background
File system enumeration provides comprehensive information about files, directories, and file system structure on Unix-like systems. This data is essential for understanding file system state and detecting unauthorized file modifications.
## Data Collected
This collector gathers structured data about file system enumeration.
### File System Enumeration Data
| Field | Description | Example |
|-------|-------------|---------|
| `GroupId` | Group Id | 123 |
| `UserId` | User Id | 123 |
| `Mode` | Mode | 123 |
| `Dev` | Dev | 123 |
| `Nlink` | Nlink | 123 |
| `Size` | Size | 123 |
| `Ino` | Ino | 123 |
| `Path` | Path | Example value |
| `LastChangeTime` | Last Change Time | 2023-10-15 14:30:25+03:00 |
| `AccessTime` | Access Time | 2023-10-15 14:30:25+03:00 |
| `ModificationTime` | Modification Time | 2023-10-15 14:30:25+03:00 |
## Collection Method
This collector enumerates the file system and records metadata to the `file_system_enumeration` table.
## Forensic Value
This evidence is crucial for forensic investigations as it provides file system information. It helps investigators understand file system state, detect unauthorized file modifications, and investigate file-based attacks. The data can reveal file changes, directory structures, and potential file system vulnerabilities.
---
# Finder Mounted Volume
> Source: https://kb.binalyze.ai/air/features/acquisition/supported-evidence/macos-collections-detail/finder-mounted-volume.html
## Overview
**Evidence:** Finder Mounted Volume
**Description:** Collects the list of mounted volumes in Finder.
**Category:** DiskFilesystem
**Platform:** macos
**Short Name:** fmvlm
**Is Parsed:** Yes
**Sent to Investigation Hub:** Yes
**Collect File(s):** No
## Background
Finder preferences track mounted volumes shown on the desktop. This data is essential for identifying external drives and volumes accessed by users.
## Data Collected
This collector gathers structured data about finder mounted volume.
### Finder Mounted Volume Data
| Field | Description | Example |
|-------|-------------|---------|
| `ID` | ID | 123 |
| `Username` | Username | Example value |
| `VolumeName` | Volume Name | Example value |
## Collection Method
This collector reads each user's `com.apple.finder.plist` and extracts `FXDesktopVolumePositions` into `finder_mounted_volumes`.
## Forensic Value
This evidence is crucial for forensic investigations as it indicates removable media usage and mounted volume names relevant to data movement.
---
# Firefox Browsing History
> Source: https://kb.binalyze.ai/air/features/acquisition/supported-evidence/macos-collections-detail/firefox-browsing-history.html
## Overview
**Evidence:** Firefox Browsing History
**Description:** Collect visited URLs from Mozilla Firefox
**Category:** Applications
**Platform:** macos
**Short Name:** fhst
**Is Parsed:** Yes
**Sent to Investigation Hub:** Yes
**Collect File(s):** No
## Background
Browser history records all websites visited by users, including URLs, page titles, visit timestamps, visit counts, and transition types. This data is essential for reconstructing user activity, identifying malicious websites, and tracking lateral movement or reconnaissance activities.
## Data Collected
This collector gathers structured data about firefox browsing history.
### Firefox Browsing History Data
| Field | Description | Example |
|-------|-------------|---------|
| `AccessTime` | Access Time | 2023-10-15 14:30:25+03:00 |
| `AccessCount` | Access Count | 123 |
| `URL` | URL | Example value |
| `Browser` | Browser | Example value |
| `Title` | Title | Example value |
| `VisitDuration` | Visit Duration | Example value |
| `Referrer` | Referrer | Example value |
| `TypedCount` | Typed Count | 123 |
| `IsHidden` | Is Hidden | true |
| `TransitionType` | Transition Type | Example value |
| `VisitID` | Visit ID | 123 |
| `TransitionQualifiers` | Transition Qualifiers | Example value |
| `User` | User | Example value |
| `Profile` | Profile | Example value |
| `HistoryFilePath` | History File Path | Example value |
## Collection Method
This collector queries the browser's History database to extract visited URLs, timestamps, referrer information, and user interaction patterns.
## Forensic Value
Browsing history reveals phishing sites, malicious domains, command-and-control servers, data exfiltration targets, and reconnaissance activities. Analysts can identify compromised credentials, track attacker infrastructure, and correlate web activity with other security events to establish attack timelines.
---
# Firefox Cookies
> Source: https://kb.binalyze.ai/air/features/acquisition/supported-evidence/macos-collections-detail/firefox-cookies.html
## Overview
**Evidence:** Firefox Cookies
**Description:** Collect Firefox Cookies
**Category:** Applications
**Platform:** macos
**Short Name:** fcookies
**Is Parsed:** Yes
**Sent to Investigation Hub:** Yes
**Collect File(s):** No
## Background
Firefox cookies store session data, authentication tokens, user preferences, and tracking information. Cookies can persist across sessions and contain sensitive data including login credentials, API tokens, and user identifiers. Understanding cookie data is essential for investigating account compromises, tracking malicious domains, and identifying data exfiltration paths.
## Data Collected
This collector gathers structured data about firefox cookies.
### Firefox Cookies Data
| Field | Description | Example |
|-------|-------------|---------|
| `UserName` | User Name | Example value |
| `ProfileName` | Profile Name | Example value |
| `OriginAttributes` | Origin Attributes | Example value |
| `Name` | Name | Example value |
| `Value` | Value | Example value |
| `Host` | Host | Example value |
| `Path` | Path | Example value |
| `IsSecure` | Is Secure | true |
| `IsHTTPOnly` | Is HTTP Only | true |
| `InBrowserElement` | In Browser Element | 123 |
| `SameSite` | Same Site | 123 |
| `RawSameSite` | Raw Same Site | 123 |
| `SchemeMap` | Scheme Map | 123 |
| `Expiry` | Expiry | 2023-10-15 14:30:25+03:00 |
| `LastAccessTime` | Last Access Time | 2023-10-15 14:30:25+03:00 |
| `CreationTime` | Creation Time | 2023-10-15 14:30:25+03:00 |
## Collection Method
This collector queries the Firefox cookies.sqlite database to extract cookie information including names, values, domains, paths, expiration times, security flags, and SameSite attributes for all user profiles.
## Forensic Value
Cookie data reveals visited websites, active sessions, authentication states, and tracking mechanisms. Malicious cookies may indicate session hijacking, credential theft, cross-site scripting attacks, or connections to command-and-control infrastructure. This evidence helps establish user activity timelines, identify compromised accounts, and track attacker access to web services.
---
# Firefox Downloads
> Source: https://kb.binalyze.ai/air/features/acquisition/supported-evidence/macos-collections-detail/firefox-downloads.html
## Overview
**Evidence:** Firefox Downloads
**Description:** Collect Firefox Downloads
**Category:** Applications
**Platform:** macos
**Short Name:** fdwnlds
**Is Parsed:** Yes
**Sent to Investigation Hub:** Yes
**Collect File(s):** No
## Background
Browser download history records files downloaded by users, including file paths, timestamps, URLs, referrer information, and download status. This data is essential for tracking file acquisition, identifying potentially malicious downloads, and reconstructing user activity timelines.
## Data Collected
This collector gathers structured data about firefox downloads.
### Firefox Downloads Data
| Field | Description | Example |
|-------|-------------|---------|
| `UserName` | User Name | Example value |
| `Browser` | Browser | Example value |
| `ProfileName` | Profile Name | Example value |
| `URL` | URL | Example value |
| `TargetPath` | Target Path | Example value |
| `CurrentPath` | Current Path | Example value |
| `Referrer` | Referrer | Example value |
| `LastModified` | Last Modified | 2023-10-15 14:30:25+03:00 |
| `DangerType` | Danger Type | 123 |
| `Opened` | Opened | 123 |
| `TabURL` | Tab URL | Example value |
| `TabReferrerURL` | Tab Referrer URL | Example value |
| `StartTime` | Start Time | 2023-10-15 14:30:25+03:00 |
| `EndTime` | End Time | 2023-10-15 14:30:25+03:00 |
| `HistoryFilePath` | History File Path | Example value |
## Collection Method
This collector queries the browser's History database to extract download records, including file paths, download times, source URLs, and security flags.
## Forensic Value
Download history reveals malware delivery vectors, data exfiltration attempts, unauthorized software installation, and user interaction with suspicious websites. Analysts can identify downloaded malicious files, track attack chains, and correlate downloads with other security events.
---
# Firefox Extensions
> Source: https://kb.binalyze.ai/air/features/acquisition/supported-evidence/macos-collections-detail/firefox-extensions.html
## Overview
**Evidence:** Firefox Extensions
**Description:** Collect Firefox Extensions (Addons)
**Category:** Applications
**Platform:** macos
**Short Name:** fext
**Is Parsed:** Yes
**Sent to Investigation Hub:** Yes
**Collect File(s):** No
## Background
Firefox extensions (add-ons) enhance browser functionality but can pose significant security risks. Malicious extensions can steal credentials, inject ads, track browsing activity, exfiltrate data, and modify web content. Understanding installed extensions is crucial for detecting browser-based attacks and unauthorized access.
## Data Collected
This collector gathers structured data about firefox extensions.
### Firefox Extensions Data
| Field | Description | Example |
|-------|-------------|---------|
| `ExtensionID` | Extension ID | Example value |
| `SyncGUID` | Sync GUID | Example value |
| `Version` | Version | Example value |
| `Username` | Username | Example value |
| `Type` | Type | Example value |
| `Name` | Name | Example value |
| `Description` | Description | Example value |
| `Visible` | Visible | true |
| `Active` | Active | true |
| `UserDisabled` | User Disabled | true |
| `AppDisabled` | App Disabled | true |
| `Path` | Path | Example value |
| `DefaultLocale` | Default Locale | Example value |
| `Hidden` | Hidden | true |
| `InstallTelemetryInfo` | Install Telemetry Info | Example value |
| `Location` | Location | Example value |
| `ManifestVersion` | Manifest Version | 123 |
| `OptionsURL` | Options URL | Example value |
| `OptionsType` | Options Type | 123 |
| `SourceURI` | Source URI | Example value |
| `SignedState` | Signed State | 123 |
| `Incognito` | Incognito | Example value |
| `UserPermissions` | User Permissions | Example value |
| `OptionalPermissions` | Optional Permissions | Example value |
| `InstallDate` | Install Date | 2023-10-15 14:30:25+03:00 |
| `UpdateDate` | Update Date | 2023-10-15 14:30:25+03:00 |
| `SignedDate` | Signed Date | 2023-10-15 14:30:25+03:00 |
## Collection Method
This collector parses Firefox extensions.json and addons.json files from user profiles to extract installed extension information including names, IDs, versions, descriptions, permissions, and installation sources.
## Forensic Value
Firefox extension data provides insight into potential compromise vectors and data exfiltration paths. Malicious or suspicious extensions may indicate phishing attacks, credential theft, adware infections, or privacy violations. This evidence helps identify attack entry points, persistence mechanisms, and unauthorized browser modifications.
---
# Collect File System (FS) Events
> Source: https://kb.binalyze.ai/air/features/acquisition/supported-evidence/macos-collections-detail/collect-file-system-fs-events.html
## Overview
**Evidence:** Collect File System (FS) Events
**Description:** Collect File System Events
**Category:** DiskFilesystem
**Platform:** macos
**Short Name:** fsevnts
**Is Parsed:** Yes
**Sent to Investigation Hub:** Yes
**Collect File(s):** No
## Background
FSEvents maintains a journal of file system changes. This data is essential for reconstructing file activity timelines and detecting suspicious modifications.
## Data Collected
This collector gathers structured data about collect file system (fs) events.
## Collection Method
This collector copies entries from `/System/Volumes/Data/.fseventsd/` into the case content for offline analysis.
## Forensic Value
This evidence is crucial for forensic investigations as it reveals file creations, deletions, and renames even when file metadata is missing.
---
# Parse File System (FS) Events
> Source: https://kb.binalyze.ai/air/features/acquisition/supported-evidence/macos-collections-detail/parse-file-system-fs-events.html
## Overview
**Evidence:** Parse File System (FS) Events
**Description:** Parse File System Events
**Category:** DiskFilesystem
**Platform:** macos
**Short Name:** fsevntsprs
**Is Parsed:** Yes
**Sent to Investigation Hub:** Yes
**Collect File(s):** No
## Background
FSEvents are binary logs that record file system changes at the kernel level. The parser decodes these logs to reveal detailed file operations including creates, deletes, renames, permission changes, and extended attribute modifications. This parsed data provides a comprehensive timeline of file system activity essential for forensic analysis.
## Data Collected
This collector gathers structured data about parse file system (fs) events.
## Collection Method
This collector parses binary fseventsd log files from the case content, decoding DLS headers, extracting event records, and interpreting flag bitmasks to produce human-readable file operation records stored in the fs_events table.
## Forensic Value
Parsed FSEvents provide detailed file operation timelines that survive file deletion and modification. They reveal attacker file operations, malware deployment, data staging, evidence tampering, and lateral movement. This evidence helps reconstruct attack sequences, identify deleted files, and establish precise activity timelines even when file metadata is altered or removed.
---
# Gatekeeper Approved Apps
> Source: https://kb.binalyze.ai/air/features/acquisition/supported-evidence/macos-collections-detail/gatekeeper-approved-apps.html
## Overview
**Evidence:** Gatekeeper Approved Apps
**Description:** Collect Gatekeeper apps allowed to run
**Category:** System
**Platform:** macos
**Short Name:** gatekapp
**Is Parsed:** Yes
**Sent to Investigation Hub:** Yes
**Collect File(s):** No
## Background
Gatekeeper approved apps list shows binaries allowed to run by Gatekeeper exceptions. This data is essential for understanding application allow-listing and detecting unauthorized approvals.
## Data Collected
This collector gathers structured data about gatekeeper approved apps.
### Gatekeeper Approved Apps Data
| Field | Description | Example |
|-------|-------------|---------|
| `Path` | Path | Example value |
| `Requirement` | Requirement | Example value |
| `CTime` | C Time | 123 |
| `MTime` | M Time | 123 |
| `LastChangeTime` | Last Change Time | 2023-10-15 14:30:25+03:00 |
| `ModificationTime` | Modification Time | 2023-10-15 14:30:25+03:00 |
## Collection Method
This collector queries the `gatekeeper_approved_apps` table via osquery and records results into `gatekeeper_apps`.
## Forensic Value
This evidence is crucial for forensic investigations as it highlights exceptions and approvals that may indicate policy bypass or persistence via whitelisted binaries.
---
# Gatekeeper
> Source: https://kb.binalyze.ai/air/features/acquisition/supported-evidence/macos-collections-detail/gatekeeper.html
## Overview
**Evidence:** Gatekeeper
**Description:** Collect Gatekeeper details
**Category:** System
**Platform:** macos
**Short Name:** gatek
**Is Parsed:** Yes
**Sent to Investigation Hub:** Yes
**Collect File(s):** No
## Background
Gatekeeper is macOS's security feature that controls which applications can run on the system. This data is essential for understanding application security policies, detecting bypassed controls, and investigating application-based incidents.
## Data Collected
This collector gathers structured data about gatekeeper.
### Gatekeeper Data
| Field | Description | Example |
|-------|-------------|---------|
| `AssessmentEnabled` | Assessment Enabled | 123 |
| `DevIDEnabled` | Dev ID Enabled | 123 |
| `Version` | Version | Example value |
| `OpaqueVersion` | Opaque Version | Example value |
## Collection Method
This collector queries the `gatekeeper` table via osquery and collects related policy files under `/var/db/SystemPolicyConfiguration/`.
## Forensic Value
This evidence is crucial for forensic investigations as it reveals Gatekeeper configuration and state, helping identify weakened protections or policy tampering.
---
# Homebrew Logs
> Source: https://kb.binalyze.ai/air/features/acquisition/supported-evidence/macos-collections-detail/homebrew-logs.html
## Overview
**Evidence:** Homebrew Logs
**Description:** Collect Homebrew Logs
**Category:** Applications
**Platform:** macos
**Short Name:** hmbwl
**Is Parsed:** No
**Sent to Investigation Hub:** No
**Collect File(s):** Yes
## Background
Homebrew is a popular package manager for macOS that logs all package installations, updates, and operations. These logs track what software was installed via Homebrew, when, and any errors encountered during package management.
## Data Collected
This collector gathers structured data about homebrew logs.
## Collection Method
This collector gathers all Homebrew log files from user-specific Library/Logs/Homebrew directories, which contain detailed package management activity including installations, updates, and configurations.
## Forensic Value
Homebrew logs are essential for tracking software installations, identifying unauthorized tool deployments, understanding attacker tool setup, and investigating system modifications. They reveal what hacking tools, utilities, or malicious packages were installed.
---
# IDE Extensions
> Source: https://kb.binalyze.ai/air/features/acquisition/supported-evidence/macos-collections-detail/ide-extensions.html
## Overview
**Evidence:** IDE Extensions
**Description:** Collect installed IDE extension and plugin metadata
**Category:** Applications
**Platform:** macos
**Short Name:** ideext
**Is Parsed:** Yes
**Sent to Investigation Hub:** Yes
**Collect File(s):** No
## Background
IDE extensions execute with the same privileges as the developer's editor and can read workspace files, access credentials, exfiltrate code, inject backdoors into builds, and persist across sessions. Malicious VS Code-compatible extensions and JetBrains plugins are a proven initial-access and persistence vector.
## Data Collected
This collector gathers structured metadata about installed IDE extensions and plugins, including identity, publisher, version, activation events, marketplace provenance, install scripts, and directory or manifest mismatches that suggest tampering. VS Code-compatible results are recorded in `ide_extensions_vscode`; JetBrains results in `ide_extensions_jetbrains`.
## Collection Method
This collector scans per-user IDE extension directories for VS Code-compatible editors (VS Code, Insiders, Server, Cursor, Devin, Windsurf, VSCodium, Antigravity) and JetBrains IDEs. It parses package.json manifests and plugin.xml metadata without executing extension code. For JetBrains JAR plugins, it reads META-INF/plugin.xml from the archive.
## Forensic Value
Extension metadata reveals unauthorized, sideloaded, or tampered extensions; broad activation events indicating startup persistence; missing marketplace provenance; directory and manifest identity mismatches suggesting post-install modification; and extension dependency chains that may introduce transitive supply-chain risk.
---
# iMessage
> Source: https://kb.binalyze.ai/air/features/acquisition/supported-evidence/macos-collections-detail/imessage.html
## Overview
**Evidence:** iMessage
**Description:** Collect iMessages
**Category:** System
**Platform:** macos
**Short Name:** imsg
**Is Parsed:** Yes
**Sent to Investigation Hub:** Yes
**Collect File(s):** Yes
## Background
iMessage chat database stores messages, attachments, and metadata per user. This data is essential for communications analysis and timeline reconstruction.
## Data Collected
This collector gathers structured data about imessage.
### iMessage Data
| Field | Description | Example |
|-------|-------------|---------|
| `User` | User | Example value |
| `MessageID` | Message ID | 123 |
| `Conversation` | Conversation | 123 |
| `Text` | Text | Example value |
| `Contact` | Contact | Example value |
| `Direction` | Direction | Example value |
| `Account` | Account | Example value |
| `Date` | Date | 2023-10-15 14:30:25+03:00 |
| `DateRead` | Date Read | 2023-10-15 14:30:25+03:00 |
| `DateDelivered` | Date Delivered | 2023-10-15 14:30:25+03:00 |
| `IsFromMe` | Is From Me | 123 |
| `IsRead` | Is Read | 123 |
| `DestinationCallerID` | Destination Caller ID | Example value |
| `AttachmentPath` | Attachment Path | Example value |
| `AttachmentName` | Attachment Name | Example value |
| `AttachmentSize` | Attachment Size | 123 |
## Collection Method
This collector copies user `chat.db` files and queries messages, attachments, and related tables, recording into `imessage`.
## Forensic Value
This evidence is crucial for forensic investigations as it reveals communications content, participants, and attachment artifacts.
---
# Install Logs
> Source: https://kb.binalyze.ai/air/features/acquisition/supported-evidence/macos-collections-detail/install-logs.html
## Overview
**Evidence:** Install Logs
**Description:** Collect Install Logs
**Category:** System
**Platform:** macos
**Short Name:** instl
**Is Parsed:** No
**Sent to Investigation Hub:** No
**Collect File(s):** Yes
## Background
macOS install logs record software installation activities including package installations, updates, and application deployments. These logs track what software was installed, when, and by whom.
## Data Collected
This collector gathers structured data about install logs.
## Collection Method
This collector gathers installation log files from /var/log/install*, which contains records of all software installations and updates performed on the system.
## Forensic Value
Install logs are valuable for tracking unauthorized software installations, understanding system configuration changes, identifying malicious software deployment, and establishing timelines of system modifications.
---
# Installed Applications
> Source: https://kb.binalyze.ai/air/features/acquisition/supported-evidence/macos-collections-detail/installed-applications.html
## Overview
**Evidence:** Installed Applications
**Description:** Collect info on installed apps
**Category:** System
**Platform:** macos
**Short Name:** apps
**Is Parsed:** Yes
**Sent to Investigation Hub:** Yes
**Collect File(s):** No
## Background
This collector gathers installed applications information from macOS, including bundle identifiers, versions, signatures, and entitlements. This data is essential for understanding software inventory, detecting unauthorized installs, and investigating persistence.
## Data Collected
This collector gathers structured data about installed applications.
### Installed Applications Data
| Field | Description | Example |
|-------|-------------|---------|
| `DisplayName` | Display Name | Example value |
| `AppName` | App Name | Example value |
| `Path` | Path | Example value |
| `Environment` | Environment | Example value |
| `Element` | Element | Example value |
| `BundleExecutable` | Bundle Executable | Example value |
| `BundleIdentifier` | Bundle Identifier | Example value |
| `BundleName` | Bundle Name | Example value |
| `BundleVersion` | Bundle Version | Example value |
| `LastChangeTime` | Last Change Time | 2023-10-15 14:30:25+03:00 |
| `AccessTime` | Access Time | 2023-10-15 14:30:25+03:00 |
| `ModificationTime` | Modification Time | 2023-10-15 14:30:25+03:00 |
| `LastOpenedTime` | Last Opened Time | 2023-10-15 14:30:25+03:00 |
| `Hash` | Hash | Example value |
| `SizeInBytes` | Size In Bytes | 123 |
| `DisableLibraryValidation` | Disable Library Validation | true |
| `DyldEnvVariables` | Dyld Env Variables | true |
| `SignatureInfo` | Signature Info | Example value |
| `DynamicLibraries` | Dynamic Libraries | [] |
## Collection Method
This collector queries the `apps` table via osquery and augments results with file metadata and signature details.
## Forensic Value
This evidence is crucial for forensic investigations as it highlights installed software, execution history, and code signing state, aiding detection of malicious or untrusted apps.
---
# IP Routes
> Source: https://kb.binalyze.ai/air/features/acquisition/supported-evidence/macos-collections-detail/ip-routes.html
## Overview
**Evidence:** IP Routes
**Description:** Collect IP Routes
**Category:** Network
**Platform:** macos
**Short Name:** iprts
**Is Parsed:** Yes
**Sent to Investigation Hub:** Yes
**Collect File(s):** No
## Background
macOS routing table entries reveal how the system forwards traffic. This data is essential for understanding network topology, default gateways, and investigating potential redirections.
## Data Collected
This collector gathers structured data about ip routes.
## Collection Method
This collector queries the `routes` table via osquery and records results into the `ip_routes` table.
## Forensic Value
This evidence is crucial for forensic investigations as it helps detect malicious routing changes, misconfigurations, and suspicious gateways.
---
# Kernel Extensions Info
> Source: https://kb.binalyze.ai/air/features/acquisition/supported-evidence/macos-collections-detail/kernel-extensions-info.html
## Overview
**Evidence:** Kernel Extensions Info
**Description:** Collect kernel extensions info
**Category:** System
**Platform:** macos
**Short Name:** kext
**Is Parsed:** Yes
**Sent to Investigation Hub:** Yes
**Collect File(s):** No
## Background
Kernel extensions (kexts) extend the macOS kernel with drivers and low-level components. This data is essential for detecting rootkits, unauthorized kernel modifications, and risky third‑party drivers.
## Data Collected
This collector gathers structured data about kernel extensions info.
### Kernel Extensions Info Data
| Field | Description | Example |
|-------|-------------|---------|
| `IDx` | I Dx | 123 |
| `Refs` | Refs | 123 |
| `MemorySize` | Memory Size | 123 |
| `Name` | Name | Example value |
| `Version` | Version | Example value |
| `LinkedAgainst` | Linked Against | Example value |
| `Path` | Path | Example value |
| `LastChangeTime` | Last Change Time | 2023-10-15 14:30:25+03:00 |
| `AccessTime` | Access Time | 2023-10-15 14:30:25+03:00 |
| `ModificationTime` | Modification Time | 2023-10-15 14:30:25+03:00 |
| `Hash` | Hash | Example value |
| `BinaryPath` | Binary Path | Example value |
| `SizeInBytes` | Size In Bytes | 123 |
## Collection Method
This collector queries the `kernel_extensions` table via osquery and enriches results with file metadata and hashes.
## Forensic Value
This evidence is crucial for forensic investigations as it surfaces loaded kernel extensions, enabling detection of persistence, unsigned drivers, and tampering with the kernel.
---
# Kernel Extensions
> Source: https://kb.binalyze.ai/air/features/acquisition/supported-evidence/macos-collections-detail/kernel-extensions.html
## Overview
**Evidence:** Kernel Extensions
**Description:** Filter kernel extension events
**Category:** System
**Platform:** macos
**Short Name:** kxt
**Is Parsed:** Yes
**Sent to Investigation Hub:** Yes
**Collect File(s):** No
## Background
Kernel extensions (kexts) are loadable kernel modules that extend macOS kernel functionality. The kextd daemon manages loading, unloading, and validation of kernel extensions. IOKit events capture hardware driver interactions and kernel-level system modifications.
## Data Collected
This collector gathers structured data about kernel extensions.
## Collection Method
This collector uses the macOS 'log' command with predicate-based filtering to extract kextd process events from IOKit over the last 3 days. Log entries are parsed from JSON format and stored in the unified_logs table with PredicateType='Kernel Extensions'.
## Forensic Value
Kernel extension logs are essential for investigating rootkits, kernel-level malware, unauthorized drivers, and system-level compromise. They reveal what kernel modules were loaded, which can indicate advanced persistent threats, bootkit infections, or malicious driver installations used for defense evasion.
---
# Keyboard Dictionary
> Source: https://kb.binalyze.ai/air/features/acquisition/supported-evidence/macos-collections-detail/keyboard-dictionary.html
## Overview
**Evidence:** Keyboard Dictionary
**Description:** Collects the list of words in the keyboard dictionary
**Category:** System
**Platform:** macos
**Short Name:** keydict
**Is Parsed:** Yes
**Sent to Investigation Hub:** Yes
**Collect File(s):** No
## Background
Keyboard dictionary entries contain user-added words for autocorrect. This data is essential for profiling user terminology and contextualizing typed content.
## Data Collected
This collector gathers structured data about keyboard dictionary.
## Collection Method
This collector reads each user's `LocalDictionary` file and records entries into `keyboard_dictionary`.
## Forensic Value
This evidence is crucial for forensic investigations as it can indicate custom vocabulary relevant to the case and user behavior.
---
# Keychain
> Source: https://kb.binalyze.ai/air/features/acquisition/supported-evidence/macos-collections-detail/keychain.html
## Overview
**Evidence:** Keychain
**Description:** Filter keychain unlock events
**Category:** System
**Platform:** macos
**Short Name:** kch
**Is Parsed:** Yes
**Sent to Investigation Hub:** Yes
**Collect File(s):** No
## Background
The macOS Keychain stores sensitive information including passwords, certificates, and encryption keys. The loginwindow process interacts with the Security framework to unlock keychains during user login and authentication. These events track keychain access and unlock attempts.
## Data Collected
This collector gathers structured data about keychain.
## Collection Method
This collector uses the macOS 'log' command with predicate-based filtering to extract loginwindow Security framework events over the last 3 days. Log entries are parsed from JSON format and stored in the unified_logs table with PredicateType='Keychain'.
## Forensic Value
Keychain events are important for investigating credential theft, unauthorized access to stored secrets, password dumping attempts, and suspicious authentication patterns. They reveal when keychains were unlocked, accessed, or modified, helping detect credential harvesting and unauthorized secret access.
---
# KnowledgeC
> Source: https://kb.binalyze.ai/air/features/acquisition/supported-evidence/macos-collections-detail/knowledgec.html
## Overview
**Evidence:** KnowledgeC
**Description:** Collect KnowledgeC Database
**Category:** System
**Platform:** macos
**Short Name:** kcdb
**Is Parsed:** No
**Sent to Investigation Hub:** No
**Collect File(s):** Yes
## Background
KnowledgeC is a macOS database that stores user activity data including application usage, device connections, media playback, location data, and system events. It's part of Apple's CoreDuet framework used for Siri suggestions and system intelligence.
## Data Collected
This collector gathers structured data about knowledgec.
## Collection Method
This collector gathers the KnowledgeC database and related files from each user's Library/Application Support/Knowledge directory, which contains comprehensive user activity tracking data.
## Forensic Value
KnowledgeC is extremely valuable for forensic investigations, providing detailed user activity timelines, application usage patterns, device connections, location history, and user behavior analysis. It's one of the richest data sources on macOS for understanding user actions.
---
# Launchd Files
> Source: https://kb.binalyze.ai/air/features/acquisition/supported-evidence/macos-collections-detail/launchd-files.html
## Overview
**Evidence:** Launchd Files
**Description:** Collect all launchd plist files from system directories
**Category:** System
**Platform:** macos
**Short Name:** lnchdf
**Is Parsed:** No
**Sent to Investigation Hub:** Yes
**Collect File(s):** Yes
## Background
Launchd plists define daemons and agents on macOS. This data is essential for auditing startup items, detecting persistence, and verifying service configurations.
## Data Collected
This collector gathers structured data about launchd files.
## Collection Method
This collector enumerates known LaunchAgents and LaunchDaemons directories, copies .plist files to content, and records file metadata into the `launchd_files` table.
## Forensic Value
This evidence is crucial for forensic investigations as it exposes auto-run configurations and modifications that may indicate malicious persistence.
---
# Launchd Overrides
> Source: https://kb.binalyze.ai/air/features/acquisition/supported-evidence/macos-collections-detail/launchd-overrides.html
## Overview
**Evidence:** Launchd Overrides
**Description:** Collect override keys for LaunchDaemons and Agents
**Category:** System
**Platform:** macos
**Short Name:** launchdo
**Is Parsed:** Yes
**Sent to Investigation Hub:** Yes
**Collect File(s):** No
## Background
Launchd overrides adjust behavior of daemons and agents without modifying the original plist. This data is essential for detecting persistence and unexpected service behavior.
## Data Collected
This collector gathers structured data about launchd overrides.
### Launchd Overrides Data
| Field | Description | Example |
|-------|-------------|---------|
| `Name` | Name | Example value |
| `Path` | Path | Example value |
| `Label` | Label | Example value |
| `Program` | Program | Example value |
| `RunAtLoad` | Run At Load | Example value |
| `KeepAlive` | Keep Alive | Example value |
| `OnDemand` | On Demand | Example value |
| `Disabled` | Disabled | Example value |
| `UserName` | User Name | Example value |
| `GroupName` | Group Name | Example value |
| `StdoutPath` | Stdout Path | Example value |
| `StderrPath` | Stderr Path | Example value |
| `StartInterval` | Start Interval | Example value |
| `Arguments` | Arguments | Example value |
| `WatchPaths` | Watch Paths | Example value |
| `QueueDirs` | Queue Dirs | Example value |
| `InetdCompatibility` | Inetd Compatibility | Example value |
| `StartOnMount` | Start On Mount | Example value |
| `RootDir` | Root Dir | Example value |
| `Cwd` | Cwd | Example value |
| `ProcessType` | Process Type | Example value |
| `Ctime` | Ctime | 123 |
| `Atime` | Atime | 123 |
| `Mtime` | Mtime | 123 |
| `Hash` | Hash | Example value |
| `SizeInBytes` | Size In Bytes | 123 |
| `LastChangeTime` | Last Change Time | 2023-10-15 14:30:25+03:00 |
| `AccessTime` | Access Time | 2023-10-15 14:30:25+03:00 |
| `ModificationTime` | Modification Time | 2023-10-15 14:30:25+03:00 |
## Collection Method
This collector queries the `launchd_overrides` table via osquery and records results into the `launchd_overrides` table.
## Forensic Value
This evidence is crucial for forensic investigations as it reveals overridden settings that may disable or enable services to aid attacker persistence or evasion.
---
# Listening Ports
> Source: https://kb.binalyze.ai/air/features/acquisition/supported-evidence/macos-collections-detail/listening-ports.html
## Overview
**Evidence:** Listening Ports
**Description:** Collect Listening Ports
**Category:** Network
**Platform:** macos
**Short Name:** lport
**Is Parsed:** Yes
**Sent to Investigation Hub:** Yes
**Collect File(s):** No
## Background
Listening ports reveal network services exposed by the macOS host. This data is essential for identifying unauthorized services, backdoors, and network‑facing attack surface.
## Data Collected
This collector gathers structured data about listening ports.
### Listening Ports Data
| Field | Description | Example |
|-------|-------------|---------|
| `PID` | PID | 123 |
| `Port` | Port | 123 |
| `Protocol` | Protocol | 123 |
| `Family` | Family | 123 |
| `Address` | Address | Example value |
| `FileDescriptor` | File Descriptor | 123 |
| `Socket` | Socket | 123 |
| `Path` | Path | Example value |
## Collection Method
This collector queries the `listening_ports` table via osquery and records results into `listening_ports`.
## Forensic Value
This evidence is crucial for forensic investigations as it correlates processes with ports, enabling detection of rogue services and covert listeners.
---
# Logged Users
> Source: https://kb.binalyze.ai/air/features/acquisition/supported-evidence/macos-collections-detail/logged-users.html
## Overview
**Evidence:** Logged Users
**Description:** Collect Logged Users
**Category:** System
**Platform:** macos
**Short Name:** lusrs
**Is Parsed:** Yes
**Sent to Investigation Hub:** Yes
**Collect File(s):** No
## Background
This collector gathers logged users information from the macOS system. This data is essential for understanding system activity, detecting security incidents, and investigating system-related events.
## Data Collected
This collector gathers structured data about logged users.
### Logged Users Data
| Field | Description | Example |
|-------|-------------|---------|
| `Type` | Type | Example value |
| `Username` | Username | Example value |
| `Tty` | Tty | Example value |
| `Host` | Host | Example value |
| `Time` | Time | 2023-10-15 14:30:25+03:00 |
| `ProcessId` | Process Id | 123 |
## Collection Method
This collector queries the `logged_in_users` table via osquery and records results into the `logged_users` table.
## Forensic Value
This evidence is crucial for forensic investigations as it reveals active and recent user sessions, helping identify unauthorized access, lateral movement, and account misuse.
---
# Login Hooks
> Source: https://kb.binalyze.ai/air/features/acquisition/supported-evidence/macos-collections-detail/login-hooks.html
## Overview
**Evidence:** Login Hooks
**Description:** Collect Login Hooks
**Category:** System
**Platform:** macos
**Short Name:** lihks
**Is Parsed:** Yes
**Sent to Investigation Hub:** Yes
**Collect File(s):** No
## Background
Login Hooks are a legacy macOS persistence mechanism that allows administrators to specify scripts or applications to be executed automatically when a user logs in. These hooks are configured in /Library/Preferences/com.apple.loginwindow.plist and execute with the privileges of the logged-in user. While deprecated in favor of LaunchAgents, Login Hooks remain a viable persistence method for both legitimate administrative tasks and malicious activity.
## Data Collected
This collector gathers structured data about login hooks.
## Collection Method
This collector reads the com.apple.loginwindow.plist file and extracts the LoginHook key value, which specifies the path to the executable or script that runs at login. It also captures file metadata including modification, access, and change timestamps to help establish a timeline of hook configuration changes.
## Forensic Value
Login Hooks are a critical persistence indicator and often abused by malware for maintaining access to compromised systems. Monitoring Login Hooks helps detect unauthorized persistence mechanisms, backdoors, and malicious scripts configured to execute at user login. The timestamps provide valuable timeline information for incident response. Unusual or unsigned executables in Login Hooks are strong indicators of compromise and should be investigated immediately.
---
# Login Items
> Source: https://kb.binalyze.ai/air/features/acquisition/supported-evidence/macos-collections-detail/login-items.html
## Overview
**Evidence:** Login Items
**Description:** Collect Login Items
**Category:** System
**Platform:** macos
**Short Name:** litms
**Is Parsed:** Yes
**Sent to Investigation Hub:** Yes
**Collect File(s):** No
## Background
Login Items configure applications to start automatically upon user login. This data is essential for detecting persistence and unwanted auto-start programs.
## Data Collected
This collector gathers structured data about login items.
### Login Items Data
| Field | Description | Example |
|-------|-------------|---------|
| `Item` | Item | Example value |
| `Path` | Path | Example value |
| `Active` | Active | true |
## Collection Method
This collector uses AppleScript via `osascript` to enumerate login items and their paths, recording them into `login_items`.
## Forensic Value
This evidence is crucial for forensic investigations as it reveals user-level persistence and startup behavior.
---
# Logind
> Source: https://kb.binalyze.ai/air/features/acquisition/supported-evidence/macos-collections-detail/logind.html
## Overview
**Evidence:** Logind
**Description:** Filter user login events
**Category:** System
**Platform:** macos
**Short Name:** lgnd
**Is Parsed:** Yes
**Sent to Investigation Hub:** Yes
**Collect File(s):** No
## Background
The logind process on macOS manages user login sessions and authentication events. It handles local and remote login attempts, session creation, and user credential validation. These events are critical for tracking user access to the system.
## Data Collected
This collector gathers structured data about logind.
## Collection Method
This collector uses the macOS 'log' command with predicate-based filtering to extract logind process events over the last 3 days. Log entries are parsed from JSON format and stored in the unified_logs table with PredicateType='Logind'.
## Forensic Value
Logind events are essential for investigating unauthorized access attempts, credential abuse, session hijacking, and establishing user activity timelines. They reveal login times, authentication methods, failed attempts, and session details crucial for incident response and user access auditing.
---
# Logout Hooks
> Source: https://kb.binalyze.ai/air/features/acquisition/supported-evidence/macos-collections-detail/logout-hooks.html
## Overview
**Evidence:** Logout Hooks
**Description:** Collect Logout Hooks
**Category:** System
**Platform:** macos
**Short Name:** lohks
**Is Parsed:** Yes
**Sent to Investigation Hub:** Yes
**Collect File(s):** No
## Background
Logout Hooks are a legacy macOS mechanism that allows administrators to specify scripts or applications to be executed automatically when a user logs out. Similar to Login Hooks, these are configured in /Library/Preferences/com.apple.loginwindow.plist and execute with user privileges. While deprecated, Logout Hooks can be exploited for data exfiltration, log clearing, evidence destruction, or maintaining persistence by cleaning up traces during logout.
## Data Collected
This collector gathers structured data about logout hooks.
## Collection Method
This collector reads the com.apple.loginwindow.plist file and extracts the LogoutHook key value, which specifies the path to the executable or script that runs at logout. It captures file metadata including modification, access, and change timestamps to help establish when the hook was configured or modified.
## Forensic Value
Logout Hooks are particularly valuable for detecting anti-forensic activities, as malicious actors often use logout scripts to clear logs, delete artifacts, or exfiltrate data before system shutdown. Monitoring Logout Hooks helps identify data exfiltration mechanisms, log tampering, and evidence destruction attempts. Unauthorized Logout Hooks may indicate advanced persistent threats attempting to cover their tracks or maintain operational security.
---
# Mail Rules
> Source: https://kb.binalyze.ai/air/features/acquisition/supported-evidence/macos-collections-detail/mail-rules.html
## Overview
**Evidence:** Mail Rules
**Description:** Collect Mail Rules that contain AppleScript
**Category:** System
**Platform:** macos
**Short Name:** mrls
**Is Parsed:** Yes
**Sent to Investigation Hub:** Yes
**Collect File(s):** No
## Background
Apple Mail rules can trigger AppleScripts on incoming mail. This data is essential for detecting malicious scripts used for persistence, exfiltration, or auto‑actions.
## Data Collected
This collector gathers structured data about mail rules.
### Mail Rules Data
| Field | Description | Example |
|-------|-------------|---------|
| `User` | User | Example value |
| `RulePath` | Rule Path | Example value |
| `Key` | Key | Example value |
| `Script` | Script | Example value |
| `ScriptPath` | Script Path | Example value |
## Collection Method
This collector searches for `SyncedRules.plist` files, extracts AppleScript rule entries, and records them into `mail_rules`.
## Forensic Value
This evidence is crucial for forensic investigations as it reveals script execution hooks configured in Mail, a known persistence vector.
---
# Media Now Playing
> Source: https://kb.binalyze.ai/air/features/acquisition/supported-evidence/macos-collections-detail/media-now-playing.html
## Overview
**Evidence:** Media Now Playing
**Description:** Collect Media Now Playing
**Category:** System
**Platform:** macos
**Short Name:** medianp
**Is Parsed:** Yes
**Sent to Investigation Hub:** Yes
**Collect File(s):** No
## Background
The KnowledgeC now-playing stream records media playback events with the playing application and, where available, the track title, artist, and album.
## Data Collected
This collector gathers structured data about media now playing, including the application, media metadata, and timing. Results are recorded in `media_now_playing`.
## Collection Method
This collector reads KnowledgeC databases under user profiles and records now-playing events into `media_now_playing`.
## Forensic Value
Media playback ties a user to the device at specific times and can reveal applications and content in use during an incident window.
---
# Manuel Configuration Profile Install
> Source: https://kb.binalyze.ai/air/features/acquisition/supported-evidence/macos-collections-detail/manuel-configuration-profile-install.html
## Overview
**Evidence:** Manuel Configuration Profile Install
**Description:** Filter MDM Clients Events
**Category:** System
**Platform:** macos
**Short Name:** mcpi
**Is Parsed:** Yes
**Sent to Investigation Hub:** Yes
**Collect File(s):** No
## Background
Mobile Device Management (MDM) configuration profiles control system settings, security policies, and restrictions on macOS. The mdmclient process manages profile installations. Manual profile installations (not pushed by MDM) can indicate unauthorized system modifications or security policy bypasses.
## Data Collected
This collector gathers structured data about manuel configuration profile install.
## Collection Method
This collector uses the macOS 'log' command with predicate-based filtering to extract manual configuration profile installation events from the MDM daemon over the last 3 days. Log entries are parsed from JSON format and stored in the unified_logs table with PredicateType='Manuel Configuration Profile Install'.
## Forensic Value
Manual MDM profile installations are suspicious and can indicate privilege escalation, security policy bypass, persistence mechanism installation, or unauthorized system modifications. They reveal configuration changes that may enable malicious activity, disable security features, or establish attacker persistence.
---
# MongoDB Logs
> Source: https://kb.binalyze.ai/air/features/acquisition/supported-evidence/macos-collections-detail/mongodb-logs.html
## Overview
**Evidence:** MongoDB Logs
**Description:** Collect MongoDB Logs
**Category:** Applications
**Platform:** macos
**Short Name:** mngl
**Is Parsed:** No
**Sent to Investigation Hub:** No
**Collect File(s):** Yes
## Background
MongoDB database logs on macOS record database operations, queries, connections, authentication attempts, and errors. These logs vary by installation method including system, Homebrew Intel, and Homebrew Apple Silicon installations.
## Data Collected
This collector gathers structured data about mongodb logs.
## Collection Method
This collector gathers MongoDB logs from multiple installation locations including system directories and various Homebrew installation paths for both Intel and Apple Silicon Macs.
## Forensic Value
MongoDB logs are valuable for investigating database breaches, unauthorized data access, injection attacks, authentication failures, and data exfiltration. They reveal query patterns, connection sources, and database compromise indicators.
---
# Most Recently Used (MRU)
> Source: https://kb.binalyze.ai/air/features/acquisition/supported-evidence/macos-collections-detail/most-recently-used-mru.html
## Overview
**Evidence:** Most Recently Used (MRU)
**Description:** Collect Most Recently Used (MRU) items
**Category:** System
**Platform:** macos
**Short Name:** mru
**Is Parsed:** Yes
**Sent to Investigation Hub:** Yes
**Collect File(s):** No
## Background
MRU data in Finder and app containers captures recently accessed folders, copies/moves, and secure bookmarks. This data is essential for reconstructing user file access and movement.
## Data Collected
This collector gathers structured data about most recently used (mru).
### Most Recently Used (MRU) Data
| Field | Description | Example |
|-------|-------------|---------|
| `User` | User | Example value |
| `SourceFile` | Source File | Example value |
| `SourceName` | Source Name | Example value |
| `SourceKey` | Source Key | Example value |
| `Name` | Name | Example value |
| `URL` | URL | Example value |
## Collection Method
This collector parses Finder and sidebar plists and secure bookmarks, extracting recent items into `most_recently_used`.
## Forensic Value
This evidence is crucial for forensic investigations as it shows recent file interactions and locations, supporting timeline and exfiltration analysis.
---
# Mount
> Source: https://kb.binalyze.ai/air/features/acquisition/supported-evidence/macos-collections-detail/mount.html
## Overview
**Evidence:** Mount
**Description:** Collects the list of mounted filesystems.
**Category:** DiskFilesystem
**Platform:** macos
**Short Name:** mnt
**Is Parsed:** Yes
**Sent to Investigation Hub:** Yes
**Collect File(s):** No
## Background
This collector gathers mount information from the macOS system. This data is essential for understanding storage configuration, detecting unauthorized mounts, and investigating storage-related incidents.
## Data Collected
This collector gathers structured data about mount.
### Mount Data
| Field | Description | Example |
|-------|-------------|---------|
| `ID` | ID | 123 |
| `Device` | Device | Example value |
| `MountPoint` | Mount Point | Example value |
| `FileSystem` | File System | Example value |
| `Options` | Options | Example value |
## Collection Method
This collector invokes the `mount` command and parses its output to record entries in the `mount` table.
## Forensic Value
This evidence is crucial for forensic investigations as it provides visibility into mounted devices, file systems, and options that may reveal persistence or data exfiltration paths.
---
# MySQL Logs
> Source: https://kb.binalyze.ai/air/features/acquisition/supported-evidence/macos-collections-detail/mysql-logs.html
## Overview
**Evidence:** MySQL Logs
**Description:** Collect MySQL Logs
**Category:** Applications
**Platform:** macos
**Short Name:** myl
**Is Parsed:** No
**Sent to Investigation Hub:** No
**Collect File(s):** Yes
## Background
MySQL database server logs on macOS capture database queries, errors, slow queries, authentication events, and server operations. Log locations vary based on installation method (system, Homebrew Intel, Homebrew Apple Silicon).
## Data Collected
This collector gathers structured data about mysql logs.
## Collection Method
This collector gathers MySQL logs from system directories and Homebrew installations, covering both Intel-based and Apple Silicon architectures, including user-specific Homebrew log directories.
## Forensic Value
MySQL logs are critical for investigating SQL injection attacks, unauthorized database access, data breaches, privilege escalation, and understanding database compromise. They provide query history, authentication attempts, and error patterns.
---
# Network Capture
> Source: https://kb.binalyze.ai/air/features/acquisition/supported-evidence/macos-collections-detail/network-capture.html
## Overview
**Evidence:** Network Capture
**Description:** Collect Network Capture
**Category:** System
**Platform:** macos
**Short Name:** nc
**Is Parsed:** No
**Sent to Investigation Hub:** Yes
**Collect File(s):** No
## Data Collected
This collector gathers structured data about network capture.
### Network Capture Data
| Field | Description | Example |
|-------|-------------|---------|
| `Timestamp` | Timestamp | Example value |
| `IPVersion` | IP Version | Example value |
| `Protocol` | Protocol | Example value |
| `SourceAddress` | Source Address | Example value |
| `DestinationAddress` | Destination Address | Example value |
| `InterfaceIndex` | Interface Index | 123 |
| `SourcePort` | Source Port | Example value |
| `DestinationPort` | Destination Port | Example value |
---
# Network Interfaces
> Source: https://kb.binalyze.ai/air/features/acquisition/supported-evidence/macos-collections-detail/network-interfaces.html
## Overview
**Evidence:** Network Interfaces
**Description:** Collect Network Interfaces
**Category:** Network
**Platform:** macos
**Short Name:** netint
**Is Parsed:** Yes
**Sent to Investigation Hub:** Yes
**Collect File(s):** No
## Background
macOS network interface information provides details about adapters, IP addresses, and configuration. This data is essential for understanding connectivity, detecting unauthorized network access, and investigating network incidents.
## Data Collected
This collector gathers structured data about network interfaces.
### Network Interfaces Data
| Field | Description | Example |
|-------|-------------|---------|
| `Interface` | Interface | Example value |
| `Address` | Address | Example value |
| `Mask` | Mask | Example value |
| `Broadcast` | Broadcast | Example value |
| `PointToPoint` | Point To Point | Example value |
| `Type` | Type | Example value |
## Collection Method
This collector queries the `interface_addresses` table via osquery and records results into the `network_interfaces` table.
## Forensic Value
This evidence is crucial for forensic investigations as it reveals interface configuration, aiding detection of rogue interfaces, unusual addressing, and network misconfigurations.
---
# Network Usage
> Source: https://kb.binalyze.ai/air/features/acquisition/supported-evidence/macos-collections-detail/network-usage.html
## Overview
**Evidence:** Network Usage
**Description:** Filter Network Usage Logs
**Category:** Network
**Platform:** macos
**Short Name:** netusagelogs
**Is Parsed:** Yes
**Sent to Investigation Hub:** Yes
**Collect File(s):** No
## Background
IPConfiguration manages network interface configurations on macOS including DHCP leases, WiFi connections (SSID associations), and network state changes. These logs track network connectivity events, IP address assignments, and wireless network transitions.
## Data Collected
This collector gathers structured data about network usage.
## Collection Method
This collector uses the macOS 'log' command with predicate-based filtering to extract IPConfiguration events related to SSIDs, DHCP leases, and network changes over the last 3 days. Log entries are parsed from JSON format and stored in the unified_logs table with PredicateType='Network Usage'.
## Forensic Value
Network usage logs help establish device location history through WiFi networks, track network-based lateral movement, identify suspicious network connections, and create timelines of system connectivity. They reveal what networks were accessed, when, and can indicate device movement or rogue network connections.
---
# NetworkFlow
> Source: https://kb.binalyze.ai/air/features/acquisition/supported-evidence/macos-collections-detail/networkflow.html
## Overview
**Evidence:** NetworkFlow
**Description:** Collect Network Flow
**Category:** System
**Platform:** macos
**Short Name:** nf
**Is Parsed:** No
**Sent to Investigation Hub:** Yes
**Collect File(s):** No
## Data Collected
This collector gathers structured data about networkflow.
---
# NGINX Logs
> Source: https://kb.binalyze.ai/air/features/acquisition/supported-evidence/macos-collections-detail/nginx-logs.html
## Overview
**Evidence:** NGINX Logs
**Description:** Collect NGINX Logs
**Category:** Applications
**Platform:** macos
**Short Name:** ngxl
**Is Parsed:** No
**Sent to Investigation Hub:** No
**Collect File(s):** Yes
## Background
NGINX web server logs on macOS capture HTTP requests, errors, and server activities. Like Apache, NGINX can be installed via system packages or Homebrew, resulting in multiple possible log locations.
## Data Collected
This collector gathers structured data about nginx logs.
## Collection Method
This collector gathers NGINX logs from system directories, Intel-based Homebrew installations, Apple Silicon Homebrew installations, and user-specific Homebrew log directories.
## Forensic Value
NGINX logs provide evidence of web attacks, API abuse, DDoS attempts, authentication failures, and suspicious request patterns. They're essential for investigating web-based compromises and analyzing attacker behavior.
---
# Notification Info
> Source: https://kb.binalyze.ai/air/features/acquisition/supported-evidence/macos-collections-detail/notification-info.html
## Overview
**Evidence:** Notification Info
**Description:** Collect Notification Info
**Category:** System
**Platform:** macos
**Short Name:** ntfc
**Is Parsed:** Yes
**Sent to Investigation Hub:** Yes
**Collect File(s):** No
## Background
Notification usage events from KnowledgeC record app notifications and durations. This data is essential for reconstructing user engagement and identifying suspicious or noisy apps.
## Data Collected
This collector gathers structured data about notification info.
## Collection Method
This collector reads KnowledgeC databases and runs a notification usage query, saving results into `notification_info`.
## Forensic Value
This evidence is crucial for forensic investigations as it ties notifications to apps and timelines, aiding behavior analysis and correlation.
---
# Opera Bookmarks
> Source: https://kb.binalyze.ai/air/features/acquisition/supported-evidence/macos-collections-detail/opera-bookmarks.html
## Overview
**Evidence:** Opera Bookmarks
**Description:** Collect Opera Bookmarks
**Category:** Applications
**Platform:** macos
**Short Name:** obkmrks
**Is Parsed:** Yes
**Sent to Investigation Hub:** Yes
**Collect File(s):** No
## Background
Browser bookmarks represent user-saved favorite websites and organizational folders. This data reveals frequently accessed sites, user interests, and potential indicators of reconnaissance, phishing targets, or suspicious infrastructure.
## Data Collected
This collector gathers structured data about opera bookmarks.
### Opera Bookmarks Data
| Field | Description | Example |
|-------|-------------|---------|
| `UserName` | User Name | Example value |
| `ProfileName` | Profile Name | Example value |
| `BrowserName` | Browser Name | Example value |
| `GUID` | GUID | Example value |
| `BookmarkID` | Bookmark ID | Example value |
| `Name` | Name | Example value |
| `Type` | Type | Example value |
| `URL` | URL | Example value |
| `ParentFolder` | Parent Folder | Example value |
| `DateAdded` | Date Added | 2023-10-15 14:30:25+03:00 |
| `DateLastUsed` | Date Last Used | 2023-10-15 14:30:25+03:00 |
| `DateModified` | Date Modified | 2023-10-15 14:30:25+03:00 |
## Collection Method
This collector parses the browser's Bookmarks file to extract saved URLs, folder structures, timestamps, and metadata.
## Forensic Value
Bookmark analysis identifies targeted websites, phishing pages, command-and-control servers, internal resources, and organizational reconnaissance patterns. Investigators can detect social engineering campaigns, credential harvesting attempts, and lateral movement preparation.
---
# Opera Browsing History
> Source: https://kb.binalyze.ai/air/features/acquisition/supported-evidence/macos-collections-detail/opera-browsing-history.html
## Overview
**Evidence:** Opera Browsing History
**Description:** Collect visited URLs from Opera
**Category:** Applications
**Platform:** macos
**Short Name:** ohst
**Is Parsed:** Yes
**Sent to Investigation Hub:** Yes
**Collect File(s):** No
## Background
Browser history records all websites visited by users, including URLs, page titles, visit timestamps, visit counts, and transition types. This data is essential for reconstructing user activity, identifying malicious websites, and tracking lateral movement or reconnaissance activities.
## Data Collected
This collector gathers structured data about opera browsing history.
### Opera Browsing History Data
| Field | Description | Example |
|-------|-------------|---------|
| `AccessTime` | Access Time | 2023-10-15 14:30:25+03:00 |
| `AccessCount` | Access Count | 123 |
| `URL` | URL | Example value |
| `Browser` | Browser | Example value |
| `Title` | Title | Example value |
| `VisitDuration` | Visit Duration | Example value |
| `Referrer` | Referrer | Example value |
| `TypedCount` | Typed Count | 123 |
| `IsHidden` | Is Hidden | true |
| `TransitionType` | Transition Type | Example value |
| `VisitID` | Visit ID | 123 |
| `TransitionQualifiers` | Transition Qualifiers | Example value |
| `User` | User | Example value |
| `Profile` | Profile | Example value |
| `HistoryFilePath` | History File Path | Example value |
## Collection Method
This collector queries the browser's History database to extract visited URLs, timestamps, referrer information, and user interaction patterns.
## Forensic Value
Browsing history reveals phishing sites, malicious domains, command-and-control servers, data exfiltration targets, and reconnaissance activities. Analysts can identify compromised credentials, track attacker infrastructure, and correlate web activity with other security events to establish attack timelines.
---
# Opera Cookies
> Source: https://kb.binalyze.ai/air/features/acquisition/supported-evidence/macos-collections-detail/opera-cookies.html
## Overview
**Evidence:** Opera Cookies
**Description:** Collect Opera Cookies
**Category:** Applications
**Platform:** macos
**Short Name:** ocookies
**Is Parsed:** Yes
**Sent to Investigation Hub:** Yes
**Collect File(s):** No
## Background
Browser cookies store session tokens, authentication credentials, user preferences, and tracking data. This data is essential for understanding authenticated sessions, tracking user activity across websites, and identifying session hijacking or credential theft.
## Data Collected
This collector gathers structured data about opera cookies.
### Opera Cookies Data
| Field | Description | Example |
|-------|-------------|---------|
| `UserName` | User Name | Example value |
| `BrowserName` | Browser Name | Example value |
| `ProfileName` | Profile Name | Example value |
| `Domain` | Domain | Example value |
| `Name` | Name | Example value |
| `Path` | Path | Example value |
| `Value` | Value | Example value |
| `IsSecure` | Is Secure | 123 |
| `IsHTTPOnly` | Is HTTP Only | 123 |
| `HasExpires` | Has Expires | 123 |
| `IsPersistent` | Is Persistent | 123 |
| `Priority` | Priority | 123 |
| `SameSite` | Same Site | 123 |
| `SourcePort` | Source Port | 123 |
| `SourceScheme` | Source Scheme | 123 |
| `CreationTime` | Creation Time | 2023-10-15 14:30:25+03:00 |
| `ExpiresTime` | Expires Time | 2023-10-15 14:30:25+03:00 |
| `LastAccessTime` | Last Access Time | 2023-10-15 14:30:25+03:00 |
## Collection Method
This collector extracts cookies from the browser's Cookies database, including domain, name, value, path, expiration, and security flags.
## Forensic Value
Cookie analysis reveals active sessions, authentication tokens, persistent tracking identifiers, and potential session hijacking. Investigators can identify stolen credentials, unauthorized access, and cross-site tracking used for reconnaissance or targeting.
---
# Opera Downloads
> Source: https://kb.binalyze.ai/air/features/acquisition/supported-evidence/macos-collections-detail/opera-downloads.html
## Overview
**Evidence:** Opera Downloads
**Description:** Collect Opera Downloads
**Category:** Applications
**Platform:** macos
**Short Name:** odwnlds
**Is Parsed:** Yes
**Sent to Investigation Hub:** Yes
**Collect File(s):** No
## Background
Browser download history records files downloaded by users, including file paths, timestamps, URLs, referrer information, and download status. This data is essential for tracking file acquisition, identifying potentially malicious downloads, and reconstructing user activity timelines.
## Data Collected
This collector gathers structured data about opera downloads.
### Opera Downloads Data
| Field | Description | Example |
|-------|-------------|---------|
| `UserName` | User Name | Example value |
| `Browser` | Browser | Example value |
| `ProfileName` | Profile Name | Example value |
| `URL` | URL | Example value |
| `TargetPath` | Target Path | Example value |
| `CurrentPath` | Current Path | Example value |
| `Referrer` | Referrer | Example value |
| `LastModified` | Last Modified | 2023-10-15 14:30:25+03:00 |
| `DangerType` | Danger Type | 123 |
| `Opened` | Opened | 123 |
| `TabURL` | Tab URL | Example value |
| `TabReferrerURL` | Tab Referrer URL | Example value |
| `StartTime` | Start Time | 2023-10-15 14:30:25+03:00 |
| `EndTime` | End Time | 2023-10-15 14:30:25+03:00 |
| `HistoryFilePath` | History File Path | Example value |
## Collection Method
This collector queries the browser's History database to extract download records, including file paths, download times, source URLs, and security flags.
## Forensic Value
Download history reveals malware delivery vectors, data exfiltration attempts, unauthorized software installation, and user interaction with suspicious websites. Analysts can identify downloaded malicious files, track attack chains, and correlate downloads with other security events.
---
# Opera Extensions
> Source: https://kb.binalyze.ai/air/features/acquisition/supported-evidence/macos-collections-detail/opera-extensions.html
## Overview
**Evidence:** Opera Extensions
**Description:** Collect Opera Extensions
**Category:** Applications
**Platform:** macos
**Short Name:** oext
**Is Parsed:** Yes
**Sent to Investigation Hub:** Yes
**Collect File(s):** No
## Background
Browser extensions enhance browser functionality but can pose significant security risks. Malicious extensions can steal credentials, inject ads, track browsing activity, exfiltrate data, and modify web content. Understanding installed extensions is crucial for detecting browser-based attacks and unauthorized access.
## Data Collected
This collector gathers structured data about opera extensions.
## Collection Method
This collector queries the browser's Extensions database or manifest files to extract installed extension information including names, IDs, versions, permissions, and installation sources.
## Forensic Value
Browser extensions provide insight into potential compromise vectors and data exfiltration paths. Malicious or suspicious extensions may indicate phishing attacks, credential theft, adware infections, or privacy violations. This evidence helps identify attack entry points, persistence mechanisms, and unauthorized browser modifications.
---
# Opera Favicons
> Source: https://kb.binalyze.ai/air/features/acquisition/supported-evidence/macos-collections-detail/opera-favicons.html
## Overview
**Evidence:** Opera Favicons
**Description:** Collect Opera Favicons
**Category:** Applications
**Platform:** macos
**Short Name:** ofico
**Is Parsed:** Yes
**Sent to Investigation Hub:** Yes
**Collect File(s):** No
## Background
Browser favicons are cached website icons that provide visual history of visited sites. This data supplements browsing history by revealing sites accessed even if history was deleted.
## Data Collected
This collector gathers structured data about opera favicons.
### Opera Favicons Data
| Field | Description | Example |
|-------|-------------|---------|
| `ID` | ID | 123 |
| `UserName` | User Name | Example value |
| `BrowserName` | Browser Name | Example value |
| `Profile` | Profile | Example value |
| `URL` | URL | Example value |
| `IconType` | Icon Type | 123 |
| `Path` | Path | Example value |
## Collection Method
This collector queries the browser's Favicons database to extract cached website icons and associated URLs.
## Forensic Value
Favicon analysis can recover evidence of deleted browsing history, identify visited sites through icon fingerprinting, and correlate with other browser artifacts to establish comprehensive activity timelines.
---
# Opera Form History
> Source: https://kb.binalyze.ai/air/features/acquisition/supported-evidence/macos-collections-detail/opera-form-history.html
## Overview
**Evidence:** Opera Form History
**Description:** Collect Opera Form History
**Category:** Applications
**Platform:** macos
**Short Name:** ofh
**Is Parsed:** Yes
**Sent to Investigation Hub:** Yes
**Collect File(s):** No
## Background
Browser form history stores previously entered form data including search queries, usernames, and other input fields. This data reveals user search patterns, account information, and potential data leakage through autofill.
## Data Collected
This collector gathers structured data about opera form history.
### Opera Form History Data
| Field | Description | Example |
|-------|-------------|---------|
| `UserName` | User Name | Example value |
| `BrowserName` | Browser Name | Example value |
| `Name` | Name | Example value |
| `Value` | Value | Example value |
| `ValueLower` | Value Lower | Example value |
| `Count` | Count | 123 |
| `Profile` | Profile | Example value |
| `Path` | Path | Example value |
| `DateCreated` | Date Created | 2023-10-15 14:30:25+03:00 |
| `DateLastUsed` | Date Last Used | 2023-10-15 14:30:25+03:00 |
## Collection Method
This collector queries the browser's form history database to extract saved form field data, search queries, and associated timestamps.
## Forensic Value
Form history exposes reconnaissance activities, credential enumeration attempts, search queries revealing attacker intent, and potentially sensitive information entered into web forms. Analysts can identify data exfiltration, account compromise indicators, and targeted search patterns.
---
# Opera Local Storage
> Source: https://kb.binalyze.ai/air/features/acquisition/supported-evidence/macos-collections-detail/opera-local-storage.html
## Overview
**Evidence:** Opera Local Storage
**Description:** Collect Opera Local Storage
**Category:** Applications
**Platform:** macos
**Short Name:** ols
**Is Parsed:** Yes
**Sent to Investigation Hub:** Yes
**Collect File(s):** No
## Background
Browser local storage contains persistent key-value data stored by websites. This data includes user preferences, session state, cached data, and potentially authentication tokens or sensitive information.
## Data Collected
This collector gathers structured data about opera local storage.
### Opera Local Storage Data
| Field | Description | Example |
|-------|-------------|---------|
| `UserName` | User Name | Example value |
| `ProfileName` | Profile Name | Example value |
| `BrowserName` | Browser Name | Example value |
| `Key` | Key | Example value |
| `Value` | Value | Example value |
| `Path` | Path | Example value |
## Collection Method
This collector extracts local storage data from browser storage databases and files.
## Forensic Value
Local storage analysis reveals stored credentials, session tokens, tracking identifiers, and application state that can indicate compromised accounts, persistent tracking, or malicious website activity. Analysts can identify credential theft, session hijacking, and data exfiltration attempts.
---
# Opera Login Data
> Source: https://kb.binalyze.ai/air/features/acquisition/supported-evidence/macos-collections-detail/opera-login-data.html
## Overview
**Evidence:** Opera Login Data
**Description:** Collect Opera Login Data
**Category:** Applications
**Platform:** macos
**Short Name:** olgd
**Is Parsed:** Yes
**Sent to Investigation Hub:** Yes
**Collect File(s):** No
## Background
Browser login data stores saved passwords and credential information. This data is critical for identifying stored credentials, password reuse patterns, and potential credential theft targets.
## Data Collected
This collector gathers structured data about opera login data.
### Opera Login Data Data
| Field | Description | Example |
|-------|-------------|---------|
| `ID` | ID | 123 |
| `UserName` | User Name | Example value |
| `BrowserName` | Browser Name | Example value |
| `OriginURL` | Origin URL | Example value |
| `SignonRealm` | Signon Realm | Example value |
| `BlacklistedByUser` | Blacklisted By User | 123 |
| `Scheme` | Scheme | Example value |
| `PasswordType` | Password Type | Example value |
| `TimesUsed` | Times Used | 123 |
| `Profile` | Profile | Example value |
| `Path` | Path | Example value |
| `DateCreated` | Date Created | 2023-10-15 14:30:25+03:00 |
| `DateLastUsed` | Date Last Used | 2023-10-15 14:30:25+03:00 |
## Collection Method
This collector extracts saved credentials from the browser's Login Data database, including URLs, usernames, and encrypted passwords.
## Forensic Value
Login data analysis reveals stored credentials, password reuse across services, targeted accounts, and potential credential harvesting. Investigators can identify compromised accounts, credential theft attempts, and unauthorized access to saved credentials by malware or attackers.
---
# Opera Sessions
> Source: https://kb.binalyze.ai/air/features/acquisition/supported-evidence/macos-collections-detail/opera-sessions.html
## Overview
**Evidence:** Opera Sessions
**Description:** Collect Opera Sessions
**Category:** Applications
**Platform:** macos
**Short Name:** opss
**Is Parsed:** Yes
**Sent to Investigation Hub:** Yes
**Collect File(s):** No
## Background
Browser sessions maintain active tab state, cookies, and authentication context. This data reveals currently active user sessions, open websites, and authenticated connections at the time of collection.
## Data Collected
This collector gathers structured data about opera sessions.
### Opera Sessions Data
| Field | Description | Example |
|-------|-------------|---------|
| `ID` | ID | 123 |
| `WindowID` | Window ID | 123 |
| `Active` | Active | true |
| `Url` | Url | Example value |
| `Title` | Title | Example value |
| `Deleted` | Deleted | true |
| `Group` | Group | Example value |
| `History` | History | [] |
| `BrowserName` | Browser Name | Example value |
## Collection Method
This collector captures browser session data including active tabs, session cookies, and authentication state.
## Forensic Value
Session analysis identifies active compromises, authenticated sessions to malicious sites, concurrent suspicious activities, and real-time indicators of ongoing attacks. Analysts can detect active C2 connections, authenticated malware communications, and live attacker sessions.
---
# Opera Thumbnails
> Source: https://kb.binalyze.ai/air/features/acquisition/supported-evidence/macos-collections-detail/opera-thumbnails.html
## Overview
**Evidence:** Opera Thumbnails
**Description:** Collect Opera Thumbnails
**Category:** Applications
**Platform:** macos
**Short Name:** othmb
**Is Parsed:** Yes
**Sent to Investigation Hub:** Yes
**Collect File(s):** No
## Background
Browser thumbnails are cached preview images of visited websites. This visual data supplements browsing history by providing screenshots of accessed pages, useful for recovering deleted history and identifying visited content.
## Data Collected
This collector gathers structured data about opera thumbnails.
### Opera Thumbnails Data
| Field | Description | Example |
|-------|-------------|---------|
| `UserName` | User Name | Example value |
| `Browser` | Browser | Example value |
| `URL` | URL | Example value |
| `URLRank` | URL Rank | 123 |
| `Title` | Title | Example value |
| `Profile` | Profile | Example value |
| `Path` | Path | Example value |
## Collection Method
This collector extracts cached thumbnail images from browser storage.
## Forensic Value
Thumbnail analysis provides visual evidence of visited websites, can recover evidence after history deletion, and helps identify phishing pages, malicious sites, or sensitive internal resources accessed by users through visual inspection.
---
# Opera User Profiles
> Source: https://kb.binalyze.ai/air/features/acquisition/supported-evidence/macos-collections-detail/opera-user-profiles.html
## Overview
**Evidence:** Opera User Profiles
**Description:** Collect Opera User Profiles
**Category:** Applications
**Platform:** macos
**Short Name:** oprfls
**Is Parsed:** Yes
**Sent to Investigation Hub:** Yes
**Collect File(s):** No
## Background
Browser user profiles store per-user browser configurations, extensions, settings, and data segregation. This data reveals multiple user accounts, profile switching patterns, and user-specific browsing behavior.
## Data Collected
This collector gathers structured data about opera user profiles.
### Opera User Profiles Data
| Field | Description | Example |
|-------|-------------|---------|
| `EndpointUserName` | Endpoint User Name | Example value |
| `Profile` | Profile | Example value |
| `ProfileUserName` | Profile User Name | Example value |
| `BrowserName` | Browser Name | Example value |
| `BackgroundApps` | Background Apps | true |
| `GoogleAccountGivenName` | Google Account Given Name | Example value |
| `GoogleAccountID` | Google Account ID | Example value |
| `GoogleAccountName` | Google Account Name | Example value |
| `PictureFileName` | Picture File Name | Example value |
| `LastDownloadedPictureURL` | Last Downloaded Picture URL | Example value |
| `HostedDomain` | Hosted Domain | Example value |
| `IsConsentedPrimaryAccount` | Is Consented Primary Account | true |
| `IsEphemeral` | Is Ephemeral | true |
## Collection Method
This collector enumerates browser user profiles and extracts profile metadata, configurations, and associated data paths.
## Forensic Value
Profile analysis identifies multiple user accounts, profile-specific extensions and configurations, shared device usage patterns, and potential privilege escalation or lateral movement using different browser profiles. Investigators can correlate activity across profiles and identify unauthorized profile creation.
---
# Opera Web Storage
> Source: https://kb.binalyze.ai/air/features/acquisition/supported-evidence/macos-collections-detail/opera-web-storage.html
## Overview
**Evidence:** Opera Web Storage
**Description:** Collect Opera Web Storage
**Category:** Applications
**Platform:** macos
**Short Name:** ows
**Is Parsed:** Yes
**Sent to Investigation Hub:** Yes
**Collect File(s):** No
## Background
Browser web storage includes both local and session storage used by websites to store client-side data. This data can contain application state, user preferences, cached content, and potentially sensitive information.
## Data Collected
This collector gathers structured data about opera web storage.
### Opera Web Storage Data
| Field | Description | Example |
|-------|-------------|---------|
| `UserName` | User Name | Example value |
| `ProfileName` | Profile Name | Example value |
| `BrowserName` | Browser Name | Example value |
| `Key` | Key | Example value |
| `Value` | Value | Example value |
| `Path` | Path | Example value |
## Collection Method
This collector extracts web storage data from browser storage locations including local storage and session storage.
## Forensic Value
Web storage analysis reveals cached application data, stored credentials, session information, and potential data exfiltration staging. Analysts can identify malicious website activity, stored authentication tokens, tracking identifiers, and sensitive data cached by compromised web applications.
---
# PCAP
> Source: https://kb.binalyze.ai/air/features/acquisition/supported-evidence/macos-collections-detail/pcap.html
## Overview
**Evidence:** PCAP
**Description:** Collect PCAP
**Category:** System
**Platform:** macos
**Short Name:** pp
**Is Parsed:** No
**Sent to Investigation Hub:** Yes
**Collect File(s):** No
## Data Collected
This collector gathers structured data about pcap.
---
# Package Install History
> Source: https://kb.binalyze.ai/air/features/acquisition/supported-evidence/macos-collections-detail/package-install-history.html
## Overview
**Evidence:** Package Install History
**Description:** Collect Package Install History
**Category:** System
**Platform:** macos
**Short Name:** pkghist
**Is Parsed:** Yes
**Sent to Investigation Hub:** Yes
**Collect File(s):** No
## Background
Package installation history tracks software installs by package IDs. This data is essential for change auditing, detecting unauthorized installs, and reconstructing software timelines.
## Data Collected
This collector gathers structured data about package install history.
### Package Install History Data
| Field | Description | Example |
|-------|-------------|---------|
| `PackageID` | Package ID | Example value |
| `Name` | Name | Example value |
| `Version` | Version | Example value |
| `Source` | Source | Example value |
| `ContentType` | Content Type | Example value |
| `Time` | Time | 2023-10-15 14:30:25+03:00 |
## Collection Method
This collector queries the `package_install_history` table via osquery and records into `package_install_histories`.
## Forensic Value
This evidence is crucial for forensic investigations as it reveals what was installed, when, and by whom, aiding attribution and scope analysis.
---
# Parallels Logs
> Source: https://kb.binalyze.ai/air/features/acquisition/supported-evidence/macos-collections-detail/parallels-logs.html
## Overview
**Evidence:** Parallels Logs
**Description:** Collect Parallels Logs
**Category:** Applications
**Platform:** macos
**Short Name:** prllgs
**Is Parsed:** No
**Sent to Investigation Hub:** No
**Collect File(s):** Yes
## Background
Parallels Desktop is a virtualization solution for macOS that runs Windows and other operating systems. It maintains logs of VM operations, errors, crashes, and problem reports in both user-specific and system-wide locations.
## Data Collected
This collector gathers structured data about parallels logs.
## Collection Method
This collector gathers Parallels logs from user Library directories (parallels.log and Problem Reports) and system-wide Library logs, capturing VM activities and diagnostic information.
## Forensic Value
Parallels logs are valuable for investigating VM-based attacks, malware analysis environments, data exfiltration through VMs, and understanding virtualized system activities. They reveal VM usage patterns, guest OS activities, and potential abuse of virtualization for evasion.
---
# PostgreSQL Logs
> Source: https://kb.binalyze.ai/air/features/acquisition/supported-evidence/macos-collections-detail/postgresql-logs.html
## Overview
**Evidence:** PostgreSQL Logs
**Description:** Collect PostgreSQL Logs
**Category:** Applications
**Platform:** macos
**Short Name:** pgrl
**Is Parsed:** No
**Sent to Investigation Hub:** No
**Collect File(s):** Yes
## Background
PostgreSQL database logs on macOS record database operations, queries, connections, authentication, and errors. Multiple PostgreSQL versions can coexist, and installation methods include system packages and Homebrew for different architectures.
## Data Collected
This collector gathers structured data about postgresql logs.
## Collection Method
This collector gathers PostgreSQL logs from system and Homebrew installations, supporting multiple PostgreSQL versions (postgresql, postgresql@14, etc.) across Intel and Apple Silicon architectures.
## Forensic Value
PostgreSQL logs are essential for investigating database attacks, SQL injection, unauthorized access, data exfiltration, and privilege escalation. They provide detailed query logs, connection information, and authentication history.
---
# Print Jobs
> Source: https://kb.binalyze.ai/air/features/acquisition/supported-evidence/macos-collections-detail/print-jobs.html
## Overview
**Evidence:** Print Jobs
**Description:** Collect print job info
**Category:** System
**Platform:** macos
**Short Name:** prntjb
**Is Parsed:** Yes
**Sent to Investigation Hub:** Yes
**Collect File(s):** No
## Background
CUPS print job history records document printing activities on macOS. This data is essential for auditing data exfiltration attempts and user activity.
## Data Collected
This collector gathers structured data about print jobs.
### Print Jobs Data
| Field | Description | Example |
|-------|-------------|---------|
| `Title` | Title | Example value |
| `Destination` | Destination | Example value |
| `User` | User | Example value |
| `Format` | Format | Example value |
| `Size` | Size | 123 |
| `CompletedTime` | Completed Time | 2023-10-15 14:30:25+03:00 |
| `ProcessingTime` | Processing Time | 2023-10-15 14:30:25+03:00 |
| `CreationTime` | Creation Time | 2023-10-15 14:30:25+03:00 |
## Collection Method
This collector queries the `cups_jobs` table via osquery and records results into `print_job_info`.
## Forensic Value
This evidence is crucial for forensic investigations as it can indicate sensitive documents printed or unusual printing behavior.
---
# Printer Info
> Source: https://kb.binalyze.ai/air/features/acquisition/supported-evidence/macos-collections-detail/printer-info.html
## Overview
**Evidence:** Printer Info
**Description:** Collect printer info
**Category:** System
**Platform:** macos
**Short Name:** prnt
**Is Parsed:** Yes
**Sent to Investigation Hub:** Yes
**Collect File(s):** No
## Background
CUPS destinations and options describe configured printers on macOS. This data is essential for understanding printing infrastructure and potential exfiltration channels.
## Data Collected
This collector gathers structured data about printer info.
### Printer Info Data
| Field | Description | Example |
|-------|-------------|---------|
| `Name` | Name | Example value |
| `OptionName` | Option Name | Example value |
| `OptionValue` | Option Value | Example value |
## Collection Method
This collector queries the `cups_destinations` table via osquery and records results into `printer_info`.
## Forensic Value
This evidence is crucial for forensic investigations as it identifies available printers and configurations relevant to data leakage scenarios.
---
# Processes
> Source: https://kb.binalyze.ai/air/features/acquisition/supported-evidence/macos-collections-detail/processes.html
## Overview
**Evidence:** Processes
**Description:** Collect Processes
**Category:** System
**Platform:** macos
**Short Name:** process
**Is Parsed:** Yes
**Sent to Investigation Hub:** Yes
**Collect File(s):** No
## Background
Process information provides a snapshot of all running processes on macOS, including command lines, parent-child relationships, and protection flags. This data is essential for understanding system activity, detecting malicious processes, and identifying unauthorized execution.
## Data Collected
This collector gathers structured data about processes.
### Processes Data
| Field | Description | Example |
|-------|-------------|---------|
| `ProcessId` | Process Id | 123 |
| `CSTime` | CS Time | 2023-10-15 14:30:25+03:00 |
| `StartTime` | Start Time | 2023-10-15 14:30:25+03:00 |
| `Command` | Command | Example value |
| `CommandLine` | Command Line | Example value |
| `State` | State | Example value |
| `SecureProcess` | Secure Process | 123 |
| `VirtualProcess` | Virtual Process | 123 |
| `ProtectionType` | Protection Type | Example value |
| `Cwd` | Cwd | Example value |
| `VirtualRootDir` | Virtual Root Dir | Example value |
| `Executable` | Executable | Example value |
| `IsExecutableExists` | Is Executable Exists | true |
| `Environment` | Environment | Example value |
| `LastChangeTime` | Last Change Time | 2023-10-15 14:30:25+03:00 |
| `AccessTime` | Access Time | 2023-10-15 14:30:25+03:00 |
| `ModificationTime` | Modification Time | 2023-10-15 14:30:25+03:00 |
| `SizeInBytes` | Size In Bytes | 123 |
| `Hash` | Hash | Example value |
| `ParentId` | Parent Id | 123 |
| `UserId` | User Id | 123 |
| `UserName` | User Name | Example value |
| `EffectiveUserId` | Effective User Id | 123 |
| `EffectiveUserName` | Effective User Name | Example value |
| `SavedUserId` | Saved User Id | 123 |
| `SavedUserName` | Saved User Name | Example value |
| `GroupId` | Group Id | 123 |
| `EffectiveGroupId` | Effective Group Id | 123 |
| `SavedGroupId` | Saved Group Id | 123 |
| `Threads` | Threads | 123 |
| `Nice` | Nice | 123 |
## Collection Method
This collector parses the necessary data from the `processes` table via osquery.
## Forensic Value
This evidence is crucial for forensic investigations as it reveals active applications and services, enabling detection of malware, process injection, backdoors, and persistence mechanisms.
---
# QQ Bookmarks
> Source: https://kb.binalyze.ai/air/features/acquisition/supported-evidence/macos-collections-detail/qq-bookmarks.html
## Overview
**Evidence:** QQ Bookmarks
**Description:** Collect QQ Bookmarks
**Category:** Applications
**Platform:** macos
**Short Name:** qbkmrks
**Is Parsed:** Yes
**Sent to Investigation Hub:** Yes
**Collect File(s):** No
## Background
Browser bookmarks represent user-saved favorite websites and organizational folders. This data reveals frequently accessed sites, user interests, and potential indicators of reconnaissance, phishing targets, or suspicious infrastructure.
## Data Collected
This collector gathers structured data about qq bookmarks.
### QQ Bookmarks Data
| Field | Description | Example |
|-------|-------------|---------|
| `UserName` | User Name | Example value |
| `ProfileName` | Profile Name | Example value |
| `BrowserName` | Browser Name | Example value |
| `GUID` | GUID | Example value |
| `BookmarkID` | Bookmark ID | Example value |
| `Name` | Name | Example value |
| `Type` | Type | Example value |
| `URL` | URL | Example value |
| `ParentFolder` | Parent Folder | Example value |
| `DateAdded` | Date Added | 2023-10-15 14:30:25+03:00 |
| `DateLastUsed` | Date Last Used | 2023-10-15 14:30:25+03:00 |
| `DateModified` | Date Modified | 2023-10-15 14:30:25+03:00 |
## Collection Method
This collector parses the browser's Bookmarks file to extract saved URLs, folder structures, timestamps, and metadata.
## Forensic Value
Bookmark analysis identifies targeted websites, phishing pages, command-and-control servers, internal resources, and organizational reconnaissance patterns. Investigators can detect social engineering campaigns, credential harvesting attempts, and lateral movement preparation.
---
# QQ Browsing History
> Source: https://kb.binalyze.ai/air/features/acquisition/supported-evidence/macos-collections-detail/qq-browsing-history.html
## Overview
**Evidence:** QQ Browsing History
**Description:** Collect Visited URLs from QQ
**Category:** Applications
**Platform:** macos
**Short Name:** qqhst
**Is Parsed:** Yes
**Sent to Investigation Hub:** Yes
**Collect File(s):** No
## Background
Browser history records all websites visited by users, including URLs, page titles, visit timestamps, visit counts, and transition types. This data is essential for reconstructing user activity, identifying malicious websites, and tracking lateral movement or reconnaissance activities.
## Data Collected
This collector gathers structured data about qq browsing history.
### QQ Browsing History Data
| Field | Description | Example |
|-------|-------------|---------|
| `AccessTime` | Access Time | 2023-10-15 14:30:25+03:00 |
| `AccessCount` | Access Count | 123 |
| `URL` | URL | Example value |
| `Browser` | Browser | Example value |
| `Title` | Title | Example value |
| `VisitDuration` | Visit Duration | Example value |
| `Referrer` | Referrer | Example value |
| `TypedCount` | Typed Count | 123 |
| `IsHidden` | Is Hidden | true |
| `TransitionType` | Transition Type | Example value |
| `VisitID` | Visit ID | 123 |
| `TransitionQualifiers` | Transition Qualifiers | Example value |
| `User` | User | Example value |
| `Profile` | Profile | Example value |
| `HistoryFilePath` | History File Path | Example value |
## Collection Method
This collector queries the browser's History database to extract visited URLs, timestamps, referrer information, and user interaction patterns.
## Forensic Value
Browsing history reveals phishing sites, malicious domains, command-and-control servers, data exfiltration targets, and reconnaissance activities. Analysts can identify compromised credentials, track attacker infrastructure, and correlate web activity with other security events to establish attack timelines.
---
# QQ Cookies
> Source: https://kb.binalyze.ai/air/features/acquisition/supported-evidence/macos-collections-detail/qq-cookies.html
## Overview
**Evidence:** QQ Cookies
**Description:** Collect QQ Cookies
**Category:** Applications
**Platform:** macos
**Short Name:** qcookies
**Is Parsed:** Yes
**Sent to Investigation Hub:** Yes
**Collect File(s):** No
## Background
Browser cookies store session tokens, authentication credentials, user preferences, and tracking data. This data is essential for understanding authenticated sessions, tracking user activity across websites, and identifying session hijacking or credential theft.
## Data Collected
This collector gathers structured data about qq cookies.
### QQ Cookies Data
| Field | Description | Example |
|-------|-------------|---------|
| `UserName` | User Name | Example value |
| `BrowserName` | Browser Name | Example value |
| `ProfileName` | Profile Name | Example value |
| `Domain` | Domain | Example value |
| `Name` | Name | Example value |
| `Path` | Path | Example value |
| `Value` | Value | Example value |
| `IsSecure` | Is Secure | 123 |
| `IsHTTPOnly` | Is HTTP Only | 123 |
| `HasExpires` | Has Expires | 123 |
| `IsPersistent` | Is Persistent | 123 |
| `Priority` | Priority | 123 |
| `SameSite` | Same Site | 123 |
| `SourcePort` | Source Port | 123 |
| `SourceScheme` | Source Scheme | 123 |
| `CreationTime` | Creation Time | 2023-10-15 14:30:25+03:00 |
| `ExpiresTime` | Expires Time | 2023-10-15 14:30:25+03:00 |
| `LastAccessTime` | Last Access Time | 2023-10-15 14:30:25+03:00 |
## Collection Method
This collector extracts cookies from the browser's Cookies database, including domain, name, value, path, expiration, and security flags.
## Forensic Value
Cookie analysis reveals active sessions, authentication tokens, persistent tracking identifiers, and potential session hijacking. Investigators can identify stolen credentials, unauthorized access, and cross-site tracking used for reconnaissance or targeting.
---
# QQ Downloads
> Source: https://kb.binalyze.ai/air/features/acquisition/supported-evidence/macos-collections-detail/qq-downloads.html
## Overview
**Evidence:** QQ Downloads
**Description:** Collect QQ Downloads
**Category:** Applications
**Platform:** macos
**Short Name:** qqdwnlds
**Is Parsed:** Yes
**Sent to Investigation Hub:** Yes
**Collect File(s):** No
## Background
Browser download history records files downloaded by users, including file paths, timestamps, URLs, referrer information, and download status. This data is essential for tracking file acquisition, identifying potentially malicious downloads, and reconstructing user activity timelines.
## Data Collected
This collector gathers structured data about qq downloads.
### QQ Downloads Data
| Field | Description | Example |
|-------|-------------|---------|
| `UserName` | User Name | Example value |
| `Browser` | Browser | Example value |
| `ProfileName` | Profile Name | Example value |
| `URL` | URL | Example value |
| `TargetPath` | Target Path | Example value |
| `CurrentPath` | Current Path | Example value |
| `Referrer` | Referrer | Example value |
| `LastModified` | Last Modified | 2023-10-15 14:30:25+03:00 |
| `DangerType` | Danger Type | 123 |
| `Opened` | Opened | 123 |
| `TabURL` | Tab URL | Example value |
| `TabReferrerURL` | Tab Referrer URL | Example value |
| `StartTime` | Start Time | 2023-10-15 14:30:25+03:00 |
| `EndTime` | End Time | 2023-10-15 14:30:25+03:00 |
| `HistoryFilePath` | History File Path | Example value |
## Collection Method
This collector queries the browser's History database to extract download records, including file paths, download times, source URLs, and security flags.
## Forensic Value
Download history reveals malware delivery vectors, data exfiltration attempts, unauthorized software installation, and user interaction with suspicious websites. Analysts can identify downloaded malicious files, track attack chains, and correlate downloads with other security events.
---
# QQ Favicons
> Source: https://kb.binalyze.ai/air/features/acquisition/supported-evidence/macos-collections-detail/qq-favicons.html
## Overview
**Evidence:** QQ Favicons
**Description:** Collect QQ Favicons
**Category:** Applications
**Platform:** macos
**Short Name:** qfico
**Is Parsed:** Yes
**Sent to Investigation Hub:** Yes
**Collect File(s):** No
## Background
Browser favicons are cached website icons that provide visual history of visited sites. This data supplements browsing history by revealing sites accessed even if history was deleted.
## Data Collected
This collector gathers structured data about qq favicons.
### QQ Favicons Data
| Field | Description | Example |
|-------|-------------|---------|
| `ID` | ID | 123 |
| `UserName` | User Name | Example value |
| `BrowserName` | Browser Name | Example value |
| `Profile` | Profile | Example value |
| `URL` | URL | Example value |
| `IconType` | Icon Type | 123 |
| `Path` | Path | Example value |
## Collection Method
This collector queries the browser's Favicons database to extract cached website icons and associated URLs.
## Forensic Value
Favicon analysis can recover evidence of deleted browsing history, identify visited sites through icon fingerprinting, and correlate with other browser artifacts to establish comprehensive activity timelines.
---
# QQ Form History
> Source: https://kb.binalyze.ai/air/features/acquisition/supported-evidence/macos-collections-detail/qq-form-history.html
## Overview
**Evidence:** QQ Form History
**Description:** Collect QQ Form History
**Category:** Applications
**Platform:** macos
**Short Name:** qfh
**Is Parsed:** Yes
**Sent to Investigation Hub:** Yes
**Collect File(s):** No
## Background
Browser form history stores previously entered form data including search queries, usernames, and other input fields. This data reveals user search patterns, account information, and potential data leakage through autofill.
## Data Collected
This collector gathers structured data about qq form history.
### QQ Form History Data
| Field | Description | Example |
|-------|-------------|---------|
| `UserName` | User Name | Example value |
| `BrowserName` | Browser Name | Example value |
| `Name` | Name | Example value |
| `Value` | Value | Example value |
| `ValueLower` | Value Lower | Example value |
| `Count` | Count | 123 |
| `Profile` | Profile | Example value |
| `Path` | Path | Example value |
| `DateCreated` | Date Created | 2023-10-15 14:30:25+03:00 |
| `DateLastUsed` | Date Last Used | 2023-10-15 14:30:25+03:00 |
## Collection Method
This collector queries the browser's form history database to extract saved form field data, search queries, and associated timestamps.
## Forensic Value
Form history exposes reconnaissance activities, credential enumeration attempts, search queries revealing attacker intent, and potentially sensitive information entered into web forms. Analysts can identify data exfiltration, account compromise indicators, and targeted search patterns.
---
# QQ Local Storage
> Source: https://kb.binalyze.ai/air/features/acquisition/supported-evidence/macos-collections-detail/qq-local-storage.html
## Overview
**Evidence:** QQ Local Storage
**Description:** Collect QQ Local Storage
**Category:** Applications
**Platform:** macos
**Short Name:** qqls
**Is Parsed:** Yes
**Sent to Investigation Hub:** Yes
**Collect File(s):** No
## Background
Browser local storage contains persistent key-value data stored by websites. This data includes user preferences, session state, cached data, and potentially authentication tokens or sensitive information.
## Data Collected
This collector gathers structured data about qq local storage.
### QQ Local Storage Data
| Field | Description | Example |
|-------|-------------|---------|
| `UserName` | User Name | Example value |
| `ProfileName` | Profile Name | Example value |
| `BrowserName` | Browser Name | Example value |
| `Key` | Key | Example value |
| `Value` | Value | Example value |
| `Path` | Path | Example value |
## Collection Method
This collector extracts local storage data from browser storage databases and files.
## Forensic Value
Local storage analysis reveals stored credentials, session tokens, tracking identifiers, and application state that can indicate compromised accounts, persistent tracking, or malicious website activity. Analysts can identify credential theft, session hijacking, and data exfiltration attempts.
---
# QQ Login Data
> Source: https://kb.binalyze.ai/air/features/acquisition/supported-evidence/macos-collections-detail/qq-login-data.html
## Overview
**Evidence:** QQ Login Data
**Description:** Collect QQ Login Data
**Category:** Applications
**Platform:** macos
**Short Name:** qlgd
**Is Parsed:** Yes
**Sent to Investigation Hub:** Yes
**Collect File(s):** No
## Background
Browser login data stores saved passwords and credential information. This data is critical for identifying stored credentials, password reuse patterns, and potential credential theft targets.
## Data Collected
This collector gathers structured data about qq login data.
### QQ Login Data Data
| Field | Description | Example |
|-------|-------------|---------|
| `ID` | ID | 123 |
| `UserName` | User Name | Example value |
| `BrowserName` | Browser Name | Example value |
| `OriginURL` | Origin URL | Example value |
| `SignonRealm` | Signon Realm | Example value |
| `BlacklistedByUser` | Blacklisted By User | 123 |
| `Scheme` | Scheme | Example value |
| `PasswordType` | Password Type | Example value |
| `TimesUsed` | Times Used | 123 |
| `Profile` | Profile | Example value |
| `Path` | Path | Example value |
| `DateCreated` | Date Created | 2023-10-15 14:30:25+03:00 |
| `DateLastUsed` | Date Last Used | 2023-10-15 14:30:25+03:00 |
## Collection Method
This collector extracts saved credentials from the browser's Login Data database, including URLs, usernames, and encrypted passwords.
## Forensic Value
Login data analysis reveals stored credentials, password reuse across services, targeted accounts, and potential credential harvesting. Investigators can identify compromised accounts, credential theft attempts, and unauthorized access to saved credentials by malware or attackers.
---
# QQ Sessions
> Source: https://kb.binalyze.ai/air/features/acquisition/supported-evidence/macos-collections-detail/qq-sessions.html
## Overview
**Evidence:** QQ Sessions
**Description:** Collect QQ Sessions
**Category:** Applications
**Platform:** macos
**Short Name:** qqss
**Is Parsed:** Yes
**Sent to Investigation Hub:** Yes
**Collect File(s):** No
## Background
Browser sessions maintain active tab state, cookies, and authentication context. This data reveals currently active user sessions, open websites, and authenticated connections at the time of collection.
## Data Collected
This collector gathers structured data about qq sessions.
### QQ Sessions Data
| Field | Description | Example |
|-------|-------------|---------|
| `ID` | ID | 123 |
| `WindowID` | Window ID | 123 |
| `Active` | Active | true |
| `Url` | Url | Example value |
| `Title` | Title | Example value |
| `Deleted` | Deleted | true |
| `Group` | Group | Example value |
| `History` | History | [] |
| `BrowserName` | Browser Name | Example value |
## Collection Method
This collector captures browser session data including active tabs, session cookies, and authentication state.
## Forensic Value
Session analysis identifies active compromises, authenticated sessions to malicious sites, concurrent suspicious activities, and real-time indicators of ongoing attacks. Analysts can detect active C2 connections, authenticated malware communications, and live attacker sessions.
---
# QQ Thumbnails
> Source: https://kb.binalyze.ai/air/features/acquisition/supported-evidence/macos-collections-detail/qq-thumbnails.html
## Overview
**Evidence:** QQ Thumbnails
**Description:** Collect QQ Thumbnails
**Category:** Applications
**Platform:** macos
**Short Name:** qthmb
**Is Parsed:** Yes
**Sent to Investigation Hub:** Yes
**Collect File(s):** No
## Background
Browser thumbnails are cached preview images of visited websites. This visual data supplements browsing history by providing screenshots of accessed pages, useful for recovering deleted history and identifying visited content.
## Data Collected
This collector gathers structured data about qq thumbnails.
### QQ Thumbnails Data
| Field | Description | Example |
|-------|-------------|---------|
| `UserName` | User Name | Example value |
| `Browser` | Browser | Example value |
| `URL` | URL | Example value |
| `URLRank` | URL Rank | 123 |
| `Title` | Title | Example value |
| `Profile` | Profile | Example value |
| `Path` | Path | Example value |
## Collection Method
This collector extracts cached thumbnail images from browser storage.
## Forensic Value
Thumbnail analysis provides visual evidence of visited websites, can recover evidence after history deletion, and helps identify phishing pages, malicious sites, or sensitive internal resources accessed by users through visual inspection.
---
# QQ User Profiles
> Source: https://kb.binalyze.ai/air/features/acquisition/supported-evidence/macos-collections-detail/qq-user-profiles.html
## Overview
**Evidence:** QQ User Profiles
**Description:** Collect QQ User Profiles
**Category:** Applications
**Platform:** macos
**Short Name:** qqprfls
**Is Parsed:** Yes
**Sent to Investigation Hub:** Yes
**Collect File(s):** No
## Background
Browser user profiles store per-user browser configurations, extensions, settings, and data segregation. This data reveals multiple user accounts, profile switching patterns, and user-specific browsing behavior.
## Data Collected
This collector gathers structured data about qq user profiles.
### QQ User Profiles Data
| Field | Description | Example |
|-------|-------------|---------|
| `EndpointUserName` | Endpoint User Name | Example value |
| `Profile` | Profile | Example value |
| `ProfileUserName` | Profile User Name | Example value |
| `BrowserName` | Browser Name | Example value |
| `BackgroundApps` | Background Apps | true |
| `GoogleAccountGivenName` | Google Account Given Name | Example value |
| `GoogleAccountID` | Google Account ID | Example value |
| `GoogleAccountName` | Google Account Name | Example value |
| `PictureFileName` | Picture File Name | Example value |
| `LastDownloadedPictureURL` | Last Downloaded Picture URL | Example value |
| `HostedDomain` | Hosted Domain | Example value |
| `IsConsentedPrimaryAccount` | Is Consented Primary Account | true |
| `IsEphemeral` | Is Ephemeral | true |
## Collection Method
This collector enumerates browser user profiles and extracts profile metadata, configurations, and associated data paths.
## Forensic Value
Profile analysis identifies multiple user accounts, profile-specific extensions and configurations, shared device usage patterns, and potential privilege escalation or lateral movement using different browser profiles. Investigators can correlate activity across profiles and identify unauthorized profile creation.
---
# QQ Web Storage
> Source: https://kb.binalyze.ai/air/features/acquisition/supported-evidence/macos-collections-detail/qq-web-storage.html
## Overview
**Evidence:** QQ Web Storage
**Description:** Collect QQ Web Storage
**Category:** Applications
**Platform:** macos
**Short Name:** qqws
**Is Parsed:** Yes
**Sent to Investigation Hub:** Yes
**Collect File(s):** No
## Background
Browser web storage includes both local and session storage used by websites to store client-side data. This data can contain application state, user preferences, cached content, and potentially sensitive information.
## Data Collected
This collector gathers structured data about qq web storage.
### QQ Web Storage Data
| Field | Description | Example |
|-------|-------------|---------|
| `UserName` | User Name | Example value |
| `ProfileName` | Profile Name | Example value |
| `BrowserName` | Browser Name | Example value |
| `Key` | Key | Example value |
| `Value` | Value | Example value |
| `Path` | Path | Example value |
## Collection Method
This collector extracts web storage data from browser storage locations including local storage and session storage.
## Forensic Value
Web storage analysis reveals cached application data, stored credentials, session information, and potential data exfiltration staging. Analysts can identify malicious website activity, stored authentication tokens, tracking identifiers, and sensitive data cached by compromised web applications.
---
# Quarantine Events
> Source: https://kb.binalyze.ai/air/features/acquisition/supported-evidence/macos-collections-detail/quarantine-events.html
## Overview
**Evidence:** Quarantine Events
**Description:** Collect Quarantine Events Database
**Category:** System
**Platform:** macos
**Short Name:** qrntn
**Is Parsed:** Yes
**Sent to Investigation Hub:** Yes
**Collect File(s):** No
## Background
This collector gathers quarantine events information from the macOS system. This data is essential for understanding download and execution origins, detecting initial access vectors, and investigating user-driven infections.
## Data Collected
This collector gathers structured data about quarantine events.
### Quarantine Events Data
| Field | Description | Example |
|-------|-------------|---------|
| `User` | User | Example value |
| `QuarantineID` | Quarantine ID | Example value |
| `Timestamp` | Timestamp | 2023-10-15 14:30:25+03:00 |
| `Bundle` | Bundle | Example value |
| `AgentName` | Agent Name | Example value |
| `DataURL` | Data URL | Example value |
| `SenderName` | Sender Name | Example value |
| `SenderAdd` | Sender Add | Example value |
| `TypeNum` | Type Num | 123 |
| `OriginTitle` | Origin Title | Example value |
| `OriginURL` | Origin URL | Example value |
| `OriginAlias` | Origin Alias | Example value |
## Collection Method
This collector copies user quarantine databases from `~/Library/Preferences/com.apple.LaunchServices.QuarantineEventsV2` and parses the `LSQuarantineEvent` table.
## Forensic Value
This evidence is crucial for forensic investigations as it reveals downloaded files, source URLs, and agent processes that can indicate phishing, drive-by downloads, or malicious attachments.
---
# Quick Look Cache
> Source: https://kb.binalyze.ai/air/features/acquisition/supported-evidence/macos-collections-detail/quick-look-cache.html
## Overview
**Evidence:** Quick Look Cache
**Description:** Collect Quick Look Cache
**Category:** System
**Platform:** macos
**Short Name:** qklc
**Is Parsed:** Yes
**Sent to Investigation Hub:** Yes
**Collect File(s):** No
## Background
Quick Look cache stores thumbnails and metadata for recently viewed files. This data is essential for confirming file access and reconstructing user interactions with files.
## Data Collected
This collector gathers structured data about quick look cache.
### Quick Look Cache Data
| Field | Description | Example |
|-------|-------------|---------|
| `Path` | Path | Example value |
| `RowID` | Row ID | 123 |
| `FSID` | FSID | Example value |
| `VolumeID` | Volume ID | 123 |
| `INode` | I Node | 123 |
| `ModTime` | Mod Time | 123 |
| `Size` | Size | 123 |
| `Label` | Label | Example value |
| `LastHitDate` | Last Hit Date | 123 |
| `HitCount` | Hit Count | Example value |
| `IconMode` | Icon Mode | 123 |
| `CachePath` | Cache Path | Example value |
## Collection Method
This collector queries the `quicklook_cache` table via osquery and records cache metadata into `quicklook_cache`.
## Forensic Value
This evidence is crucial for forensic investigations as it indicates files previewed or viewed by a user, even if moved or deleted.
---
# Re-Opened Apps
> Source: https://kb.binalyze.ai/air/features/acquisition/supported-evidence/macos-collections-detail/re-opened-apps.html
## Overview
**Evidence:** Re-Opened Apps
**Description:** Collect Re-Opened Apps
**Category:** System
**Platform:** macos
**Short Name:** reapps
**Is Parsed:** Yes
**Sent to Investigation Hub:** Yes
**Collect File(s):** No
## Background
Re-opened apps preference tracks files and apps restored at login. This data is essential for understanding user session restoration and potential persistence via loginwindow.
## Data Collected
This collector gathers structured data about re-opened apps.
### Re-Opened Apps Data
| Field | Description | Example |
|-------|-------------|---------|
| `Plist` | Plist | Example value |
| `FilePath` | File Path | Example value |
| `OriginalFilename` | Original Filename | Example value |
| `FileType` | File Type | Example value |
| `SHA1` | SHA1 | Example value |
| `SizeInBytes` | Size In Bytes | 123 |
| `FileCreated` | File Created | 2023-10-15 14:30:25+03:00 |
| `FileLastAccessed` | File Last Accessed | 2023-10-15 14:30:25+03:00 |
| `FileLastChanged` | File Last Changed | 2023-10-15 14:30:25+03:00 |
| `FileLastModified` | File Last Modified | 2023-10-15 14:30:25+03:00 |
## Collection Method
This collector joins `plist`, `hash`, and `file` tables to enumerate ByHost loginwindow plists and referenced items, recording metadata into `re_opened_apps`.
## Forensic Value
This evidence is crucial for forensic investigations as it highlights recently accessed items and auto‑restored apps that may indicate user behavior or malicious persistence.
---
# Safari Browsing History
> Source: https://kb.binalyze.ai/air/features/acquisition/supported-evidence/macos-collections-detail/safari-browsing-history.html
## Overview
**Evidence:** Safari Browsing History
**Description:** Collect visited URLs from Safari
**Category:** Applications
**Platform:** macos
**Short Name:** shst
**Is Parsed:** Yes
**Sent to Investigation Hub:** Yes
**Collect File(s):** No
## Background
Browser history records all websites visited by users, including URLs, page titles, visit timestamps, visit counts, and transition types. This data is essential for reconstructing user activity, identifying malicious websites, and tracking lateral movement or reconnaissance activities.
## Data Collected
This collector gathers structured data about safari browsing history.
### Safari Browsing History Data
| Field | Description | Example |
|-------|-------------|---------|
| `AccessTime` | Access Time | 2023-10-15 14:30:25+03:00 |
| `AccessCount` | Access Count | 123 |
| `URL` | URL | Example value |
| `Browser` | Browser | Example value |
| `Title` | Title | Example value |
| `VisitDuration` | Visit Duration | Example value |
| `Referrer` | Referrer | Example value |
| `TypedCount` | Typed Count | 123 |
| `IsHidden` | Is Hidden | true |
| `TransitionType` | Transition Type | Example value |
| `VisitID` | Visit ID | 123 |
| `TransitionQualifiers` | Transition Qualifiers | Example value |
| `User` | User | Example value |
| `Profile` | Profile | Example value |
| `HistoryFilePath` | History File Path | Example value |
## Collection Method
This collector queries the browser's History database to extract visited URLs, timestamps, referrer information, and user interaction patterns.
## Forensic Value
Browsing history reveals phishing sites, malicious domains, command-and-control servers, data exfiltration targets, and reconnaissance activities. Analysts can identify compromised credentials, track attacker infrastructure, and correlate web activity with other security events to establish attack timelines.
---
# Safari Downloads
> Source: https://kb.binalyze.ai/air/features/acquisition/supported-evidence/macos-collections-detail/safari-downloads.html
## Overview
**Evidence:** Safari Downloads
**Description:** Collect Safari Downloads
**Category:** Applications
**Platform:** macos
**Short Name:** sdwnlds
**Is Parsed:** Yes
**Sent to Investigation Hub:** Yes
**Collect File(s):** No
## Background
Browser download history records files downloaded by users, including file paths, timestamps, URLs, referrer information, and download status. This data is essential for tracking file acquisition, identifying potentially malicious downloads, and reconstructing user activity timelines.
## Data Collected
This collector gathers structured data about safari downloads.
### Safari Downloads Data
| Field | Description | Example |
|-------|-------------|---------|
| `UserName` | User Name | Example value |
| `Browser` | Browser | Example value |
| `ProfileName` | Profile Name | Example value |
| `URL` | URL | Example value |
| `TargetPath` | Target Path | Example value |
| `CurrentPath` | Current Path | Example value |
| `Referrer` | Referrer | Example value |
| `LastModified` | Last Modified | 2023-10-15 14:30:25+03:00 |
| `DangerType` | Danger Type | 123 |
| `Opened` | Opened | 123 |
| `TabURL` | Tab URL | Example value |
| `TabReferrerURL` | Tab Referrer URL | Example value |
| `StartTime` | Start Time | 2023-10-15 14:30:25+03:00 |
| `EndTime` | End Time | 2023-10-15 14:30:25+03:00 |
| `HistoryFilePath` | History File Path | Example value |
## Collection Method
This collector queries the browser's History database to extract download records, including file paths, download times, source URLs, and security flags.
## Forensic Value
Download history reveals malware delivery vectors, data exfiltration attempts, unauthorized software installation, and user interaction with suspicious websites. Analysts can identify downloaded malicious files, track attack chains, and correlate downloads with other security events.
---
# Screensharing
> Source: https://kb.binalyze.ai/air/features/acquisition/supported-evidence/macos-collections-detail/screensharing.html
## Overview
**Evidence:** Screensharing
**Description:** Filter screen sharing events
**Category:** System
**Platform:** macos
**Short Name:** sch
**Is Parsed:** Yes
**Sent to Investigation Hub:** Yes
**Collect File(s):** No
## Background
macOS screen sharing functionality is managed by screensharingd (daemon) and ScreensharingAgent processes. These handle VNC-based remote desktop sessions, allowing users to view and control the Mac remotely. Logs capture connection attempts, session establishments, and screen sharing activities.
## Data Collected
This collector gathers structured data about screensharing.
## Collection Method
This collector uses the macOS 'log' command with predicate-based filtering to extract screen sharing daemon and agent events over the last 3 days. Log entries are parsed from JSON format and stored in the unified_logs table with PredicateType='Screensharing'.
## Forensic Value
Screen sharing logs are valuable for investigating unauthorized remote access, surveillance activities, data theft, and remote control of systems. They reveal when screen sharing was enabled, connection sources, and session durations, which are critical for detecting unauthorized monitoring or remote attacks.
---
# Session Creation and Destruction
> Source: https://kb.binalyze.ai/air/features/acquisition/supported-evidence/macos-collections-detail/session-creation-and-destruction.html
## Overview
**Evidence:** Session Creation and Destruction
**Description:** Filter sessions creation and destruction events
**Category:** System
**Platform:** macos
**Short Name:** scd
**Is Parsed:** Yes
**Sent to Investigation Hub:** Yes
**Collect File(s):** No
## Background
The securityd daemon manages security sessions on macOS including user sessions, authorization sessions, and security contexts. It tracks session lifecycle events from creation through destruction, managing authentication and authorization tokens throughout the session.
## Data Collected
This collector gathers structured data about session creation and destruction.
## Collection Method
This collector uses the macOS 'log' command with predicate-based filtering to extract securityd session events over the last 3 days. Log entries are parsed from JSON format and stored in the unified_logs table with PredicateType='Session Creation and Destruction'.
## Forensic Value
Session events are critical for understanding user activity timelines, session hijacking attempts, authentication token abuse, and concurrent session patterns. They help establish when users were active on the system, detect anomalous session behaviors, and investigate unauthorized access through session manipulation.
---
# Shared File List
> Source: https://kb.binalyze.ai/air/features/acquisition/supported-evidence/macos-collections-detail/shared-file-list.html
## Overview
**Evidence:** Shared File List
**Description:** Collect Shared File List (SFL) items
**Category:** System
**Platform:** macos
**Short Name:** sfl
**Is Parsed:** Yes
**Sent to Investigation Hub:** Yes
**Collect File(s):** No
## Background
Shared File List (SFL/SFL2) stores recent items and application-specific lists. This data is essential for reconstructing user activity and identifying recently accessed files and apps.
## Data Collected
This collector gathers structured data about shared file list.
### Shared File List Data
| Field | Description | Example |
|-------|-------------|---------|
| `User` | User | Example value |
| `SourceFile` | Source File | Example value |
| `SourceName` | Source Name | Example value |
| `ItemIndex` | Item Index | 123 |
| `Name` | Name | Example value |
| `URL` | URL | Example value |
## Collection Method
This collector copies user SFL/SFL2 files, decodes NSKeyedArchive contents, and records entries into `shared_file_list`.
## Forensic Value
This evidence is crucial for forensic investigations as it reveals recent documents and locations, aiding timeline building and data exfiltration analysis.
---
# Shell History
> Source: https://kb.binalyze.ai/air/features/acquisition/supported-evidence/macos-collections-detail/shell-history.html
## Overview
**Evidence:** Shell History
**Description:** Collect Shell History
**Category:** System
**Platform:** macos
**Short Name:** shellhist
**Is Parsed:** Yes
**Sent to Investigation Hub:** Yes
**Collect File(s):** No
## Background
This collector gathers shell history information from macOS. This data is essential for understanding user activity, detecting suspicious commands, and investigating command-based incidents.
## Data Collected
This collector gathers structured data about shell history.
### Shell History Data
| Field | Description | Example |
|-------|-------------|---------|
| `Command` | Command | Example value |
| `HistoryFile` | History File | Example value |
| `UserId` | User Id | 123 |
| `Timestamp` | Timestamp | 2023-10-15 14:30:25+03:00 |
## Collection Method
This collector reads history files (e.g., .bash_history, .zsh_history) and records parsed entries into the `shell_history` table.
## Forensic Value
This evidence is crucial for forensic investigations as it reveals executed commands, helping trace attacker actions, privilege escalation attempts, and persistence via command-line activity.
---
# Software Update Information
> Source: https://kb.binalyze.ai/air/features/acquisition/supported-evidence/macos-collections-detail/software-update-information.html
## Overview
**Evidence:** Software Update Information
**Description:** Collects software update information
**Category:** System
**Platform:** macos
**Short Name:** swinfo
**Is Parsed:** Yes
**Sent to Investigation Hub:** Yes
**Collect File(s):** No
## Background
Software update preferences record last successful updates and recommended updates. This data is essential for verifying patch status and detecting outdated or vulnerable systems.
## Data Collected
This collector gathers structured data about software update information.
## Collection Method
This collector copies and parses `/Library/Preferences/com.apple.SoftwareUpdate.plist` and records fields into `software_update_information`.
## Forensic Value
This evidence is crucial for forensic investigations as it reveals update timelines and failures, helping assess exposure windows and compliance.
---
# Sophos Events Database
> Source: https://kb.binalyze.ai/air/features/acquisition/supported-evidence/macos-collections-detail/sophos-events-database.html
## Overview
**Evidence:** Sophos Events Database
**Description:** Collect Sophos Events Database
**Category:** Applications
**Platform:** macos
**Short Name:** sedb
**Is Parsed:** No
**Sent to Investigation Hub:** No
**Collect File(s):** Yes
## Background
Sophos Anti-Virus for Mac maintains an events database (events.db) that stores all security events, threat detections, scan results, and quarantine activities. This SQLite database contains comprehensive security event history.
## Data Collected
This collector gathers structured data about sophos events database.
## Collection Method
This collector gathers the Sophos events.db database file from the system-wide Library/Sophos Anti-Virus directory, which contains structured security event data.
## Forensic Value
The Sophos events database is critical for investigating malware detections, understanding threat timelines, identifying quarantined files, and analyzing security incidents on macOS. It provides detailed, queryable security event history.
---
# Sophos Logs
> Source: https://kb.binalyze.ai/air/features/acquisition/supported-evidence/macos-collections-detail/sophos-logs.html
## Overview
**Evidence:** Sophos Logs
**Description:** Collect Sophos Logs
**Category:** Applications
**Platform:** macos
**Short Name:** splgs
**Is Parsed:** No
**Sent to Investigation Hub:** No
**Collect File(s):** Yes
## Background
Sophos maintains multiple log files on macOS including the main Anti-Virus log, updater log, and LiveQuery osquery logs. These logs capture real-time protection events, update activities, and endpoint detection query results.
## Data Collected
This collector gathers structured data about sophos logs.
## Collection Method
This collector gathers Sophos log files from system-wide Library/Logs directories, including the main antivirus log, update logs, and LiveQuery/osquery logs for endpoint detection and response.
## Forensic Value
Sophos logs provide comprehensive security visibility including virus detections, update status, EDR queries, and system protection events. The LiveQuery logs reveal endpoint detection activities and security monitoring queries executed on the system.
---
# Splashtop Mac Logs
> Source: https://kb.binalyze.ai/air/features/acquisition/supported-evidence/macos-collections-detail/splashtop-mac-logs.html
## Overview
**Evidence:** Splashtop Mac Logs
**Description:** Collect Splashtop Mac Application Logs
**Category:** Applications
**Platform:** macos
**Short Name:** splttmclg
**Is Parsed:** No
**Sent to Investigation Hub:** No
**Collect File(s):** Yes
## Background
Splashtop is a remote desktop solution widely used in business environments. It stores logs in shared directories including streamer logs, business logs (often compressed as ZIP files), and user-specific Library logs.
## Data Collected
This collector gathers structured data about splashtop mac logs.
## Collection Method
This collector gathers Splashtop logs from Users/Shared locations (SplashtopStreamer text files and Splashtop Business archives) and user-specific Library/Logs directories.
## Forensic Value
Splashtop logs are valuable for investigating remote access sessions, unauthorized connections, data transfers, and potential abuse of remote management tools. They help establish timelines of remote access activities often exploited in security incidents.
---
# Spotlight Metadata
> Source: https://kb.binalyze.ai/air/features/acquisition/supported-evidence/macos-collections-detail/spotlight-metadata.html
## Overview
**Evidence:** Spotlight Metadata
**Description:** Collects macOS Spotlight metadata from system and all user store databases
**Category:** System
**Platform:** macos
**Short Name:** spotlight
**Is Parsed:** Yes
**Sent to Investigation Hub:** Yes
**Collect File(s):** Yes
## Background
macOS Spotlight maintains comprehensive metadata indexes of files, applications, emails, and user activity across the system. The store.db files contain rich metadata including file paths, creation/modification times, content types, keywords, email addresses, geographic coordinates, and user interactions. System-level stores track global file activity while user-level stores contain personalized metadata and search history. This data is essential for reconstructing user activity, file access patterns, and document timelines.
## Data Collected
This collector gathers structured data about spotlight metadata.
### Spotlight Metadata Data
| Field | Description | Example |
|-------|-------------|---------|
| `ID` | ID | 123 |
| `Username` | Username | Example value |
| `Inode` | Inode | 123 |
| `Flags` | Flags | Example value |
| `ItemID` | Item ID | 123 |
| `ParentInode` | Parent Inode | 123 |
| `DateUpdated` | Date Updated | 2023-10-15 14:30:25+03:00 |
| `Filepath` | Filepath | Example value |
| `Metadata` | Metadata | Example value |
## Collection Method
This collector discovers and parses all Spotlight store.db files from both system storage (`/System/Volumes/Data/.Spotlight-V100/Store-V2/*/store.db`) and all user home directories (`Library/Metadata/CoreSpotlight/.../store.db`). It processes each database concurrently, extracting file metadata, timestamps, and attributes, then records them into the `spotlight_metadata` table with username and source path context.
## Forensic Value
This evidence is crucial for forensic investigations as it provides comprehensive file activity history, including deleted files that remain in the index, document metadata (authors, keywords, GPS coordinates), email addresses, application usage, and user search patterns. It helps establish file presence, user knowledge, and temporal relationships between files and activities, often revealing evidence that no longer exists in the filesystem.
---
# SSH Authorized Keys
> Source: https://kb.binalyze.ai/air/features/acquisition/supported-evidence/macos-collections-detail/ssh-authorized-keys.html
## Overview
**Evidence:** SSH Authorized Keys
**Description:** Collect SSH authorized keys
**Category:** Network
**Platform:** macos
**Short Name:** sshauth
**Is Parsed:** Yes
**Sent to Investigation Hub:** Yes
**Collect File(s):** No
## Background
SSH authorized keys contain public keys that are allowed to authenticate to user accounts without passwords. This data is essential for understanding SSH key-based authentication, detecting unauthorized access, and investigating SSH-related security incidents.
## Data Collected
This collector gathers structured data about ssh authorized keys.
## Collection Method
This collector parses the necessary data from SSH authorized keys files.
## Forensic Value
This evidence is crucial for forensic investigations as it provides information about SSH key-based authentication. It helps investigators understand SSH access patterns, detect unauthorized keys, and investigate SSH-related attacks. The data can reveal key-based access, authentication methods, and potential security vulnerabilities.
---
# SSH Configs
> Source: https://kb.binalyze.ai/air/features/acquisition/supported-evidence/macos-collections-detail/ssh-configs.html
## Overview
**Evidence:** SSH Configs
**Description:** Collect SSH configurations
**Category:** Network
**Platform:** macos
**Short Name:** sshconf
**Is Parsed:** Yes
**Sent to Investigation Hub:** Yes
**Collect File(s):** No
## Background
SSH configuration files contain client-side SSH settings that control connection behavior, authentication methods, and security policies. This data is essential for understanding SSH client configuration, detecting security misconfigurations, and investigating SSH-related security incidents.
## Data Collected
This collector gathers structured data about ssh configs.
## Collection Method
This collector parses the necessary data from SSH configuration files.
## Forensic Value
This evidence is crucial for forensic investigations as it provides information about SSH client configuration and connection settings. It helps investigators understand SSH connection patterns, detect security misconfigurations, and investigate SSH-related attacks. The data can reveal connection preferences, host-specific settings, and authentication methods.
---
# SSH Files
> Source: https://kb.binalyze.ai/air/features/acquisition/supported-evidence/macos-collections-detail/ssh-files.html
## Overview
**Evidence:** SSH Files
**Description:** Collect all files from SSH directories including configurations, keys, and other SSH-related files
**Category:** System
**Platform:** macos
**Short Name:** sshf
**Is Parsed:** No
**Sent to Investigation Hub:** Yes
**Collect File(s):** Yes
## Background
SSH configuration and key material define how remote access is performed on Unix-like systems. System directories (e.g., /etc/ssh, /usr/local/etc/ssh) and per-user ~/.ssh hold configs, keys, and trust relationships (known_hosts). These artifacts are critical for understanding access, hardening state, and potential lateral movement paths.
## Data Collected
This collector gathers structured data about ssh files.
## Collection Method
This collector walks system SSH directories and each user's ~/.ssh directory, copying regular files into the case content and recording metadata such as ownership, file mode, and timestamps.
## Forensic Value
SSH files reveal authorized keys, host trust, cipher/policy settings, and possible backdoors. They help identify unauthorized access, weak configurations, persistence via keys, and relationships to other systems for lateral movement.
---
# SSH Known Hosts
> Source: https://kb.binalyze.ai/air/features/acquisition/supported-evidence/macos-collections-detail/ssh-known-hosts.html
## Overview
**Evidence:** SSH Known Hosts
**Description:** Collect SSH known hosts
**Category:** Network
**Platform:** macos
**Short Name:** sshknown
**Is Parsed:** Yes
**Sent to Investigation Hub:** Yes
**Collect File(s):** No
## Background
SSH known hosts files contain public keys of remote hosts that have been previously connected to, providing host verification and preventing man-in-the-middle attacks. This data is essential for understanding SSH connection history, detecting potential security breaches, and investigating SSH-related security incidents.
## Data Collected
This collector gathers structured data about ssh known hosts.
## Collection Method
This collector parses the necessary data from SSH known hosts files.
## Forensic Value
This evidence is crucial for forensic investigations as it provides information about SSH connection history and host trust relationships. It helps investigators understand network connections, detect potential security breaches, and investigate SSH-related attacks. The data can reveal connection patterns, host relationships, and potential security vulnerabilities.
---
# SSHD Configs
> Source: https://kb.binalyze.ai/air/features/acquisition/supported-evidence/macos-collections-detail/sshd-configs.html
## Overview
**Evidence:** SSHD Configs
**Description:** Collect SSHD configurations
**Category:** Network
**Platform:** macos
**Short Name:** sshdconf
**Is Parsed:** Yes
**Sent to Investigation Hub:** Yes
**Collect File(s):** No
## Background
SSH daemon (sshd) configuration files contain settings that control SSH server behavior, security policies, and access controls. This data is essential for understanding SSH server configuration, detecting security misconfigurations, and investigating SSH-related security incidents.
## Data Collected
This collector gathers structured data about sshd configs.
### SSHD Configs Data
| Field | Description | Example |
|-------|-------------|---------|
| `Option` | Option | Example value |
| `Value` | Value | Example value |
## Collection Method
This collector parses the necessary data from SSH daemon configuration files.
## Forensic Value
This evidence is crucial for forensic investigations as it provides information about SSH server configuration and security settings. It helps investigators understand SSH access controls, detect security misconfigurations, and investigate SSH-related attacks. The data can reveal authentication methods, port configurations, user restrictions, and security policies.
---
# Sshd
> Source: https://kb.binalyze.ai/air/features/acquisition/supported-evidence/macos-collections-detail/sshd.html
## Overview
**Evidence:** Sshd
**Description:** Filter ssh activity events
**Category:** System
**Platform:** macos
**Short Name:** sshd
**Is Parsed:** Yes
**Sent to Investigation Hub:** Yes
**Collect File(s):** No
## Background
The SSH daemon (sshd) on macOS handles secure shell connections for remote access. It logs all SSH connection attempts, authentication events, session establishments, and disconnections. SSH is commonly used for remote administration and is frequently targeted by attackers.
## Data Collected
This collector gathers structured data about sshd.
### Sshd Data
| Field | Description | Example |
|-------|-------------|---------|
| `Option` | Option | Example value |
| `Value` | Value | Example value |
## Collection Method
This collector uses the macOS 'log' command with predicate-based filtering to extract sshd process events over the last 3 days. Log entries are parsed from JSON format and stored in the unified_logs table with PredicateType='Sshd'.
## Forensic Value
SSH logs are vital for investigating remote access, lateral movement, brute force attacks, and unauthorized system access. They provide source IP addresses, authentication attempts, connection times, and user accounts used, which are essential for detecting intrusions and tracking attacker movements.
---
# Sudo Last Run
> Source: https://kb.binalyze.ai/air/features/acquisition/supported-evidence/macos-collections-detail/sudo-last-run.html
## Overview
**Evidence:** Sudo Last Run
**Description:** Collect Sudo Last Run
**Category:** System
**Platform:** macos
**Short Name:** slr
**Is Parsed:** Yes
**Sent to Investigation Hub:** Yes
**Collect File(s):** No
## Background
The sudo timestamp files track when users last successfully authenticated with sudo, allowing password-less sudo execution within a timeout period. These timestamps reveal privilege escalation activities and administrative command execution. Understanding sudo usage is essential for detecting unauthorized privilege escalation, lateral movement, and administrative access abuse.
## Data Collected
This collector gathers structured data about sudo last run.
### Sudo Last Run Data
| Field | Description | Example |
|-------|-------------|---------|
| `UID` | UID | 123 |
| `User` | User | Example value |
| `Source` | Source | Example value |
| `SudoRunTimestamp` | Sudo Run Timestamp | 2023-10-15 14:30:25+03:00 |
## Collection Method
This collector parses binary timestamp files from /private/var/db/sudo/ts/, extracting user IDs and last sudo execution timestamps for each user who has used sudo on the system.
## Forensic Value
Sudo timestamp data reveals when users gained elevated privileges, indicating administrative activities, privilege escalation attempts, or unauthorized access. Unexpected sudo usage may indicate compromised credentials, privilege escalation attacks, or malicious administrative actions. This evidence helps establish timelines for privileged activities and identify unauthorized elevated access.
---
# System Extension Info
> Source: https://kb.binalyze.ai/air/features/acquisition/supported-evidence/macos-collections-detail/system-extension-info.html
## Overview
**Evidence:** System Extension Info
**Description:** Collect system extension info
**Category:** System
**Platform:** macos
**Short Name:** sysext
**Is Parsed:** Yes
**Sent to Investigation Hub:** Yes
**Collect File(s):** No
## Background
System Extensions replaced kernel extensions starting with macOS 10.15 to provide safer extensibility with reduced kernel access. These extensions run in user space and provide functionality like network filtering, endpoint security, and file system monitoring. Understanding installed system extensions is crucial for detecting unauthorized monitoring tools, security product tampering, and malicious extensions.
## Data Collected
This collector gathers structured data about system extension info.
### System Extension Info Data
| Field | Description | Example |
|-------|-------------|---------|
| `UUID` | UUID | Example value |
| `Path` | Path | Example value |
| `BundlePath` | Bundle Path | Example value |
| `State` | State | Example value |
| `BundleID` | Bundle ID | Example value |
| `Version` | Version | Example value |
| `Category` | Category | Example value |
| `TeamId` | Team Id | Example value |
| `MDMManaged` | MDM Managed | 123 |
## Collection Method
This collector queries the system_extensions table via osquery to retrieve information about all registered system extensions, including their bundle IDs, paths, versions, categories, team IDs, and MDM management status.
## Forensic Value
System extension information reveals security monitoring capabilities and potential surveillance tools. Unauthorized or malicious extensions may indicate persistence mechanisms, data exfiltration tools, or attacker-deployed monitoring software. This evidence helps identify security product tampering, unauthorized access to system resources, and extension-based persistence.
---
# System Integrity Protection Status
> Source: https://kb.binalyze.ai/air/features/acquisition/supported-evidence/macos-collections-detail/system-integrity-protection-status.html
## Overview
**Evidence:** System Integrity Protection Status
**Description:** Collect SIP status
**Category:** System
**Platform:** macos
**Short Name:** sip
**Is Parsed:** Yes
**Sent to Investigation Hub:** Yes
**Collect File(s):** No
## Background
System Integrity Protection (SIP) restricts the root user from performing certain operations to protect system integrity. This data is essential for assessing hardening state and detecting weakened protections.
## Data Collected
This collector gathers structured data about system integrity protection status.
## Collection Method
This collector queries the `sip_config` table via osquery and records results into `sip_status`.
## Forensic Value
This evidence is crucial for forensic investigations as it indicates whether protections are disabled, potentially enabling malicious modifications to the system.
---
# System Logs
> Source: https://kb.binalyze.ai/air/features/acquisition/supported-evidence/macos-collections-detail/system-logs.html
## Overview
**Evidence:** System Logs
**Description:** Collect System Logs
**Category:** System
**Platform:** macos
**Short Name:** sysl
**Is Parsed:** No
**Sent to Investigation Hub:** No
**Collect File(s):** Yes
## Background
macOS system logs contain critical system events, kernel messages, daemon activities, and system-level diagnostics. These logs are stored in /var/log and provide comprehensive system operation details.
## Data Collected
This collector gathers structured data about system logs.
## Collection Method
This collector gathers system log files from /var/log/system*, which includes system.log and related system event logs containing kernel and system daemon messages.
## Forensic Value
System logs are essential for investigating system-level events, boot activities, kernel panics, daemon operations, and system-wide errors. They provide critical timeline information for incident response and system behavior analysis.
---
# Tccd
> Source: https://kb.binalyze.ai/air/features/acquisition/supported-evidence/macos-collections-detail/tccd.html
## Overview
**Evidence:** Tccd
**Description:** Filter tccd events
**Category:** System
**Platform:** macos
**Short Name:** tccd
**Is Parsed:** Yes
**Sent to Investigation Hub:** Yes
**Collect File(s):** No
## Background
The Transparency, Consent, and Control Daemon (tccd) manages privacy permissions on macOS including camera, microphone, screen recording, accessibility, and file access permissions. It logs all permission requests, grants, and denials for applications.
## Data Collected
This collector gathers structured data about tccd.
## Collection Method
This collector uses the macOS 'log' command with predicate-based filtering to extract tccd process events over the last 3 days. Log entries are parsed from JSON format and stored in the unified_logs table with PredicateType='Tccd'.
## Forensic Value
TCC events are critical for investigating privacy violations, malware behavior, spyware activities, and unauthorized access to sensitive resources. They reveal which applications requested camera/microphone access, screen recording capabilities, and file system permissions, helping identify suspicious privilege escalation and data collection attempts.
---
# Teamviewer Logs
> Source: https://kb.binalyze.ai/air/features/acquisition/supported-evidence/macos-collections-detail/teamviewer-logs.html
## Overview
**Evidence:** Teamviewer Logs
**Description:** Collect Teamviewer Logs
**Category:** Applications
**Platform:** macos
**Short Name:** tvwl
**Is Parsed:** No
**Sent to Investigation Hub:** No
**Collect File(s):** Yes
## Background
TeamViewer is a popular remote access and support tool that maintains detailed logs of connections, network activities, and session information. It stores separate logs for general activities and network-specific events.
## Data Collected
This collector gathers structured data about teamviewer logs.
## Collection Method
This collector gathers TeamViewer log files from user Library directories, including both the main logfile and network-specific logfile that track all remote access sessions and connections.
## Forensic Value
TeamViewer logs are essential for investigating unauthorized remote access, social engineering attacks, data theft, and ransomware deployment. They provide connection IDs, partner IDs, session times, and activities that are frequently involved in security incidents.
---
# Transparency, Consent, and Control (TCC)
> Source: https://kb.binalyze.ai/air/features/acquisition/supported-evidence/macos-collections-detail/transparency-consent-and-control-tcc.html
## Overview
**Evidence:** Transparency, Consent, and Control (TCC)
**Description:** Collect Transparency, Consent, and Control Information
**Category:** System
**Platform:** macos
**Short Name:** tcc
**Is Parsed:** Yes
**Sent to Investigation Hub:** Yes
**Collect File(s):** No
## Background
TCC is macOS's privacy framework managing application permissions to sensitive resources (camera, microphone, files, etc.). This data is essential for auditing privacy decisions and detecting over‑permissive apps.
## Data Collected
This collector gathers structured data about transparency, consent, and control (tcc).
### Transparency, Consent, and Control (TCC) Data
| Field | Description | Example |
|-------|-------------|---------|
| `User` | User | Example value |
| `Service` | Service | Example value |
| `Client` | Client | Example value |
| `AuthReason` | Auth Reason | Example value |
| `AuthValue` | Auth Value | Example value |
| `LastModified` | Last Modified | 2023-10-15 14:30:25+03:00 |
## Collection Method
This collector copies TCC databases from system and user paths and parses the `access` table to extract service, client, reason, and value.
## Forensic Value
This evidence is crucial for forensic investigations as it reveals which apps were granted or denied sensitive permissions and when, assisting in identifying privacy abuses.
---
# .Trash
> Source: https://kb.binalyze.ai/air/features/acquisition/supported-evidence/macos-collections-detail/trash.html
## Overview
**Evidence:** .Trash
**Description:** Collect detailed information about files in .Trash directory
**Category:** DiskFilesystem
**Platform:** macos
**Short Name:** trsh
**Is Parsed:** Yes
**Sent to Investigation Hub:** Yes
**Collect File(s):** No
## Background
User trash folders contain recently deleted items per account. This data is essential for recovering deleted evidence, tracing user actions, and identifying data staging.
## Data Collected
This collector gathers structured data about .trash.
## Collection Method
This collector enumerates each user's `~/.Trash` directory and records file metadata into the `trash` table.
## Forensic Value
This evidence is crucial for forensic investigations as it surfaces deleted items that may indicate anti‑forensic behavior or sensitive data handling.
---
# USB Info
> Source: https://kb.binalyze.ai/air/features/acquisition/supported-evidence/macos-collections-detail/usb-info.html
## Overview
**Evidence:** USB Info
**Description:** Filter USB Mass Storage Class events
**Category:** System
**Platform:** macos
**Short Name:** usbinfo
**Is Parsed:** Yes
**Sent to Investigation Hub:** Yes
**Collect File(s):** No
## Background
USB Mass Storage Class (USBMSC) events on macOS capture USB device connections, disconnections, and storage device interactions through the IOKit framework. These logs track external storage devices including USB drives, external hard drives, and other mass storage peripherals connected to the system.
## Data Collected
This collector gathers structured data about usb info.
## Collection Method
This collector uses the macOS 'log' command with predicate-based filtering to extract USB Mass Storage Class subsystem events and USB-related process activities over the last 3 days. Log entries are parsed from JSON format and stored in the unified_logs table with PredicateType='USB Info'.
## Forensic Value
USB logs are critical for investigating data exfiltration, unauthorized device usage, malware introduction via USB drives, and BadUSB attacks. They reveal what USB devices were connected, when, and for how long, helping identify potential data theft, evidence tampering, or malicious device insertion during security incidents.
---
# User Groups
> Source: https://kb.binalyze.ai/air/features/acquisition/supported-evidence/macos-collections-detail/user-groups.html
## Overview
**Evidence:** User Groups
**Description:** Collect User Groups
**Category:** System
**Platform:** macos
**Short Name:** groups
**Is Parsed:** Yes
**Sent to Investigation Hub:** Yes
**Collect File(s):** No
## Background
This collector gathers user group information from macOS. This data is essential for understanding access control, detecting misconfigurations, and investigating group-based privilege assignments.
## Data Collected
This collector gathers structured data about user groups.
## Collection Method
This collector queries osquery’s `groups` table and records results into the `user_groups` table.
## Forensic Value
This evidence is crucial for forensic investigations as it reveals group memberships and elevated permissions, aiding detection of unauthorized privilege grants.
---
# Users
> Source: https://kb.binalyze.ai/air/features/acquisition/supported-evidence/macos-collections-detail/users.html
## Overview
**Evidence:** Users
**Description:** Collect Users
**Category:** System
**Platform:** macos
**Short Name:** users
**Is Parsed:** Yes
**Sent to Investigation Hub:** Yes
**Collect File(s):** No
## Background
User account information provides details about local accounts on macOS, including group memberships and account properties. This data is essential for understanding system access and detecting unauthorized accounts.
## Data Collected
This collector gathers structured data about users.
### Users Data
| Field | Description | Example |
|-------|-------------|---------|
| `UserId` | User Id | 123 |
| `Name` | Name | Example value |
| `GroupId` | Group Id | 123 |
| `GroupName` | Group Name | Example value |
| `Description` | Description | Example value |
| `Directory` | Directory | Example value |
| `Shell` | Shell | Example value |
## Collection Method
This collector queries osquery’s `users` joined with `groups` and records results into the `users` table.
## Forensic Value
This evidence is crucial for forensic investigations as it helps identify suspicious or unauthorized accounts, detect privilege escalation, and audit user management for policy compliance.
---
# Vivaldi Bookmarks
> Source: https://kb.binalyze.ai/air/features/acquisition/supported-evidence/macos-collections-detail/vivaldi-bookmarks.html
## Overview
**Evidence:** Vivaldi Bookmarks
**Description:** Collect Vivaldi Bookmarks
**Category:** Applications
**Platform:** macos
**Short Name:** vbkmrks
**Is Parsed:** Yes
**Sent to Investigation Hub:** Yes
**Collect File(s):** No
## Background
Browser bookmarks represent user-saved favorite websites and organizational folders. This data reveals frequently accessed sites, user interests, and potential indicators of reconnaissance, phishing targets, or suspicious infrastructure.
## Data Collected
This collector gathers structured data about vivaldi bookmarks.
### Vivaldi Bookmarks Data
| Field | Description | Example |
|-------|-------------|---------|
| `UserName` | User Name | Example value |
| `ProfileName` | Profile Name | Example value |
| `BrowserName` | Browser Name | Example value |
| `GUID` | GUID | Example value |
| `BookmarkID` | Bookmark ID | Example value |
| `Name` | Name | Example value |
| `Type` | Type | Example value |
| `URL` | URL | Example value |
| `ParentFolder` | Parent Folder | Example value |
| `DateAdded` | Date Added | 2023-10-15 14:30:25+03:00 |
| `DateLastUsed` | Date Last Used | 2023-10-15 14:30:25+03:00 |
| `DateModified` | Date Modified | 2023-10-15 14:30:25+03:00 |
## Collection Method
This collector parses the browser's Bookmarks file to extract saved URLs, folder structures, timestamps, and metadata.
## Forensic Value
Bookmark analysis identifies targeted websites, phishing pages, command-and-control servers, internal resources, and organizational reconnaissance patterns. Investigators can detect social engineering campaigns, credential harvesting attempts, and lateral movement preparation.
---
# Vivaldi Browsing History
> Source: https://kb.binalyze.ai/air/features/acquisition/supported-evidence/macos-collections-detail/vivaldi-browsing-history.html
## Overview
**Evidence:** Vivaldi Browsing History
**Description:** Collect visited URLs from Vivaldi
**Category:** Applications
**Platform:** macos
**Short Name:** vhst
**Is Parsed:** Yes
**Sent to Investigation Hub:** Yes
**Collect File(s):** No
## Background
Browser history records all websites visited by users, including URLs, page titles, visit timestamps, visit counts, and transition types. This data is essential for reconstructing user activity, identifying malicious websites, and tracking lateral movement or reconnaissance activities.
## Data Collected
This collector gathers structured data about vivaldi browsing history.
### Vivaldi Browsing History Data
| Field | Description | Example |
|-------|-------------|---------|
| `AccessTime` | Access Time | 2023-10-15 14:30:25+03:00 |
| `AccessCount` | Access Count | 123 |
| `URL` | URL | Example value |
| `Browser` | Browser | Example value |
| `Title` | Title | Example value |
| `VisitDuration` | Visit Duration | Example value |
| `Referrer` | Referrer | Example value |
| `TypedCount` | Typed Count | 123 |
| `IsHidden` | Is Hidden | true |
| `TransitionType` | Transition Type | Example value |
| `VisitID` | Visit ID | 123 |
| `TransitionQualifiers` | Transition Qualifiers | Example value |
| `User` | User | Example value |
| `Profile` | Profile | Example value |
| `HistoryFilePath` | History File Path | Example value |
## Collection Method
This collector queries the browser's History database to extract visited URLs, timestamps, referrer information, and user interaction patterns.
## Forensic Value
Browsing history reveals phishing sites, malicious domains, command-and-control servers, data exfiltration targets, and reconnaissance activities. Analysts can identify compromised credentials, track attacker infrastructure, and correlate web activity with other security events to establish attack timelines.
---
# Vivaldi Cookies
> Source: https://kb.binalyze.ai/air/features/acquisition/supported-evidence/macos-collections-detail/vivaldi-cookies.html
## Overview
**Evidence:** Vivaldi Cookies
**Description:** Collect Vivaldi Cookies
**Category:** Applications
**Platform:** macos
**Short Name:** vcookies
**Is Parsed:** Yes
**Sent to Investigation Hub:** Yes
**Collect File(s):** No
## Background
Browser cookies store session tokens, authentication credentials, user preferences, and tracking data. This data is essential for understanding authenticated sessions, tracking user activity across websites, and identifying session hijacking or credential theft.
## Data Collected
This collector gathers structured data about vivaldi cookies.
### Vivaldi Cookies Data
| Field | Description | Example |
|-------|-------------|---------|
| `UserName` | User Name | Example value |
| `BrowserName` | Browser Name | Example value |
| `ProfileName` | Profile Name | Example value |
| `Domain` | Domain | Example value |
| `Name` | Name | Example value |
| `Path` | Path | Example value |
| `Value` | Value | Example value |
| `IsSecure` | Is Secure | 123 |
| `IsHTTPOnly` | Is HTTP Only | 123 |
| `HasExpires` | Has Expires | 123 |
| `IsPersistent` | Is Persistent | 123 |
| `Priority` | Priority | 123 |
| `SameSite` | Same Site | 123 |
| `SourcePort` | Source Port | 123 |
| `SourceScheme` | Source Scheme | 123 |
| `CreationTime` | Creation Time | 2023-10-15 14:30:25+03:00 |
| `ExpiresTime` | Expires Time | 2023-10-15 14:30:25+03:00 |
| `LastAccessTime` | Last Access Time | 2023-10-15 14:30:25+03:00 |
## Collection Method
This collector extracts cookies from the browser's Cookies database, including domain, name, value, path, expiration, and security flags.
## Forensic Value
Cookie analysis reveals active sessions, authentication tokens, persistent tracking identifiers, and potential session hijacking. Investigators can identify stolen credentials, unauthorized access, and cross-site tracking used for reconnaissance or targeting.
---
# Vivaldi Downloads
> Source: https://kb.binalyze.ai/air/features/acquisition/supported-evidence/macos-collections-detail/vivaldi-downloads.html
## Overview
**Evidence:** Vivaldi Downloads
**Description:** Collect Vivaldi Downloads
**Category:** Applications
**Platform:** macos
**Short Name:** vdwnlds
**Is Parsed:** Yes
**Sent to Investigation Hub:** Yes
**Collect File(s):** No
## Background
Browser download history records files downloaded by users, including file paths, timestamps, URLs, referrer information, and download status. This data is essential for tracking file acquisition, identifying potentially malicious downloads, and reconstructing user activity timelines.
## Data Collected
This collector gathers structured data about vivaldi downloads.
### Vivaldi Downloads Data
| Field | Description | Example |
|-------|-------------|---------|
| `UserName` | User Name | Example value |
| `Browser` | Browser | Example value |
| `ProfileName` | Profile Name | Example value |
| `URL` | URL | Example value |
| `TargetPath` | Target Path | Example value |
| `CurrentPath` | Current Path | Example value |
| `Referrer` | Referrer | Example value |
| `LastModified` | Last Modified | 2023-10-15 14:30:25+03:00 |
| `DangerType` | Danger Type | 123 |
| `Opened` | Opened | 123 |
| `TabURL` | Tab URL | Example value |
| `TabReferrerURL` | Tab Referrer URL | Example value |
| `StartTime` | Start Time | 2023-10-15 14:30:25+03:00 |
| `EndTime` | End Time | 2023-10-15 14:30:25+03:00 |
| `HistoryFilePath` | History File Path | Example value |
## Collection Method
This collector queries the browser's History database to extract download records, including file paths, download times, source URLs, and security flags.
## Forensic Value
Download history reveals malware delivery vectors, data exfiltration attempts, unauthorized software installation, and user interaction with suspicious websites. Analysts can identify downloaded malicious files, track attack chains, and correlate downloads with other security events.
---
# Vivaldi Favicons
> Source: https://kb.binalyze.ai/air/features/acquisition/supported-evidence/macos-collections-detail/vivaldi-favicons.html
## Overview
**Evidence:** Vivaldi Favicons
**Description:** Collect Vivaldi Favicons
**Category:** Applications
**Platform:** macos
**Short Name:** vfico
**Is Parsed:** Yes
**Sent to Investigation Hub:** Yes
**Collect File(s):** No
## Background
Browser favicons are cached website icons that provide visual history of visited sites. This data supplements browsing history by revealing sites accessed even if history was deleted.
## Data Collected
This collector gathers structured data about vivaldi favicons.
### Vivaldi Favicons Data
| Field | Description | Example |
|-------|-------------|---------|
| `ID` | ID | 123 |
| `UserName` | User Name | Example value |
| `BrowserName` | Browser Name | Example value |
| `Profile` | Profile | Example value |
| `URL` | URL | Example value |
| `IconType` | Icon Type | 123 |
| `Path` | Path | Example value |
## Collection Method
This collector queries the browser's Favicons database to extract cached website icons and associated URLs.
## Forensic Value
Favicon analysis can recover evidence of deleted browsing history, identify visited sites through icon fingerprinting, and correlate with other browser artifacts to establish comprehensive activity timelines.
---
# Vivaldi Form History
> Source: https://kb.binalyze.ai/air/features/acquisition/supported-evidence/macos-collections-detail/vivaldi-form-history.html
## Overview
**Evidence:** Vivaldi Form History
**Description:** Collect Vivaldi Form History
**Category:** Applications
**Platform:** macos
**Short Name:** vfh
**Is Parsed:** Yes
**Sent to Investigation Hub:** Yes
**Collect File(s):** No
## Background
Browser form history stores previously entered form data including search queries, usernames, and other input fields. This data reveals user search patterns, account information, and potential data leakage through autofill.
## Data Collected
This collector gathers structured data about vivaldi form history.
### Vivaldi Form History Data
| Field | Description | Example |
|-------|-------------|---------|
| `UserName` | User Name | Example value |
| `BrowserName` | Browser Name | Example value |
| `Name` | Name | Example value |
| `Value` | Value | Example value |
| `ValueLower` | Value Lower | Example value |
| `Count` | Count | 123 |
| `Profile` | Profile | Example value |
| `Path` | Path | Example value |
| `DateCreated` | Date Created | 2023-10-15 14:30:25+03:00 |
| `DateLastUsed` | Date Last Used | 2023-10-15 14:30:25+03:00 |
## Collection Method
This collector queries the browser's form history database to extract saved form field data, search queries, and associated timestamps.
## Forensic Value
Form history exposes reconnaissance activities, credential enumeration attempts, search queries revealing attacker intent, and potentially sensitive information entered into web forms. Analysts can identify data exfiltration, account compromise indicators, and targeted search patterns.
---
# Vivaldi Local Storage
> Source: https://kb.binalyze.ai/air/features/acquisition/supported-evidence/macos-collections-detail/vivaldi-local-storage.html
## Overview
**Evidence:** Vivaldi Local Storage
**Description:** Collect Vivaldi Local Storage
**Category:** Applications
**Platform:** macos
**Short Name:** vls
**Is Parsed:** Yes
**Sent to Investigation Hub:** Yes
**Collect File(s):** No
## Background
Browser local storage contains persistent key-value data stored by websites. This data includes user preferences, session state, cached data, and potentially authentication tokens or sensitive information.
## Data Collected
This collector gathers structured data about vivaldi local storage.
### Vivaldi Local Storage Data
| Field | Description | Example |
|-------|-------------|---------|
| `UserName` | User Name | Example value |
| `ProfileName` | Profile Name | Example value |
| `BrowserName` | Browser Name | Example value |
| `Key` | Key | Example value |
| `Value` | Value | Example value |
| `Path` | Path | Example value |
## Collection Method
This collector extracts local storage data from browser storage databases and files.
## Forensic Value
Local storage analysis reveals stored credentials, session tokens, tracking identifiers, and application state that can indicate compromised accounts, persistent tracking, or malicious website activity. Analysts can identify credential theft, session hijacking, and data exfiltration attempts.
---
# Vivaldi Login Data
> Source: https://kb.binalyze.ai/air/features/acquisition/supported-evidence/macos-collections-detail/vivaldi-login-data.html
## Overview
**Evidence:** Vivaldi Login Data
**Description:** Collect Vivaldi Login Data
**Category:** Applications
**Platform:** macos
**Short Name:** vlgd
**Is Parsed:** Yes
**Sent to Investigation Hub:** Yes
**Collect File(s):** No
## Background
Browser login data stores saved passwords and credential information. This data is critical for identifying stored credentials, password reuse patterns, and potential credential theft targets.
## Data Collected
This collector gathers structured data about vivaldi login data.
### Vivaldi Login Data Data
| Field | Description | Example |
|-------|-------------|---------|
| `ID` | ID | 123 |
| `UserName` | User Name | Example value |
| `BrowserName` | Browser Name | Example value |
| `OriginURL` | Origin URL | Example value |
| `SignonRealm` | Signon Realm | Example value |
| `BlacklistedByUser` | Blacklisted By User | 123 |
| `Scheme` | Scheme | Example value |
| `PasswordType` | Password Type | Example value |
| `TimesUsed` | Times Used | 123 |
| `Profile` | Profile | Example value |
| `Path` | Path | Example value |
| `DateCreated` | Date Created | 2023-10-15 14:30:25+03:00 |
| `DateLastUsed` | Date Last Used | 2023-10-15 14:30:25+03:00 |
## Collection Method
This collector extracts saved credentials from the browser's Login Data database, including URLs, usernames, and encrypted passwords.
## Forensic Value
Login data analysis reveals stored credentials, password reuse across services, targeted accounts, and potential credential harvesting. Investigators can identify compromised accounts, credential theft attempts, and unauthorized access to saved credentials by malware or attackers.
---
# Vivaldi Sessions
> Source: https://kb.binalyze.ai/air/features/acquisition/supported-evidence/macos-collections-detail/vivaldi-sessions.html
## Overview
**Evidence:** Vivaldi Sessions
**Description:** Collect Vivaldi Sessions
**Category:** Applications
**Platform:** macos
**Short Name:** vvss
**Is Parsed:** Yes
**Sent to Investigation Hub:** Yes
**Collect File(s):** No
## Background
Browser sessions maintain active tab state, cookies, and authentication context. This data reveals currently active user sessions, open websites, and authenticated connections at the time of collection.
## Data Collected
This collector gathers structured data about vivaldi sessions.
### Vivaldi Sessions Data
| Field | Description | Example |
|-------|-------------|---------|
| `ID` | ID | 123 |
| `WindowID` | Window ID | 123 |
| `Active` | Active | true |
| `Url` | Url | Example value |
| `Title` | Title | Example value |
| `Deleted` | Deleted | true |
| `Group` | Group | Example value |
| `History` | History | [] |
| `BrowserName` | Browser Name | Example value |
## Collection Method
This collector captures browser session data including active tabs, session cookies, and authentication state.
## Forensic Value
Session analysis identifies active compromises, authenticated sessions to malicious sites, concurrent suspicious activities, and real-time indicators of ongoing attacks. Analysts can detect active C2 connections, authenticated malware communications, and live attacker sessions.
---
# Vivaldi Thumbnails
> Source: https://kb.binalyze.ai/air/features/acquisition/supported-evidence/macos-collections-detail/vivaldi-thumbnails.html
## Overview
**Evidence:** Vivaldi Thumbnails
**Description:** Collect Vivaldi Thumbnails
**Category:** Applications
**Platform:** macos
**Short Name:** vthmb
**Is Parsed:** Yes
**Sent to Investigation Hub:** Yes
**Collect File(s):** No
## Background
Browser thumbnails are cached preview images of visited websites. This visual data supplements browsing history by providing screenshots of accessed pages, useful for recovering deleted history and identifying visited content.
## Data Collected
This collector gathers structured data about vivaldi thumbnails.
### Vivaldi Thumbnails Data
| Field | Description | Example |
|-------|-------------|---------|
| `UserName` | User Name | Example value |
| `Browser` | Browser | Example value |
| `URL` | URL | Example value |
| `URLRank` | URL Rank | 123 |
| `Title` | Title | Example value |
| `Profile` | Profile | Example value |
| `Path` | Path | Example value |
## Collection Method
This collector extracts cached thumbnail images from browser storage.
## Forensic Value
Thumbnail analysis provides visual evidence of visited websites, can recover evidence after history deletion, and helps identify phishing pages, malicious sites, or sensitive internal resources accessed by users through visual inspection.
---
# Vivaldi User Profiles
> Source: https://kb.binalyze.ai/air/features/acquisition/supported-evidence/macos-collections-detail/vivaldi-user-profiles.html
## Overview
**Evidence:** Vivaldi User Profiles
**Description:** Collect Vivaldi User Profiles
**Category:** Applications
**Platform:** macos
**Short Name:** vprfls
**Is Parsed:** Yes
**Sent to Investigation Hub:** Yes
**Collect File(s):** No
## Background
Browser user profiles store per-user browser configurations, extensions, settings, and data segregation. This data reveals multiple user accounts, profile switching patterns, and user-specific browsing behavior.
## Data Collected
This collector gathers structured data about vivaldi user profiles.
### Vivaldi User Profiles Data
| Field | Description | Example |
|-------|-------------|---------|
| `EndpointUserName` | Endpoint User Name | Example value |
| `Profile` | Profile | Example value |
| `ProfileUserName` | Profile User Name | Example value |
| `BrowserName` | Browser Name | Example value |
| `BackgroundApps` | Background Apps | true |
| `GoogleAccountGivenName` | Google Account Given Name | Example value |
| `GoogleAccountID` | Google Account ID | Example value |
| `GoogleAccountName` | Google Account Name | Example value |
| `PictureFileName` | Picture File Name | Example value |
| `LastDownloadedPictureURL` | Last Downloaded Picture URL | Example value |
| `HostedDomain` | Hosted Domain | Example value |
| `IsConsentedPrimaryAccount` | Is Consented Primary Account | true |
| `IsEphemeral` | Is Ephemeral | true |
## Collection Method
This collector enumerates browser user profiles and extracts profile metadata, configurations, and associated data paths.
## Forensic Value
Profile analysis identifies multiple user accounts, profile-specific extensions and configurations, shared device usage patterns, and potential privilege escalation or lateral movement using different browser profiles. Investigators can correlate activity across profiles and identify unauthorized profile creation.
---
# Vivaldi Web Storage
> Source: https://kb.binalyze.ai/air/features/acquisition/supported-evidence/macos-collections-detail/vivaldi-web-storage.html
## Overview
**Evidence:** Vivaldi Web Storage
**Description:** Collect Vivaldi Web Storage
**Category:** Applications
**Platform:** macos
**Short Name:** vws
**Is Parsed:** Yes
**Sent to Investigation Hub:** Yes
**Collect File(s):** No
## Background
Browser web storage includes both local and session storage used by websites to store client-side data. This data can contain application state, user preferences, cached content, and potentially sensitive information.
## Data Collected
This collector gathers structured data about vivaldi web storage.
### Vivaldi Web Storage Data
| Field | Description | Example |
|-------|-------------|---------|
| `UserName` | User Name | Example value |
| `ProfileName` | Profile Name | Example value |
| `BrowserName` | Browser Name | Example value |
| `Key` | Key | Example value |
| `Value` | Value | Example value |
| `Path` | Path | Example value |
## Collection Method
This collector extracts web storage data from browser storage locations including local storage and session storage.
## Forensic Value
Web storage analysis reveals cached application data, stored credentials, session information, and potential data exfiltration staging. Analysts can identify malicious website activity, stored authentication tokens, tracking identifiers, and sensitive data cached by compromised web applications.
---
# Waterfox Browsing History
> Source: https://kb.binalyze.ai/air/features/acquisition/supported-evidence/macos-collections-detail/waterfox-browsing-history.html
## Overview
**Evidence:** Waterfox Browsing History
**Description:** Collect visited URLs from Waterfox
**Category:** Applications
**Platform:** macos
**Short Name:** whst
**Is Parsed:** Yes
**Sent to Investigation Hub:** Yes
**Collect File(s):** No
## Background
Browser history records all websites visited by users, including URLs, page titles, visit timestamps, visit counts, and transition types. This data is essential for reconstructing user activity, identifying malicious websites, and tracking lateral movement or reconnaissance activities.
## Data Collected
This collector gathers structured data about waterfox browsing history.
### Waterfox Browsing History Data
| Field | Description | Example |
|-------|-------------|---------|
| `AccessTime` | Access Time | 2023-10-15 14:30:25+03:00 |
| `AccessCount` | Access Count | 123 |
| `URL` | URL | Example value |
| `Browser` | Browser | Example value |
| `Title` | Title | Example value |
| `VisitDuration` | Visit Duration | Example value |
| `Referrer` | Referrer | Example value |
| `TypedCount` | Typed Count | 123 |
| `IsHidden` | Is Hidden | true |
| `TransitionType` | Transition Type | Example value |
| `VisitID` | Visit ID | 123 |
| `TransitionQualifiers` | Transition Qualifiers | Example value |
| `User` | User | Example value |
| `Profile` | Profile | Example value |
| `HistoryFilePath` | History File Path | Example value |
## Collection Method
This collector queries the browser's History database to extract visited URLs, timestamps, referrer information, and user interaction patterns.
## Forensic Value
Browsing history reveals phishing sites, malicious domains, command-and-control servers, data exfiltration targets, and reconnaissance activities. Analysts can identify compromised credentials, track attacker infrastructure, and correlate web activity with other security events to establish attack timelines.
---
# Waterfox Downloads
> Source: https://kb.binalyze.ai/air/features/acquisition/supported-evidence/macos-collections-detail/waterfox-downloads.html
## Overview
**Evidence:** Waterfox Downloads
**Description:** Collect Waterfox Downloads
**Category:** Applications
**Platform:** macos
**Short Name:** wdwnlds
**Is Parsed:** Yes
**Sent to Investigation Hub:** Yes
**Collect File(s):** No
## Background
Browser download history records files downloaded by users, including file paths, timestamps, URLs, referrer information, and download status. This data is essential for tracking file acquisition, identifying potentially malicious downloads, and reconstructing user activity timelines.
## Data Collected
This collector gathers structured data about waterfox downloads.
### Waterfox Downloads Data
| Field | Description | Example |
|-------|-------------|---------|
| `UserName` | User Name | Example value |
| `Browser` | Browser | Example value |
| `ProfileName` | Profile Name | Example value |
| `URL` | URL | Example value |
| `TargetPath` | Target Path | Example value |
| `CurrentPath` | Current Path | Example value |
| `Referrer` | Referrer | Example value |
| `LastModified` | Last Modified | 2023-10-15 14:30:25+03:00 |
| `DangerType` | Danger Type | 123 |
| `Opened` | Opened | 123 |
| `TabURL` | Tab URL | Example value |
| `TabReferrerURL` | Tab Referrer URL | Example value |
| `StartTime` | Start Time | 2023-10-15 14:30:25+03:00 |
| `EndTime` | End Time | 2023-10-15 14:30:25+03:00 |
| `HistoryFilePath` | History File Path | Example value |
## Collection Method
This collector queries the browser's History database to extract download records, including file paths, download times, source URLs, and security flags.
## Forensic Value
Download history reveals malware delivery vectors, data exfiltration attempts, unauthorized software installation, and user interaction with suspicious websites. Analysts can identify downloaded malicious files, track attack chains, and correlate downloads with other security events.
---
# Wifi Logs
> Source: https://kb.binalyze.ai/air/features/acquisition/supported-evidence/macos-collections-detail/wifi-logs.html
## Overview
**Evidence:** Wifi Logs
**Description:** Collect Wifi Logs
**Category:** Network
**Platform:** macos
**Short Name:** wifil
**Is Parsed:** No
**Sent to Investigation Hub:** No
**Collect File(s):** Yes
## Background
macOS WiFi logs contain wireless network connection events, authentication attempts, network transitions, and WiFi-related errors. These logs track all wireless network activity on the system.
## Data Collected
This collector gathers structured data about wifi logs.
## Collection Method
This collector gathers WiFi log files from /var/log/wifi*, which includes detailed wireless network connection logs, authentication events, and network diagnostics.
## Forensic Value
WiFi logs help establish device location history through network connections, identify unauthorized network access attempts, track network-based attacks, and reconstruct user movement and connectivity patterns.
---
# Wireless Network Connections
> Source: https://kb.binalyze.ai/air/features/acquisition/supported-evidence/macos-collections-detail/wireless-network-connections.html
## Overview
**Evidence:** Wireless Network Connections
**Description:** Collect Wireless Network Connections
**Category:** Network
**Platform:** macos
**Short Name:** wncon
**Is Parsed:** Yes
**Sent to Investigation Hub:** Yes
**Collect File(s):** No
## Background
Known Wi‑Fi networks provide a history of SSIDs and connection metadata. This data is essential for tracking user mobility, rogue AP exposure, and lateral movement via wireless.
## Data Collected
This collector gathers structured data about wireless network connections.
## Collection Method
This collector parses `/Library/Preferences/com.apple.wifi.known-networks.plist` and records entries into `wireless_network_connections`.
## Forensic Value
This evidence is crucial for forensic investigations as it reveals trusted SSIDs, join behavior, and captive portal interactions that can indicate risk or compromise.
---
# XProtect Remediation
> Source: https://kb.binalyze.ai/air/features/acquisition/supported-evidence/macos-collections-detail/xprotect-remediation.html
## Overview
**Evidence:** XProtect Remediation
**Description:** Filter detecting and blocking malicious software events
**Category:** System
**Platform:** macos
**Short Name:** xpr
**Is Parsed:** Yes
**Sent to Investigation Hub:** Yes
**Collect File(s):** No
## Background
XProtect is Apple's built-in malware detection and removal technology for macOS. The XProtect Framework logs malware detection events, remediation actions, and threat blocking activities. It provides real-time protection against known malware and suspicious files.
## Data Collected
This collector gathers structured data about xprotect remediation.
## Collection Method
This collector uses the macOS 'log' command with predicate-based filtering to extract XProtect Framework structured events over the last 3 days. Log entries are parsed from JSON format and stored in the unified_logs table with PredicateType='XProtect Remediation'.
## Forensic Value
XProtect logs are essential for identifying malware infections, tracking threat detection and remediation, and understanding the scope of compromise. They reveal what malware was detected, when, what files were affected, and what remediation actions were taken, providing crucial evidence of security incidents.
---
# Linux Collections
> Source: https://kb.binalyze.ai/air/features/acquisition/supported-evidence/linux-collections.html
## **Linux Evidence List**
---
# AI Agent Events
> Source: https://kb.binalyze.ai/air/features/acquisition/supported-evidence/linux-collections-detail/ai-agent-events.html
## Overview
**Evidence:** AI Agent Events
**Description:** Parse AI agent transcripts to extract a hash-chained event timeline
**Category:** AI
**Platform:** linux
**Short Name:** aievt
**Is Parsed:** Yes
**Sent to Investigation Hub:** Yes
**Collect File(s):** No
## Background
AI coding assistants and agent frameworks persist prompts, tool calls, approvals, and execution results in JSONL or JSON transcripts. Those records show what an agent was asked to do, which tools it invoked, and whether a user approved the action.
## Data Collected
This collector gathers structured data about AI agent events, including prompts, assistant messages, tool calls, MCP server names, approval states, exit codes, and source hashes.
## Collection Method
Transcripts from AI tools are parsed with explicit size limits. Each event is hash-chained using the previous hash and source offset so analysts can detect gaps or tampering. Prompt text is stored as a bounded redacted excerpt with SHA-256.
## Forensic Value
Reconstructs what an AI agent did on the host: which commands it ran, which files it referenced, which MCP tools it called, and whether the user approved or denied those actions. Risk flags highlight prompt injection, dangerous commands, credential access, and transcript integrity gaps.
---
# AI Agents
> Source: https://kb.binalyze.ai/air/features/acquisition/supported-evidence/linux-collections-detail/ai-agents.html
## Overview
**Evidence:** AI Agents
**Description:** Parse custom AI agent definitions and autonomy settings
**Category:** AI
**Platform:** linux
**Short Name:** aiagent
**Is Parsed:** Yes
**Sent to Investigation Hub:** Yes
**Collect File(s):** No
## Background
Claude Code, Cursor, and similar tools store custom agent definitions that control tools, permission modes, MCP servers, and standing instructions. A poisoned agent definition can grant broad tool access or persist hidden automation.
## Data Collected
This collector gathers structured data about custom AI agent definitions, including agent path, tools, permission mode, MCP servers, and bounded instruction excerpts.
## Collection Method
This collector parses YAML frontmatter and bounded markdown bodies from project and global agent directories, preserving raw sources in Content.
## Forensic Value
Identifies custom agents with broad tool access, permission bypass, embedded hooks, or malicious instructions that can steer AI tool execution without an interactive prompt.
---
# AI Artifacts
> Source: https://kb.binalyze.ai/air/features/acquisition/supported-evidence/linux-collections-detail/ai-artifacts.html
## Overview
**Evidence:** AI Artifacts
**Description:** Inventory AI tool files (configs, transcripts, databases, MCP definitions)
**Category:** AI
**Platform:** linux
**Short Name:** aiart
**Is Parsed:** No
**Sent to Investigation Hub:** Yes
**Collect File(s):** Yes
## Background
AI coding tools leave configs, transcripts, state databases, and MCP definitions under user homes and project directories such as .cursor/, .claude/, and .codex/. An inventory of those files establishes which tools were present and where their evidence lives.
## Data Collected
This collector gathers structured inventory data about AI tool artifacts, including path, SHA-256, size, modification time, tool name, and artifact type, and collects the matching files.
## Collection Method
This collector walks user homes and development directories to discover AI tool artifacts in known and project-local locations, recording file metadata without deep-parsing content.
## Forensic Value
Provides a filesystem inventory of AI tool presence on the host. Paths, hashes, and timestamps support timeline correlation with other collectors and tamper detection across acquisitions.
---
# AI Commands
> Source: https://kb.binalyze.ai/air/features/acquisition/supported-evidence/linux-collections-detail/ai-commands.html
## Overview
**Evidence:** AI Commands
**Description:** Parse custom AI slash-command definitions
**Category:** AI
**Platform:** linux
**Short Name:** aicmd
**Is Parsed:** Yes
**Sent to Investigation Hub:** Yes
**Collect File(s):** No
## Background
Claude Code and Cursor allow project and user custom slash-command markdown files. Those commands can embed shell instructions, automation, or prompt text that runs whenever an operator invokes them.
## Data Collected
This collector gathers structured data about custom AI slash-command definitions, including command path, name, and bounded redacted excerpts.
## Collection Method
This collector parses command frontmatter and bounded excerpts from project and user command directories while preserving raw files in Content.
## Forensic Value
Identifies custom commands that embed dangerous shell instructions, prompt injection, or hidden automation that can execute during AI-assisted work.
---
# AI Configs
> Source: https://kb.binalyze.ai/air/features/acquisition/supported-evidence/linux-collections-detail/ai-configs.html
## Overview
**Evidence:** AI Configs
**Description:** Parse AI tool configuration files for provider, model, and permission metadata
**Category:** AI
**Platform:** linux
**Short Name:** aicfg
**Is Parsed:** Yes
**Sent to Investigation Hub:** Yes
**Collect File(s):** No
## Background
AI tools store provider, model, permission, and trust settings in files such as claude.json, settings.json, and cli-config.json. Those settings determine which models are used and whether the agent can act without approval.
## Data Collected
This collector gathers structured data about AI tool configurations, including provider, model, permission mode, trust overrides, and secret-like value indicators.
## Collection Method
This collector scans per-user and project-scope config files and parses JSON content to extract provider, model, and permission metadata and to flag risky configurations.
## Forensic Value
Reveals which AI providers and models are configured, whether auto-approve or manual permission modes are in use, and whether configs contain secret-like values. Risk flags highlight permission bypasses and broad tool allowlists.
---
# AI Hooks
> Source: https://kb.binalyze.ai/air/features/acquisition/supported-evidence/linux-collections-detail/ai-hooks.html
## Overview
**Evidence:** AI Hooks
**Description:** Parse AI hook definitions that auto-execute commands on agent events
**Category:** AI
**Platform:** linux
**Short Name:** aihook
**Is Parsed:** Yes
**Sent to Investigation Hub:** Yes
**Collect File(s):** No
## Background
Cursor hooks.json and Claude settings can bind shell commands to AI tool events such as session start, prompt submit, or file edit. Hooks run automatically and are a high-risk persistence and remote-code-execution surface.
## Data Collected
This collector gathers structured data about AI hook definitions, including event, matcher, command, referenced script hashes, and source config paths.
## Collection Method
This collector parses hook event, matcher, and command entries from Cursor and Claude hook configs, hashes referenced scripts, and preserves source configs.
## Forensic Value
Hooks can run shell commands before or after AI tool events without an interactive prompt. They are a high-risk persistence and code-execution surface during AI-assisted investigations.
---
# AI MCP
> Source: https://kb.binalyze.ai/air/features/acquisition/supported-evidence/linux-collections-detail/ai-mcp.html
## Overview
**Evidence:** AI MCP
**Description:** Extract MCP server definitions and execution surface from AI tool configs
**Category:** AI
**Platform:** linux
**Short Name:** aimcp
**Is Parsed:** Yes
**Sent to Investigation Hub:** Yes
**Collect File(s):** No
## Background
Model Context Protocol (MCP) servers are the execution bridge between AI agents and external systems. Configured servers can launch local commands, expose environment variables, or connect to remote endpoints.
## Data Collected
This collector gathers structured data about MCP servers, including server name, launch command and arguments, environment-variable names, transport, URL host, and risk flags.
## Collection Method
This collector scans claude_desktop_config.json, .mcp.json, and mcp.json in per-user and per-project scope and extracts each defined MCP server.
## Forensic Value
Inventories every MCP server configured on the host. Risk flags highlight remote servers, risky launchers, broad environment exposure, and suspicious command patterns that can extend an agent's reach.
---
# AI Models
> Source: https://kb.binalyze.ai/air/features/acquisition/supported-evidence/linux-collections-detail/ai-models.html
## Overview
**Evidence:** AI Models
**Description:** Inventory Ollama, Hugging Face, and signature-confirmed local model components
**Category:** AI
**Platform:** linux
**Short Name:** aimodel
**Is Parsed:** Yes
**Sent to Investigation Hub:** Yes
**Collect File(s):** No
## Background
Local model runtimes such as Ollama and Hugging Face caches store model revisions and component files on disk. Presence of a model is not proof it was executed; inventory still shows which components were referenced locally.
## Data Collected
This collector gathers structured data about local model-component references, including model key, revision, component role, locator, capture mode, digest provenance, verification status, size, and timestamps where available.
## Collection Method
This collector parses bounded Ollama manifests, Hugging Face cache refs and snapshot metadata, and recognized model metadata inside signature-confirmed project roots. Large model-content files remain metadata-only.
## Forensic Value
Shows which model revisions and components were referenced locally, preserving declared and physically computed digest provenance without treating a downloaded model as proof of execution.
---
# AI Rules
> Source: https://kb.binalyze.ai/air/features/acquisition/supported-evidence/linux-collections-detail/ai-rules.html
## Overview
**Evidence:** AI Rules
**Description:** Parse AI tool rules, instructions, and ignore/indexing files
**Category:** AI
**Platform:** linux
**Short Name:** airule
**Is Parsed:** Yes
**Sent to Investigation Hub:** Yes
**Collect File(s):** No
## Background
Instruction files such as CLAUDE.md, AGENTS.md, .cursorrules, Copilot instructions, and AI ignore/indexing files persist standing guidance for coding assistants. They can inject attacker-controlled directives or hide files from AI review.
## Data Collected
This collector gathers structured data about AI rules and instruction files, including path, type, SHA-256, size, and a bounded redacted excerpt.
## Collection Method
This collector uses the AI artifact scanner across user homes and development roots. Full rule bodies are copied to Content; Case.db stores metadata plus a bounded redacted excerpt.
## Forensic Value
Surfaces persistent prompt-injection directives and anti-forensics exclusions that can hide malicious files from AI review or steer agent behavior across sessions.
---
# AI Secrets
> Source: https://kb.binalyze.ai/air/features/acquisition/supported-evidence/linux-collections-detail/ai-secrets.html
## Overview
**Evidence:** AI Secrets
**Description:** Hunt credentials exposed in AI prompts, responses, tool output, and configs
**Category:** AI
**Platform:** linux
**Short Name:** aisec
**Is Parsed:** Yes
**Sent to Investigation Hub:** Yes
**Collect File(s):** No
## Background
Developers paste tokens, keys, and credentials into AI prompts. Agents can also echo secrets back or receive them from tool output and config stores. Those findings are a credential-exposure lead, not proof of theft.
## Data Collected
This collector gathers structured data about redacted credential findings, including detector, category, surface, location, and links back to the originating session or event. Cleartext is not stored in Case.db.
## Collection Method
This collector reuses the AI artifact scanner and transcript/config parsers. A two-stage detector emits redacted findings with their surface and location. Cleartext is never written to Case.db.
## Forensic Value
Reveals secrets a developer pasted into an AI tool, that an agent echoed back, or that a tool returned. Findings link to the originating session, event, and preserved raw source for follow-up.
---
# AI Sessions
> Source: https://kb.binalyze.ai/air/features/acquisition/supported-evidence/linux-collections-detail/ai-sessions.html
## Overview
**Evidence:** AI Sessions
**Description:** Parse AI agent transcripts to extract session timeline headers
**Category:** AI
**Platform:** linux
**Short Name:** aisess
**Is Parsed:** Yes
**Sent to Investigation Hub:** Yes
**Collect File(s):** No
## Background
AI coding tools persist conversation sessions as JSONL transcripts and workspace files. Session headers show when an agent ran, which project it targeted, and how many prompts or tool calls occurred.
## Data Collected
This collector gathers structured data about AI agent sessions, including project path, timestamps, message counts, tool-call counts, and session-level risk flags.
## Collection Method
This collector scans per-user transcript directories and workspace storage. JSONL transcripts are parsed for session metadata; workspace files map workspace IDs to project paths.
## Forensic Value
Reconstructs the timeline of AI agent sessions: when they ran, in which projects, and how many prompts and tool calls occurred. Risk flags surface sessions with dangerous commands, prompt injection indicators, or transcript integrity gaps.
---
# AI Skills
> Source: https://kb.binalyze.ai/air/features/acquisition/supported-evidence/linux-collections-detail/ai-skills.html
## Overview
**Evidence:** AI Skills
**Description:** Parse AI skill definitions and bundled script inventory
**Category:** AI
**Platform:** linux
**Short Name:** aiskill
**Is Parsed:** Yes
**Sent to Investigation Hub:** Yes
**Collect File(s):** No
## Background
AI tools load SKILL.md definitions and bundled scripts that extend agent capabilities. A malicious skill can inject dynamic context or execute bundled payloads during an agent run.
## Data Collected
This collector gathers structured data about AI skills and bundled skill files, including skill path, tools, SHA-256, size, and inventoried script metadata.
## Collection Method
This collector parses skill frontmatter and body excerpts, inventories bundled scripts by path, hash, and size, and copies raw files to Content.
## Forensic Value
Surfaces executable skill payloads and dynamic context injection that can steer or compromise AI agent execution beyond the interactive prompt.
---
# AnyDesk Logs
> Source: https://kb.binalyze.ai/air/features/acquisition/supported-evidence/linux-collections-detail/anydesk-logs.html
## Overview
**Evidence:** AnyDesk Logs
**Description:** Collect AnyDesk Logs
**Category:** Applications
**Platform:** linux
**Short Name:** adsl
**Is Parsed:** No
**Sent to Investigation Hub:** No
**Collect File(s):** Yes
## Background
AnyDesk is a remote desktop application widely used for remote support and access. On Linux, it maintains trace logs of connections, sessions, file transfers, and activities in user home directories and system-wide locations, including custom deployment prefixes.
## Data Collected
This collector gathers structured data about anydesk logs.
## Collection Method
This collector gathers AnyDesk trace files from user home directories (.anydesk folders with optional custom prefixes), system logs in /var/log, and .config/AnyDesk/Logs directories.
## Forensic Value
AnyDesk logs are critical for investigating unauthorized remote access, ransomware deployment, data exfiltration, lateral movement, and insider threats. They reveal connection times, remote IP addresses, file transfers, and session activities frequently involved in security incidents.
---
# Apache Logs
> Source: https://kb.binalyze.ai/air/features/acquisition/supported-evidence/linux-collections-detail/apache-logs.html
## Overview
**Evidence:** Apache Logs
**Description:** Collect Apache Logs
**Category:** Applications
**Platform:** linux
**Short Name:** apcl
**Is Parsed:** No
**Sent to Investigation Hub:** No
**Collect File(s):** Yes
## Background
Apache HTTP Server logs on Linux record web server access, errors, and activities. Logs are located in /var/log/apache2 on Debian-based systems and /var/log/httpd on Red Hat-based systems, with custom installations potentially in /usr/local.
## Data Collected
This collector gathers structured data about apache logs.
## Collection Method
This collector gathers Apache logs from standard system locations including Debian-style (/var/log/apache2) and custom installations (/usr/local/var/log/httpd).
## Forensic Value
Apache logs are critical for investigating web application attacks, SQL injection, XSS attacks, web shell uploads, data exfiltration, and unauthorized access. Access logs reveal attacker IPs, request patterns, and attack vectors.
---
# AppArmor Profiles
> Source: https://kb.binalyze.ai/air/features/acquisition/supported-evidence/linux-collections-detail/apparmor-profiles.html
## Overview
**Evidence:** AppArmor Profiles
**Description:** Collect AppArmor profiles
**Category:** System
**Platform:** linux
**Short Name:** aarmpr
**Is Parsed:** Yes
**Sent to Investigation Hub:** Yes
**Collect File(s):** No
## Background
This collector gathers AppArmor profiles information from the Linux system. This data is essential for understanding application confinement policies and detecting policy changes.
## Data Collected
This collector gathers structured data about apparmor profiles.
## Collection Method
This collector reads AppArmor policy data from the kernel security filesystem and records it into the `app_armor_profiles` table.
## Forensic Value
This evidence is crucial for forensic investigations as it shows enforced or complain modes and loaded profiles, helping detect weakened application confinement or policy tampering.
---
# APT History
> Source: https://kb.binalyze.ai/air/features/acquisition/supported-evidence/linux-collections-detail/apt-history.html
## Overview
**Evidence:** APT History
**Description:** Collect APT history
**Category:** System
**Platform:** linux
**Short Name:** apthst
**Is Parsed:** Yes
**Sent to Investigation Hub:** Yes
**Collect File(s):** No
## Background
This collector gathers apt history information from the Linux system. This data is essential for understanding system activity, detecting security incidents, and investigating system-related events.
## Data Collected
This collector gathers structured data about apt history.
## Collection Method
This collector parses the necessary data from the `apt_history` table.
## Forensic Value
This evidence is crucial for forensic investigations as it provides apt history information. It helps investigators understand system activity, detect security incidents, and investigate system-related events. The data can reveal system changes, unauthorized activities, and potential security vulnerabilities. Analysts can use this information to identify system compromises, trace malicious activities, and assess Linux security posture.
---
# APT Sources
> Source: https://kb.binalyze.ai/air/features/acquisition/supported-evidence/linux-collections-detail/apt-sources.html
## Overview
**Evidence:** APT Sources
**Description:** Collect APT sources
**Category:** System
**Platform:** linux
**Short Name:** apts
**Is Parsed:** Yes
**Sent to Investigation Hub:** Yes
**Collect File(s):** No
## Background
This collector gathers apt sources information from the Linux system. This data is essential for understanding system activity, detecting security incidents, and investigating system-related events.
## Data Collected
This collector gathers structured data about apt sources.
## Collection Method
This collector parses the necessary data from the `apt_sources` table.
## Forensic Value
This evidence is crucial for forensic investigations as it provides apt sources information. It helps investigators understand system activity, detect security incidents, and investigate system-related events. The data can reveal system changes, unauthorized activities, and potential security vulnerabilities. Analysts can use this information to identify system compromises, trace malicious activities, and assess Linux security posture.
---
# ARP Table
> Source: https://kb.binalyze.ai/air/features/acquisition/supported-evidence/linux-collections-detail/arp-table.html
## Overview
**Evidence:** ARP Table
**Description:** Collect ARP table
**Category:** Network
**Platform:** linux
**Short Name:** arpt
**Is Parsed:** Yes
**Sent to Investigation Hub:** Yes
**Collect File(s):** No
## Background
This collector gathers arp table information from the Linux system. This data is essential for understanding system activity, detecting security incidents, and investigating system-related events.
## Data Collected
This collector gathers structured data about arp table.
## Collection Method
This collector parses the necessary data from the `arp_table` table.
## Forensic Value
This evidence is crucial for forensic investigations as it provides arp table information. It helps investigators understand system activity, detect security incidents, and investigate system-related events. The data can reveal system changes, unauthorized activities, and potential security vulnerabilities. Analysts can use this information to identify system compromises, trace malicious activities, and assess Linux security posture.
---
# Auth Logs
> Source: https://kb.binalyze.ai/air/features/acquisition/supported-evidence/linux-collections-detail/auth-logs.html
## Overview
**Evidence:** Auth Logs
**Description:** Collect Auth Logs
**Category:** System
**Platform:** linux
**Short Name:** authl
**Is Parsed:** No
**Sent to Investigation Hub:** No
**Collect File(s):** Yes
## Background
Linux auth logs record all authentication-related events including user logins, sudo commands, SSH access attempts, su commands, and PAM (Pluggable Authentication Modules) activities. Found primarily on Debian-based systems.
## Data Collected
This collector gathers structured data about auth logs.
## Collection Method
This collector gathers auth log files from /var/log/auth*, including rotated logs, which contain detailed authentication and authorization events.
## Forensic Value
Auth logs are critical for investigating unauthorized access, privilege escalation, brute force attacks, SSH intrusions, and user activity. They provide essential evidence for security incident investigations and compliance auditing.
---
# Block Devices
> Source: https://kb.binalyze.ai/air/features/acquisition/supported-evidence/linux-collections-detail/block-devices.html
## Overview
**Evidence:** Block Devices
**Description:** Collect block devices
**Category:** DiskFilesystem
**Platform:** linux
**Short Name:** blkd
**Is Parsed:** Yes
**Sent to Investigation Hub:** Yes
**Collect File(s):** No
## Background
Linux exposes block device attributes via sysfs, detailing disks and partitions (size, removability, RO flag). Enumerating these devices reveals attached media and storage topology.
## Data Collected
This collector gathers structured data about block devices.
### Block Devices Data
| Field | Description | Example |
|-------|-------------|---------|
| `Name` | Name | Example value |
| `Major` | Major | Example value |
| `Minor` | Minor | Example value |
| `ReadOnly` | Read Only | true |
| `Removable` | Removable | true |
| `Size` | Size | 123 |
| `Parent` | Parent | Example value |
## Collection Method
This collector walks /sys/block, parses device attributes (dev, size, removable, ro) and builds a hierarchy of parent/child relationships.
## Forensic Value
Block device inventory assists with identifying removable media use, hidden partitions, and potential data staging volumes. It supports triage of storage relevant to an incident.
---
# Boot Logs
> Source: https://kb.binalyze.ai/air/features/acquisition/supported-evidence/linux-collections-detail/boot-logs.html
## Overview
**Evidence:** Boot Logs
**Description:** Collect Boot Logs
**Category:** System
**Platform:** linux
**Short Name:** bootl
**Is Parsed:** No
**Sent to Investigation Hub:** No
**Collect File(s):** Yes
## Background
Linux boot logs contain messages from the boot process including kernel initialization, service startup, hardware detection, and boot-time errors. They capture the system state during boot and initialization sequences.
## Data Collected
This collector gathers structured data about boot logs.
## Collection Method
This collector gathers boot log files from /var/log/boot*, which record system boot messages, service initialization, and startup sequence events.
## Forensic Value
Boot logs are valuable for investigating system startup issues, rootkit persistence mechanisms, boot-time malware, service startup anomalies, and understanding system configuration at boot time.
---
# Brave Bookmarks
> Source: https://kb.binalyze.ai/air/features/acquisition/supported-evidence/linux-collections-detail/brave-bookmarks.html
## Overview
**Evidence:** Brave Bookmarks
**Description:** Collect Brave Bookmarks
**Category:** Applications
**Platform:** linux
**Short Name:** bbkmrks
**Is Parsed:** Yes
**Sent to Investigation Hub:** Yes
**Collect File(s):** No
## Background
Browser bookmarks represent user-saved favorite websites and organizational folders. This data reveals frequently accessed sites, user interests, and potential indicators of reconnaissance, phishing targets, or suspicious infrastructure.
## Data Collected
This collector gathers structured data about brave bookmarks.
### Brave Bookmarks Data
| Field | Description | Example |
|-------|-------------|---------|
| `UserName` | User Name | Example value |
| `ProfileName` | Profile Name | Example value |
| `BrowserName` | Browser Name | Example value |
| `GUID` | GUID | Example value |
| `BookmarkID` | Bookmark ID | Example value |
| `Name` | Name | Example value |
| `Type` | Type | Example value |
| `URL` | URL | Example value |
| `ParentFolder` | Parent Folder | Example value |
| `DateAdded` | Date Added | 2023-10-15 14:30:25+03:00 |
| `DateLastUsed` | Date Last Used | 2023-10-15 14:30:25+03:00 |
| `DateModified` | Date Modified | 2023-10-15 14:30:25+03:00 |
## Collection Method
This collector parses the browser's Bookmarks file to extract saved URLs, folder structures, timestamps, and metadata.
## Forensic Value
Bookmark analysis identifies targeted websites, phishing pages, command-and-control servers, internal resources, and organizational reconnaissance patterns. Investigators can detect social engineering campaigns, credential harvesting attempts, and lateral movement preparation.
---
# Brave Browsing History
> Source: https://kb.binalyze.ai/air/features/acquisition/supported-evidence/linux-collections-detail/brave-browsing-history.html
## Overview
**Evidence:** Brave Browsing History
**Description:** Collect visited URLs from Brave
**Category:** Applications
**Platform:** linux
**Short Name:** bhst
**Is Parsed:** Yes
**Sent to Investigation Hub:** Yes
**Collect File(s):** No
## Background
Browser history records all websites visited by users, including URLs, page titles, visit timestamps, visit counts, and transition types. This data is essential for reconstructing user activity, identifying malicious websites, and tracking lateral movement or reconnaissance activities.
## Data Collected
This collector gathers structured data about brave browsing history.
### Brave Browsing History Data
| Field | Description | Example |
|-------|-------------|---------|
| `AccessTime` | Access Time | 2023-10-15 14:30:25+03:00 |
| `AccessCount` | Access Count | 123 |
| `URL` | URL | Example value |
| `Browser` | Browser | Example value |
| `Title` | Title | Example value |
| `VisitDuration` | Visit Duration | Example value |
| `Referrer` | Referrer | Example value |
| `TypedCount` | Typed Count | 123 |
| `IsHidden` | Is Hidden | true |
| `TransitionType` | Transition Type | Example value |
| `VisitID` | Visit ID | 123 |
| `TransitionQualifiers` | Transition Qualifiers | Example value |
| `User` | User | Example value |
| `Profile` | Profile | Example value |
| `HistoryFilePath` | History File Path | Example value |
## Collection Method
This collector queries the browser's History database to extract visited URLs, timestamps, referrer information, and user interaction patterns.
## Forensic Value
Browsing history reveals phishing sites, malicious domains, command-and-control servers, data exfiltration targets, and reconnaissance activities. Analysts can identify compromised credentials, track attacker infrastructure, and correlate web activity with other security events to establish attack timelines.
---
# Brave Cookies
> Source: https://kb.binalyze.ai/air/features/acquisition/supported-evidence/linux-collections-detail/brave-cookies.html
## Overview
**Evidence:** Brave Cookies
**Description:** Collect Brave Cookies
**Category:** Applications
**Platform:** linux
**Short Name:** bcookies
**Is Parsed:** Yes
**Sent to Investigation Hub:** Yes
**Collect File(s):** No
## Background
Browser cookies store session tokens, authentication credentials, user preferences, and tracking data. This data is essential for understanding authenticated sessions, tracking user activity across websites, and identifying session hijacking or credential theft.
## Data Collected
This collector gathers structured data about brave cookies.
### Brave Cookies Data
| Field | Description | Example |
|-------|-------------|---------|
| `UserName` | User Name | Example value |
| `BrowserName` | Browser Name | Example value |
| `ProfileName` | Profile Name | Example value |
| `Domain` | Domain | Example value |
| `Name` | Name | Example value |
| `Path` | Path | Example value |
| `Value` | Value | Example value |
| `IsSecure` | Is Secure | 123 |
| `IsHTTPOnly` | Is HTTP Only | 123 |
| `HasExpires` | Has Expires | 123 |
| `IsPersistent` | Is Persistent | 123 |
| `Priority` | Priority | 123 |
| `SameSite` | Same Site | 123 |
| `SourcePort` | Source Port | 123 |
| `SourceScheme` | Source Scheme | 123 |
| `CreationTime` | Creation Time | 2023-10-15 14:30:25+03:00 |
| `ExpiresTime` | Expires Time | 2023-10-15 14:30:25+03:00 |
| `LastAccessTime` | Last Access Time | 2023-10-15 14:30:25+03:00 |
## Collection Method
This collector extracts cookies from the browser's Cookies database, including domain, name, value, path, expiration, and security flags.
## Forensic Value
Cookie analysis reveals active sessions, authentication tokens, persistent tracking identifiers, and potential session hijacking. Investigators can identify stolen credentials, unauthorized access, and cross-site tracking used for reconnaissance or targeting.
---
# Brave Downloads
> Source: https://kb.binalyze.ai/air/features/acquisition/supported-evidence/linux-collections-detail/brave-downloads.html
## Overview
**Evidence:** Brave Downloads
**Description:** Collect Brave Downloads
**Category:** Applications
**Platform:** linux
**Short Name:** bdwnlds
**Is Parsed:** Yes
**Sent to Investigation Hub:** Yes
**Collect File(s):** No
## Background
Browser download history records files downloaded by users, including file paths, timestamps, URLs, referrer information, and download status. This data is essential for tracking file acquisition, identifying potentially malicious downloads, and reconstructing user activity timelines.
## Data Collected
This collector gathers structured data about brave downloads.
### Brave Downloads Data
| Field | Description | Example |
|-------|-------------|---------|
| `UserName` | User Name | Example value |
| `Browser` | Browser | Example value |
| `ProfileName` | Profile Name | Example value |
| `URL` | URL | Example value |
| `TargetPath` | Target Path | Example value |
| `CurrentPath` | Current Path | Example value |
| `Referrer` | Referrer | Example value |
| `LastModified` | Last Modified | 2023-10-15 14:30:25+03:00 |
| `DangerType` | Danger Type | 123 |
| `Opened` | Opened | 123 |
| `TabURL` | Tab URL | Example value |
| `TabReferrerURL` | Tab Referrer URL | Example value |
| `StartTime` | Start Time | 2023-10-15 14:30:25+03:00 |
| `EndTime` | End Time | 2023-10-15 14:30:25+03:00 |
| `HistoryFilePath` | History File Path | Example value |
## Collection Method
This collector queries the browser's History database to extract download records, including file paths, download times, source URLs, and security flags.
## Forensic Value
Download history reveals malware delivery vectors, data exfiltration attempts, unauthorized software installation, and user interaction with suspicious websites. Analysts can identify downloaded malicious files, track attack chains, and correlate downloads with other security events.
---
# Brave Favicons
> Source: https://kb.binalyze.ai/air/features/acquisition/supported-evidence/linux-collections-detail/brave-favicons.html
## Overview
**Evidence:** Brave Favicons
**Description:** Collect Brave Favicons
**Category:** Applications
**Platform:** linux
**Short Name:** bfico
**Is Parsed:** Yes
**Sent to Investigation Hub:** Yes
**Collect File(s):** No
## Background
Browser favicons are cached website icons that provide visual history of visited sites. This data supplements browsing history by revealing sites accessed even if history was deleted.
## Data Collected
This collector gathers structured data about brave favicons.
### Brave Favicons Data
| Field | Description | Example |
|-------|-------------|---------|
| `ID` | ID | 123 |
| `UserName` | User Name | Example value |
| `BrowserName` | Browser Name | Example value |
| `Profile` | Profile | Example value |
| `URL` | URL | Example value |
| `IconType` | Icon Type | 123 |
| `Path` | Path | Example value |
## Collection Method
This collector queries the browser's Favicons database to extract cached website icons and associated URLs.
## Forensic Value
Favicon analysis can recover evidence of deleted browsing history, identify visited sites through icon fingerprinting, and correlate with other browser artifacts to establish comprehensive activity timelines.
---
# Brave Form History
> Source: https://kb.binalyze.ai/air/features/acquisition/supported-evidence/linux-collections-detail/brave-form-history.html
## Overview
**Evidence:** Brave Form History
**Description:** Collect Brave Form History
**Category:** Applications
**Platform:** linux
**Short Name:** bfh
**Is Parsed:** Yes
**Sent to Investigation Hub:** Yes
**Collect File(s):** No
## Background
Browser form history stores previously entered form data including search queries, usernames, and other input fields. This data reveals user search patterns, account information, and potential data leakage through autofill.
## Data Collected
This collector gathers structured data about brave form history.
### Brave Form History Data
| Field | Description | Example |
|-------|-------------|---------|
| `UserName` | User Name | Example value |
| `BrowserName` | Browser Name | Example value |
| `Name` | Name | Example value |
| `Value` | Value | Example value |
| `ValueLower` | Value Lower | Example value |
| `Count` | Count | 123 |
| `Profile` | Profile | Example value |
| `Path` | Path | Example value |
| `DateCreated` | Date Created | 2023-10-15 14:30:25+03:00 |
| `DateLastUsed` | Date Last Used | 2023-10-15 14:30:25+03:00 |
## Collection Method
This collector queries the browser's form history database to extract saved form field data, search queries, and associated timestamps.
## Forensic Value
Form history exposes reconnaissance activities, credential enumeration attempts, search queries revealing attacker intent, and potentially sensitive information entered into web forms. Analysts can identify data exfiltration, account compromise indicators, and targeted search patterns.
---
# Brave Local Storage
> Source: https://kb.binalyze.ai/air/features/acquisition/supported-evidence/linux-collections-detail/brave-local-storage.html
## Overview
**Evidence:** Brave Local Storage
**Description:** Collect Brave Local Storage
**Category:** Applications
**Platform:** linux
**Short Name:** bls
**Is Parsed:** Yes
**Sent to Investigation Hub:** Yes
**Collect File(s):** No
## Background
Browser local storage contains persistent key-value data stored by websites. This data includes user preferences, session state, cached data, and potentially authentication tokens or sensitive information.
## Data Collected
This collector gathers structured data about brave local storage.
### Brave Local Storage Data
| Field | Description | Example |
|-------|-------------|---------|
| `UserName` | User Name | Example value |
| `ProfileName` | Profile Name | Example value |
| `BrowserName` | Browser Name | Example value |
| `Key` | Key | Example value |
| `Value` | Value | Example value |
| `Path` | Path | Example value |
## Collection Method
This collector extracts local storage data from browser storage databases and files.
## Forensic Value
Local storage analysis reveals stored credentials, session tokens, tracking identifiers, and application state that can indicate compromised accounts, persistent tracking, or malicious website activity. Analysts can identify credential theft, session hijacking, and data exfiltration attempts.
---
# Brave Login Data
> Source: https://kb.binalyze.ai/air/features/acquisition/supported-evidence/linux-collections-detail/brave-login-data.html
## Overview
**Evidence:** Brave Login Data
**Description:** Collect Brave Login Data
**Category:** Applications
**Platform:** linux
**Short Name:** blgd
**Is Parsed:** Yes
**Sent to Investigation Hub:** Yes
**Collect File(s):** No
## Background
Browser login data stores saved passwords and credential information. This data is critical for identifying stored credentials, password reuse patterns, and potential credential theft targets.
## Data Collected
This collector gathers structured data about brave login data.
### Brave Login Data Data
| Field | Description | Example |
|-------|-------------|---------|
| `ID` | ID | 123 |
| `UserName` | User Name | Example value |
| `BrowserName` | Browser Name | Example value |
| `OriginURL` | Origin URL | Example value |
| `SignonRealm` | Signon Realm | Example value |
| `BlacklistedByUser` | Blacklisted By User | 123 |
| `Scheme` | Scheme | Example value |
| `PasswordType` | Password Type | Example value |
| `TimesUsed` | Times Used | 123 |
| `Profile` | Profile | Example value |
| `Path` | Path | Example value |
| `DateCreated` | Date Created | 2023-10-15 14:30:25+03:00 |
| `DateLastUsed` | Date Last Used | 2023-10-15 14:30:25+03:00 |
## Collection Method
This collector extracts saved credentials from the browser's Login Data database, including URLs, usernames, and encrypted passwords.
## Forensic Value
Login data analysis reveals stored credentials, password reuse across services, targeted accounts, and potential credential harvesting. Investigators can identify compromised accounts, credential theft attempts, and unauthorized access to saved credentials by malware or attackers.
---
# Brave Sessions
> Source: https://kb.binalyze.ai/air/features/acquisition/supported-evidence/linux-collections-detail/brave-sessions.html
## Overview
**Evidence:** Brave Sessions
**Description:** Collect Brave Sessions
**Category:** Applications
**Platform:** linux
**Short Name:** brvss
**Is Parsed:** Yes
**Sent to Investigation Hub:** Yes
**Collect File(s):** No
## Background
Browser sessions maintain active tab state, cookies, and authentication context. This data reveals currently active user sessions, open websites, and authenticated connections at the time of collection.
## Data Collected
This collector gathers structured data about brave sessions.
### Brave Sessions Data
| Field | Description | Example |
|-------|-------------|---------|
| `ID` | ID | 123 |
| `WindowID` | Window ID | 123 |
| `Active` | Active | true |
| `Url` | Url | Example value |
| `Title` | Title | Example value |
| `Deleted` | Deleted | true |
| `Group` | Group | Example value |
| `History` | History | [] |
| `BrowserName` | Browser Name | Example value |
## Collection Method
This collector captures browser session data including active tabs, session cookies, and authentication state.
## Forensic Value
Session analysis identifies active compromises, authenticated sessions to malicious sites, concurrent suspicious activities, and real-time indicators of ongoing attacks. Analysts can detect active C2 connections, authenticated malware communications, and live attacker sessions.
---
# Brave Thumbnails
> Source: https://kb.binalyze.ai/air/features/acquisition/supported-evidence/linux-collections-detail/brave-thumbnails.html
## Overview
**Evidence:** Brave Thumbnails
**Description:** Collect Brave Thumbnails
**Category:** Applications
**Platform:** linux
**Short Name:** bthmb
**Is Parsed:** Yes
**Sent to Investigation Hub:** Yes
**Collect File(s):** No
## Background
Browser thumbnails are cached preview images of visited websites. This visual data supplements browsing history by providing screenshots of accessed pages, useful for recovering deleted history and identifying visited content.
## Data Collected
This collector gathers structured data about brave thumbnails.
### Brave Thumbnails Data
| Field | Description | Example |
|-------|-------------|---------|
| `UserName` | User Name | Example value |
| `Browser` | Browser | Example value |
| `URL` | URL | Example value |
| `URLRank` | URL Rank | 123 |
| `Title` | Title | Example value |
| `Profile` | Profile | Example value |
| `Path` | Path | Example value |
## Collection Method
This collector extracts cached thumbnail images from browser storage.
## Forensic Value
Thumbnail analysis provides visual evidence of visited websites, can recover evidence after history deletion, and helps identify phishing pages, malicious sites, or sensitive internal resources accessed by users through visual inspection.
---
# Brave User Profiles
> Source: https://kb.binalyze.ai/air/features/acquisition/supported-evidence/linux-collections-detail/brave-user-profiles.html
## Overview
**Evidence:** Brave User Profiles
**Description:** Collect Brave User Profiles
**Category:** Applications
**Platform:** linux
**Short Name:** bprfls
**Is Parsed:** Yes
**Sent to Investigation Hub:** Yes
**Collect File(s):** No
## Background
Browser user profiles store per-user browser configurations, extensions, settings, and data segregation. This data reveals multiple user accounts, profile switching patterns, and user-specific browsing behavior.
## Data Collected
This collector gathers structured data about brave user profiles.
### Brave User Profiles Data
| Field | Description | Example |
|-------|-------------|---------|
| `EndpointUserName` | Endpoint User Name | Example value |
| `Profile` | Profile | Example value |
| `ProfileUserName` | Profile User Name | Example value |
| `BrowserName` | Browser Name | Example value |
| `BackgroundApps` | Background Apps | true |
| `GoogleAccountGivenName` | Google Account Given Name | Example value |
| `GoogleAccountID` | Google Account ID | Example value |
| `GoogleAccountName` | Google Account Name | Example value |
| `PictureFileName` | Picture File Name | Example value |
| `LastDownloadedPictureURL` | Last Downloaded Picture URL | Example value |
| `HostedDomain` | Hosted Domain | Example value |
| `IsConsentedPrimaryAccount` | Is Consented Primary Account | true |
| `IsEphemeral` | Is Ephemeral | true |
## Collection Method
This collector enumerates browser user profiles and extracts profile metadata, configurations, and associated data paths.
## Forensic Value
Profile analysis identifies multiple user accounts, profile-specific extensions and configurations, shared device usage patterns, and potential privilege escalation or lateral movement using different browser profiles. Investigators can correlate activity across profiles and identify unauthorized profile creation.
---
# Brave Web Storage
> Source: https://kb.binalyze.ai/air/features/acquisition/supported-evidence/linux-collections-detail/brave-web-storage.html
## Overview
**Evidence:** Brave Web Storage
**Description:** Collect Brave Web Storage
**Category:** Applications
**Platform:** linux
**Short Name:** bws
**Is Parsed:** Yes
**Sent to Investigation Hub:** Yes
**Collect File(s):** No
## Background
Browser web storage includes both local and session storage used by websites to store client-side data. This data can contain application state, user preferences, cached content, and potentially sensitive information.
## Data Collected
This collector gathers structured data about brave web storage.
### Brave Web Storage Data
| Field | Description | Example |
|-------|-------------|---------|
| `UserName` | User Name | Example value |
| `ProfileName` | Profile Name | Example value |
| `BrowserName` | Browser Name | Example value |
| `Key` | Key | Example value |
| `Value` | Value | Example value |
| `Path` | Path | Example value |
## Collection Method
This collector extracts web storage data from browser storage locations including local storage and session storage.
## Forensic Value
Web storage analysis reveals cached application data, stored credentials, session information, and potential data exfiltration staging. Analysts can identify malicious website activity, stored authentication tokens, tracking identifiers, and sensitive data cached by compromised web applications.
---
# Chrome Bookmarks
> Source: https://kb.binalyze.ai/air/features/acquisition/supported-evidence/linux-collections-detail/chrome-bookmarks.html
## Overview
**Evidence:** Chrome Bookmarks
**Description:** Collect Chrome Bookmarks
**Category:** Applications
**Platform:** linux
**Short Name:** cbkmrks
**Is Parsed:** Yes
**Sent to Investigation Hub:** Yes
**Collect File(s):** No
## Background
Browser bookmarks represent user-saved favorite websites and organizational folders. This data reveals frequently accessed sites, user interests, and potential indicators of reconnaissance, phishing targets, or suspicious infrastructure.
## Data Collected
This collector gathers structured data about chrome bookmarks.
### Chrome Bookmarks Data
| Field | Description | Example |
|-------|-------------|---------|
| `UserName` | User Name | Example value |
| `ProfileName` | Profile Name | Example value |
| `BrowserName` | Browser Name | Example value |
| `GUID` | GUID | Example value |
| `BookmarkID` | Bookmark ID | Example value |
| `Name` | Name | Example value |
| `Type` | Type | Example value |
| `URL` | URL | Example value |
| `ParentFolder` | Parent Folder | Example value |
| `DateAdded` | Date Added | 2023-10-15 14:30:25+03:00 |
| `DateLastUsed` | Date Last Used | 2023-10-15 14:30:25+03:00 |
| `DateModified` | Date Modified | 2023-10-15 14:30:25+03:00 |
## Collection Method
This collector parses the browser's Bookmarks file to extract saved URLs, folder structures, timestamps, and metadata.
## Forensic Value
Bookmark analysis identifies targeted websites, phishing pages, command-and-control servers, internal resources, and organizational reconnaissance patterns. Investigators can detect social engineering campaigns, credential harvesting attempts, and lateral movement preparation.
---
# Chrome Browsing History
> Source: https://kb.binalyze.ai/air/features/acquisition/supported-evidence/linux-collections-detail/chrome-browsing-history.html
## Overview
**Evidence:** Chrome Browsing History
**Description:** Collect visited URLs from Google Chrome
**Category:** Applications
**Platform:** linux
**Short Name:** chst
**Is Parsed:** Yes
**Sent to Investigation Hub:** Yes
**Collect File(s):** No
## Background
Browser history records all websites visited by users, including URLs, page titles, visit timestamps, visit counts, and transition types. This data is essential for reconstructing user activity, identifying malicious websites, and tracking lateral movement or reconnaissance activities.
## Data Collected
This collector gathers structured data about chrome browsing history.
### Chrome Browsing History Data
| Field | Description | Example |
|-------|-------------|---------|
| `AccessTime` | Access Time | 2023-10-15 14:30:25+03:00 |
| `AccessCount` | Access Count | 123 |
| `URL` | URL | Example value |
| `Browser` | Browser | Example value |
| `Title` | Title | Example value |
| `VisitDuration` | Visit Duration | Example value |
| `Referrer` | Referrer | Example value |
| `TypedCount` | Typed Count | 123 |
| `IsHidden` | Is Hidden | true |
| `TransitionType` | Transition Type | Example value |
| `VisitID` | Visit ID | 123 |
| `TransitionQualifiers` | Transition Qualifiers | Example value |
| `User` | User | Example value |
| `Profile` | Profile | Example value |
| `HistoryFilePath` | History File Path | Example value |
## Collection Method
This collector queries the browser's History database to extract visited URLs, timestamps, referrer information, and user interaction patterns.
## Forensic Value
Browsing history reveals phishing sites, malicious domains, command-and-control servers, data exfiltration targets, and reconnaissance activities. Analysts can identify compromised credentials, track attacker infrastructure, and correlate web activity with other security events to establish attack timelines.
---
# Chrome Cookies
> Source: https://kb.binalyze.ai/air/features/acquisition/supported-evidence/linux-collections-detail/chrome-cookies.html
## Overview
**Evidence:** Chrome Cookies
**Description:** Collect Chrome Cookies
**Category:** Applications
**Platform:** linux
**Short Name:** ccookies
**Is Parsed:** Yes
**Sent to Investigation Hub:** Yes
**Collect File(s):** No
## Background
Browser cookies store session tokens, authentication credentials, user preferences, and tracking data. This data is essential for understanding authenticated sessions, tracking user activity across websites, and identifying session hijacking or credential theft.
## Data Collected
This collector gathers structured data about chrome cookies.
### Chrome Cookies Data
| Field | Description | Example |
|-------|-------------|---------|
| `UserName` | User Name | Example value |
| `BrowserName` | Browser Name | Example value |
| `ProfileName` | Profile Name | Example value |
| `Domain` | Domain | Example value |
| `Name` | Name | Example value |
| `Path` | Path | Example value |
| `Value` | Value | Example value |
| `IsSecure` | Is Secure | 123 |
| `IsHTTPOnly` | Is HTTP Only | 123 |
| `HasExpires` | Has Expires | 123 |
| `IsPersistent` | Is Persistent | 123 |
| `Priority` | Priority | 123 |
| `SameSite` | Same Site | 123 |
| `SourcePort` | Source Port | 123 |
| `SourceScheme` | Source Scheme | 123 |
| `CreationTime` | Creation Time | 2023-10-15 14:30:25+03:00 |
| `ExpiresTime` | Expires Time | 2023-10-15 14:30:25+03:00 |
| `LastAccessTime` | Last Access Time | 2023-10-15 14:30:25+03:00 |
## Collection Method
This collector extracts cookies from the browser's Cookies database, including domain, name, value, path, expiration, and security flags.
## Forensic Value
Cookie analysis reveals active sessions, authentication tokens, persistent tracking identifiers, and potential session hijacking. Investigators can identify stolen credentials, unauthorized access, and cross-site tracking used for reconnaissance or targeting.
---
# Chrome Downloads
> Source: https://kb.binalyze.ai/air/features/acquisition/supported-evidence/linux-collections-detail/chrome-downloads.html
## Overview
**Evidence:** Chrome Downloads
**Description:** Collect Chrome Downloads
**Category:** Applications
**Platform:** linux
**Short Name:** cdwnlds
**Is Parsed:** Yes
**Sent to Investigation Hub:** Yes
**Collect File(s):** No
## Background
Browser download history records files downloaded by users, including file paths, timestamps, URLs, referrer information, and download status. This data is essential for tracking file acquisition, identifying potentially malicious downloads, and reconstructing user activity timelines.
## Data Collected
This collector gathers structured data about chrome downloads.
### Chrome Downloads Data
| Field | Description | Example |
|-------|-------------|---------|
| `UserName` | User Name | Example value |
| `Browser` | Browser | Example value |
| `ProfileName` | Profile Name | Example value |
| `URL` | URL | Example value |
| `TargetPath` | Target Path | Example value |
| `CurrentPath` | Current Path | Example value |
| `Referrer` | Referrer | Example value |
| `LastModified` | Last Modified | 2023-10-15 14:30:25+03:00 |
| `DangerType` | Danger Type | 123 |
| `Opened` | Opened | 123 |
| `TabURL` | Tab URL | Example value |
| `TabReferrerURL` | Tab Referrer URL | Example value |
| `StartTime` | Start Time | 2023-10-15 14:30:25+03:00 |
| `EndTime` | End Time | 2023-10-15 14:30:25+03:00 |
| `HistoryFilePath` | History File Path | Example value |
## Collection Method
This collector queries the browser's History database to extract download records, including file paths, download times, source URLs, and security flags.
## Forensic Value
Download history reveals malware delivery vectors, data exfiltration attempts, unauthorized software installation, and user interaction with suspicious websites. Analysts can identify downloaded malicious files, track attack chains, and correlate downloads with other security events.
---
# Chrome Extensions
> Source: https://kb.binalyze.ai/air/features/acquisition/supported-evidence/linux-collections-detail/chrome-extensions.html
## Overview
**Evidence:** Chrome Extensions
**Description:** Collect Chrome Extensions
**Category:** Applications
**Platform:** linux
**Short Name:** chrext
**Is Parsed:** Yes
**Sent to Investigation Hub:** Yes
**Collect File(s):** No
## Background
Chromium-based browser extensions extend functionality and can be abused for persistence, credential theft, tracking, or data exfiltration. Manifest metadata and permissions offer insight into capabilities and risk.
## Data Collected
This collector gathers structured data about chrome extensions.
## Collection Method
This collector discovers profile Preference files, parses extension configuration, locates each extension's manifest.json, copies artifacts to case content, and normalizes extension metadata (permissions, version, author, install time).
## Forensic Value
Extension inventories help identify malicious or risky add-ons, correlate with browser activity, and detect persistence mechanisms. Permissions and update URLs aid threat hunting and attribution.
---
# Chrome Favicons
> Source: https://kb.binalyze.ai/air/features/acquisition/supported-evidence/linux-collections-detail/chrome-favicons.html
## Overview
**Evidence:** Chrome Favicons
**Description:** Collect Chrome Favicons
**Category:** Applications
**Platform:** linux
**Short Name:** cfico
**Is Parsed:** Yes
**Sent to Investigation Hub:** Yes
**Collect File(s):** No
## Background
Browser favicons are cached website icons that provide visual history of visited sites. This data supplements browsing history by revealing sites accessed even if history was deleted.
## Data Collected
This collector gathers structured data about chrome favicons.
### Chrome Favicons Data
| Field | Description | Example |
|-------|-------------|---------|
| `ID` | ID | 123 |
| `UserName` | User Name | Example value |
| `BrowserName` | Browser Name | Example value |
| `Profile` | Profile | Example value |
| `URL` | URL | Example value |
| `IconType` | Icon Type | 123 |
| `Path` | Path | Example value |
## Collection Method
This collector queries the browser's Favicons database to extract cached website icons and associated URLs.
## Forensic Value
Favicon analysis can recover evidence of deleted browsing history, identify visited sites through icon fingerprinting, and correlate with other browser artifacts to establish comprehensive activity timelines.
---
# Chrome Form History
> Source: https://kb.binalyze.ai/air/features/acquisition/supported-evidence/linux-collections-detail/chrome-form-history.html
## Overview
**Evidence:** Chrome Form History
**Description:** Collect Chrome Form History
**Category:** Applications
**Platform:** linux
**Short Name:** cfh
**Is Parsed:** Yes
**Sent to Investigation Hub:** Yes
**Collect File(s):** No
## Background
Browser form history stores previously entered form data including search queries, usernames, and other input fields. This data reveals user search patterns, account information, and potential data leakage through autofill.
## Data Collected
This collector gathers structured data about chrome form history.
### Chrome Form History Data
| Field | Description | Example |
|-------|-------------|---------|
| `UserName` | User Name | Example value |
| `BrowserName` | Browser Name | Example value |
| `Name` | Name | Example value |
| `Value` | Value | Example value |
| `ValueLower` | Value Lower | Example value |
| `Count` | Count | 123 |
| `Profile` | Profile | Example value |
| `Path` | Path | Example value |
| `DateCreated` | Date Created | 2023-10-15 14:30:25+03:00 |
| `DateLastUsed` | Date Last Used | 2023-10-15 14:30:25+03:00 |
## Collection Method
This collector queries the browser's form history database to extract saved form field data, search queries, and associated timestamps.
## Forensic Value
Form history exposes reconnaissance activities, credential enumeration attempts, search queries revealing attacker intent, and potentially sensitive information entered into web forms. Analysts can identify data exfiltration, account compromise indicators, and targeted search patterns.
---
# Chrome Local Storage
> Source: https://kb.binalyze.ai/air/features/acquisition/supported-evidence/linux-collections-detail/chrome-local-storage.html
## Overview
**Evidence:** Chrome Local Storage
**Description:** Collect Chrome Local Storage
**Category:** Applications
**Platform:** linux
**Short Name:** chrls
**Is Parsed:** Yes
**Sent to Investigation Hub:** Yes
**Collect File(s):** No
## Background
Browser local storage contains persistent key-value data stored by websites. This data includes user preferences, session state, cached data, and potentially authentication tokens or sensitive information.
## Data Collected
This collector gathers structured data about chrome local storage.
### Chrome Local Storage Data
| Field | Description | Example |
|-------|-------------|---------|
| `UserName` | User Name | Example value |
| `ProfileName` | Profile Name | Example value |
| `BrowserName` | Browser Name | Example value |
| `Key` | Key | Example value |
| `Value` | Value | Example value |
| `Path` | Path | Example value |
## Collection Method
This collector extracts local storage data from browser storage databases and files.
## Forensic Value
Local storage analysis reveals stored credentials, session tokens, tracking identifiers, and application state that can indicate compromised accounts, persistent tracking, or malicious website activity. Analysts can identify credential theft, session hijacking, and data exfiltration attempts.
---
# Chrome Login Data
> Source: https://kb.binalyze.ai/air/features/acquisition/supported-evidence/linux-collections-detail/chrome-login-data.html
## Overview
**Evidence:** Chrome Login Data
**Description:** Collect Chrome Login Data
**Category:** Applications
**Platform:** linux
**Short Name:** chrlgd
**Is Parsed:** Yes
**Sent to Investigation Hub:** Yes
**Collect File(s):** No
## Background
Browser login data stores saved passwords and credential information. This data is critical for identifying stored credentials, password reuse patterns, and potential credential theft targets.
## Data Collected
This collector gathers structured data about chrome login data.
### Chrome Login Data Data
| Field | Description | Example |
|-------|-------------|---------|
| `ID` | ID | 123 |
| `UserName` | User Name | Example value |
| `BrowserName` | Browser Name | Example value |
| `OriginURL` | Origin URL | Example value |
| `SignonRealm` | Signon Realm | Example value |
| `BlacklistedByUser` | Blacklisted By User | 123 |
| `Scheme` | Scheme | Example value |
| `PasswordType` | Password Type | Example value |
| `TimesUsed` | Times Used | 123 |
| `Profile` | Profile | Example value |
| `Path` | Path | Example value |
| `DateCreated` | Date Created | 2023-10-15 14:30:25+03:00 |
| `DateLastUsed` | Date Last Used | 2023-10-15 14:30:25+03:00 |
## Collection Method
This collector extracts saved credentials from the browser's Login Data database, including URLs, usernames, and encrypted passwords.
## Forensic Value
Login data analysis reveals stored credentials, password reuse across services, targeted accounts, and potential credential harvesting. Investigators can identify compromised accounts, credential theft attempts, and unauthorized access to saved credentials by malware or attackers.
---
# Chrome Sessions
> Source: https://kb.binalyze.ai/air/features/acquisition/supported-evidence/linux-collections-detail/chrome-sessions.html
## Overview
**Evidence:** Chrome Sessions
**Description:** Collect Chrome Sessions
**Category:** Applications
**Platform:** linux
**Short Name:** chrss
**Is Parsed:** Yes
**Sent to Investigation Hub:** Yes
**Collect File(s):** No
## Background
Browser sessions maintain active tab state, cookies, and authentication context. This data reveals currently active user sessions, open websites, and authenticated connections at the time of collection.
## Data Collected
This collector gathers structured data about chrome sessions.
### Chrome Sessions Data
| Field | Description | Example |
|-------|-------------|---------|
| `ID` | ID | 123 |
| `WindowID` | Window ID | 123 |
| `Active` | Active | true |
| `Url` | Url | Example value |
| `Title` | Title | Example value |
| `Deleted` | Deleted | true |
| `Group` | Group | Example value |
| `History` | History | [] |
| `BrowserName` | Browser Name | Example value |
## Collection Method
This collector captures browser session data including active tabs, session cookies, and authentication state.
## Forensic Value
Session analysis identifies active compromises, authenticated sessions to malicious sites, concurrent suspicious activities, and real-time indicators of ongoing attacks. Analysts can detect active C2 connections, authenticated malware communications, and live attacker sessions.
---
# Chrome Thumbnails
> Source: https://kb.binalyze.ai/air/features/acquisition/supported-evidence/linux-collections-detail/chrome-thumbnails.html
## Overview
**Evidence:** Chrome Thumbnails
**Description:** Collect Chrome Thumbnails
**Category:** Applications
**Platform:** linux
**Short Name:** cthmb
**Is Parsed:** Yes
**Sent to Investigation Hub:** Yes
**Collect File(s):** No
## Background
Browser thumbnails are cached preview images of visited websites. This visual data supplements browsing history by providing screenshots of accessed pages, useful for recovering deleted history and identifying visited content.
## Data Collected
This collector gathers structured data about chrome thumbnails.
### Chrome Thumbnails Data
| Field | Description | Example |
|-------|-------------|---------|
| `UserName` | User Name | Example value |
| `Browser` | Browser | Example value |
| `URL` | URL | Example value |
| `URLRank` | URL Rank | 123 |
| `Title` | Title | Example value |
| `Profile` | Profile | Example value |
| `Path` | Path | Example value |
## Collection Method
This collector extracts cached thumbnail images from browser storage.
## Forensic Value
Thumbnail analysis provides visual evidence of visited websites, can recover evidence after history deletion, and helps identify phishing pages, malicious sites, or sensitive internal resources accessed by users through visual inspection.
---
# Chrome User Profiles
> Source: https://kb.binalyze.ai/air/features/acquisition/supported-evidence/linux-collections-detail/chrome-user-profiles.html
## Overview
**Evidence:** Chrome User Profiles
**Description:** Collect Chrome User Profiles
**Category:** Applications
**Platform:** linux
**Short Name:** cprfls
**Is Parsed:** Yes
**Sent to Investigation Hub:** Yes
**Collect File(s):** No
## Background
Browser user profiles store per-user browser configurations, extensions, settings, and data segregation. This data reveals multiple user accounts, profile switching patterns, and user-specific browsing behavior.
## Data Collected
This collector gathers structured data about chrome user profiles.
### Chrome User Profiles Data
| Field | Description | Example |
|-------|-------------|---------|
| `EndpointUserName` | Endpoint User Name | Example value |
| `Profile` | Profile | Example value |
| `ProfileUserName` | Profile User Name | Example value |
| `BrowserName` | Browser Name | Example value |
| `BackgroundApps` | Background Apps | true |
| `GoogleAccountGivenName` | Google Account Given Name | Example value |
| `GoogleAccountID` | Google Account ID | Example value |
| `GoogleAccountName` | Google Account Name | Example value |
| `PictureFileName` | Picture File Name | Example value |
| `LastDownloadedPictureURL` | Last Downloaded Picture URL | Example value |
| `HostedDomain` | Hosted Domain | Example value |
| `IsConsentedPrimaryAccount` | Is Consented Primary Account | true |
| `IsEphemeral` | Is Ephemeral | true |
## Collection Method
This collector enumerates browser user profiles and extracts profile metadata, configurations, and associated data paths.
## Forensic Value
Profile analysis identifies multiple user accounts, profile-specific extensions and configurations, shared device usage patterns, and potential privilege escalation or lateral movement using different browser profiles. Investigators can correlate activity across profiles and identify unauthorized profile creation.
---
# Chrome Web Storage
> Source: https://kb.binalyze.ai/air/features/acquisition/supported-evidence/linux-collections-detail/chrome-web-storage.html
## Overview
**Evidence:** Chrome Web Storage
**Description:** Collect Chrome Web Storage
**Category:** Applications
**Platform:** linux
**Short Name:** cws
**Is Parsed:** Yes
**Sent to Investigation Hub:** Yes
**Collect File(s):** No
## Background
Browser web storage includes both local and session storage used by websites to store client-side data. This data can contain application state, user preferences, cached content, and potentially sensitive information.
## Data Collected
This collector gathers structured data about chrome web storage.
### Chrome Web Storage Data
| Field | Description | Example |
|-------|-------------|---------|
| `UserName` | User Name | Example value |
| `ProfileName` | Profile Name | Example value |
| `BrowserName` | Browser Name | Example value |
| `Key` | Key | Example value |
| `Value` | Value | Example value |
| `Path` | Path | Example value |
## Collection Method
This collector extracts web storage data from browser storage locations including local storage and session storage.
## Forensic Value
Web storage analysis reveals cached application data, stored credentials, session information, and potential data exfiltration staging. Analysts can identify malicious website activity, stored authentication tokens, tracking identifiers, and sensitive data cached by compromised web applications.
---
# Chromium Bookmarks
> Source: https://kb.binalyze.ai/air/features/acquisition/supported-evidence/linux-collections-detail/chromium-bookmarks.html
## Overview
**Evidence:** Chromium Bookmarks
**Description:** Collect Chromium Bookmarks
**Category:** Applications
**Platform:** linux
**Short Name:** chbkmrks
**Is Parsed:** Yes
**Sent to Investigation Hub:** Yes
**Collect File(s):** No
## Background
Browser bookmarks represent user-saved favorite websites and organizational folders. This data reveals frequently accessed sites, user interests, and potential indicators of reconnaissance, phishing targets, or suspicious infrastructure.
## Data Collected
This collector gathers structured data about chromium bookmarks.
## Collection Method
This collector parses the browser's Bookmarks file to extract saved URLs, folder structures, timestamps, and metadata.
## Forensic Value
Bookmark analysis identifies targeted websites, phishing pages, command-and-control servers, internal resources, and organizational reconnaissance patterns. Investigators can detect social engineering campaigns, credential harvesting attempts, and lateral movement preparation.
---
# Chromium Browsing History
> Source: https://kb.binalyze.ai/air/features/acquisition/supported-evidence/linux-collections-detail/chromium-browsing-history.html
## Overview
**Evidence:** Chromium Browsing History
**Description:** Collect visited URLs from Chromium
**Category:** Applications
**Platform:** linux
**Short Name:** cmhst
**Is Parsed:** Yes
**Sent to Investigation Hub:** Yes
**Collect File(s):** No
## Background
Browser history records all websites visited by users, including URLs, page titles, visit timestamps, visit counts, and transition types. This data is essential for reconstructing user activity, identifying malicious websites, and tracking lateral movement or reconnaissance activities.
## Data Collected
This collector gathers structured data about chromium browsing history.
## Collection Method
This collector queries the browser's History database to extract visited URLs, timestamps, referrer information, and user interaction patterns.
## Forensic Value
Browsing history reveals phishing sites, malicious domains, command-and-control servers, data exfiltration targets, and reconnaissance activities. Analysts can identify compromised credentials, track attacker infrastructure, and correlate web activity with other security events to establish attack timelines.
---
# Chromium Cookies
> Source: https://kb.binalyze.ai/air/features/acquisition/supported-evidence/linux-collections-detail/chromium-cookies.html
## Overview
**Evidence:** Chromium Cookies
**Description:** Collect Chromium Cookies
**Category:** Applications
**Platform:** linux
**Short Name:** chcookies
**Is Parsed:** Yes
**Sent to Investigation Hub:** Yes
**Collect File(s):** No
## Background
Browser cookies store session tokens, authentication credentials, user preferences, and tracking data. This data is essential for understanding authenticated sessions, tracking user activity across websites, and identifying session hijacking or credential theft.
## Data Collected
This collector gathers structured data about chromium cookies.
## Collection Method
This collector extracts cookies from the browser's Cookies database, including domain, name, value, path, expiration, and security flags.
## Forensic Value
Cookie analysis reveals active sessions, authentication tokens, persistent tracking identifiers, and potential session hijacking. Investigators can identify stolen credentials, unauthorized access, and cross-site tracking used for reconnaissance or targeting.
---
# Chromium Downloads
> Source: https://kb.binalyze.ai/air/features/acquisition/supported-evidence/linux-collections-detail/chromium-downloads.html
## Overview
**Evidence:** Chromium Downloads
**Description:** Collect Chromium Downloads
**Category:** Applications
**Platform:** linux
**Short Name:** cmdwnlds
**Is Parsed:** Yes
**Sent to Investigation Hub:** Yes
**Collect File(s):** No
## Background
Browser download history records files downloaded by users, including file paths, timestamps, URLs, referrer information, and download status. This data is essential for tracking file acquisition, identifying potentially malicious downloads, and reconstructing user activity timelines.
## Data Collected
This collector gathers structured data about chromium downloads.
## Collection Method
This collector queries the browser's History database to extract download records, including file paths, download times, source URLs, and security flags.
## Forensic Value
Download history reveals malware delivery vectors, data exfiltration attempts, unauthorized software installation, and user interaction with suspicious websites. Analysts can identify downloaded malicious files, track attack chains, and correlate downloads with other security events.
---
# Chromium Favicons
> Source: https://kb.binalyze.ai/air/features/acquisition/supported-evidence/linux-collections-detail/chromium-favicons.html
## Overview
**Evidence:** Chromium Favicons
**Description:** Collect Chromium Favicons
**Category:** Applications
**Platform:** linux
**Short Name:** chfico
**Is Parsed:** Yes
**Sent to Investigation Hub:** Yes
**Collect File(s):** No
## Background
Browser favicons are cached website icons that provide visual history of visited sites. This data supplements browsing history by revealing sites accessed even if history was deleted.
## Data Collected
This collector gathers structured data about chromium favicons.
## Collection Method
This collector queries the browser's Favicons database to extract cached website icons and associated URLs.
## Forensic Value
Favicon analysis can recover evidence of deleted browsing history, identify visited sites through icon fingerprinting, and correlate with other browser artifacts to establish comprehensive activity timelines.
---
# Chromium Form History
> Source: https://kb.binalyze.ai/air/features/acquisition/supported-evidence/linux-collections-detail/chromium-form-history.html
## Overview
**Evidence:** Chromium Form History
**Description:** Collect Chromium Form History
**Category:** Applications
**Platform:** linux
**Short Name:** chfh
**Is Parsed:** Yes
**Sent to Investigation Hub:** Yes
**Collect File(s):** No
## Background
Browser form history stores previously entered form data including search queries, usernames, and other input fields. This data reveals user search patterns, account information, and potential data leakage through autofill.
## Data Collected
This collector gathers structured data about chromium form history.
## Collection Method
This collector queries the browser's form history database to extract saved form field data, search queries, and associated timestamps.
## Forensic Value
Form history exposes reconnaissance activities, credential enumeration attempts, search queries revealing attacker intent, and potentially sensitive information entered into web forms. Analysts can identify data exfiltration, account compromise indicators, and targeted search patterns.
---
# Chromium Local Storage
> Source: https://kb.binalyze.ai/air/features/acquisition/supported-evidence/linux-collections-detail/chromium-local-storage.html
## Overview
**Evidence:** Chromium Local Storage
**Description:** Collect Chromium Local Storage
**Category:** Applications
**Platform:** linux
**Short Name:** chmls
**Is Parsed:** Yes
**Sent to Investigation Hub:** Yes
**Collect File(s):** No
## Background
Browser local storage contains persistent key-value data stored by websites. This data includes user preferences, session state, cached data, and potentially authentication tokens or sensitive information.
## Data Collected
This collector gathers structured data about chromium local storage.
## Collection Method
This collector extracts local storage data from browser storage databases and files.
## Forensic Value
Local storage analysis reveals stored credentials, session tokens, tracking identifiers, and application state that can indicate compromised accounts, persistent tracking, or malicious website activity. Analysts can identify credential theft, session hijacking, and data exfiltration attempts.
---
# Chromium Login Data
> Source: https://kb.binalyze.ai/air/features/acquisition/supported-evidence/linux-collections-detail/chromium-login-data.html
## Overview
**Evidence:** Chromium Login Data
**Description:** Collect Chromium Login Data
**Category:** Applications
**Platform:** linux
**Short Name:** chmlgd
**Is Parsed:** Yes
**Sent to Investigation Hub:** Yes
**Collect File(s):** No
## Background
Browser login data stores saved passwords and credential information. This data is critical for identifying stored credentials, password reuse patterns, and potential credential theft targets.
## Data Collected
This collector gathers structured data about chromium login data.
## Collection Method
This collector extracts saved credentials from the browser's Login Data database, including URLs, usernames, and encrypted passwords.
## Forensic Value
Login data analysis reveals stored credentials, password reuse across services, targeted accounts, and potential credential harvesting. Investigators can identify compromised accounts, credential theft attempts, and unauthorized access to saved credentials by malware or attackers.
---
# Chromium Sessions
> Source: https://kb.binalyze.ai/air/features/acquisition/supported-evidence/linux-collections-detail/chromium-sessions.html
## Overview
**Evidence:** Chromium Sessions
**Description:** Collect Chromium Sessions
**Category:** Applications
**Platform:** linux
**Short Name:** chmss
**Is Parsed:** Yes
**Sent to Investigation Hub:** Yes
**Collect File(s):** No
## Background
Browser sessions maintain active tab state, cookies, and authentication context. This data reveals currently active user sessions, open websites, and authenticated connections at the time of collection.
## Data Collected
This collector gathers structured data about chromium sessions.
## Collection Method
This collector captures browser session data including active tabs, session cookies, and authentication state.
## Forensic Value
Session analysis identifies active compromises, authenticated sessions to malicious sites, concurrent suspicious activities, and real-time indicators of ongoing attacks. Analysts can detect active C2 connections, authenticated malware communications, and live attacker sessions.
---
# Chromium Thumbnails
> Source: https://kb.binalyze.ai/air/features/acquisition/supported-evidence/linux-collections-detail/chromium-thumbnails.html
## Overview
**Evidence:** Chromium Thumbnails
**Description:** Collect Chromium Thumbnails
**Category:** Applications
**Platform:** linux
**Short Name:** chthmb
**Is Parsed:** Yes
**Sent to Investigation Hub:** Yes
**Collect File(s):** No
## Background
Browser thumbnails are cached preview images of visited websites. This visual data supplements browsing history by providing screenshots of accessed pages, useful for recovering deleted history and identifying visited content.
## Data Collected
This collector gathers structured data about chromium thumbnails.
## Collection Method
This collector extracts cached thumbnail images from browser storage.
## Forensic Value
Thumbnail analysis provides visual evidence of visited websites, can recover evidence after history deletion, and helps identify phishing pages, malicious sites, or sensitive internal resources accessed by users through visual inspection.
---
# Chromium User Profiles
> Source: https://kb.binalyze.ai/air/features/acquisition/supported-evidence/linux-collections-detail/chromium-user-profiles.html
## Overview
**Evidence:** Chromium User Profiles
**Description:** Collect Chromium User Profiles
**Category:** Applications
**Platform:** linux
**Short Name:** chprfls
**Is Parsed:** Yes
**Sent to Investigation Hub:** Yes
**Collect File(s):** No
## Background
Browser user profiles store per-user browser configurations, extensions, settings, and data segregation. This data reveals multiple user accounts, profile switching patterns, and user-specific browsing behavior.
## Data Collected
This collector gathers structured data about chromium user profiles.
## Collection Method
This collector enumerates browser user profiles and extracts profile metadata, configurations, and associated data paths.
## Forensic Value
Profile analysis identifies multiple user accounts, profile-specific extensions and configurations, shared device usage patterns, and potential privilege escalation or lateral movement using different browser profiles. Investigators can correlate activity across profiles and identify unauthorized profile creation.
---
# Chromium Web Storage
> Source: https://kb.binalyze.ai/air/features/acquisition/supported-evidence/linux-collections-detail/chromium-web-storage.html
## Overview
**Evidence:** Chromium Web Storage
**Description:** Collect Chromium Web Storage
**Category:** Applications
**Platform:** linux
**Short Name:** chws
**Is Parsed:** Yes
**Sent to Investigation Hub:** Yes
**Collect File(s):** No
## Background
Browser web storage includes both local and session storage used by websites to store client-side data. This data can contain application state, user preferences, cached content, and potentially sensitive information.
## Data Collected
This collector gathers structured data about chromium web storage.
## Collection Method
This collector extracts web storage data from browser storage locations including local storage and session storage.
## Forensic Value
Web storage analysis reveals cached application data, stored credentials, session information, and potential data exfiltration staging. Analysts can identify malicious website activity, stored authentication tokens, tracking identifiers, and sensitive data cached by compromised web applications.
---
# Cron Jobs
> Source: https://kb.binalyze.ai/air/features/acquisition/supported-evidence/linux-collections-detail/cron-jobs.html
## Overview
**Evidence:** Cron Jobs
**Description:** Collect cron jobs
**Category:** System
**Platform:** linux
**Short Name:** cronj
**Is Parsed:** Yes
**Sent to Investigation Hub:** Yes
**Collect File(s):** No
## Background
Cron jobs on AIX systems are scheduled tasks that run automatically at specified times or intervals. This data is essential for understanding system automation, detecting unauthorized scheduled tasks, and investigating time-based security incidents. Cron jobs provide evidence of automated processes, maintenance tasks, and potential persistence mechanisms used by attackers.
## Data Collected
This collector gathers structured data about cron jobs.
### Cron Jobs Data
| Field | Description | Example |
|-------|-------------|---------|
| `Minute` | Minute | Example value |
| `Hour` | Hour | Example value |
| `DayOfMonth` | Day Of Month | Example value |
| `Month` | Month | Example value |
| `DayOfWeek` | Day Of Week | Example value |
| `Command` | Command | Example value |
| `Path` | Path | Example value |
| `Event` | Event | Example value |
## Collection Method
This collector parses the necessary data from cron configuration files.
## Forensic Value
This evidence is crucial for forensic investigations as it provides information about scheduled tasks and automated processes on AIX systems. It helps investigators understand system automation, detect unauthorized scheduled tasks, and investigate time-based attacks. The data can reveal maintenance schedules, automated processes, and potential persistence mechanisms. Analysts can use this information to identify suspicious scheduled tasks, trace automated activities, and assess AIX system security posture.
---
# DEB Packages
> Source: https://kb.binalyze.ai/air/features/acquisition/supported-evidence/linux-collections-detail/deb-packages.html
## Overview
**Evidence:** DEB Packages
**Description:** Collect Debian packages
**Category:** System
**Platform:** linux
**Short Name:** debp
**Is Parsed:** Yes
**Sent to Investigation Hub:** Yes
**Collect File(s):** No
## Background
This collector gathers deb packages information from the Linux system. This data is essential for understanding system activity, detecting security incidents, and investigating system-related events.
## Data Collected
This collector gathers structured data about deb packages.
## Collection Method
This collector parses the necessary data from the `deb_packages` table.
## Forensic Value
This evidence is crucial for forensic investigations as it provides deb packages information. It helps investigators understand system activity, detect security incidents, and investigate system-related events. The data can reveal system changes, unauthorized activities, and potential security vulnerabilities. Analysts can use this information to identify system compromises, trace malicious activities, and assess Linux security posture.
---
# Default Browser
> Source: https://kb.binalyze.ai/air/features/acquisition/supported-evidence/linux-collections-detail/default-browser.html
## Overview
**Evidence:** Default Browser
**Description:** Collect Default Browser
**Category:** Applications
**Platform:** linux
**Short Name:** dbrws
**Is Parsed:** Yes
**Sent to Investigation Hub:** Yes
**Collect File(s):** No
## Background
The default browser setting reveals user preferences and potential attack surfaces. Malware and persistence mechanisms may change the default browser to hijack web traffic, inject malicious extensions, or redirect users to phishing sites. Tracking changes to this setting helps detect browser hijacking and unauthorized modifications.
## Data Collected
This collector gathers structured data about default browser.
### Default Browser Data
| Field | Description | Example |
|-------|-------------|---------|
| `DefaultBrowser` | Default Browser | Example value |
## Collection Method
This collector queries the operating system's default application registry to identify which browser is configured as the default handler for HTTP/HTTPS protocols.
## Forensic Value
Default browser configuration is crucial for understanding user behavior patterns and detecting browser-based attacks. Unexpected changes may indicate malware activity, persistence mechanisms, or social engineering attacks. This evidence helps establish timelines for browser-related compromise and identify attack vectors.
---
# Dependency Manifests
> Source: https://kb.binalyze.ai/air/features/acquisition/supported-evidence/linux-collections-detail/dependency-manifests.html
## Overview
**Evidence:** Dependency Manifests
**Description:** Collect developer dependency manifests
**Category:** Applications
**Platform:** linux
**Short Name:** depman
**Is Parsed:** Yes
**Sent to Investigation Hub:** Yes
**Collect File(s):** No
## Background
Developer dependency manifests and lockfiles define declared and resolved third-party packages used by software projects. Covered formats include package.json, package-lock.json, yarn.lock, pnpm-lock.yaml, bun.lock, go.mod, requirements.txt, Pipfile.lock, pyproject.toml, poetry.lock, Cargo.toml, pom.xml, composer.json, Gemfile, Gemfile.lock, Gradle files, and NuGet project files. These files are primary targets for supply chain attacks including dependency confusion, typosquatting, and known-malicious package injection.
## Data Collected
This collector gathers structured data about declared and resolved dependencies, including package names, version constraints, resolved versions, source registries, integrity hashes, direct or transitive status, and whether a lock file is present. Results are recorded in `dependency_manifests`.
## Collection Method
This collector scans user home directories and common development paths for dependency manifest and lock files. Each file is parsed to extract package metadata. Directories such as node_modules, vendor, and .git are skipped for performance.
## Forensic Value
Dependency manifest data is critical for detecting supply chain compromises. Investigators can identify known-malicious packages, typosquatted dependencies, dependency confusion attacks, and missing lock files that indicate insecure dependency resolution.
---
# DHCP Server Logs
> Source: https://kb.binalyze.ai/air/features/acquisition/supported-evidence/linux-collections-detail/dhcp-server-logs.html
## Overview
**Evidence:** DHCP Server Logs
**Description:** Collect DHCP Server Logs
**Category:** Applications
**Platform:** linux
**Short Name:** dhcpl
**Is Parsed:** No
**Sent to Investigation Hub:** No
**Collect File(s):** Yes
## Background
DHCP server logs on Linux record IP address assignments, lease information, client MAC addresses, and DHCP transactions. These logs help track which devices connected to the network and when.
## Data Collected
This collector gathers structured data about dhcp server logs.
## Collection Method
This collector gathers DHCP server logs from /var/log/dhcpd.log, which contains DHCP daemon operational logs including IP assignments and lease management.
## Forensic Value
DHCP logs are valuable for network forensics, identifying unauthorized devices, tracking IP address assignments to MAC addresses, establishing device presence timelines, and investigating network-based attacks.
---
# DNF History
> Source: https://kb.binalyze.ai/air/features/acquisition/supported-evidence/linux-collections-detail/dnf-history.html
## Overview
**Evidence:** DNF History
**Description:** Collect DNF History.
**Category:** System
**Platform:** linux
**Short Name:** dnfhist
**Is Parsed:** Yes
**Sent to Investigation Hub:** Yes
**Collect File(s):** No
## Background
This collector gathers dnf history information from the Linux system. This data is essential for understanding system activity, detecting security incidents, and investigating system-related events.
## Data Collected
This collector gathers structured data about dnf history.
## Collection Method
This collector parses the necessary data from the `dnf_history` table.
## Forensic Value
This evidence is crucial for forensic investigations as it provides dnf history information. It helps investigators understand system activity, detect security incidents, and investigate system-related events. The data can reveal system changes, unauthorized activities, and potential security vulnerabilities. Analysts can use this information to identify system compromises, trace malicious activities, and assess Linux security posture.
---
# DNS Resolvers
> Source: https://kb.binalyze.ai/air/features/acquisition/supported-evidence/linux-collections-detail/dns-resolvers.html
## Overview
**Evidence:** DNS Resolvers
**Description:** Collect DNS resolvers
**Category:** Network
**Platform:** linux
**Short Name:** dnsr
**Is Parsed:** Yes
**Sent to Investigation Hub:** Yes
**Collect File(s):** No
## Background
DNS resolvers on AIX (Advanced Interactive eXecutive) systems provide configuration information about how the system resolves domain names to IP addresses. This data is essential for understanding network configuration, detecting DNS-related security incidents, and investigating network connectivity issues. DNS resolver configuration affects how applications and services resolve hostnames on AIX systems.
## Data Collected
This collector gathers structured data about dns resolvers.
### DNS Resolvers Data
| Field | Description | Example |
|-------|-------------|---------|
| `Type` | Type | Example value |
| `Address` | Address | Example value |
| `Netmask` | Netmask | Example value |
| `OptionsStr` | Options Str | Example value |
## Collection Method
This collector parses the necessary data from DNS configuration files.
## Forensic Value
This evidence is crucial for forensic investigations as it provides information about DNS configuration and network resolution settings on AIX systems. It helps investigators understand network configuration, detect DNS-related attacks, and investigate network connectivity issues. The data can reveal DNS server configurations, search domains, and resolution options. Analysts can use this information to identify DNS misconfigurations, trace network resolution patterns, and assess AIX system network security posture.
---
# Docker Changes
> Source: https://kb.binalyze.ai/air/features/acquisition/supported-evidence/linux-collections-detail/docker-changes.html
## Overview
**Evidence:** Docker Changes
**Description:** Collect Docker Changes.
**Category:** Applications
**Platform:** linux
**Short Name:** dockchanges
**Is Parsed:** Yes
**Sent to Investigation Hub:** Yes
**Collect File(s):** No
## Background
Docker filesystem changes track modifications made to container filesystems since container creation. These changes reveal files added, modified, or deleted, essential for detecting malware installation, data tampering, or unauthorized access.
## Data Collected
This collector gathers structured data about docker changes.
## Collection Method
This collector queries the Docker daemon via Docker Engine API to retrieve filesystem changes for each container. It lists file paths and change types (added, modified, deleted) since the container was created from its base image.
## Forensic Value
Filesystem changes expose malware droppers, backdoor installations, log tampering, credential theft, or data exfiltration staging. Investigators can identify suspicious file modifications, detect persistence mechanisms, and trace attacker activities within compromised containers.
---
# Docker Container Logs
> Source: https://kb.binalyze.ai/air/features/acquisition/supported-evidence/linux-collections-detail/docker-container-logs.html
## Overview
**Evidence:** Docker Container Logs
**Description:** Collect Docker Container Logs
**Category:** Applications
**Platform:** linux
**Short Name:** dcl
**Is Parsed:** Yes
**Sent to Investigation Hub:** Yes
**Collect File(s):** No
## Background
Docker container logs capture stdout/stderr output from containerized applications. Log data provides runtime behavior, error messages, access patterns, and potential indicators of compromise within container workloads.
## Data Collected
This collector gathers structured data about docker container logs.
## Collection Method
This collector queries the Docker daemon via Docker Engine API to retrieve logs from each container. It captures stdout and stderr output with timestamps for forensic analysis of application behavior and security events.
## Forensic Value
Container logs reveal application errors, authentication attempts, command execution, data access patterns, and exploitation attempts. Analyzing logs helps identify suspicious activities, trace attacker actions, detect data exfiltration, and reconstruct incident timelines in containerized environments.
---
# Docker Containers
> Source: https://kb.binalyze.ai/air/features/acquisition/supported-evidence/linux-collections-detail/docker-containers.html
## Overview
**Evidence:** Docker Containers
**Description:** Collect Docker Containers.
**Category:** Applications
**Platform:** linux
**Short Name:** dockcontainers
**Is Parsed:** Yes
**Sent to Investigation Hub:** Yes
**Collect File(s):** No
## Background
Docker containers are isolated runtime environments that package applications and their dependencies. Container metadata reveals running services, exposed ports, mounted volumes, and runtime configurations, essential for identifying malicious containers, unauthorized deployments, and security misconfigurations.
## Data Collected
This collector gathers structured data about docker containers.
## Collection Method
This collector queries the Docker daemon via Docker Engine API to enumerate all containers (running and stopped). It extracts container ID, name, image, state, created time, ports, mounts, network settings, labels, and environment variables for forensic analysis.
## Forensic Value
Container data helps investigators identify suspicious containers, detect cryptominers, backdoors, or data exfiltration tools running in containerized environments. Configuration details reveal privilege escalation, volume mounts to sensitive host paths, and network exposure that may indicate compromise or policy violations.
---
# Docker Image History
> Source: https://kb.binalyze.ai/air/features/acquisition/supported-evidence/linux-collections-detail/docker-image-history.html
## Overview
**Evidence:** Docker Image History
**Description:** Collect Docker Image History.
**Category:** Applications
**Platform:** linux
**Short Name:** dockimagehist
**Is Parsed:** Yes
**Sent to Investigation Hub:** Yes
**Collect File(s):** No
## Background
Docker image history shows the layered build steps and commands used to construct an image. This forensic data reveals how an image was built, what software was installed, files added, and configuration changes made during image creation.
## Data Collected
This collector gathers structured data about docker image history.
## Collection Method
This collector queries the Docker daemon via Docker Engine API to retrieve the build history of each image. It extracts layer ID, created time, created by command, size, and tags for each layer in the image's history.
## Forensic Value
Image history exposes malicious commands embedded in image layers, such as backdoor installations, credential theft scripts, or cryptominer deployments. Investigators can identify suspicious layers, trace image lineage, and detect tampering or supply chain attacks in containerized environments.
---
# Docker Images
> Source: https://kb.binalyze.ai/air/features/acquisition/supported-evidence/linux-collections-detail/docker-images.html
## Overview
**Evidence:** Docker Images
**Description:** Collect Docker Images.
**Category:** Applications
**Platform:** linux
**Short Name:** dockimages
**Is Parsed:** Yes
**Sent to Investigation Hub:** Yes
**Collect File(s):** No
## Background
Docker images are templates used to create containers, consisting of layered filesystems and metadata. Image inventories reveal deployed applications, base operating systems, vulnerabilities, and potentially malicious or unauthorized images in the environment.
## Data Collected
This collector gathers structured data about docker images.
## Collection Method
This collector queries the Docker daemon via Docker Engine API to list all images (tagged and untagged). It extracts image ID, repository tags, size, creation time, and layer information for each image stored locally.
## Forensic Value
Image data helps identify vulnerable base images, unauthorized images pulled from untrusted registries, backdoored images, or bloated images that may hide malicious payloads. Tracking image provenance and tags assists in supply chain security investigations and compliance audits.
---
# Docker Info
> Source: https://kb.binalyze.ai/air/features/acquisition/supported-evidence/linux-collections-detail/docker-info.html
## Overview
**Evidence:** Docker Info
**Description:** Collect Docker Info.
**Category:** Applications
**Platform:** linux
**Short Name:** dockinfo
**Is Parsed:** Yes
**Sent to Investigation Hub:** Yes
**Collect File(s):** No
## Background
Docker system information provides configuration details about the Docker daemon including storage driver, kernel version, operating system, total containers/images, and resource limits. This metadata is crucial for understanding the Docker environment configuration and detecting anomalies.
## Data Collected
This collector gathers structured data about docker info.
## Collection Method
This collector queries the Docker daemon via Docker Engine API to retrieve system-wide information including version, storage driver, logging driver, plugins, security options, and resource constraints.
## Forensic Value
System-level Docker configuration reveals potential security weaknesses such as insecure registries, disabled security features, or resource exhaustion. This data helps investigators understand the Docker deployment model and identify misconfigurations that attackers may exploit.
---
# Docker Logs
> Source: https://kb.binalyze.ai/air/features/acquisition/supported-evidence/linux-collections-detail/docker-logs.html
## Overview
**Evidence:** Docker Logs
**Description:** Collect Docker Logs on Filesystem
**Category:** Applications
**Platform:** linux
**Short Name:** dckl
**Is Parsed:** No
**Sent to Investigation Hub:** No
**Collect File(s):** Yes
## Background
Docker container logs on Linux are stored as JSON files within the Docker data directory. Each container has its own log file containing stdout/stderr output from the containerized application.
## Data Collected
This collector gathers structured data about docker logs.
## Collection Method
This collector gathers Docker container JSON log files from /var/lib/docker/*/*/, which contain container output logs organized by container ID.
## Forensic Value
Docker logs are essential for investigating containerized application activities, malicious container behavior, data exfiltration, command execution, and understanding attack chains in containerized environments.
---
# Docker Networks
> Source: https://kb.binalyze.ai/air/features/acquisition/supported-evidence/linux-collections-detail/docker-networks.html
## Overview
**Evidence:** Docker Networks
**Description:** Collect Docker Networks.
**Category:** Applications
**Platform:** linux
**Short Name:** docknetworks
**Is Parsed:** Yes
**Sent to Investigation Hub:** Yes
**Collect File(s):** No
## Background
Docker networks define how containers communicate with each other and external systems. Network configuration reveals bridge networks, overlay networks, host networking modes, and IP address allocations critical for understanding container connectivity and isolation.
## Data Collected
This collector gathers structured data about docker networks.
## Collection Method
This collector queries the Docker daemon via Docker Engine API to enumerate all Docker networks. It extracts network ID, name, driver type, scope, subnet configuration, gateway, connected containers, and network options.
## Forensic Value
Network data identifies containers exposed to the host network (potential privilege escalation), custom networks used for lateral movement, or misconfigured network isolation. Analyzing network attachments helps map container communication paths and detect unauthorized network access or data exfiltration channels.
---
# Docker Processes
> Source: https://kb.binalyze.ai/air/features/acquisition/supported-evidence/linux-collections-detail/docker-processes.html
## Overview
**Evidence:** Docker Processes
**Description:** Collect Docker Processes.
**Category:** Applications
**Platform:** linux
**Short Name:** docktops
**Is Parsed:** Yes
**Sent to Investigation Hub:** Yes
**Collect File(s):** No
## Background
Docker container processes show which processes are running inside each container. This data reveals the actual workload, potential process injection, privilege escalation, and unauthorized process execution within containerized environments.
## Data Collected
This collector gathers structured data about docker processes.
## Collection Method
This collector queries the Docker daemon via Docker Engine API to execute 'top' command for each container. It lists processes, PIDs, user, CPU usage, memory usage, and command line for processes running in containers.
## Forensic Value
Process data within containers identifies cryptominers, reverse shells, suspicious child processes, or privilege escalation attempts. Comparing running processes against expected workload helps detect compromised containers, malware, or unauthorized access to containerized applications.
---
# Docker Volumes
> Source: https://kb.binalyze.ai/air/features/acquisition/supported-evidence/linux-collections-detail/docker-volumes.html
## Overview
**Evidence:** Docker Volumes
**Description:** Collect Docker Volumes.
**Category:** Applications
**Platform:** linux
**Short Name:** dockvolumes
**Is Parsed:** Yes
**Sent to Investigation Hub:** Yes
**Collect File(s):** No
## Background
Docker volumes provide persistent storage for containers, allowing data to persist beyond container lifecycle. Volume metadata reveals mount paths, drivers, and which containers have access to shared data, critical for data exfiltration and persistence investigations.
## Data Collected
This collector gathers structured data about docker volumes.
## Collection Method
This collector queries the Docker daemon via Docker Engine API to list all volumes. It extracts volume name, driver, mount point, labels, and scope information for each volume in the system.
## Forensic Value
Volume data exposes sensitive data storage locations, shared volumes between containers (lateral movement risk), and host path mounts that may grant container access to sensitive host files. Investigators can identify data staging locations, credential stores, or malicious persistence mechanisms using volumes.
---
# Dump Brave Indexed DB
> Source: https://kb.binalyze.ai/air/features/acquisition/supported-evidence/linux-collections-detail/dump-brave-indexed-db.html
## Overview
**Evidence:** Dump Brave Indexed DB
**Description:** Dump Brave Indexed DB
**Category:** Applications
**Platform:** linux
**Short Name:** bidxdb
**Is Parsed:** Yes
**Sent to Investigation Hub:** Yes
**Collect File(s):** No
## Background
Browser IndexedDB is a client-side database used by web applications to store structured data. This data can contain application state, cached content, user data, and potentially sensitive information stored by web applications.
## Data Collected
This collector gathers structured data about dump brave indexed db.
## Collection Method
This collector extracts IndexedDB databases and records from browser storage locations.
## Forensic Value
IndexedDB analysis reveals web application data, cached credentials, offline application state, and potential data exfiltration staging areas. Investigators can identify malicious web application activity, stored authentication tokens, and sensitive data cached by compromised websites.
---
# Dump Chrome Indexed DB
> Source: https://kb.binalyze.ai/air/features/acquisition/supported-evidence/linux-collections-detail/dump-chrome-indexed-db.html
## Overview
**Evidence:** Dump Chrome Indexed DB
**Description:** Dump Chrome Indexed DB
**Category:** Applications
**Platform:** linux
**Short Name:** cidxdb
**Is Parsed:** Yes
**Sent to Investigation Hub:** Yes
**Collect File(s):** No
## Background
Browser IndexedDB is a client-side database used by web applications to store structured data. This data can contain application state, cached content, user data, and potentially sensitive information stored by web applications.
## Data Collected
This collector gathers structured data about dump chrome indexed db.
## Collection Method
This collector extracts IndexedDB databases and records from browser storage locations.
## Forensic Value
IndexedDB analysis reveals web application data, cached credentials, offline application state, and potential data exfiltration staging areas. Investigators can identify malicious web application activity, stored authentication tokens, and sensitive data cached by compromised websites.
---
# Dump Chromium Indexed DB
> Source: https://kb.binalyze.ai/air/features/acquisition/supported-evidence/linux-collections-detail/dump-chromium-indexed-db.html
## Overview
**Evidence:** Dump Chromium Indexed DB
**Description:** Dump Chromium Indexed DB
**Category:** Applications
**Platform:** linux
**Short Name:** chidxdb
**Is Parsed:** Yes
**Sent to Investigation Hub:** Yes
**Collect File(s):** No
## Background
Browser IndexedDB is a client-side database used by web applications to store structured data. This data can contain application state, cached content, user data, and potentially sensitive information stored by web applications.
## Data Collected
This collector gathers structured data about dump chromium indexed db.
## Collection Method
This collector extracts IndexedDB databases and records from browser storage locations.
## Forensic Value
IndexedDB analysis reveals web application data, cached credentials, offline application state, and potential data exfiltration staging areas. Investigators can identify malicious web application activity, stored authentication tokens, and sensitive data cached by compromised websites.
---
# Dump Edge Indexed DB
> Source: https://kb.binalyze.ai/air/features/acquisition/supported-evidence/linux-collections-detail/dump-edge-indexed-db.html
## Overview
**Evidence:** Dump Edge Indexed DB
**Description:** Dump Edge Indexed DB
**Category:** Applications
**Platform:** linux
**Short Name:** eidxdb
**Is Parsed:** Yes
**Sent to Investigation Hub:** Yes
**Collect File(s):** No
## Background
Browser IndexedDB is a client-side database used by web applications to store structured data. This data can contain application state, cached content, user data, and potentially sensitive information stored by web applications.
## Data Collected
This collector gathers structured data about dump edge indexed db.
## Collection Method
This collector extracts IndexedDB databases and records from browser storage locations.
## Forensic Value
IndexedDB analysis reveals web application data, cached credentials, offline application state, and potential data exfiltration staging areas. Investigators can identify malicious web application activity, stored authentication tokens, and sensitive data cached by compromised websites.
---
# Dump Opera Indexed DB
> Source: https://kb.binalyze.ai/air/features/acquisition/supported-evidence/linux-collections-detail/dump-opera-indexed-db.html
## Overview
**Evidence:** Dump Opera Indexed DB
**Description:** Dump Opera Indexed DB
**Category:** Applications
**Platform:** linux
**Short Name:** oidxdb
**Is Parsed:** Yes
**Sent to Investigation Hub:** Yes
**Collect File(s):** No
## Background
Browser IndexedDB is a client-side database used by web applications to store structured data. This data can contain application state, cached content, user data, and potentially sensitive information stored by web applications.
## Data Collected
This collector gathers structured data about dump opera indexed db.
## Collection Method
This collector extracts IndexedDB databases and records from browser storage locations.
## Forensic Value
IndexedDB analysis reveals web application data, cached credentials, offline application state, and potential data exfiltration staging areas. Investigators can identify malicious web application activity, stored authentication tokens, and sensitive data cached by compromised websites.
---
# Dump Vivaldi Indexed DB
> Source: https://kb.binalyze.ai/air/features/acquisition/supported-evidence/linux-collections-detail/dump-vivaldi-indexed-db.html
## Overview
**Evidence:** Dump Vivaldi Indexed DB
**Description:** Dump Vivaldi Indexed DB
**Category:** Applications
**Platform:** linux
**Short Name:** vidxdb
**Is Parsed:** Yes
**Sent to Investigation Hub:** Yes
**Collect File(s):** No
## Background
Browser IndexedDB is a client-side database used by web applications to store structured data. This data can contain application state, cached content, user data, and potentially sensitive information stored by web applications.
## Data Collected
This collector gathers structured data about dump vivaldi indexed db.
## Collection Method
This collector extracts IndexedDB databases and records from browser storage locations.
## Forensic Value
IndexedDB analysis reveals web application data, cached credentials, offline application state, and potential data exfiltration staging areas. Investigators can identify malicious web application activity, stored authentication tokens, and sensitive data cached by compromised websites.
---
# Edge Bookmarks
> Source: https://kb.binalyze.ai/air/features/acquisition/supported-evidence/linux-collections-detail/edge-bookmarks.html
## Overview
**Evidence:** Edge Bookmarks
**Description:** Collect Edge Bookmarks
**Category:** Applications
**Platform:** linux
**Short Name:** ebkmrks
**Is Parsed:** Yes
**Sent to Investigation Hub:** Yes
**Collect File(s):** No
## Background
Browser bookmarks represent user-saved favorite websites and organizational folders. This data reveals frequently accessed sites, user interests, and potential indicators of reconnaissance, phishing targets, or suspicious infrastructure.
## Data Collected
This collector gathers structured data about edge bookmarks.
### Edge Bookmarks Data
| Field | Description | Example |
|-------|-------------|---------|
| `UserName` | User Name | Example value |
| `ProfileName` | Profile Name | Example value |
| `BrowserName` | Browser Name | Example value |
| `GUID` | GUID | Example value |
| `BookmarkID` | Bookmark ID | Example value |
| `Name` | Name | Example value |
| `Type` | Type | Example value |
| `URL` | URL | Example value |
| `ParentFolder` | Parent Folder | Example value |
| `DateAdded` | Date Added | 2023-10-15 14:30:25+03:00 |
| `DateLastUsed` | Date Last Used | 2023-10-15 14:30:25+03:00 |
| `DateModified` | Date Modified | 2023-10-15 14:30:25+03:00 |
## Collection Method
This collector parses the browser's Bookmarks file to extract saved URLs, folder structures, timestamps, and metadata.
## Forensic Value
Bookmark analysis identifies targeted websites, phishing pages, command-and-control servers, internal resources, and organizational reconnaissance patterns. Investigators can detect social engineering campaigns, credential harvesting attempts, and lateral movement preparation.
---
# Edge Browsing History
> Source: https://kb.binalyze.ai/air/features/acquisition/supported-evidence/linux-collections-detail/edge-browsing-history.html
## Overview
**Evidence:** Edge Browsing History
**Description:** Collect visited URLs from Edge
**Category:** Applications
**Platform:** linux
**Short Name:** ehst
**Is Parsed:** Yes
**Sent to Investigation Hub:** Yes
**Collect File(s):** No
## Background
Browser history records all websites visited by users, including URLs, page titles, visit timestamps, visit counts, and transition types. This data is essential for reconstructing user activity, identifying malicious websites, and tracking lateral movement or reconnaissance activities.
## Data Collected
This collector gathers structured data about edge browsing history.
### Edge Browsing History Data
| Field | Description | Example |
|-------|-------------|---------|
| `AccessTime` | Access Time | 2023-10-15 14:30:25+03:00 |
| `AccessCount` | Access Count | 123 |
| `URL` | URL | Example value |
| `Browser` | Browser | Example value |
| `Title` | Title | Example value |
| `VisitDuration` | Visit Duration | Example value |
| `Referrer` | Referrer | Example value |
| `TypedCount` | Typed Count | 123 |
| `IsHidden` | Is Hidden | true |
| `TransitionType` | Transition Type | Example value |
| `VisitID` | Visit ID | 123 |
| `TransitionQualifiers` | Transition Qualifiers | Example value |
| `User` | User | Example value |
| `Profile` | Profile | Example value |
| `HistoryFilePath` | History File Path | Example value |
## Collection Method
This collector queries the browser's History database to extract visited URLs, timestamps, referrer information, and user interaction patterns.
## Forensic Value
Browsing history reveals phishing sites, malicious domains, command-and-control servers, data exfiltration targets, and reconnaissance activities. Analysts can identify compromised credentials, track attacker infrastructure, and correlate web activity with other security events to establish attack timelines.
---
# Edge Cookies
> Source: https://kb.binalyze.ai/air/features/acquisition/supported-evidence/linux-collections-detail/edge-cookies.html
## Overview
**Evidence:** Edge Cookies
**Description:** Collect Edge Cookies
**Category:** Applications
**Platform:** linux
**Short Name:** ecookies
**Is Parsed:** Yes
**Sent to Investigation Hub:** Yes
**Collect File(s):** No
## Background
Browser cookies store session tokens, authentication credentials, user preferences, and tracking data. This data is essential for understanding authenticated sessions, tracking user activity across websites, and identifying session hijacking or credential theft.
## Data Collected
This collector gathers structured data about edge cookies.
### Edge Cookies Data
| Field | Description | Example |
|-------|-------------|---------|
| `UserName` | User Name | Example value |
| `BrowserName` | Browser Name | Example value |
| `ProfileName` | Profile Name | Example value |
| `Domain` | Domain | Example value |
| `Name` | Name | Example value |
| `Path` | Path | Example value |
| `Value` | Value | Example value |
| `IsSecure` | Is Secure | 123 |
| `IsHTTPOnly` | Is HTTP Only | 123 |
| `HasExpires` | Has Expires | 123 |
| `IsPersistent` | Is Persistent | 123 |
| `Priority` | Priority | 123 |
| `SameSite` | Same Site | 123 |
| `SourcePort` | Source Port | 123 |
| `SourceScheme` | Source Scheme | 123 |
| `CreationTime` | Creation Time | 2023-10-15 14:30:25+03:00 |
| `ExpiresTime` | Expires Time | 2023-10-15 14:30:25+03:00 |
| `LastAccessTime` | Last Access Time | 2023-10-15 14:30:25+03:00 |
## Collection Method
This collector extracts cookies from the browser's Cookies database, including domain, name, value, path, expiration, and security flags.
## Forensic Value
Cookie analysis reveals active sessions, authentication tokens, persistent tracking identifiers, and potential session hijacking. Investigators can identify stolen credentials, unauthorized access, and cross-site tracking used for reconnaissance or targeting.
---
# Edge Downloads
> Source: https://kb.binalyze.ai/air/features/acquisition/supported-evidence/linux-collections-detail/edge-downloads.html
## Overview
**Evidence:** Edge Downloads
**Description:** Collect Edge Downloads
**Category:** Applications
**Platform:** linux
**Short Name:** edwnlds
**Is Parsed:** Yes
**Sent to Investigation Hub:** Yes
**Collect File(s):** No
## Background
Browser download history records files downloaded by users, including file paths, timestamps, URLs, referrer information, and download status. This data is essential for tracking file acquisition, identifying potentially malicious downloads, and reconstructing user activity timelines.
## Data Collected
This collector gathers structured data about edge downloads.
### Edge Downloads Data
| Field | Description | Example |
|-------|-------------|---------|
| `UserName` | User Name | Example value |
| `Browser` | Browser | Example value |
| `ProfileName` | Profile Name | Example value |
| `URL` | URL | Example value |
| `TargetPath` | Target Path | Example value |
| `CurrentPath` | Current Path | Example value |
| `Referrer` | Referrer | Example value |
| `LastModified` | Last Modified | 2023-10-15 14:30:25+03:00 |
| `DangerType` | Danger Type | 123 |
| `Opened` | Opened | 123 |
| `TabURL` | Tab URL | Example value |
| `TabReferrerURL` | Tab Referrer URL | Example value |
| `StartTime` | Start Time | 2023-10-15 14:30:25+03:00 |
| `EndTime` | End Time | 2023-10-15 14:30:25+03:00 |
| `HistoryFilePath` | History File Path | Example value |
## Collection Method
This collector queries the browser's History database to extract download records, including file paths, download times, source URLs, and security flags.
## Forensic Value
Download history reveals malware delivery vectors, data exfiltration attempts, unauthorized software installation, and user interaction with suspicious websites. Analysts can identify downloaded malicious files, track attack chains, and correlate downloads with other security events.
---
# Edge Favicons
> Source: https://kb.binalyze.ai/air/features/acquisition/supported-evidence/linux-collections-detail/edge-favicons.html
## Overview
**Evidence:** Edge Favicons
**Description:** Collect Edge Favicons
**Category:** Applications
**Platform:** linux
**Short Name:** efico
**Is Parsed:** Yes
**Sent to Investigation Hub:** Yes
**Collect File(s):** No
## Background
Browser favicons are cached website icons that provide visual history of visited sites. This data supplements browsing history by revealing sites accessed even if history was deleted.
## Data Collected
This collector gathers structured data about edge favicons.
### Edge Favicons Data
| Field | Description | Example |
|-------|-------------|---------|
| `ID` | ID | 123 |
| `UserName` | User Name | Example value |
| `BrowserName` | Browser Name | Example value |
| `Profile` | Profile | Example value |
| `URL` | URL | Example value |
| `IconType` | Icon Type | 123 |
| `Path` | Path | Example value |
## Collection Method
This collector queries the browser's Favicons database to extract cached website icons and associated URLs.
## Forensic Value
Favicon analysis can recover evidence of deleted browsing history, identify visited sites through icon fingerprinting, and correlate with other browser artifacts to establish comprehensive activity timelines.
---
# Edge Form History
> Source: https://kb.binalyze.ai/air/features/acquisition/supported-evidence/linux-collections-detail/edge-form-history.html
## Overview
**Evidence:** Edge Form History
**Description:** Collect Edge Form History
**Category:** Applications
**Platform:** linux
**Short Name:** efh
**Is Parsed:** Yes
**Sent to Investigation Hub:** Yes
**Collect File(s):** No
## Background
Browser form history stores previously entered form data including search queries, usernames, and other input fields. This data reveals user search patterns, account information, and potential data leakage through autofill.
## Data Collected
This collector gathers structured data about edge form history.
### Edge Form History Data
| Field | Description | Example |
|-------|-------------|---------|
| `UserName` | User Name | Example value |
| `BrowserName` | Browser Name | Example value |
| `Name` | Name | Example value |
| `Value` | Value | Example value |
| `ValueLower` | Value Lower | Example value |
| `Count` | Count | 123 |
| `Profile` | Profile | Example value |
| `Path` | Path | Example value |
| `DateCreated` | Date Created | 2023-10-15 14:30:25+03:00 |
| `DateLastUsed` | Date Last Used | 2023-10-15 14:30:25+03:00 |
## Collection Method
This collector queries the browser's form history database to extract saved form field data, search queries, and associated timestamps.
## Forensic Value
Form history exposes reconnaissance activities, credential enumeration attempts, search queries revealing attacker intent, and potentially sensitive information entered into web forms. Analysts can identify data exfiltration, account compromise indicators, and targeted search patterns.
---
# Edge Local Storage
> Source: https://kb.binalyze.ai/air/features/acquisition/supported-evidence/linux-collections-detail/edge-local-storage.html
## Overview
**Evidence:** Edge Local Storage
**Description:** Collect Edge Local Storage
**Category:** Applications
**Platform:** linux
**Short Name:** els
**Is Parsed:** Yes
**Sent to Investigation Hub:** Yes
**Collect File(s):** No
## Background
Browser local storage contains persistent key-value data stored by websites. This data includes user preferences, session state, cached data, and potentially authentication tokens or sensitive information.
## Data Collected
This collector gathers structured data about edge local storage.
### Edge Local Storage Data
| Field | Description | Example |
|-------|-------------|---------|
| `UserName` | User Name | Example value |
| `ProfileName` | Profile Name | Example value |
| `BrowserName` | Browser Name | Example value |
| `Key` | Key | Example value |
| `Value` | Value | Example value |
| `Path` | Path | Example value |
## Collection Method
This collector extracts local storage data from browser storage databases and files.
## Forensic Value
Local storage analysis reveals stored credentials, session tokens, tracking identifiers, and application state that can indicate compromised accounts, persistent tracking, or malicious website activity. Analysts can identify credential theft, session hijacking, and data exfiltration attempts.
---
# Edge Login Data
> Source: https://kb.binalyze.ai/air/features/acquisition/supported-evidence/linux-collections-detail/edge-login-data.html
## Overview
**Evidence:** Edge Login Data
**Description:** Collect Edge Login Data
**Category:** Applications
**Platform:** linux
**Short Name:** elgd
**Is Parsed:** Yes
**Sent to Investigation Hub:** Yes
**Collect File(s):** No
## Background
Browser login data stores saved passwords and credential information. This data is critical for identifying stored credentials, password reuse patterns, and potential credential theft targets.
## Data Collected
This collector gathers structured data about edge login data.
### Edge Login Data Data
| Field | Description | Example |
|-------|-------------|---------|
| `ID` | ID | 123 |
| `UserName` | User Name | Example value |
| `BrowserName` | Browser Name | Example value |
| `OriginURL` | Origin URL | Example value |
| `SignonRealm` | Signon Realm | Example value |
| `BlacklistedByUser` | Blacklisted By User | 123 |
| `Scheme` | Scheme | Example value |
| `PasswordType` | Password Type | Example value |
| `TimesUsed` | Times Used | 123 |
| `Profile` | Profile | Example value |
| `Path` | Path | Example value |
| `DateCreated` | Date Created | 2023-10-15 14:30:25+03:00 |
| `DateLastUsed` | Date Last Used | 2023-10-15 14:30:25+03:00 |
## Collection Method
This collector extracts saved credentials from the browser's Login Data database, including URLs, usernames, and encrypted passwords.
## Forensic Value
Login data analysis reveals stored credentials, password reuse across services, targeted accounts, and potential credential harvesting. Investigators can identify compromised accounts, credential theft attempts, and unauthorized access to saved credentials by malware or attackers.
---
# Edge Sessions
> Source: https://kb.binalyze.ai/air/features/acquisition/supported-evidence/linux-collections-detail/edge-sessions.html
## Overview
**Evidence:** Edge Sessions
**Description:** Collect Edge Sessions
**Category:** Applications
**Platform:** linux
**Short Name:** edss
**Is Parsed:** Yes
**Sent to Investigation Hub:** Yes
**Collect File(s):** No
## Background
Browser sessions maintain active tab state, cookies, and authentication context. This data reveals currently active user sessions, open websites, and authenticated connections at the time of collection.
## Data Collected
This collector gathers structured data about edge sessions.
### Edge Sessions Data
| Field | Description | Example |
|-------|-------------|---------|
| `ID` | ID | 123 |
| `WindowID` | Window ID | 123 |
| `Active` | Active | true |
| `Url` | Url | Example value |
| `Title` | Title | Example value |
| `Deleted` | Deleted | true |
| `Group` | Group | Example value |
| `History` | History | [] |
| `BrowserName` | Browser Name | Example value |
## Collection Method
This collector captures browser session data including active tabs, session cookies, and authentication state.
## Forensic Value
Session analysis identifies active compromises, authenticated sessions to malicious sites, concurrent suspicious activities, and real-time indicators of ongoing attacks. Analysts can detect active C2 connections, authenticated malware communications, and live attacker sessions.
---
# Edge Thumbnails
> Source: https://kb.binalyze.ai/air/features/acquisition/supported-evidence/linux-collections-detail/edge-thumbnails.html
## Overview
**Evidence:** Edge Thumbnails
**Description:** Collect Edge Thumbnails
**Category:** Applications
**Platform:** linux
**Short Name:** ethmb
**Is Parsed:** Yes
**Sent to Investigation Hub:** Yes
**Collect File(s):** No
## Background
Browser thumbnails are cached preview images of visited websites. This visual data supplements browsing history by providing screenshots of accessed pages, useful for recovering deleted history and identifying visited content.
## Data Collected
This collector gathers structured data about edge thumbnails.
### Edge Thumbnails Data
| Field | Description | Example |
|-------|-------------|---------|
| `UserName` | User Name | Example value |
| `Browser` | Browser | Example value |
| `URL` | URL | Example value |
| `URLRank` | URL Rank | 123 |
| `Title` | Title | Example value |
| `Profile` | Profile | Example value |
| `Path` | Path | Example value |
## Collection Method
This collector extracts cached thumbnail images from browser storage.
## Forensic Value
Thumbnail analysis provides visual evidence of visited websites, can recover evidence after history deletion, and helps identify phishing pages, malicious sites, or sensitive internal resources accessed by users through visual inspection.
---
# Edge User Profiles
> Source: https://kb.binalyze.ai/air/features/acquisition/supported-evidence/linux-collections-detail/edge-user-profiles.html
## Overview
**Evidence:** Edge User Profiles
**Description:** Collect Edge User Profiles
**Category:** Applications
**Platform:** linux
**Short Name:** eprfls
**Is Parsed:** Yes
**Sent to Investigation Hub:** Yes
**Collect File(s):** No
## Background
Browser user profiles store per-user browser configurations, extensions, settings, and data segregation. This data reveals multiple user accounts, profile switching patterns, and user-specific browsing behavior.
## Data Collected
This collector gathers structured data about edge user profiles.
### Edge User Profiles Data
| Field | Description | Example |
|-------|-------------|---------|
| `EndpointUserName` | Endpoint User Name | Example value |
| `Profile` | Profile | Example value |
| `ProfileUserName` | Profile User Name | Example value |
| `BrowserName` | Browser Name | Example value |
| `BackgroundApps` | Background Apps | true |
| `GoogleAccountGivenName` | Google Account Given Name | Example value |
| `GoogleAccountID` | Google Account ID | Example value |
| `GoogleAccountName` | Google Account Name | Example value |
| `PictureFileName` | Picture File Name | Example value |
| `LastDownloadedPictureURL` | Last Downloaded Picture URL | Example value |
| `HostedDomain` | Hosted Domain | Example value |
| `IsConsentedPrimaryAccount` | Is Consented Primary Account | true |
| `IsEphemeral` | Is Ephemeral | true |
## Collection Method
This collector enumerates browser user profiles and extracts profile metadata, configurations, and associated data paths.
## Forensic Value
Profile analysis identifies multiple user accounts, profile-specific extensions and configurations, shared device usage patterns, and potential privilege escalation or lateral movement using different browser profiles. Investigators can correlate activity across profiles and identify unauthorized profile creation.
---
# Edge Web Storage
> Source: https://kb.binalyze.ai/air/features/acquisition/supported-evidence/linux-collections-detail/edge-web-storage.html
## Overview
**Evidence:** Edge Web Storage
**Description:** Collect Edge Web Storage
**Category:** Applications
**Platform:** linux
**Short Name:** ews
**Is Parsed:** Yes
**Sent to Investigation Hub:** Yes
**Collect File(s):** No
## Background
Browser web storage includes both local and session storage used by websites to store client-side data. This data can contain application state, user preferences, cached content, and potentially sensitive information.
## Data Collected
This collector gathers structured data about edge web storage.
### Edge Web Storage Data
| Field | Description | Example |
|-------|-------------|---------|
| `UserName` | User Name | Example value |
| `ProfileName` | Profile Name | Example value |
| `BrowserName` | Browser Name | Example value |
| `Key` | Key | Example value |
| `Value` | Value | Example value |
| `Path` | Path | Example value |
## Collection Method
This collector extracts web storage data from browser storage locations including local storage and session storage.
## Forensic Value
Web storage analysis reveals cached application data, stored credentials, session information, and potential data exfiltration staging. Analysts can identify malicious website activity, stored authentication tokens, tracking identifiers, and sensitive data cached by compromised web applications.
---
# ETC Files
> Source: https://kb.binalyze.ai/air/features/acquisition/supported-evidence/linux-collections-detail/etc-files.html
## Overview
**Evidence:** ETC Files
**Description:** Collect all files in /private/etc directory
**Category:** System
**Platform:** linux
**Short Name:** etcf
**Is Parsed:** No
**Sent to Investigation Hub:** Yes
**Collect File(s):** Yes
## Background
The /private/etc directory on macOS contains system configuration files that define services, networking, authentication, and other OS behavior. Reviewing these files provides visibility into security posture and configuration drift.
## Data Collected
This collector gathers structured data about etc files.
## Collection Method
This collector walks the /private/etc directory, captures metadata (times, modes, sizes) and copies regular files into the case content for preservation and review.
## Forensic Value
Configuration files reveal service enablement, policy changes, malicious tampering, and indicators of persistence. They are essential for baselining and detecting unauthorized modifications.
---
# Failed Login Attempts
> Source: https://kb.binalyze.ai/air/features/acquisition/supported-evidence/linux-collections-detail/failed-login-attempts.html
## Overview
**Evidence:** Failed Login Attempts
**Description:** Collect fail login attempts
**Category:** Applications
**Platform:** linux
**Short Name:** fla
**Is Parsed:** Yes
**Sent to Investigation Hub:** Yes
**Collect File(s):** No
## Background
On Linux, failed login attempts are typically recorded in the binary btmp file. These records capture usernames, TTY, source hosts, and timestamps, which are crucial indicators of brute-force attempts or misconfiguration.
## Data Collected
This collector gathers structured data about failed login attempts.
## Collection Method
This collector reads entries from /var/log/btmp using a Utmp scanner, converts them to structured records, and adds the raw file to protected content.
## Forensic Value
Failed login telemetry reveals attack surface probing, credential stuffing, and mis-typed user behavior. It supports timeline reconstruction and correlation with authentication logs and network telemetry.
---
# File System Enumeration as CSV
> Source: https://kb.binalyze.ai/air/features/acquisition/supported-evidence/linux-collections-detail/file-system-enumeration-as-csv.html
## Overview
**Evidence:** File System Enumeration as CSV
**Description:** Dump file and folder information as CSV.
**Group:** DiskFilesystem
**Sub Group:** Disk & File System
**Platform:** linux
**Short Name:** fsenum
**Is Parsed:** Yes
**Sent to Investigation Hub:** No
**Collect Raw File(s):** No
**Collect as CSV File:** Yes
## Background
File system enumeration provides comprehensive information about files, directories, and file system structure on Unix-like systems. This data is essential for understanding file system state and detecting unauthorized file modifications.
## Data Collected
This collector gathers structured data about file system enumeration as csv.
### File System Enumeration as CSV Data
| Field | Description | Example |
|-------|-------------|---------|
| `GroupId` | Group Id | 123 |
| `UserId` | User Id | 123 |
| `Mode` | Mode | 123 |
| `Dev` | Dev | 123 |
| `Nlink` | Nlink | 123 |
| `Size` | Size | 123 |
| `Ino` | Ino | 123 |
| `Path` | Path | Example value |
| `LastChangeTime` | Last Change Time | 2023-10-15 14:30:25+03:00 |
| `AccessTime` | Access Time | 2023-10-15 14:30:25+03:00 |
| `ModificationTime` | Modification Time | 2023-10-15 14:30:25+03:00 |
## Collection Method
This collector enumerates the file system and records metadata to the `file_system_enumeration` table.
## Forensic Value
This evidence is crucial for forensic investigations as it provides file system information. It helps investigators understand file system state, detect unauthorized file modifications, and investigate file-based attacks. The data can reveal file changes, directory structures, and potential file system vulnerabilities.
---
# Firefox Browsing History
> Source: https://kb.binalyze.ai/air/features/acquisition/supported-evidence/linux-collections-detail/firefox-browsing-history.html
## Overview
**Evidence:** Firefox Browsing History
**Description:** Collect visited URLs from Mozilla Firefox
**Category:** Applications
**Platform:** linux
**Short Name:** fhst
**Is Parsed:** Yes
**Sent to Investigation Hub:** Yes
**Collect File(s):** No
## Background
Browser history records all websites visited by users, including URLs, page titles, visit timestamps, visit counts, and transition types. This data is essential for reconstructing user activity, identifying malicious websites, and tracking lateral movement or reconnaissance activities.
## Data Collected
This collector gathers structured data about firefox browsing history.
### Firefox Browsing History Data
| Field | Description | Example |
|-------|-------------|---------|
| `AccessTime` | Access Time | 2023-10-15 14:30:25+03:00 |
| `AccessCount` | Access Count | 123 |
| `URL` | URL | Example value |
| `Browser` | Browser | Example value |
| `Title` | Title | Example value |
| `VisitDuration` | Visit Duration | Example value |
| `Referrer` | Referrer | Example value |
| `TypedCount` | Typed Count | 123 |
| `IsHidden` | Is Hidden | true |
| `TransitionType` | Transition Type | Example value |
| `VisitID` | Visit ID | 123 |
| `TransitionQualifiers` | Transition Qualifiers | Example value |
| `User` | User | Example value |
| `Profile` | Profile | Example value |
| `HistoryFilePath` | History File Path | Example value |
## Collection Method
This collector queries the browser's History database to extract visited URLs, timestamps, referrer information, and user interaction patterns.
## Forensic Value
Browsing history reveals phishing sites, malicious domains, command-and-control servers, data exfiltration targets, and reconnaissance activities. Analysts can identify compromised credentials, track attacker infrastructure, and correlate web activity with other security events to establish attack timelines.
---
# Firefox Cookies
> Source: https://kb.binalyze.ai/air/features/acquisition/supported-evidence/linux-collections-detail/firefox-cookies.html
## Overview
**Evidence:** Firefox Cookies
**Description:** Collect Firefox Cookies
**Category:** Applications
**Platform:** linux
**Short Name:** fcookies
**Is Parsed:** Yes
**Sent to Investigation Hub:** Yes
**Collect File(s):** No
## Background
Firefox cookies store session data, authentication tokens, user preferences, and tracking information. Cookies can persist across sessions and contain sensitive data including login credentials, API tokens, and user identifiers. Understanding cookie data is essential for investigating account compromises, tracking malicious domains, and identifying data exfiltration paths.
## Data Collected
This collector gathers structured data about firefox cookies.
### Firefox Cookies Data
| Field | Description | Example |
|-------|-------------|---------|
| `UserName` | User Name | Example value |
| `ProfileName` | Profile Name | Example value |
| `OriginAttributes` | Origin Attributes | Example value |
| `Name` | Name | Example value |
| `Value` | Value | Example value |
| `Host` | Host | Example value |
| `Path` | Path | Example value |
| `IsSecure` | Is Secure | true |
| `IsHTTPOnly` | Is HTTP Only | true |
| `InBrowserElement` | In Browser Element | 123 |
| `SameSite` | Same Site | 123 |
| `RawSameSite` | Raw Same Site | 123 |
| `SchemeMap` | Scheme Map | 123 |
| `Expiry` | Expiry | 2023-10-15 14:30:25+03:00 |
| `LastAccessTime` | Last Access Time | 2023-10-15 14:30:25+03:00 |
| `CreationTime` | Creation Time | 2023-10-15 14:30:25+03:00 |
## Collection Method
This collector queries the Firefox cookies.sqlite database to extract cookie information including names, values, domains, paths, expiration times, security flags, and SameSite attributes for all user profiles.
## Forensic Value
Cookie data reveals visited websites, active sessions, authentication states, and tracking mechanisms. Malicious cookies may indicate session hijacking, credential theft, cross-site scripting attacks, or connections to command-and-control infrastructure. This evidence helps establish user activity timelines, identify compromised accounts, and track attacker access to web services.
---
# Firefox Downloads
> Source: https://kb.binalyze.ai/air/features/acquisition/supported-evidence/linux-collections-detail/firefox-downloads.html
## Overview
**Evidence:** Firefox Downloads
**Description:** Collect Firefox Downloads
**Category:** Applications
**Platform:** linux
**Short Name:** fdwnlds
**Is Parsed:** Yes
**Sent to Investigation Hub:** Yes
**Collect File(s):** No
## Background
Browser download history records files downloaded by users, including file paths, timestamps, URLs, referrer information, and download status. This data is essential for tracking file acquisition, identifying potentially malicious downloads, and reconstructing user activity timelines.
## Data Collected
This collector gathers structured data about firefox downloads.
### Firefox Downloads Data
| Field | Description | Example |
|-------|-------------|---------|
| `UserName` | User Name | Example value |
| `Browser` | Browser | Example value |
| `ProfileName` | Profile Name | Example value |
| `URL` | URL | Example value |
| `TargetPath` | Target Path | Example value |
| `CurrentPath` | Current Path | Example value |
| `Referrer` | Referrer | Example value |
| `LastModified` | Last Modified | 2023-10-15 14:30:25+03:00 |
| `DangerType` | Danger Type | 123 |
| `Opened` | Opened | 123 |
| `TabURL` | Tab URL | Example value |
| `TabReferrerURL` | Tab Referrer URL | Example value |
| `StartTime` | Start Time | 2023-10-15 14:30:25+03:00 |
| `EndTime` | End Time | 2023-10-15 14:30:25+03:00 |
| `HistoryFilePath` | History File Path | Example value |
## Collection Method
This collector queries the browser's History database to extract download records, including file paths, download times, source URLs, and security flags.
## Forensic Value
Download history reveals malware delivery vectors, data exfiltration attempts, unauthorized software installation, and user interaction with suspicious websites. Analysts can identify downloaded malicious files, track attack chains, and correlate downloads with other security events.
---
# Firefox Extensions
> Source: https://kb.binalyze.ai/air/features/acquisition/supported-evidence/linux-collections-detail/firefox-extensions.html
## Overview
**Evidence:** Firefox Extensions
**Description:** Collect Firefox Extensions (Addons)
**Category:** Applications
**Platform:** linux
**Short Name:** fext
**Is Parsed:** Yes
**Sent to Investigation Hub:** Yes
**Collect File(s):** No
## Background
Firefox extensions (add-ons) enhance browser functionality but can pose significant security risks. Malicious extensions can steal credentials, inject ads, track browsing activity, exfiltrate data, and modify web content. Understanding installed extensions is crucial for detecting browser-based attacks and unauthorized access.
## Data Collected
This collector gathers structured data about firefox extensions.
### Firefox Extensions Data
| Field | Description | Example |
|-------|-------------|---------|
| `ExtensionID` | Extension ID | Example value |
| `SyncGUID` | Sync GUID | Example value |
| `Version` | Version | Example value |
| `Username` | Username | Example value |
| `Type` | Type | Example value |
| `Name` | Name | Example value |
| `Description` | Description | Example value |
| `Visible` | Visible | true |
| `Active` | Active | true |
| `UserDisabled` | User Disabled | true |
| `AppDisabled` | App Disabled | true |
| `Path` | Path | Example value |
| `DefaultLocale` | Default Locale | Example value |
| `Hidden` | Hidden | true |
| `InstallTelemetryInfo` | Install Telemetry Info | Example value |
| `Location` | Location | Example value |
| `ManifestVersion` | Manifest Version | 123 |
| `OptionsURL` | Options URL | Example value |
| `OptionsType` | Options Type | 123 |
| `SourceURI` | Source URI | Example value |
| `SignedState` | Signed State | 123 |
| `Incognito` | Incognito | Example value |
| `UserPermissions` | User Permissions | Example value |
| `OptionalPermissions` | Optional Permissions | Example value |
| `InstallDate` | Install Date | 2023-10-15 14:30:25+03:00 |
| `UpdateDate` | Update Date | 2023-10-15 14:30:25+03:00 |
| `SignedDate` | Signed Date | 2023-10-15 14:30:25+03:00 |
## Collection Method
This collector parses Firefox extensions.json and addons.json files from user profiles to extract installed extension information including names, IDs, versions, descriptions, permissions, and installation sources.
## Forensic Value
Firefox extension data provides insight into potential compromise vectors and data exfiltration paths. Malicious or suspicious extensions may indicate phishing attacks, credential theft, adware infections, or privacy violations. This evidence helps identify attack entry points, persistence mechanisms, and unauthorized browser modifications.
---
# Fstab
> Source: https://kb.binalyze.ai/air/features/acquisition/supported-evidence/linux-collections-detail/fstab.html
## Overview
**Evidence:** Fstab
**Description:** Collect fstab configuration
**Category:** DiskFilesystem
**Platform:** linux
**Short Name:** fstab
**Is Parsed:** Yes
**Sent to Investigation Hub:** Yes
**Collect File(s):** No
## Background
This collector gathers fstab information from the Linux system. This data is essential for understanding system activity, detecting security incidents, and investigating system-related events.
## Data Collected
This collector gathers structured data about fstab.
### Fstab Data
| Field | Description | Example |
|-------|-------------|---------|
| `Dump` | Dump | Example value |
| `FileSystem` | File System | Example value |
| `MountPoint` | Mount Point | Example value |
| `Options` | Options | Example value |
| `Pass` | Pass | Example value |
| `Type` | Type | Example value |
## Collection Method
This collector parses the necessary data from the `fstab` table.
## Forensic Value
This evidence is crucial for forensic investigations as it provides fstab information. It helps investigators understand system activity, detect security incidents, and investigate system-related events. The data can reveal system changes, unauthorized activities, and potential security vulnerabilities. Analysts can use this information to identify system compromises, trace malicious activities, and assess Linux security posture.
---
# Hosts
> Source: https://kb.binalyze.ai/air/features/acquisition/supported-evidence/linux-collections-detail/hosts.html
## Overview
**Evidence:** Hosts
**Description:** Collect hosts
**Category:** Network
**Platform:** linux
**Short Name:** hosts
**Is Parsed:** Yes
**Sent to Investigation Hub:** Yes
**Collect File(s):** No
## Background
collect hosts file on AIX (Advanced Interactive eXecutive) systems provides valuable forensic information for digital investigations. This data is essential for understanding system activity, detecting security incidents, and investigating system-related events. AIX systems provide unique insights into enterprise Unix environments and their security configurations.
## Data Collected
This collector gathers structured data about hosts.
### Hosts Data
| Field | Description | Example |
|-------|-------------|---------|
| `Address` | Address | Example value |
| `HostNames` | Host Names | Example value |
## Collection Method
This collector parses the necessary data from system configuration files and data sources.
## Forensic Value
This evidence is crucial for forensic investigations as it provides information about hosts on AIX systems. It helps investigators understand system configuration, detect security incidents, and investigate system-related events. The data can reveal system activity, configuration details, and potential security vulnerabilities. Analysts can use this information to identify suspicious activities, trace system changes, and assess AIX system security posture.
---
# ICMP Table
> Source: https://kb.binalyze.ai/air/features/acquisition/supported-evidence/linux-collections-detail/icmp-table.html
## Overview
**Evidence:** ICMP Table
**Description:** Collect ICMP table
**Category:** Network
**Platform:** linux
**Short Name:** icmptab
**Is Parsed:** Yes
**Sent to Investigation Hub:** Yes
**Collect File(s):** No
## Background
This collector gathers icmp information from the Linux system. This data is essential for understanding system activity, detecting security incidents, and investigating system-related events.
## Data Collected
This collector gathers structured data about icmp table.
## Collection Method
This collector parses the necessary data from the `icmp` table.
## Forensic Value
This evidence is crucial for forensic investigations as it provides icmp information. It helps investigators understand system activity, detect security incidents, and investigate system-related events. The data can reveal system changes, unauthorized activities, and potential security vulnerabilities. Analysts can use this information to identify system compromises, trace malicious activities, and assess Linux security posture.
---
# IDE Extensions
> Source: https://kb.binalyze.ai/air/features/acquisition/supported-evidence/linux-collections-detail/ide-extensions.html
## Overview
**Evidence:** IDE Extensions
**Description:** Collect installed IDE extension and plugin metadata
**Category:** Applications
**Platform:** linux
**Short Name:** ideext
**Is Parsed:** Yes
**Sent to Investigation Hub:** Yes
**Collect File(s):** No
## Background
IDE extensions execute with the same privileges as the developer's editor and can read workspace files, access credentials, exfiltrate code, inject backdoors into builds, and persist across sessions. Malicious VS Code-compatible extensions and JetBrains plugins are a proven initial-access and persistence vector.
## Data Collected
This collector gathers structured metadata about installed IDE extensions and plugins, including identity, publisher, version, activation events, marketplace provenance, install scripts, and directory or manifest mismatches that suggest tampering. VS Code-compatible results are recorded in `ide_extensions_vscode`; JetBrains results in `ide_extensions_jetbrains`.
## Collection Method
This collector scans per-user IDE extension directories for VS Code-compatible editors (VS Code, Insiders, Server, Cursor, Devin, Windsurf, VSCodium, Antigravity) and JetBrains IDEs. It parses package.json manifests and plugin.xml metadata without executing extension code. For JetBrains JAR plugins, it reads META-INF/plugin.xml from the archive.
## Forensic Value
Extension metadata reveals unauthorized, sideloaded, or tampered extensions; broad activation events indicating startup persistence; missing marketplace provenance; directory and manifest identity mismatches suggesting post-install modification; and extension dependency chains that may introduce transitive supply-chain risk.
---
# IP Routes
> Source: https://kb.binalyze.ai/air/features/acquisition/supported-evidence/linux-collections-detail/ip-routes.html
## Overview
**Evidence:** IP Routes
**Description:** Collect IP routes
**Category:** Network
**Platform:** linux
**Short Name:** iprts
**Is Parsed:** Yes
**Sent to Investigation Hub:** Yes
**Collect File(s):** No
## Background
This collector gathers ip route information from the Linux system. This data is essential for understanding system activity, detecting security incidents, and investigating system-related events.
## Data Collected
This collector gathers structured data about ip routes.
## Collection Method
This collector parses the necessary data from the `ip_route` table.
## Forensic Value
This evidence is crucial for forensic investigations as it provides ip route information. It helps investigators understand system activity, detect security incidents, and investigate system-related events. The data can reveal system changes, unauthorized activities, and potential security vulnerabilities. Analysts can use this information to identify system compromises, trace malicious activities, and assess Linux security posture.
---
# IP Tables
> Source: https://kb.binalyze.ai/air/features/acquisition/supported-evidence/linux-collections-detail/ip-tables.html
## Overview
**Evidence:** IP Tables
**Description:** Collect IP tables
**Category:** Network
**Platform:** linux
**Short Name:** iptbl
**Is Parsed:** Yes
**Sent to Investigation Hub:** Yes
**Collect File(s):** No
## Background
Linux iptables firewall rules provide information about network security policies, access controls, and traffic filtering. This data is essential for understanding network security configuration and detecting unauthorized rule changes.
## Data Collected
This collector gathers structured data about ip tables.
## Collection Method
This collector parses the necessary data from the `iptables` table.
## Forensic Value
This evidence is crucial for forensic investigations as it provides firewall configuration information. It helps investigators understand network security policies, detect unauthorized rule changes, and investigate network-based attacks. The data can reveal firewall rules, access controls, and potential security vulnerabilities. Analysts can use this information to identify network security compromises, trace rule changes, and assess firewall security posture.
---
# Kernel Logs
> Source: https://kb.binalyze.ai/air/features/acquisition/supported-evidence/linux-collections-detail/kernel-logs.html
## Overview
**Evidence:** Kernel Logs
**Description:** Collect Kernel Logs
**Category:** System
**Platform:** linux
**Short Name:** kernl
**Is Parsed:** No
**Sent to Investigation Hub:** No
**Collect File(s):** Yes
## Background
Linux kernel logs (kern.log) contain messages from the Linux kernel including hardware events, driver messages, kernel errors, system calls, and low-level system events. These logs capture kernel-level activities and errors.
## Data Collected
This collector gathers structured data about kernel logs.
## Collection Method
This collector gathers kernel log files from /var/log/kern*, including rotated logs, which contain kernel messages and low-level system events.
## Forensic Value
Kernel logs are critical for investigating kernel exploits, rootkits, hardware manipulation, driver-level attacks, and system crashes. They provide low-level forensic evidence essential for advanced threat analysis.
---
# Kernel Modules
> Source: https://kb.binalyze.ai/air/features/acquisition/supported-evidence/linux-collections-detail/kernel-modules.html
## Overview
**Evidence:** Kernel Modules
**Description:** Collect kernel modules
**Category:** System
**Platform:** linux
**Short Name:** krnmods
**Is Parsed:** Yes
**Sent to Investigation Hub:** Yes
**Collect File(s):** No
## Background
Linux kernel modules provide information about loaded kernel extensions and drivers. This data is essential for understanding system kernel configuration and detecting unauthorized kernel modifications.
## Data Collected
This collector gathers structured data about kernel modules.
## Collection Method
This collector parses the necessary data from the `kernel_modules` table.
## Forensic Value
This evidence is crucial for forensic investigations as it provides kernel module information. It helps investigators understand kernel configuration, detect unauthorized kernel modifications, and investigate kernel-based attacks. The data can reveal loaded modules, kernel extensions, and potential kernel vulnerabilities. Analysts can use this information to identify kernel compromises, trace kernel activities, and assess kernel security posture.
---
# Last Access
> Source: https://kb.binalyze.ai/air/features/acquisition/supported-evidence/linux-collections-detail/last-access.html
## Overview
**Evidence:** Last Access
**Description:** Collect last access records
**Category:** Applications
**Platform:** linux
**Short Name:** lastacs
**Is Parsed:** Yes
**Sent to Investigation Hub:** Yes
**Collect File(s):** No
## Background
This collector gathers last access information from the Linux system. This data is essential for understanding user activity, detecting unauthorized access, and investigating authentication events.
## Data Collected
This collector gathers structured data about last access.
## Collection Method
This collector parses UTMP/WTMP records and records them into the `last_access` table.
## Forensic Value
This evidence is crucial for forensic investigations as it provides session activity details including logins and logouts, helping trace user behaviors and identify anomalies.
---
# Lock Files
> Source: https://kb.binalyze.ai/air/features/acquisition/supported-evidence/linux-collections-detail/lock-files.html
## Overview
**Evidence:** Lock Files
**Description:** Collect lock files
**Category:** System
**Platform:** linux
**Short Name:** lckfls
**Is Parsed:** Yes
**Sent to Investigation Hub:** Yes
**Collect File(s):** No
## Background
This collector gathers lock files information from the Linux system. This data is essential for understanding process/file locking behavior, detecting contention or misuse, and investigating system-related events.
## Data Collected
This collector gathers structured data about lock files.
## Collection Method
This collector parses process file descriptor info and lock metadata and records it into the `lock_files` table.
## Forensic Value
This evidence is crucial for forensic investigations as it reveals locked resources and processes holding them, helping identify sabotage, ransomware behavior, or resource contention.
---
# Log Files
> Source: https://kb.binalyze.ai/air/features/acquisition/supported-evidence/linux-collections-detail/log-files.html
## Overview
**Evidence:** Log Files
**Description:** Collect log files under /var/log/
**Category:** System
**Platform:** linux
**Short Name:** logs
**Is Parsed:** Yes
**Sent to Investigation Hub:** Yes
**Collect File(s):** No
## Background
Linux log files provide comprehensive records of system events, application activities, and security events. This data is essential for understanding system behavior, detecting security incidents, and reconstructing timelines of events.
## Data Collected
This collector gathers structured data about log files.
## Collection Method
This collector parses the necessary data from the `log_files` table.
## Forensic Value
This evidence is crucial for forensic investigations as it provides comprehensive system activity records. It helps investigators detect system-level attacks, analyze security events, and reconstruct system incidents. The data can reveal system errors, security events, and unauthorized system modifications. Analysts can use this information to identify system compromises, trace malicious activities, and assess Linux security posture.
---
# Logged Users
> Source: https://kb.binalyze.ai/air/features/acquisition/supported-evidence/linux-collections-detail/logged-users.html
## Overview
**Evidence:** Logged Users
**Description:** Collect logged user list
**Category:** Applications
**Platform:** linux
**Short Name:** lgdusrs
**Is Parsed:** Yes
**Sent to Investigation Hub:** Yes
**Collect File(s):** No
## Background
This collector gathers logged users information from the Linux system. This data is essential for understanding user activity, detecting unauthorized access, and investigating authentication events.
## Data Collected
This collector gathers structured data about logged users.
## Collection Method
This collector parses UTMP/WTMP records and records them into the `logged_users` table.
## Forensic Value
This evidence is crucial for forensic investigations as it provides user session information. It helps investigators identify suspicious logins, trace session activities, and assess account misuse.
---
# Mail Logs
> Source: https://kb.binalyze.ai/air/features/acquisition/supported-evidence/linux-collections-detail/mail-logs.html
## Overview
**Evidence:** Mail Logs
**Description:** Collect Mail Logs
**Category:** System
**Platform:** linux
**Short Name:** maill
**Is Parsed:** No
**Sent to Investigation Hub:** No
**Collect File(s):** Yes
## Background
Linux mail logs record email server activities including message delivery, SMTP transactions, mail relay operations, and email-related errors from services like Postfix, Sendmail, or Exim.
## Data Collected
This collector gathers structured data about mail logs.
## Collection Method
This collector gathers mail log files from /var/log/mail*, including rotated archives, which contain email server operational logs.
## Forensic Value
Mail logs are essential for investigating email-based attacks, spam campaigns, phishing attempts, email exfiltration, and mail server compromise. They provide evidence of email communications and server abuse.
---
# Memory Map
> Source: https://kb.binalyze.ai/air/features/acquisition/supported-evidence/linux-collections-detail/memory-map.html
## Overview
**Evidence:** Memory Map
**Description:** Collect memory map
**Category:** Memory
**Platform:** linux
**Short Name:** memmap
**Is Parsed:** Yes
**Sent to Investigation Hub:** Yes
**Collect File(s):** No
## Background
This collector gathers memory map information from the Linux system. This data is essential for understanding system activity, detecting security incidents, and investigating system-related events.
## Data Collected
This collector gathers structured data about memory map.
## Collection Method
This collector parses the necessary data from the `memory_map` table.
## Forensic Value
This evidence is crucial for forensic investigations as it provides memory map information. It helps investigators understand system activity, detect security incidents, and investigate system-related events. The data can reveal system changes, unauthorized activities, and potential security vulnerabilities. Analysts can use this information to identify system compromises, trace malicious activities, and assess Linux security posture.
---
# Messages
> Source: https://kb.binalyze.ai/air/features/acquisition/supported-evidence/linux-collections-detail/messages.html
## Overview
**Evidence:** Messages
**Description:** Collect Messages Logs
**Category:** System
**Platform:** linux
**Short Name:** msgs
**Is Parsed:** No
**Sent to Investigation Hub:** No
**Collect File(s):** Yes
## Background
The messages log is the primary system log on Red Hat-based distributions (RHEL, CentOS, Fedora). It contains general system messages, informational messages, and non-critical system events from various services and daemons.
## Data Collected
This collector gathers structured data about messages.
## Collection Method
This collector gathers messages log files from /var/log/messages*, including rotated archives, which contain system-wide event logs.
## Forensic Value
Messages logs are essential for investigating system activities, service operations, hardware events, and security incidents on Red Hat-based systems. They provide crucial timeline data for forensic investigations.
---
# MongoDB Logs
> Source: https://kb.binalyze.ai/air/features/acquisition/supported-evidence/linux-collections-detail/mongodb-logs.html
## Overview
**Evidence:** MongoDB Logs
**Description:** Collect MongoDB Logs
**Category:** Applications
**Platform:** linux
**Short Name:** mngl
**Is Parsed:** No
**Sent to Investigation Hub:** No
**Collect File(s):** Yes
## Background
MongoDB database logs on Linux record database operations, queries, connections, authentication attempts, and errors. These logs are essential for tracking NoSQL database activities and security events.
## Data Collected
This collector gathers structured data about mongodb logs.
## Collection Method
This collector gathers MongoDB logs from /var/log/mongodb, which contains operational logs including queries, connections, and administrative operations.
## Forensic Value
MongoDB logs are valuable for investigating NoSQL injection attacks, unauthorized data access, data breaches, authentication failures, and database enumeration. They reveal query patterns and connection sources indicating compromise.
---
# Mounts
> Source: https://kb.binalyze.ai/air/features/acquisition/supported-evidence/linux-collections-detail/mounts.html
## Overview
**Evidence:** Mounts
**Description:** Collect mounts
**Category:** DiskFilesystem
**Platform:** linux
**Short Name:** mounts
**Is Parsed:** Yes
**Sent to Investigation Hub:** Yes
**Collect File(s):** No
## Background
Mount information on AIX systems provides details about mounted file systems, storage devices, and network shares. This data is essential for understanding system storage configuration, detecting unauthorized mounts, and investigating storage-related security incidents. Mount information includes file system types, mount points, device information, and access permissions.
## Data Collected
This collector gathers structured data about mounts.
## Collection Method
This collector parses the necessary data from system mount information.
## Forensic Value
This evidence is crucial for forensic investigations as it provides information about mounted file systems and storage configuration on AIX systems. It helps investigators understand storage layout, detect unauthorized mounts, and investigate storage-related attacks. The data can reveal file system types, mount points, device information, and access patterns. Analysts can use this information to identify suspicious mounts, trace storage access, and assess AIX system security posture.
---
# MySQL Logs
> Source: https://kb.binalyze.ai/air/features/acquisition/supported-evidence/linux-collections-detail/mysql-logs.html
## Overview
**Evidence:** MySQL Logs
**Description:** Collect MySQL Logs
**Category:** Applications
**Platform:** linux
**Short Name:** myl
**Is Parsed:** No
**Sent to Investigation Hub:** No
**Collect File(s):** Yes
## Background
MySQL database server logs on Linux capture database queries, errors, slow queries, authentication events, and server operations. These logs are critical for tracking database activities and security incidents.
## Data Collected
This collector gathers structured data about mysql logs.
## Collection Method
This collector gathers MySQL logs from /var/log/mysql, which typically contains error logs, slow query logs, and general query logs if enabled.
## Forensic Value
MySQL logs are critical for investigating SQL injection attacks, unauthorized database access, data exfiltration, privilege escalation, and database compromise. They provide query history and authentication attempt records.
---
# Network Interfaces
> Source: https://kb.binalyze.ai/air/features/acquisition/supported-evidence/linux-collections-detail/network-interfaces.html
## Overview
**Evidence:** Network Interfaces
**Description:** Collect network interfaces
**Category:** Network
**Platform:** linux
**Short Name:** netint
**Is Parsed:** Yes
**Sent to Investigation Hub:** Yes
**Collect File(s):** No
## Background
Linux network interface information provides details about network adapters, IP addresses, and network configuration. This data is essential for understanding network connectivity, detecting unauthorized network access, and investigating network-related security incidents.
## Data Collected
This collector gathers structured data about network interfaces.
## Collection Method
This collector parses the necessary data from the `network_interfaces` table.
## Forensic Value
This evidence is crucial for forensic investigations as it provides network configuration information. It helps investigators understand network topology, detect unauthorized network access, and investigate network-based attacks. The data can reveal network misconfigurations, unauthorized connections, and potential network vulnerabilities. Analysts can use this information to identify network compromises, trace network activities, and assess network security posture.
---
# NFS Exports
> Source: https://kb.binalyze.ai/air/features/acquisition/supported-evidence/linux-collections-detail/nfs-exports.html
## Overview
**Evidence:** NFS Exports
**Description:** Collect NFS exports
**Category:** DiskFilesystem
**Platform:** linux
**Short Name:** nfsexpr
**Is Parsed:** Yes
**Sent to Investigation Hub:** Yes
**Collect File(s):** No
## Background
This collector gathers NFS exports information from the Linux system. This data is essential for understanding network file sharing configuration, detecting unauthorized shares, and investigating data exposure risks.
## Data Collected
This collector gathers structured data about nfs exports.
## Collection Method
This collector parses NFS export configuration and records entries into the `nfs_exports` tables.
## Forensic Value
This evidence is crucial for forensic investigations as it provides network file share visibility. It helps investigators identify exposed paths, client permissions, and misconfigurations that could lead to data leakage.
---
# NGINX Logs
> Source: https://kb.binalyze.ai/air/features/acquisition/supported-evidence/linux-collections-detail/nginx-logs.html
## Overview
**Evidence:** NGINX Logs
**Description:** Collect NGINX Logs
**Category:** Applications
**Platform:** linux
**Short Name:** ngxl
**Is Parsed:** No
**Sent to Investigation Hub:** No
**Collect File(s):** Yes
## Background
NGINX web server logs on Linux capture HTTP/HTTPS requests, errors, and server activities. NGINX is widely used as both a web server and reverse proxy, making its logs essential for investigating web-based attacks.
## Data Collected
This collector gathers structured data about nginx logs.
## Collection Method
This collector gathers NGINX logs from the standard /var/log/nginx directory, which contains access logs, error logs, and any custom log configurations.
## Forensic Value
NGINX logs provide evidence of web attacks, API abuse, DDoS attempts, authentication bypasses, and malicious request patterns. They're essential for investigating compromised web applications and reverse proxy attacks.
---
# Opera Bookmarks
> Source: https://kb.binalyze.ai/air/features/acquisition/supported-evidence/linux-collections-detail/opera-bookmarks.html
## Overview
**Evidence:** Opera Bookmarks
**Description:** Collect Opera Bookmarks
**Category:** Applications
**Platform:** linux
**Short Name:** obkmrks
**Is Parsed:** Yes
**Sent to Investigation Hub:** Yes
**Collect File(s):** No
## Background
Browser bookmarks represent user-saved favorite websites and organizational folders. This data reveals frequently accessed sites, user interests, and potential indicators of reconnaissance, phishing targets, or suspicious infrastructure.
## Data Collected
This collector gathers structured data about opera bookmarks.
### Opera Bookmarks Data
| Field | Description | Example |
|-------|-------------|---------|
| `UserName` | User Name | Example value |
| `ProfileName` | Profile Name | Example value |
| `BrowserName` | Browser Name | Example value |
| `GUID` | GUID | Example value |
| `BookmarkID` | Bookmark ID | Example value |
| `Name` | Name | Example value |
| `Type` | Type | Example value |
| `URL` | URL | Example value |
| `ParentFolder` | Parent Folder | Example value |
| `DateAdded` | Date Added | 2023-10-15 14:30:25+03:00 |
| `DateLastUsed` | Date Last Used | 2023-10-15 14:30:25+03:00 |
| `DateModified` | Date Modified | 2023-10-15 14:30:25+03:00 |
## Collection Method
This collector parses the browser's Bookmarks file to extract saved URLs, folder structures, timestamps, and metadata.
## Forensic Value
Bookmark analysis identifies targeted websites, phishing pages, command-and-control servers, internal resources, and organizational reconnaissance patterns. Investigators can detect social engineering campaigns, credential harvesting attempts, and lateral movement preparation.
---
# Opera Browsing History
> Source: https://kb.binalyze.ai/air/features/acquisition/supported-evidence/linux-collections-detail/opera-browsing-history.html
## Overview
**Evidence:** Opera Browsing History
**Description:** Collect Visited URLs from Opera
**Category:** Applications
**Platform:** linux
**Short Name:** ohst
**Is Parsed:** Yes
**Sent to Investigation Hub:** Yes
**Collect File(s):** No
## Background
Browser history records all websites visited by users, including URLs, page titles, visit timestamps, visit counts, and transition types. This data is essential for reconstructing user activity, identifying malicious websites, and tracking lateral movement or reconnaissance activities.
## Data Collected
This collector gathers structured data about opera browsing history.
### Opera Browsing History Data
| Field | Description | Example |
|-------|-------------|---------|
| `AccessTime` | Access Time | 2023-10-15 14:30:25+03:00 |
| `AccessCount` | Access Count | 123 |
| `URL` | URL | Example value |
| `Browser` | Browser | Example value |
| `Title` | Title | Example value |
| `VisitDuration` | Visit Duration | Example value |
| `Referrer` | Referrer | Example value |
| `TypedCount` | Typed Count | 123 |
| `IsHidden` | Is Hidden | true |
| `TransitionType` | Transition Type | Example value |
| `VisitID` | Visit ID | 123 |
| `TransitionQualifiers` | Transition Qualifiers | Example value |
| `User` | User | Example value |
| `Profile` | Profile | Example value |
| `HistoryFilePath` | History File Path | Example value |
## Collection Method
This collector queries the browser's History database to extract visited URLs, timestamps, referrer information, and user interaction patterns.
## Forensic Value
Browsing history reveals phishing sites, malicious domains, command-and-control servers, data exfiltration targets, and reconnaissance activities. Analysts can identify compromised credentials, track attacker infrastructure, and correlate web activity with other security events to establish attack timelines.
---
# Opera Cookies
> Source: https://kb.binalyze.ai/air/features/acquisition/supported-evidence/linux-collections-detail/opera-cookies.html
## Overview
**Evidence:** Opera Cookies
**Description:** Collect Opera Cookies
**Category:** Applications
**Platform:** linux
**Short Name:** ocookies
**Is Parsed:** Yes
**Sent to Investigation Hub:** Yes
**Collect File(s):** No
## Background
Browser cookies store session tokens, authentication credentials, user preferences, and tracking data. This data is essential for understanding authenticated sessions, tracking user activity across websites, and identifying session hijacking or credential theft.
## Data Collected
This collector gathers structured data about opera cookies.
### Opera Cookies Data
| Field | Description | Example |
|-------|-------------|---------|
| `UserName` | User Name | Example value |
| `BrowserName` | Browser Name | Example value |
| `ProfileName` | Profile Name | Example value |
| `Domain` | Domain | Example value |
| `Name` | Name | Example value |
| `Path` | Path | Example value |
| `Value` | Value | Example value |
| `IsSecure` | Is Secure | 123 |
| `IsHTTPOnly` | Is HTTP Only | 123 |
| `HasExpires` | Has Expires | 123 |
| `IsPersistent` | Is Persistent | 123 |
| `Priority` | Priority | 123 |
| `SameSite` | Same Site | 123 |
| `SourcePort` | Source Port | 123 |
| `SourceScheme` | Source Scheme | 123 |
| `CreationTime` | Creation Time | 2023-10-15 14:30:25+03:00 |
| `ExpiresTime` | Expires Time | 2023-10-15 14:30:25+03:00 |
| `LastAccessTime` | Last Access Time | 2023-10-15 14:30:25+03:00 |
## Collection Method
This collector extracts cookies from the browser's Cookies database, including domain, name, value, path, expiration, and security flags.
## Forensic Value
Cookie analysis reveals active sessions, authentication tokens, persistent tracking identifiers, and potential session hijacking. Investigators can identify stolen credentials, unauthorized access, and cross-site tracking used for reconnaissance or targeting.
---
# Opera Downloads
> Source: https://kb.binalyze.ai/air/features/acquisition/supported-evidence/linux-collections-detail/opera-downloads.html
## Overview
**Evidence:** Opera Downloads
**Description:** Collect Opera Downloads
**Category:** Applications
**Platform:** linux
**Short Name:** odwnlds
**Is Parsed:** Yes
**Sent to Investigation Hub:** Yes
**Collect File(s):** No
## Background
Browser download history records files downloaded by users, including file paths, timestamps, URLs, referrer information, and download status. This data is essential for tracking file acquisition, identifying potentially malicious downloads, and reconstructing user activity timelines.
## Data Collected
This collector gathers structured data about opera downloads.
### Opera Downloads Data
| Field | Description | Example |
|-------|-------------|---------|
| `UserName` | User Name | Example value |
| `Browser` | Browser | Example value |
| `ProfileName` | Profile Name | Example value |
| `URL` | URL | Example value |
| `TargetPath` | Target Path | Example value |
| `CurrentPath` | Current Path | Example value |
| `Referrer` | Referrer | Example value |
| `LastModified` | Last Modified | 2023-10-15 14:30:25+03:00 |
| `DangerType` | Danger Type | 123 |
| `Opened` | Opened | 123 |
| `TabURL` | Tab URL | Example value |
| `TabReferrerURL` | Tab Referrer URL | Example value |
| `StartTime` | Start Time | 2023-10-15 14:30:25+03:00 |
| `EndTime` | End Time | 2023-10-15 14:30:25+03:00 |
| `HistoryFilePath` | History File Path | Example value |
## Collection Method
This collector queries the browser's History database to extract download records, including file paths, download times, source URLs, and security flags.
## Forensic Value
Download history reveals malware delivery vectors, data exfiltration attempts, unauthorized software installation, and user interaction with suspicious websites. Analysts can identify downloaded malicious files, track attack chains, and correlate downloads with other security events.
---
# Opera Favicons
> Source: https://kb.binalyze.ai/air/features/acquisition/supported-evidence/linux-collections-detail/opera-favicons.html
## Overview
**Evidence:** Opera Favicons
**Description:** Collect Opera Favicons
**Category:** Applications
**Platform:** linux
**Short Name:** ofico
**Is Parsed:** Yes
**Sent to Investigation Hub:** Yes
**Collect File(s):** No
## Background
Browser favicons are cached website icons that provide visual history of visited sites. This data supplements browsing history by revealing sites accessed even if history was deleted.
## Data Collected
This collector gathers structured data about opera favicons.
### Opera Favicons Data
| Field | Description | Example |
|-------|-------------|---------|
| `ID` | ID | 123 |
| `UserName` | User Name | Example value |
| `BrowserName` | Browser Name | Example value |
| `Profile` | Profile | Example value |
| `URL` | URL | Example value |
| `IconType` | Icon Type | 123 |
| `Path` | Path | Example value |
## Collection Method
This collector queries the browser's Favicons database to extract cached website icons and associated URLs.
## Forensic Value
Favicon analysis can recover evidence of deleted browsing history, identify visited sites through icon fingerprinting, and correlate with other browser artifacts to establish comprehensive activity timelines.
---
# Opera Form History
> Source: https://kb.binalyze.ai/air/features/acquisition/supported-evidence/linux-collections-detail/opera-form-history.html
## Overview
**Evidence:** Opera Form History
**Description:** Collect Opera Form History
**Category:** Applications
**Platform:** linux
**Short Name:** ofh
**Is Parsed:** Yes
**Sent to Investigation Hub:** Yes
**Collect File(s):** No
## Background
Browser form history stores previously entered form data including search queries, usernames, and other input fields. This data reveals user search patterns, account information, and potential data leakage through autofill.
## Data Collected
This collector gathers structured data about opera form history.
### Opera Form History Data
| Field | Description | Example |
|-------|-------------|---------|
| `UserName` | User Name | Example value |
| `BrowserName` | Browser Name | Example value |
| `Name` | Name | Example value |
| `Value` | Value | Example value |
| `ValueLower` | Value Lower | Example value |
| `Count` | Count | 123 |
| `Profile` | Profile | Example value |
| `Path` | Path | Example value |
| `DateCreated` | Date Created | 2023-10-15 14:30:25+03:00 |
| `DateLastUsed` | Date Last Used | 2023-10-15 14:30:25+03:00 |
## Collection Method
This collector queries the browser's form history database to extract saved form field data, search queries, and associated timestamps.
## Forensic Value
Form history exposes reconnaissance activities, credential enumeration attempts, search queries revealing attacker intent, and potentially sensitive information entered into web forms. Analysts can identify data exfiltration, account compromise indicators, and targeted search patterns.
---
# Opera Local Storage
> Source: https://kb.binalyze.ai/air/features/acquisition/supported-evidence/linux-collections-detail/opera-local-storage.html
## Overview
**Evidence:** Opera Local Storage
**Description:** Collect Opera Local Storage
**Category:** Applications
**Platform:** linux
**Short Name:** ols
**Is Parsed:** Yes
**Sent to Investigation Hub:** Yes
**Collect File(s):** No
## Background
Browser local storage contains persistent key-value data stored by websites. This data includes user preferences, session state, cached data, and potentially authentication tokens or sensitive information.
## Data Collected
This collector gathers structured data about opera local storage.
### Opera Local Storage Data
| Field | Description | Example |
|-------|-------------|---------|
| `UserName` | User Name | Example value |
| `ProfileName` | Profile Name | Example value |
| `BrowserName` | Browser Name | Example value |
| `Key` | Key | Example value |
| `Value` | Value | Example value |
| `Path` | Path | Example value |
## Collection Method
This collector extracts local storage data from browser storage databases and files.
## Forensic Value
Local storage analysis reveals stored credentials, session tokens, tracking identifiers, and application state that can indicate compromised accounts, persistent tracking, or malicious website activity. Analysts can identify credential theft, session hijacking, and data exfiltration attempts.
---
# Opera Login Data
> Source: https://kb.binalyze.ai/air/features/acquisition/supported-evidence/linux-collections-detail/opera-login-data.html
## Overview
**Evidence:** Opera Login Data
**Description:** Collect Opera Login Data
**Category:** Applications
**Platform:** linux
**Short Name:** olgd
**Is Parsed:** Yes
**Sent to Investigation Hub:** Yes
**Collect File(s):** No
## Background
Browser login data stores saved passwords and credential information. This data is critical for identifying stored credentials, password reuse patterns, and potential credential theft targets.
## Data Collected
This collector gathers structured data about opera login data.
### Opera Login Data Data
| Field | Description | Example |
|-------|-------------|---------|
| `ID` | ID | 123 |
| `UserName` | User Name | Example value |
| `BrowserName` | Browser Name | Example value |
| `OriginURL` | Origin URL | Example value |
| `SignonRealm` | Signon Realm | Example value |
| `BlacklistedByUser` | Blacklisted By User | 123 |
| `Scheme` | Scheme | Example value |
| `PasswordType` | Password Type | Example value |
| `TimesUsed` | Times Used | 123 |
| `Profile` | Profile | Example value |
| `Path` | Path | Example value |
| `DateCreated` | Date Created | 2023-10-15 14:30:25+03:00 |
| `DateLastUsed` | Date Last Used | 2023-10-15 14:30:25+03:00 |
## Collection Method
This collector extracts saved credentials from the browser's Login Data database, including URLs, usernames, and encrypted passwords.
## Forensic Value
Login data analysis reveals stored credentials, password reuse across services, targeted accounts, and potential credential harvesting. Investigators can identify compromised accounts, credential theft attempts, and unauthorized access to saved credentials by malware or attackers.
---
# Opera Sessions
> Source: https://kb.binalyze.ai/air/features/acquisition/supported-evidence/linux-collections-detail/opera-sessions.html
## Overview
**Evidence:** Opera Sessions
**Description:** Collect Opera Sessions
**Category:** Applications
**Platform:** linux
**Short Name:** opss
**Is Parsed:** Yes
**Sent to Investigation Hub:** Yes
**Collect File(s):** No
## Background
Browser sessions maintain active tab state, cookies, and authentication context. This data reveals currently active user sessions, open websites, and authenticated connections at the time of collection.
## Data Collected
This collector gathers structured data about opera sessions.
### Opera Sessions Data
| Field | Description | Example |
|-------|-------------|---------|
| `ID` | ID | 123 |
| `WindowID` | Window ID | 123 |
| `Active` | Active | true |
| `Url` | Url | Example value |
| `Title` | Title | Example value |
| `Deleted` | Deleted | true |
| `Group` | Group | Example value |
| `History` | History | [] |
| `BrowserName` | Browser Name | Example value |
## Collection Method
This collector captures browser session data including active tabs, session cookies, and authentication state.
## Forensic Value
Session analysis identifies active compromises, authenticated sessions to malicious sites, concurrent suspicious activities, and real-time indicators of ongoing attacks. Analysts can detect active C2 connections, authenticated malware communications, and live attacker sessions.
---
# Opera Thumbnails
> Source: https://kb.binalyze.ai/air/features/acquisition/supported-evidence/linux-collections-detail/opera-thumbnails.html
## Overview
**Evidence:** Opera Thumbnails
**Description:** Collect Opera Thumbnails
**Category:** Applications
**Platform:** linux
**Short Name:** othmb
**Is Parsed:** Yes
**Sent to Investigation Hub:** Yes
**Collect File(s):** No
## Background
Browser thumbnails are cached preview images of visited websites. This visual data supplements browsing history by providing screenshots of accessed pages, useful for recovering deleted history and identifying visited content.
## Data Collected
This collector gathers structured data about opera thumbnails.
### Opera Thumbnails Data
| Field | Description | Example |
|-------|-------------|---------|
| `UserName` | User Name | Example value |
| `Browser` | Browser | Example value |
| `URL` | URL | Example value |
| `URLRank` | URL Rank | 123 |
| `Title` | Title | Example value |
| `Profile` | Profile | Example value |
| `Path` | Path | Example value |
## Collection Method
This collector extracts cached thumbnail images from browser storage.
## Forensic Value
Thumbnail analysis provides visual evidence of visited websites, can recover evidence after history deletion, and helps identify phishing pages, malicious sites, or sensitive internal resources accessed by users through visual inspection.
---
# Opera User Profiles
> Source: https://kb.binalyze.ai/air/features/acquisition/supported-evidence/linux-collections-detail/opera-user-profiles.html
## Overview
**Evidence:** Opera User Profiles
**Description:** Collect Opera User Profiles
**Category:** Applications
**Platform:** linux
**Short Name:** oprfls
**Is Parsed:** Yes
**Sent to Investigation Hub:** Yes
**Collect File(s):** No
## Background
Browser user profiles store per-user browser configurations, extensions, settings, and data segregation. This data reveals multiple user accounts, profile switching patterns, and user-specific browsing behavior.
## Data Collected
This collector gathers structured data about opera user profiles.
### Opera User Profiles Data
| Field | Description | Example |
|-------|-------------|---------|
| `EndpointUserName` | Endpoint User Name | Example value |
| `Profile` | Profile | Example value |
| `ProfileUserName` | Profile User Name | Example value |
| `BrowserName` | Browser Name | Example value |
| `BackgroundApps` | Background Apps | true |
| `GoogleAccountGivenName` | Google Account Given Name | Example value |
| `GoogleAccountID` | Google Account ID | Example value |
| `GoogleAccountName` | Google Account Name | Example value |
| `PictureFileName` | Picture File Name | Example value |
| `LastDownloadedPictureURL` | Last Downloaded Picture URL | Example value |
| `HostedDomain` | Hosted Domain | Example value |
| `IsConsentedPrimaryAccount` | Is Consented Primary Account | true |
| `IsEphemeral` | Is Ephemeral | true |
## Collection Method
This collector enumerates browser user profiles and extracts profile metadata, configurations, and associated data paths.
## Forensic Value
Profile analysis identifies multiple user accounts, profile-specific extensions and configurations, shared device usage patterns, and potential privilege escalation or lateral movement using different browser profiles. Investigators can correlate activity across profiles and identify unauthorized profile creation.
---
# Opera Web Storage
> Source: https://kb.binalyze.ai/air/features/acquisition/supported-evidence/linux-collections-detail/opera-web-storage.html
## Overview
**Evidence:** Opera Web Storage
**Description:** Collect Opera Web Storage
**Category:** Applications
**Platform:** linux
**Short Name:** ows
**Is Parsed:** Yes
**Sent to Investigation Hub:** Yes
**Collect File(s):** No
## Background
Browser web storage includes both local and session storage used by websites to store client-side data. This data can contain application state, user preferences, cached content, and potentially sensitive information.
## Data Collected
This collector gathers structured data about opera web storage.
### Opera Web Storage Data
| Field | Description | Example |
|-------|-------------|---------|
| `UserName` | User Name | Example value |
| `ProfileName` | Profile Name | Example value |
| `BrowserName` | Browser Name | Example value |
| `Key` | Key | Example value |
| `Value` | Value | Example value |
| `Path` | Path | Example value |
## Collection Method
This collector extracts web storage data from browser storage locations including local storage and session storage.
## Forensic Value
Web storage analysis reveals cached application data, stored credentials, session information, and potential data exfiltration staging. Analysts can identify malicious website activity, stored authentication tokens, tracking identifiers, and sensitive data cached by compromised web applications.
---
# PostgreSQL Logs
> Source: https://kb.binalyze.ai/air/features/acquisition/supported-evidence/linux-collections-detail/postgresql-logs.html
## Overview
**Evidence:** PostgreSQL Logs
**Description:** Collect PostgreSQL Logs
**Category:** Applications
**Platform:** linux
**Short Name:** pgrl
**Is Parsed:** No
**Sent to Investigation Hub:** No
**Collect File(s):** Yes
## Background
PostgreSQL database logs on Linux record database operations, queries, connections, authentication events, and errors. Logs can be in /var/log/postgresql or within the data directory (/var/lib/pgsql/data/pg_log).
## Data Collected
This collector gathers structured data about postgresql logs.
## Collection Method
This collector gathers PostgreSQL logs from both standard log directories and the PostgreSQL data directory, capturing all database operational logs.
## Forensic Value
PostgreSQL logs are essential for investigating SQL injection, unauthorized access, data breaches, privilege escalation, and database attacks. They provide detailed query logs, connection information, and authentication history.
---
# Process Open Files
> Source: https://kb.binalyze.ai/air/features/acquisition/supported-evidence/linux-collections-detail/process-open-files.html
## Overview
**Evidence:** Process Open Files
**Description:** Collect process open files information
**Category:** System
**Platform:** linux
**Short Name:** popenf
**Is Parsed:** Yes
**Sent to Investigation Hub:** Yes
**Collect File(s):** No
## Background
This collector gathers process open files information from the Linux system. This data is essential for understanding process activity, detecting suspicious file access, and investigating process-based security incidents.
## Data Collected
This collector gathers structured data about process open files.
## Collection Method
This collector parses process file descriptor information and records it into the `process_open_files` table.
## Forensic Value
This evidence is crucial for forensic investigations as it reveals files accessed by processes, helping detect data exfiltration, malware behavior, and unauthorized access.
---
# Processes
> Source: https://kb.binalyze.ai/air/features/acquisition/supported-evidence/linux-collections-detail/processes.html
## Overview
**Evidence:** Processes
**Description:** Collect process list
**Category:** System
**Platform:** linux
**Short Name:** process
**Is Parsed:** Yes
**Sent to Investigation Hub:** Yes
**Collect File(s):** No
## Background
Process information on AIX systems provides detailed records of running processes, their attributes, and system resource usage. This data is essential for understanding system activity, detecting malicious processes, and investigating process-related security incidents. AIX process information includes process IDs, command lines, resource usage, and execution context.
## Data Collected
This collector gathers structured data about processes.
### Processes Data
| Field | Description | Example |
|-------|-------------|---------|
| `CWD` | CWD | Example value |
| `ChildrenMajorFaults` | Children Major Faults | 123 |
| `ChildrenMinorFaults` | Children Minor Faults | 123 |
| `Command` | Command | Example value |
| `CommandLine` | Command Line | Example value |
| `EffectiveGroupId` | Effective Group Id | 123 |
| `EffectiveUserId` | Effective User Id | 123 |
| `EffectiveUserName` | Effective User Name | Example value |
| `Environment` | Environment | Example value |
| `Executable` | Executable | Example value |
| `IsExecutableExists` | Is Executable Exists | true |
| `Hash` | Hash | Example value |
| `FileDescriptors` | File Descriptors | Example value |
| `Flags` | Flags | 123 |
| `GroupId` | Group Id | 123 |
| `MajorFaults` | Major Faults | 123 |
| `Maps` | Maps | [] |
| `MinorFaults` | Minor Faults | 123 |
| `Nice` | Nice | 123 |
| `ParentId` | Parent Id | 123 |
| `Priority` | Priority | 123 |
| `ProcessId` | Process Id | 123 |
| `RealGroupId` | Real Group Id | 123 |
| `RealUserId` | Real User Id | 123 |
| `ResidentSize` | Resident Size | 123 |
| `SavedGroupId` | Saved Group Id | 123 |
| `SavedUserId` | Saved User Id | 123 |
| `SessionId` | Session Id | 123 |
| `State` | State | Example value |
| `Threads` | Threads | 123 |
| `TpgId` | Tpg Id | 123 |
| `TtyNr` | Tty Nr | 123 |
| `RealUserName` | Real User Name | Example value |
| `SavedUserName` | Saved User Name | Example value |
| `VMSize` | VM Size | 123 |
| `CSTime` | CS Time | 123 |
| `CUTime` | CU Time | 123 |
| `SystemTime` | System Time | 123 |
| `StartTime` | Start Time | 123 |
| `StartDateTime` | Start Date Time | 2023-10-15 14:30:25+03:00 |
| `UserTime` | User Time | 123 |
## Collection Method
This collector parses the necessary data from system process information and file system.
## Forensic Value
This evidence is crucial for forensic investigations as it provides comprehensive process information for AIX systems. It helps investigators understand system activity, detect malicious processes, and investigate process-related attacks. The data can reveal running applications, resource usage patterns, and execution context. Analysts can use this information to identify suspicious processes, trace process relationships, and assess AIX system security posture.
---
# RAM Image
> Source: https://kb.binalyze.ai/air/features/acquisition/supported-evidence/linux-collections-detail/ram-image.html
## Overview
**Evidence:** RAM Image
**Description:** Create an image of RAM
**Category:** Memory
**Platform:** linux
**Short Name:** ram
**Is Parsed:** Yes
**Sent to Investigation Hub:** Yes
**Collect File(s):** No
## Background
This collector gathers ram information from the Linux system by creating a RAM image. This data is essential for understanding system activity, detecting security incidents, and investigating system-related events.
## Data Collected
This collector gathers structured data about ram image.
### RAM Image Data
| Field | Description | Example |
|-------|-------------|---------|
| `Path` | Path | Example value |
| `FileSize` | File Size | 123.45 |
## Collection Method
This collector creates a RAM image and records its metadata in the `ram_image` table.
## Forensic Value
This evidence is crucial for forensic investigations as it provides volatile memory content and metadata. It helps investigators analyze in-memory artifacts, detect malware, and investigate runtime behaviors. Analysts can use this information to identify malicious processes, extract credentials, and assess Linux security posture.
---
# Raw Table
> Source: https://kb.binalyze.ai/air/features/acquisition/supported-evidence/linux-collections-detail/raw-table.html
## Overview
**Evidence:** Raw Table
**Description:** Collect Raw table
**Category:** Network
**Platform:** linux
**Short Name:** rawtab
**Is Parsed:** Yes
**Sent to Investigation Hub:** Yes
**Collect File(s):** No
## Background
This collector gathers raw socket connection table information from the Linux system. This data is essential for understanding low-level network activity and detecting potentially suspicious raw socket usage.
## Data Collected
This collector gathers structured data about raw table.
## Collection Method
This collector parses /proc raw socket tables and records entries into the `raw_table` table.
## Forensic Value
This evidence is crucial for forensic investigations as it provides raw socket usage visibility. It helps investigators detect packet crafting tools, covert channels, and low-level networking anomalies.
---
# Secure
> Source: https://kb.binalyze.ai/air/features/acquisition/supported-evidence/linux-collections-detail/secure.html
## Overview
**Evidence:** Secure
**Description:** Collect Secure Logs
**Category:** System
**Platform:** linux
**Short Name:** secl
**Is Parsed:** No
**Sent to Investigation Hub:** No
**Collect File(s):** Yes
## Background
The secure log is the authentication and security log on Red Hat-based systems, equivalent to auth.log on Debian systems. It records authentication attempts, sudo usage, SSH connections, and security-related events.
## Data Collected
This collector gathers structured data about secure.
## Collection Method
This collector gathers secure log files from /var/log/secure*, including rotated archives, capturing all authentication and security events on RHEL-based distributions.
## Forensic Value
Secure logs are vital for investigating security breaches, failed login attempts, privilege escalation, SSH attacks, and unauthorized access on Red Hat systems. Essential for forensic analysis and security auditing.
---
# SELinux Configs
> Source: https://kb.binalyze.ai/air/features/acquisition/supported-evidence/linux-collections-detail/selinux-configs.html
## Overview
**Evidence:** SELinux Configs
**Description:** Collect SELinux configurations
**Category:** System
**Platform:** linux
**Short Name:** selinuxc
**Is Parsed:** Yes
**Sent to Investigation Hub:** Yes
**Collect File(s):** No
## Background
This collector gathers selinux configs information from the Linux system. This data is essential for understanding system activity, detecting security incidents, and investigating system-related events.
## Data Collected
This collector gathers structured data about selinux configs.
## Collection Method
This collector parses configuration files and records key-value pairs into the `selinux_configs` table.
## Forensic Value
This evidence is crucial for forensic investigations as it provides selinux configs information. It helps investigators understand system activity, detect security incidents, and investigate system-related events.
---
# SELinux Settings
> Source: https://kb.binalyze.ai/air/features/acquisition/supported-evidence/linux-collections-detail/selinux-settings.html
## Overview
**Evidence:** SELinux Settings
**Description:** Collect SELinux settings
**Category:** System
**Platform:** linux
**Short Name:** selinuxs
**Is Parsed:** Yes
**Sent to Investigation Hub:** Yes
**Collect File(s):** No
## Background
SELinux settings provide information about mandatory access control policies and security contexts. This data is essential for understanding system security policies and detecting security policy violations.
## Data Collected
This collector gathers structured data about selinux settings.
## Collection Method
This collector reads SELinux settings from `/etc/selinux/` and `/sys/fs/selinux/` and records them into the `selinux_settings` table.
## Forensic Value
This evidence is crucial for forensic investigations as it provides mandatory access control information. It helps investigators understand security policies, detect policy violations, and investigate access control attacks.
---
# Shadow
> Source: https://kb.binalyze.ai/air/features/acquisition/supported-evidence/linux-collections-detail/shadow.html
## Overview
**Evidence:** Shadow
**Description:** Collect shadow content
**Category:** Applications
**Platform:** linux
**Short Name:** shadow
**Is Parsed:** Yes
**Sent to Investigation Hub:** Yes
**Collect File(s):** No
## Background
Linux shadow file contains encrypted password information and account security settings. This data is essential for understanding password policies, detecting password-based attacks, and investigating authentication security incidents.
## Data Collected
This collector gathers structured data about shadow.
### Shadow Data
| Field | Description | Example |
|-------|-------------|---------|
| `Username` | Username | Example value |
| `Expire` | Expire | 123 |
| `Inactive` | Inactive | 123 |
| `LastChange` | Last Change | 123 |
| `Max` | Max | 123 |
| `Min` | Min | 123 |
| `PasswordStatus` | Password Status | Example value |
| `Warning` | Warning | 123 |
## Collection Method
This collector parses the necessary data from the `/etc/shadow` file and records data into the `shadow` table.
## Forensic Value
This evidence is crucial for forensic investigations as it provides password and authentication information. It helps investigators understand password policies, detect password-based attacks, and investigate authentication security incidents.
---
# Shared Memory
> Source: https://kb.binalyze.ai/air/features/acquisition/supported-evidence/linux-collections-detail/shared-memory.html
## Overview
**Evidence:** Shared Memory
**Description:** Collect shared memory
**Category:** Memory
**Platform:** linux
**Short Name:** sharedm
**Is Parsed:** Yes
**Sent to Investigation Hub:** Yes
**Collect File(s):** No
## Background
This collector gathers shared memory information from the Linux system. This data is essential for understanding system activity, detecting security incidents, and investigating system-related events.
## Data Collected
This collector gathers structured data about shared memory.
## Collection Method
This collector enumerates System V shared memory segments and records them into the `shared_memory` table.
## Forensic Value
This evidence is crucial for forensic investigations as it provides shared memory usage details that can indicate inter-process communication, potential covert channels, or malware persistence.
---
# Shell History
> Source: https://kb.binalyze.ai/air/features/acquisition/supported-evidence/linux-collections-detail/shell-history.html
## Overview
**Evidence:** Shell History
**Description:** Collect shell history
**Category:** System
**Platform:** linux
**Short Name:** shellhist
**Is Parsed:** Yes
**Sent to Investigation Hub:** Yes
**Collect File(s):** No
## Background
collect shell history on AIX (Advanced Interactive eXecutive) systems provides valuable forensic information for digital investigations. This data is essential for understanding system activity, detecting security incidents, and investigating system-related events. AIX systems provide unique insights into enterprise Unix environments and their security configurations.
## Data Collected
This collector gathers structured data about shell history.
### Shell History Data
| Field | Description | Example |
|-------|-------------|---------|
| `Command` | Command | Example value |
| `HistoryFile` | History File | Example value |
| `UserId` | User Id | 123 |
| `Timestamp` | Timestamp | 2023-10-15 14:30:25+03:00 |
## Collection Method
This collector parses the necessary data from system configuration files and data sources.
## Forensic Value
This evidence is crucial for forensic investigations as it provides information about shell history on AIX systems. It helps investigators understand system configuration, detect security incidents, and investigate system-related events. The data can reveal system activity, configuration details, and potential security vulnerabilities. Analysts can use this information to identify suspicious activities, trace system changes, and assess AIX system security posture.
---
# SSH Authorized Keys
> Source: https://kb.binalyze.ai/air/features/acquisition/supported-evidence/linux-collections-detail/ssh-authorized-keys.html
## Overview
**Evidence:** SSH Authorized Keys
**Description:** Collect SSH authorized keys
**Category:** Network
**Platform:** linux
**Short Name:** sshauth
**Is Parsed:** Yes
**Sent to Investigation Hub:** Yes
**Collect File(s):** No
## Background
SSH authorized keys contain public keys that are allowed to authenticate to user accounts without passwords. This data is essential for understanding SSH key-based authentication, detecting unauthorized access, and investigating SSH-related security incidents.
## Data Collected
This collector gathers structured data about ssh authorized keys.
## Collection Method
This collector parses the necessary data from SSH authorized keys files.
## Forensic Value
This evidence is crucial for forensic investigations as it provides information about SSH key-based authentication. It helps investigators understand SSH access patterns, detect unauthorized keys, and investigate SSH-related attacks. The data can reveal key-based access, authentication methods, and potential security vulnerabilities.
---
# SSH Configs
> Source: https://kb.binalyze.ai/air/features/acquisition/supported-evidence/linux-collections-detail/ssh-configs.html
## Overview
**Evidence:** SSH Configs
**Description:** Collect SSH configurations
**Category:** Network
**Platform:** linux
**Short Name:** sshconf
**Is Parsed:** Yes
**Sent to Investigation Hub:** Yes
**Collect File(s):** No
## Background
SSH configuration files contain client-side SSH settings that control connection behavior, authentication methods, and security policies. This data is essential for understanding SSH client configuration, detecting security misconfigurations, and investigating SSH-related security incidents.
## Data Collected
This collector gathers structured data about ssh configs.
## Collection Method
This collector parses the necessary data from SSH configuration files.
## Forensic Value
This evidence is crucial for forensic investigations as it provides information about SSH client configuration and connection settings. It helps investigators understand SSH connection patterns, detect security misconfigurations, and investigate SSH-related attacks. The data can reveal connection preferences, host-specific settings, and authentication methods.
---
# SSH Files
> Source: https://kb.binalyze.ai/air/features/acquisition/supported-evidence/linux-collections-detail/ssh-files.html
## Overview
**Evidence:** SSH Files
**Description:** Collect SSH files
**Category:** Network
**Platform:** linux
**Short Name:** sshf
**Is Parsed:** No
**Sent to Investigation Hub:** Yes
**Collect File(s):** Yes
## Background
SSH configuration and key material define how remote access is performed on Unix-like systems. System directories (e.g., /etc/ssh, /usr/local/etc/ssh) and per-user ~/.ssh hold configs, keys, and trust relationships (known_hosts). These artifacts are critical for understanding access, hardening state, and potential lateral movement paths.
## Data Collected
This collector gathers structured data about ssh files.
## Collection Method
This collector walks system SSH directories and each user's ~/.ssh directory, copying regular files into the case content and recording metadata such as ownership, file mode, and timestamps.
## Forensic Value
SSH files reveal authorized keys, host trust, cipher/policy settings, and possible backdoors. They help identify unauthorized access, weak configurations, persistence via keys, and relationships to other systems for lateral movement.
---
# SSH Known Hosts
> Source: https://kb.binalyze.ai/air/features/acquisition/supported-evidence/linux-collections-detail/ssh-known-hosts.html
## Overview
**Evidence:** SSH Known Hosts
**Description:** Collect SSH known hosts
**Category:** Network
**Platform:** linux
**Short Name:** sshknown
**Is Parsed:** Yes
**Sent to Investigation Hub:** Yes
**Collect File(s):** No
## Background
SSH known hosts files contain public keys of remote hosts that have been previously connected to, providing host verification and preventing man-in-the-middle attacks. This data is essential for understanding SSH connection history, detecting potential security breaches, and investigating SSH-related security incidents.
## Data Collected
This collector gathers structured data about ssh known hosts.
## Collection Method
This collector parses the necessary data from SSH known hosts files.
## Forensic Value
This evidence is crucial for forensic investigations as it provides information about SSH connection history and host trust relationships. It helps investigators understand network connections, detect potential security breaches, and investigate SSH-related attacks. The data can reveal connection patterns, host relationships, and potential security vulnerabilities.
---
# SSH Server Logs
> Source: https://kb.binalyze.ai/air/features/acquisition/supported-evidence/linux-collections-detail/ssh-server-logs.html
## Overview
**Evidence:** SSH Server Logs
**Description:** Collect SSH Server Logs
**Category:** Applications
**Platform:** linux
**Short Name:** sshl
**Is Parsed:** No
**Sent to Investigation Hub:** No
**Collect File(s):** Yes
## Background
SSH server logs on Linux record all SSH connection attempts, successful logins, authentication failures, and session activities. These logs are found in auth.log (Debian) or secure (Red Hat) and are critical for investigating remote access.
## Data Collected
This collector gathers structured data about ssh server logs.
## Collection Method
This collector gathers SSH-related logs from /var/log/auth*, which contains SSH daemon (sshd) authentication events and session information.
## Forensic Value
SSH logs are critical for investigating unauthorized remote access, brute force attacks, SSH key compromises, lateral movement, and attacker activities. They provide IP addresses, usernames, authentication methods, and session timing.
---
# SSHD Configs
> Source: https://kb.binalyze.ai/air/features/acquisition/supported-evidence/linux-collections-detail/sshd-configs.html
## Overview
**Evidence:** SSHD Configs
**Description:** Collect SSHD configurations
**Category:** Network
**Platform:** linux
**Short Name:** sshdconf
**Is Parsed:** Yes
**Sent to Investigation Hub:** Yes
**Collect File(s):** No
## Background
SSH daemon (sshd) configuration files contain settings that control SSH server behavior, security policies, and access controls. This data is essential for understanding SSH server configuration, detecting security misconfigurations, and investigating SSH-related security incidents.
## Data Collected
This collector gathers structured data about sshd configs.
### SSHD Configs Data
| Field | Description | Example |
|-------|-------------|---------|
| `Option` | Option | Example value |
| `Value` | Value | Example value |
## Collection Method
This collector parses the necessary data from SSH daemon configuration files.
## Forensic Value
This evidence is crucial for forensic investigations as it provides information about SSH server configuration and security settings. It helps investigators understand SSH access controls, detect security misconfigurations, and investigate SSH-related attacks. The data can reveal authentication methods, port configurations, user restrictions, and security policies.
---
# Sudoers
> Source: https://kb.binalyze.ai/air/features/acquisition/supported-evidence/linux-collections-detail/sudoers.html
## Overview
**Evidence:** Sudoers
**Description:** Collect sudoers
**Category:** Applications
**Platform:** linux
**Short Name:** sudoers
**Is Parsed:** Yes
**Sent to Investigation Hub:** Yes
**Collect File(s):** No
## Background
Linux sudoers configuration provides information about privilege escalation policies and administrative access controls. This data is essential for understanding privilege management and detecting unauthorized privilege escalation.
## Data Collected
This collector gathers structured data about sudoers.
### Sudoers Data
| Field | Description | Example |
|-------|-------------|---------|
| `Header` | Header | Example value |
| `RuleDetails` | Rule Details | Example value |
| `Source` | Source | Example value |
## Collection Method
This collector parses sudoers configuration files and records entries into the `sudoers` table.
## Forensic Value
This evidence is crucial for forensic investigations as it provides privilege escalation information. It helps investigators understand privilege policies, detect unauthorized privilege escalation, and investigate privilege-based attacks.
---
# SUID Binaries
> Source: https://kb.binalyze.ai/air/features/acquisition/supported-evidence/linux-collections-detail/suid-binaries.html
## Overview
**Evidence:** SUID Binaries
**Description:** Collect SUID binaries
**Category:** System
**Platform:** linux
**Short Name:** suidbins
**Is Parsed:** Yes
**Sent to Investigation Hub:** Yes
**Collect File(s):** No
## Background
collect suid binaries on AIX (Advanced Interactive eXecutive) systems provides valuable forensic information for digital investigations. This data is essential for understanding system activity, detecting security incidents, and investigating system-related events. AIX systems provide unique insights into enterprise Unix environments and their security configurations.
## Data Collected
This collector gathers structured data about suid binaries.
## Collection Method
This collector parses the necessary data from system configuration files and data sources.
## Forensic Value
This evidence is crucial for forensic investigations as it provides information about suid binaries on AIX systems. It helps investigators understand system configuration, detect security incidents, and investigate system-related events. The data can reveal system activity, configuration details, and potential security vulnerabilities. Analysts can use this information to identify suspicious activities, trace system changes, and assess AIX system security posture.
---
# Swaps
> Source: https://kb.binalyze.ai/air/features/acquisition/supported-evidence/linux-collections-detail/swaps.html
## Overview
**Evidence:** Swaps
**Description:** Collect swap info
**Category:** Memory
**Platform:** linux
**Short Name:** swaps
**Is Parsed:** Yes
**Sent to Investigation Hub:** Yes
**Collect File(s):** No
## Background
This collector gathers swaps information from the Linux system. This data is essential for understanding system activity, detecting security incidents, and investigating system-related events.
## Data Collected
This collector gathers structured data about swaps.
### Swaps Data
| Field | Description | Example |
|-------|-------------|---------|
| `FilePath` | File Path | Example value |
| `Priority` | Priority | 123 |
| `Size` | Size | 123 |
| `Type` | Type | Example value |
| `Used` | Used | 123 |
## Collection Method
This collector parses the necessary data from the `swaps` table.
## Forensic Value
This evidence is crucial for forensic investigations as it provides swaps information. It helps investigators understand system activity, detect security incidents, and investigate system-related events. The data can reveal system changes, unauthorized activities, and potential security vulnerabilities. Analysts can use this information to identify system compromises, trace malicious activities, and assess Linux security posture.
---
# Sysmon Logs
> Source: https://kb.binalyze.ai/air/features/acquisition/supported-evidence/linux-collections-detail/sysmon-logs.html
## Overview
**Evidence:** Sysmon Logs
**Description:** Collect Sysmon Logs.
**Category:** System
**Platform:** linux
**Short Name:** sysmon
**Is Parsed:** Yes
**Sent to Investigation Hub:** Yes
**Collect File(s):** No
## Background
Sysmon for Linux is a security monitoring tool that provides detailed information about system activity including process creation, network connections, and file system changes. It generates comprehensive logs that are essential for threat detection, incident response, and security analysis on Linux systems.
## Data Collected
This collector gathers structured data about sysmon logs.
### Sysmon Logs Data
| Field | Description | Example |
|-------|-------------|---------|
| `FilePath` | File Path | Example value |
| `Name` | Name | Example value |
| `Size` | Size | 123.45 |
| `SourcePath` | Source Path | Example value |
## Collection Method
This collector parses Sysmon logs from /var/log/syslog and extracts structured event data. It processes Sysmon-specific log entries and converts them into a structured format for analysis.
## Forensic Value
Sysmon logs are invaluable for forensic investigations as they provide detailed system activity timelines including process creation with hashes, network connections, file modifications, and other security-relevant events. This data helps investigators reconstruct attack sequences, identify malicious activities, track lateral movement, and understand the full scope of security incidents on Linux systems.
---
# System Artifacts
> Source: https://kb.binalyze.ai/air/features/acquisition/supported-evidence/linux-collections-detail/system-artifacts.html
## Overview
**Evidence:** System Artifacts
**Description:** Collect system artifacts (Files of collected evidence. For example: /etc/passwd file)
**Category:** System
**Platform:** linux
**Short Name:** sysartf
**Is Parsed:** Yes
**Sent to Investigation Hub:** Yes
**Collect File(s):** No
## Background
This collector gathers system artifacts information from the Linux system. This data is essential for understanding system activity, detecting security incidents, and investigating system-related events.
## Data Collected
This collector gathers structured data about system artifacts.
## Collection Method
This collector parses configured artifact sources and collects files, recording metadata into the `system_artifacts` table.
## Forensic Value
This evidence is crucial for forensic investigations as it provides system artifacts that reveal system changes, unauthorized activities, and potential security vulnerabilities.
---
# System Controls
> Source: https://kb.binalyze.ai/air/features/acquisition/supported-evidence/linux-collections-detail/system-controls.html
## Overview
**Evidence:** System Controls
**Description:** Collect system controls
**Category:** System
**Platform:** linux
**Short Name:** syscntrls
**Is Parsed:** Yes
**Sent to Investigation Hub:** Yes
**Collect File(s):** No
## Background
This collector gathers system controls (sysctl) information from the Linux system. This data is essential for understanding kernel and system tuning parameters and detecting unauthorized changes.
## Data Collected
This collector gathers structured data about system controls.
## Collection Method
This collector parses sysctl configuration files and current values, recording them into the `system_controls` table.
## Forensic Value
This evidence is crucial for forensic investigations as it reveals system tuning parameters and changes that might indicate persistence or hardening bypasses.
---
# System Logs
> Source: https://kb.binalyze.ai/air/features/acquisition/supported-evidence/linux-collections-detail/system-logs.html
## Overview
**Evidence:** System Logs
**Description:** Collect System Logs
**Category:** System
**Platform:** linux
**Short Name:** sysl
**Is Parsed:** No
**Sent to Investigation Hub:** No
**Collect File(s):** Yes
## Background
Linux syslog contains comprehensive system-wide logs including application messages, system events, and daemon activities. It's the primary logging facility on Debian-based systems (Ubuntu, Debian) and captures all non-kernel system messages.
## Data Collected
This collector gathers structured data about system logs.
## Collection Method
This collector gathers syslog files from /var/log/syslog*, including rotated logs, which contain timestamped system events and application messages.
## Forensic Value
Syslog is critical for investigating system events, application activities, service failures, and security incidents. It provides a comprehensive timeline of system operations essential for incident response and forensic analysis.
---
# Systemctl Services
> Source: https://kb.binalyze.ai/air/features/acquisition/supported-evidence/linux-collections-detail/systemctl-services.html
## Overview
**Evidence:** Systemctl Services
**Description:** Collect Systemctl Running Services
**Category:** System
**Platform:** linux
**Short Name:** sysctl
**Is Parsed:** Yes
**Sent to Investigation Hub:** Yes
**Collect File(s):** No
## Background
This collector gathers systemctl service information from the Linux system. This data is essential for understanding system service state, detecting unauthorized service changes, and investigating persistence or service-related security incidents.
## Data Collected
This collector gathers structured data about systemctl services.
## Collection Method
This collector runs systemctl queries and records results into the `systemctl_services` table.
## Forensic Value
This evidence is crucial for forensic investigations as it provides service status and configuration information. It helps investigators understand active/inactive services, detect unauthorized service modifications, and investigate persistence mechanisms.
---
# TCP Table
> Source: https://kb.binalyze.ai/air/features/acquisition/supported-evidence/linux-collections-detail/tcp-table.html
## Overview
**Evidence:** TCP Table
**Description:** Collect TCP table
**Category:** Network
**Platform:** linux
**Short Name:** tcptab
**Is Parsed:** Yes
**Sent to Investigation Hub:** Yes
**Collect File(s):** No
## Background
This collector gathers TCP connection table information from the Linux system. This data is essential for understanding network activity, detecting suspicious connections, and investigating network-based security incidents.
## Data Collected
This collector gathers structured data about tcp table.
## Collection Method
This collector parses the necessary data from the `tcp_table` table.
## Forensic Value
This evidence is crucial for forensic investigations as it provides TCP connection information. It helps investigators understand active and historical connections, detect suspicious endpoints, and investigate lateral movement. Analysts can use this information to identify compromised services, trace remote connections, and assess network security posture.
---
# UDP Table
> Source: https://kb.binalyze.ai/air/features/acquisition/supported-evidence/linux-collections-detail/udp-table.html
## Overview
**Evidence:** UDP Table
**Description:** Collect UDP table
**Category:** Network
**Platform:** linux
**Short Name:** udptab
**Is Parsed:** Yes
**Sent to Investigation Hub:** Yes
**Collect File(s):** No
## Background
This collector gathers UDP connection table information from the Linux system. This data is essential for understanding network activity, detecting suspicious connections, and investigating network-based security incidents.
## Data Collected
This collector gathers structured data about udp table.
## Collection Method
This collector parses the necessary data from the `udp_table` table.
## Forensic Value
This evidence is crucial for forensic investigations as it provides UDP connection information. It helps investigators understand active and historical connections, detect suspicious endpoints, and investigate potential data exfiltration. Analysts can use this information to identify compromised services, trace remote connections, and assess network security posture.
---
# UDPLite Table
> Source: https://kb.binalyze.ai/air/features/acquisition/supported-evidence/linux-collections-detail/udplite-table.html
## Overview
**Evidence:** UDPLite Table
**Description:** Collect UDPLite table
**Category:** Network
**Platform:** linux
**Short Name:** udplitetab
**Is Parsed:** Yes
**Sent to Investigation Hub:** Yes
**Collect File(s):** No
## Background
This collector gathers UDPLite connection table information from the Linux system. This data is essential for understanding network activity, detecting suspicious connections, and investigating network-based security incidents.
## Data Collected
This collector gathers structured data about udplite table.
## Collection Method
This collector parses the necessary data from the `udp_lite_table` table.
## Forensic Value
This evidence is crucial for forensic investigations as it provides UDPLite connection information. It helps investigators understand active and historical connections, detect suspicious endpoints, and investigate potential data exfiltration. Analysts can use this information to identify compromised services, trace remote connections, and assess network security posture.
---
# ULimit Information
> Source: https://kb.binalyze.ai/air/features/acquisition/supported-evidence/linux-collections-detail/ulimit-information.html
## Overview
**Evidence:** ULimit Information
**Description:** Collect ulimit information
**Category:** System
**Platform:** linux
**Short Name:** ulimit
**Is Parsed:** Yes
**Sent to Investigation Hub:** Yes
**Collect File(s):** No
## Background
collect ulimit information on AIX (Advanced Interactive eXecutive) systems provides valuable forensic information for digital investigations. This data is essential for understanding system activity, detecting security incidents, and investigating system-related events. AIX systems provide unique insights into enterprise Unix environments and their security configurations.
## Data Collected
This collector gathers structured data about ulimit information.
## Collection Method
This collector parses the necessary data from system configuration files and data sources.
## Forensic Value
This evidence is crucial for forensic investigations as it provides information about ulimit information on AIX systems. It helps investigators understand system configuration, detect security incidents, and investigate system-related events. The data can reveal system activity, configuration details, and potential security vulnerabilities. Analysts can use this information to identify suspicious activities, trace system changes, and assess AIX system security posture.
---
# Unix Sockets
> Source: https://kb.binalyze.ai/air/features/acquisition/supported-evidence/linux-collections-detail/unix-sockets.html
## Overview
**Evidence:** Unix Sockets
**Description:** Collect unix sockets
**Category:** Network
**Platform:** linux
**Short Name:** unixsoc
**Is Parsed:** Yes
**Sent to Investigation Hub:** Yes
**Collect File(s):** No
## Background
This collector gathers unix sockets information from the Linux system. This data is essential for understanding inter-process communication, detecting unauthorized socket usage, and investigating system-related security incidents.
## Data Collected
This collector gathers structured data about unix sockets.
## Collection Method
This collector parses the necessary data from the `unix_sockets` table.
## Forensic Value
This evidence is crucial for forensic investigations as it provides unix sockets information. It helps investigators understand IPC usage, detect suspicious services, and investigate process communications. Analysts can use this information to identify potential backdoors, trace service activity, and assess Linux security posture.
---
# User Groups
> Source: https://kb.binalyze.ai/air/features/acquisition/supported-evidence/linux-collections-detail/user-groups.html
## Overview
**Evidence:** User Groups
**Description:** Collect user group list
**Category:** System
**Platform:** linux
**Short Name:** groups
**Is Parsed:** Yes
**Sent to Investigation Hub:** Yes
**Collect File(s):** No
## Background
collect user groups on AIX (Advanced Interactive eXecutive) systems provides valuable forensic information for digital investigations. This data is essential for understanding system activity, detecting security incidents, and investigating system-related events. AIX systems provide unique insights into enterprise Unix environments and their security configurations.
## Data Collected
This collector gathers structured data about user groups.
## Collection Method
This collector parses the necessary data from system configuration files and data sources.
## Forensic Value
This evidence is crucial for forensic investigations as it provides information about user groups on AIX systems. It helps investigators understand system configuration, detect security incidents, and investigate system-related events. The data can reveal system activity, configuration details, and potential security vulnerabilities. Analysts can use this information to identify suspicious activities, trace system changes, and assess AIX system security posture.
---
# Users
> Source: https://kb.binalyze.ai/air/features/acquisition/supported-evidence/linux-collections-detail/users.html
## Overview
**Evidence:** Users
**Description:** Collect user list
**Category:** System
**Platform:** linux
**Short Name:** users
**Is Parsed:** Yes
**Sent to Investigation Hub:** Yes
**Collect File(s):** No
## Background
User information on AIX systems provides details about system users, their accounts, and access configurations. This data is essential for understanding system access, detecting unauthorized accounts, and investigating user-related security incidents. AIX user information includes user IDs, group memberships, home directories, and shell configurations.
## Data Collected
This collector gathers structured data about users.
## Collection Method
This collector parses the necessary data from the `/etc/passwd` file.
## Forensic Value
This evidence is crucial for forensic investigations as it provides information about system users and their configurations on AIX systems. It helps investigators understand user accounts, detect unauthorized access, and investigate user-related attacks. The data can reveal user privileges, group memberships, and access patterns. Analysts can use this information to identify suspicious accounts, trace user activities, and assess AIX system security posture.
---
# Vivaldi Bookmarks
> Source: https://kb.binalyze.ai/air/features/acquisition/supported-evidence/linux-collections-detail/vivaldi-bookmarks.html
## Overview
**Evidence:** Vivaldi Bookmarks
**Description:** Collect Vivaldi Bookmarks
**Category:** Applications
**Platform:** linux
**Short Name:** vbkmrks
**Is Parsed:** Yes
**Sent to Investigation Hub:** Yes
**Collect File(s):** No
## Background
Browser bookmarks represent user-saved favorite websites and organizational folders. This data reveals frequently accessed sites, user interests, and potential indicators of reconnaissance, phishing targets, or suspicious infrastructure.
## Data Collected
This collector gathers structured data about vivaldi bookmarks.
### Vivaldi Bookmarks Data
| Field | Description | Example |
|-------|-------------|---------|
| `UserName` | User Name | Example value |
| `ProfileName` | Profile Name | Example value |
| `BrowserName` | Browser Name | Example value |
| `GUID` | GUID | Example value |
| `BookmarkID` | Bookmark ID | Example value |
| `Name` | Name | Example value |
| `Type` | Type | Example value |
| `URL` | URL | Example value |
| `ParentFolder` | Parent Folder | Example value |
| `DateAdded` | Date Added | 2023-10-15 14:30:25+03:00 |
| `DateLastUsed` | Date Last Used | 2023-10-15 14:30:25+03:00 |
| `DateModified` | Date Modified | 2023-10-15 14:30:25+03:00 |
## Collection Method
This collector parses the browser's Bookmarks file to extract saved URLs, folder structures, timestamps, and metadata.
## Forensic Value
Bookmark analysis identifies targeted websites, phishing pages, command-and-control servers, internal resources, and organizational reconnaissance patterns. Investigators can detect social engineering campaigns, credential harvesting attempts, and lateral movement preparation.
---
# Vivaldi Browsing History
> Source: https://kb.binalyze.ai/air/features/acquisition/supported-evidence/linux-collections-detail/vivaldi-browsing-history.html
## Overview
**Evidence:** Vivaldi Browsing History
**Description:** Collect visited URLs from Vivaldi
**Category:** Applications
**Platform:** linux
**Short Name:** vhst
**Is Parsed:** Yes
**Sent to Investigation Hub:** Yes
**Collect File(s):** No
## Background
Browser history records all websites visited by users, including URLs, page titles, visit timestamps, visit counts, and transition types. This data is essential for reconstructing user activity, identifying malicious websites, and tracking lateral movement or reconnaissance activities.
## Data Collected
This collector gathers structured data about vivaldi browsing history.
### Vivaldi Browsing History Data
| Field | Description | Example |
|-------|-------------|---------|
| `AccessTime` | Access Time | 2023-10-15 14:30:25+03:00 |
| `AccessCount` | Access Count | 123 |
| `URL` | URL | Example value |
| `Browser` | Browser | Example value |
| `Title` | Title | Example value |
| `VisitDuration` | Visit Duration | Example value |
| `Referrer` | Referrer | Example value |
| `TypedCount` | Typed Count | 123 |
| `IsHidden` | Is Hidden | true |
| `TransitionType` | Transition Type | Example value |
| `VisitID` | Visit ID | 123 |
| `TransitionQualifiers` | Transition Qualifiers | Example value |
| `User` | User | Example value |
| `Profile` | Profile | Example value |
| `HistoryFilePath` | History File Path | Example value |
## Collection Method
This collector queries the browser's History database to extract visited URLs, timestamps, referrer information, and user interaction patterns.
## Forensic Value
Browsing history reveals phishing sites, malicious domains, command-and-control servers, data exfiltration targets, and reconnaissance activities. Analysts can identify compromised credentials, track attacker infrastructure, and correlate web activity with other security events to establish attack timelines.
---
# Vivaldi Cookies
> Source: https://kb.binalyze.ai/air/features/acquisition/supported-evidence/linux-collections-detail/vivaldi-cookies.html
## Overview
**Evidence:** Vivaldi Cookies
**Description:** Collect Vivaldi Cookies
**Category:** Applications
**Platform:** linux
**Short Name:** vcookies
**Is Parsed:** Yes
**Sent to Investigation Hub:** Yes
**Collect File(s):** No
## Background
Browser cookies store session tokens, authentication credentials, user preferences, and tracking data. This data is essential for understanding authenticated sessions, tracking user activity across websites, and identifying session hijacking or credential theft.
## Data Collected
This collector gathers structured data about vivaldi cookies.
### Vivaldi Cookies Data
| Field | Description | Example |
|-------|-------------|---------|
| `UserName` | User Name | Example value |
| `BrowserName` | Browser Name | Example value |
| `ProfileName` | Profile Name | Example value |
| `Domain` | Domain | Example value |
| `Name` | Name | Example value |
| `Path` | Path | Example value |
| `Value` | Value | Example value |
| `IsSecure` | Is Secure | 123 |
| `IsHTTPOnly` | Is HTTP Only | 123 |
| `HasExpires` | Has Expires | 123 |
| `IsPersistent` | Is Persistent | 123 |
| `Priority` | Priority | 123 |
| `SameSite` | Same Site | 123 |
| `SourcePort` | Source Port | 123 |
| `SourceScheme` | Source Scheme | 123 |
| `CreationTime` | Creation Time | 2023-10-15 14:30:25+03:00 |
| `ExpiresTime` | Expires Time | 2023-10-15 14:30:25+03:00 |
| `LastAccessTime` | Last Access Time | 2023-10-15 14:30:25+03:00 |
## Collection Method
This collector extracts cookies from the browser's Cookies database, including domain, name, value, path, expiration, and security flags.
## Forensic Value
Cookie analysis reveals active sessions, authentication tokens, persistent tracking identifiers, and potential session hijacking. Investigators can identify stolen credentials, unauthorized access, and cross-site tracking used for reconnaissance or targeting.
---
# Vivaldi Downloads
> Source: https://kb.binalyze.ai/air/features/acquisition/supported-evidence/linux-collections-detail/vivaldi-downloads.html
## Overview
**Evidence:** Vivaldi Downloads
**Description:** Collect Vivaldi Downloads
**Category:** Applications
**Platform:** linux
**Short Name:** vdwnlds
**Is Parsed:** Yes
**Sent to Investigation Hub:** Yes
**Collect File(s):** No
## Background
Browser download history records files downloaded by users, including file paths, timestamps, URLs, referrer information, and download status. This data is essential for tracking file acquisition, identifying potentially malicious downloads, and reconstructing user activity timelines.
## Data Collected
This collector gathers structured data about vivaldi downloads.
### Vivaldi Downloads Data
| Field | Description | Example |
|-------|-------------|---------|
| `UserName` | User Name | Example value |
| `Browser` | Browser | Example value |
| `ProfileName` | Profile Name | Example value |
| `URL` | URL | Example value |
| `TargetPath` | Target Path | Example value |
| `CurrentPath` | Current Path | Example value |
| `Referrer` | Referrer | Example value |
| `LastModified` | Last Modified | 2023-10-15 14:30:25+03:00 |
| `DangerType` | Danger Type | 123 |
| `Opened` | Opened | 123 |
| `TabURL` | Tab URL | Example value |
| `TabReferrerURL` | Tab Referrer URL | Example value |
| `StartTime` | Start Time | 2023-10-15 14:30:25+03:00 |
| `EndTime` | End Time | 2023-10-15 14:30:25+03:00 |
| `HistoryFilePath` | History File Path | Example value |
## Collection Method
This collector queries the browser's History database to extract download records, including file paths, download times, source URLs, and security flags.
## Forensic Value
Download history reveals malware delivery vectors, data exfiltration attempts, unauthorized software installation, and user interaction with suspicious websites. Analysts can identify downloaded malicious files, track attack chains, and correlate downloads with other security events.
---
# Vivaldi Favicons
> Source: https://kb.binalyze.ai/air/features/acquisition/supported-evidence/linux-collections-detail/vivaldi-favicons.html
## Overview
**Evidence:** Vivaldi Favicons
**Description:** Collect Vivaldi Favicons
**Category:** Applications
**Platform:** linux
**Short Name:** vfico
**Is Parsed:** Yes
**Sent to Investigation Hub:** Yes
**Collect File(s):** No
## Background
Browser favicons are cached website icons that provide visual history of visited sites. This data supplements browsing history by revealing sites accessed even if history was deleted.
## Data Collected
This collector gathers structured data about vivaldi favicons.
### Vivaldi Favicons Data
| Field | Description | Example |
|-------|-------------|---------|
| `ID` | ID | 123 |
| `UserName` | User Name | Example value |
| `BrowserName` | Browser Name | Example value |
| `Profile` | Profile | Example value |
| `URL` | URL | Example value |
| `IconType` | Icon Type | 123 |
| `Path` | Path | Example value |
## Collection Method
This collector queries the browser's Favicons database to extract cached website icons and associated URLs.
## Forensic Value
Favicon analysis can recover evidence of deleted browsing history, identify visited sites through icon fingerprinting, and correlate with other browser artifacts to establish comprehensive activity timelines.
---
# Vivaldi Form History
> Source: https://kb.binalyze.ai/air/features/acquisition/supported-evidence/linux-collections-detail/vivaldi-form-history.html
## Overview
**Evidence:** Vivaldi Form History
**Description:** Collect Vivaldi Form History
**Category:** Applications
**Platform:** linux
**Short Name:** vfh
**Is Parsed:** Yes
**Sent to Investigation Hub:** Yes
**Collect File(s):** No
## Background
Browser form history stores previously entered form data including search queries, usernames, and other input fields. This data reveals user search patterns, account information, and potential data leakage through autofill.
## Data Collected
This collector gathers structured data about vivaldi form history.
### Vivaldi Form History Data
| Field | Description | Example |
|-------|-------------|---------|
| `UserName` | User Name | Example value |
| `BrowserName` | Browser Name | Example value |
| `Name` | Name | Example value |
| `Value` | Value | Example value |
| `ValueLower` | Value Lower | Example value |
| `Count` | Count | 123 |
| `Profile` | Profile | Example value |
| `Path` | Path | Example value |
| `DateCreated` | Date Created | 2023-10-15 14:30:25+03:00 |
| `DateLastUsed` | Date Last Used | 2023-10-15 14:30:25+03:00 |
## Collection Method
This collector queries the browser's form history database to extract saved form field data, search queries, and associated timestamps.
## Forensic Value
Form history exposes reconnaissance activities, credential enumeration attempts, search queries revealing attacker intent, and potentially sensitive information entered into web forms. Analysts can identify data exfiltration, account compromise indicators, and targeted search patterns.
---
# Vivaldi Local Storage
> Source: https://kb.binalyze.ai/air/features/acquisition/supported-evidence/linux-collections-detail/vivaldi-local-storage.html
## Overview
**Evidence:** Vivaldi Local Storage
**Description:** Collect Vivaldi Local Storage
**Category:** Applications
**Platform:** linux
**Short Name:** vls
**Is Parsed:** Yes
**Sent to Investigation Hub:** Yes
**Collect File(s):** No
## Background
Browser local storage contains persistent key-value data stored by websites. This data includes user preferences, session state, cached data, and potentially authentication tokens or sensitive information.
## Data Collected
This collector gathers structured data about vivaldi local storage.
### Vivaldi Local Storage Data
| Field | Description | Example |
|-------|-------------|---------|
| `UserName` | User Name | Example value |
| `ProfileName` | Profile Name | Example value |
| `BrowserName` | Browser Name | Example value |
| `Key` | Key | Example value |
| `Value` | Value | Example value |
| `Path` | Path | Example value |
## Collection Method
This collector extracts local storage data from browser storage databases and files.
## Forensic Value
Local storage analysis reveals stored credentials, session tokens, tracking identifiers, and application state that can indicate compromised accounts, persistent tracking, or malicious website activity. Analysts can identify credential theft, session hijacking, and data exfiltration attempts.
---
# Vivaldi Login Data
> Source: https://kb.binalyze.ai/air/features/acquisition/supported-evidence/linux-collections-detail/vivaldi-login-data.html
## Overview
**Evidence:** Vivaldi Login Data
**Description:** Collect Vivaldi Login Data
**Category:** Applications
**Platform:** linux
**Short Name:** vlgd
**Is Parsed:** Yes
**Sent to Investigation Hub:** Yes
**Collect File(s):** No
## Background
Browser login data stores saved passwords and credential information. This data is critical for identifying stored credentials, password reuse patterns, and potential credential theft targets.
## Data Collected
This collector gathers structured data about vivaldi login data.
### Vivaldi Login Data Data
| Field | Description | Example |
|-------|-------------|---------|
| `ID` | ID | 123 |
| `UserName` | User Name | Example value |
| `BrowserName` | Browser Name | Example value |
| `OriginURL` | Origin URL | Example value |
| `SignonRealm` | Signon Realm | Example value |
| `BlacklistedByUser` | Blacklisted By User | 123 |
| `Scheme` | Scheme | Example value |
| `PasswordType` | Password Type | Example value |
| `TimesUsed` | Times Used | 123 |
| `Profile` | Profile | Example value |
| `Path` | Path | Example value |
| `DateCreated` | Date Created | 2023-10-15 14:30:25+03:00 |
| `DateLastUsed` | Date Last Used | 2023-10-15 14:30:25+03:00 |
## Collection Method
This collector extracts saved credentials from the browser's Login Data database, including URLs, usernames, and encrypted passwords.
## Forensic Value
Login data analysis reveals stored credentials, password reuse across services, targeted accounts, and potential credential harvesting. Investigators can identify compromised accounts, credential theft attempts, and unauthorized access to saved credentials by malware or attackers.
---
# Vivaldi Sessions
> Source: https://kb.binalyze.ai/air/features/acquisition/supported-evidence/linux-collections-detail/vivaldi-sessions.html
## Overview
**Evidence:** Vivaldi Sessions
**Description:** Collect Vivaldi Sessions
**Category:** Applications
**Platform:** linux
**Short Name:** vvss
**Is Parsed:** Yes
**Sent to Investigation Hub:** Yes
**Collect File(s):** No
## Background
Browser sessions maintain active tab state, cookies, and authentication context. This data reveals currently active user sessions, open websites, and authenticated connections at the time of collection.
## Data Collected
This collector gathers structured data about vivaldi sessions.
### Vivaldi Sessions Data
| Field | Description | Example |
|-------|-------------|---------|
| `ID` | ID | 123 |
| `WindowID` | Window ID | 123 |
| `Active` | Active | true |
| `Url` | Url | Example value |
| `Title` | Title | Example value |
| `Deleted` | Deleted | true |
| `Group` | Group | Example value |
| `History` | History | [] |
| `BrowserName` | Browser Name | Example value |
## Collection Method
This collector captures browser session data including active tabs, session cookies, and authentication state.
## Forensic Value
Session analysis identifies active compromises, authenticated sessions to malicious sites, concurrent suspicious activities, and real-time indicators of ongoing attacks. Analysts can detect active C2 connections, authenticated malware communications, and live attacker sessions.
---
# Vivaldi Thumbnails
> Source: https://kb.binalyze.ai/air/features/acquisition/supported-evidence/linux-collections-detail/vivaldi-thumbnails.html
## Overview
**Evidence:** Vivaldi Thumbnails
**Description:** Collect Vivaldi Thumbnails
**Category:** Applications
**Platform:** linux
**Short Name:** vthmb
**Is Parsed:** Yes
**Sent to Investigation Hub:** Yes
**Collect File(s):** No
## Background
Browser thumbnails are cached preview images of visited websites. This visual data supplements browsing history by providing screenshots of accessed pages, useful for recovering deleted history and identifying visited content.
## Data Collected
This collector gathers structured data about vivaldi thumbnails.
### Vivaldi Thumbnails Data
| Field | Description | Example |
|-------|-------------|---------|
| `UserName` | User Name | Example value |
| `Browser` | Browser | Example value |
| `URL` | URL | Example value |
| `URLRank` | URL Rank | 123 |
| `Title` | Title | Example value |
| `Profile` | Profile | Example value |
| `Path` | Path | Example value |
## Collection Method
This collector extracts cached thumbnail images from browser storage.
## Forensic Value
Thumbnail analysis provides visual evidence of visited websites, can recover evidence after history deletion, and helps identify phishing pages, malicious sites, or sensitive internal resources accessed by users through visual inspection.
---
# Vivaldi User Profiles
> Source: https://kb.binalyze.ai/air/features/acquisition/supported-evidence/linux-collections-detail/vivaldi-user-profiles.html
## Overview
**Evidence:** Vivaldi User Profiles
**Description:** Collect Vivaldi User Profiles
**Category:** Applications
**Platform:** linux
**Short Name:** vprfls
**Is Parsed:** Yes
**Sent to Investigation Hub:** Yes
**Collect File(s):** No
## Background
Browser user profiles store per-user browser configurations, extensions, settings, and data segregation. This data reveals multiple user accounts, profile switching patterns, and user-specific browsing behavior.
## Data Collected
This collector gathers structured data about vivaldi user profiles.
### Vivaldi User Profiles Data
| Field | Description | Example |
|-------|-------------|---------|
| `EndpointUserName` | Endpoint User Name | Example value |
| `Profile` | Profile | Example value |
| `ProfileUserName` | Profile User Name | Example value |
| `BrowserName` | Browser Name | Example value |
| `BackgroundApps` | Background Apps | true |
| `GoogleAccountGivenName` | Google Account Given Name | Example value |
| `GoogleAccountID` | Google Account ID | Example value |
| `GoogleAccountName` | Google Account Name | Example value |
| `PictureFileName` | Picture File Name | Example value |
| `LastDownloadedPictureURL` | Last Downloaded Picture URL | Example value |
| `HostedDomain` | Hosted Domain | Example value |
| `IsConsentedPrimaryAccount` | Is Consented Primary Account | true |
| `IsEphemeral` | Is Ephemeral | true |
## Collection Method
This collector enumerates browser user profiles and extracts profile metadata, configurations, and associated data paths.
## Forensic Value
Profile analysis identifies multiple user accounts, profile-specific extensions and configurations, shared device usage patterns, and potential privilege escalation or lateral movement using different browser profiles. Investigators can correlate activity across profiles and identify unauthorized profile creation.
---
# Vivaldi Web Storage
> Source: https://kb.binalyze.ai/air/features/acquisition/supported-evidence/linux-collections-detail/vivaldi-web-storage.html
## Overview
**Evidence:** Vivaldi Web Storage
**Description:** Collect Vivaldi Web Storage
**Category:** Applications
**Platform:** linux
**Short Name:** vws
**Is Parsed:** Yes
**Sent to Investigation Hub:** Yes
**Collect File(s):** No
## Background
Browser web storage includes both local and session storage used by websites to store client-side data. This data can contain application state, user preferences, cached content, and potentially sensitive information.
## Data Collected
This collector gathers structured data about vivaldi web storage.
### Vivaldi Web Storage Data
| Field | Description | Example |
|-------|-------------|---------|
| `UserName` | User Name | Example value |
| `ProfileName` | Profile Name | Example value |
| `BrowserName` | Browser Name | Example value |
| `Key` | Key | Example value |
| `Value` | Value | Example value |
| `Path` | Path | Example value |
## Collection Method
This collector extracts web storage data from browser storage locations including local storage and session storage.
## Forensic Value
Web storage analysis reveals cached application data, stored credentials, session information, and potential data exfiltration staging. Analysts can identify malicious website activity, stored authentication tokens, tracking identifiers, and sensitive data cached by compromised web applications.
---
# YUM History
> Source: https://kb.binalyze.ai/air/features/acquisition/supported-evidence/linux-collections-detail/yum-history.html
## Overview
**Evidence:** YUM History
**Description:** Collect YUM history
**Category:** System
**Platform:** linux
**Short Name:** yumhist
**Is Parsed:** Yes
**Sent to Investigation Hub:** Yes
**Collect File(s):** No
## Background
collect yum history on AIX (Advanced Interactive eXecutive) systems provides valuable forensic information for digital investigations. This data is essential for understanding system activity, detecting security incidents, and investigating system-related events. AIX systems provide unique insights into enterprise Unix environments and their security configurations.
## Data Collected
This collector gathers structured data about yum history.
## Collection Method
This collector parses the necessary data from system configuration files and data sources.
## Forensic Value
This evidence is crucial for forensic investigations as it provides information about yum history on AIX systems. It helps investigators understand system configuration, detect security incidents, and investigate system-related events. The data can reveal system activity, configuration details, and potential security vulnerabilities. Analysts can use this information to identify suspicious activities, trace system changes, and assess AIX system security posture.
---
# YUM Sources
> Source: https://kb.binalyze.ai/air/features/acquisition/supported-evidence/linux-collections-detail/yum-sources.html
## Overview
**Evidence:** YUM Sources
**Description:** Collect YUM sources
**Category:** System
**Platform:** linux
**Short Name:** yumsrcs
**Is Parsed:** Yes
**Sent to Investigation Hub:** Yes
**Collect File(s):** No
## Background
collect yum sources on AIX (Advanced Interactive eXecutive) systems provides valuable forensic information for digital investigations. This data is essential for understanding system activity, detecting security incidents, and investigating system-related events. AIX systems provide unique insights into enterprise Unix environments and their security configurations.
## Data Collected
This collector gathers structured data about yum sources.
## Collection Method
This collector parses the necessary data from system configuration files and data sources.
## Forensic Value
This evidence is crucial for forensic investigations as it provides information about yum sources on AIX systems. It helps investigators understand system configuration, detect security incidents, and investigate system-related events. The data can reveal system activity, configuration details, and potential security vulnerabilities. Analysts can use this information to identify suspicious activities, trace system changes, and assess AIX system security posture.
---
# AIX Collections
> Source: https://kb.binalyze.ai/air/features/acquisition/supported-evidence/ibm-aix-collections.html
## **AIX Evidence List**
---
# AnyDesk Logs
> Source: https://kb.binalyze.ai/air/features/acquisition/supported-evidence/ibm-aix-collections-detail/anydesk-logs.html
## Overview
**Evidence:** AnyDesk Logs
**Description:** Collect AnyDesk Logs
**Category:** Applications
**Platform:** aix
**Short Name:** adsl
**Is Parsed:** No
**Sent to Investigation Hub:** Yes
**Collect File(s):** Yes
## Background
AnyDesk is a remote desktop application that maintains trace logs of connections, sessions, file transfers, and user activities. Logs are stored in both user-specific directories and system-wide locations, including custom deployment prefixes.
## Data Collected
This collector gathers structured data about anydesk logs.
## Collection Method
This collector gathers AnyDesk trace files from user home directories (.anydesk folders with optional custom prefixes), system logs in /var/log, and Application Support directories.
## Forensic Value
AnyDesk logs are critical for investigating unauthorized remote access, data exfiltration, lateral movement, and insider threats. They reveal connection times, remote IP addresses, file transfers, and session activities often used in ransomware and data theft incidents.
---
# Apache Logs
> Source: https://kb.binalyze.ai/air/features/acquisition/supported-evidence/ibm-aix-collections-detail/apache-logs.html
## Overview
**Evidence:** Apache Logs
**Description:** Collect Apache Logs
**Category:** Applications
**Platform:** aix
**Short Name:** apcl
**Is Parsed:** No
**Sent to Investigation Hub:** Yes
**Collect File(s):** Yes
## Background
Apache HTTP Server logs on macOS record web server access, errors, and activities. These logs are found in various locations depending on installation method (system, Homebrew Intel, Homebrew Apple Silicon).
## Data Collected
This collector gathers structured data about apache logs.
## Collection Method
This collector gathers Apache/httpd logs from multiple possible locations including system directories (/var/log/apache2), Homebrew installations (/usr/local, /opt/homebrew), and user-specific Homebrew logs.
## Forensic Value
Apache logs are critical for investigating web application attacks, unauthorized access attempts, data exfiltration, web shell activities, and understanding web server compromise. Access logs reveal attacker IP addresses, request patterns, and attack vectors.
---
# Auth Logs
> Source: https://kb.binalyze.ai/air/features/acquisition/supported-evidence/ibm-aix-collections-detail/auth-logs.html
## Overview
**Evidence:** Auth Logs
**Description:** Collect Auth Logs
**Category:** System
**Platform:** aix
**Short Name:** authl
**Is Parsed:** No
**Sent to Investigation Hub:** No
**Collect File(s):** Yes
## Background
AIX audit logs are stored in the /audit directory and record security-relevant events including authentication attempts, privilege escalation, file access, and system configuration changes. AIX uses its own audit subsystem distinct from other Unix systems.
## Data Collected
This collector gathers structured data about auth logs.
## Collection Method
This collector gathers AIX audit files from /audit/*, which contains security audit trails including authentication, authorization, and access control events.
## Forensic Value
AIX audit logs are essential for investigating unauthorized access, privilege escalation, security policy violations, and compliance auditing. They provide detailed security event tracking critical for forensic investigations on AIX systems.
## Notes
Artifact collector for AIX. Locations: /audit/*
---
# Boot Logs
> Source: https://kb.binalyze.ai/air/features/acquisition/supported-evidence/ibm-aix-collections-detail/boot-logs.html
## Overview
**Evidence:** Boot Logs
**Description:** Collect Boot Logs
**Category:** System
**Platform:** aix
**Short Name:** bootl
**Is Parsed:** No
**Sent to Investigation Hub:** No
**Collect File(s):** Yes
## Background
AIX boot logs are stored in /var/adm/ras/bootlog and contain boot sequence information, initialization messages, and startup errors. The wtmp file tracks user login history and system reboots, providing important timeline information.
## Data Collected
This collector gathers structured data about boot logs.
## Collection Method
This collector gathers AIX boot logs from /var/adm/ras/bootlog* and wtmp files from /var/adm/wtmp*, capturing system boot history and user login tracking.
## Forensic Value
AIX boot logs are valuable for investigating system startup anomalies, persistence mechanisms, boot-time malware, and establishing system reboot timelines. They help understand system initialization and identify unauthorized system modifications.
## Notes
Artifact collector for AIX. Locations: /var/adm/ras/bootlog*, /var/adm/wtmp*
---
# Cron Jobs
> Source: https://kb.binalyze.ai/air/features/acquisition/supported-evidence/ibm-aix-collections-detail/cron-jobs.html
## Overview
**Evidence:** Cron Jobs
**Description:** Collect cron jobs
**Category:** System
**Platform:** aix
**Short Name:** cronj
**Is Parsed:** Yes
**Sent to Investigation Hub:** Yes
**Collect File(s):** No
## Background
Cron jobs on AIX systems are scheduled tasks that run automatically at specified times or intervals. This data is essential for understanding system automation, detecting unauthorized scheduled tasks, and investigating time-based security incidents. Cron jobs provide evidence of automated processes, maintenance tasks, and potential persistence mechanisms used by attackers.
## Data Collected
This collector gathers structured data about cron jobs.
### Cron Jobs Data
| Field | Description | Example |
|-------|-------------|---------|
| `Minute` | Minute | Example value |
| `Hour` | Hour | Example value |
| `DayOfMonth` | Day Of Month | Example value |
| `Month` | Month | Example value |
| `DayOfWeek` | Day Of Week | Example value |
| `Command` | Command | Example value |
| `Path` | Path | Example value |
| `Event` | Event | Example value |
## Collection Method
This collector parses the necessary data from cron configuration files.
## Forensic Value
This evidence is crucial for forensic investigations as it provides information about scheduled tasks and automated processes on AIX systems. It helps investigators understand system automation, detect unauthorized scheduled tasks, and investigate time-based attacks. The data can reveal maintenance schedules, automated processes, and potential persistence mechanisms. Analysts can use this information to identify suspicious scheduled tasks, trace automated activities, and assess AIX system security posture.
---
# DHCP Server Logs
> Source: https://kb.binalyze.ai/air/features/acquisition/supported-evidence/ibm-aix-collections-detail/dhcp-server-logs.html
## Overview
**Evidence:** DHCP Server Logs
**Description:** Collect DHCP Server Logs
**Category:** Applications
**Platform:** aix
**Short Name:** dhcpl
**Is Parsed:** No
**Sent to Investigation Hub:** No
**Collect File(s):** Yes
## Background
DHCP client daemon logs on AIX are stored in /usr/tmp/dhcpcd.log. These logs record DHCP client activities including IP address assignments, lease renewals, and DHCP server communications on AIX systems.
## Data Collected
This collector gathers structured data about dhcp server logs.
## Collection Method
This collector gathers DHCP client daemon logs from /usr/tmp/dhcpcd.log, which contains AIX DHCP client operational logs and network configuration activities.
## Forensic Value
DHCP logs on AIX help track network configuration changes, IP address assignments, and network connectivity timeline. They're useful for investigating network-based attacks and establishing system network presence on AIX systems.
## Notes
Artifact collector for AIX. Locations: /usr/tmp/dhcpcd.log
---
# Discord Desktop Cache
> Source: https://kb.binalyze.ai/air/features/acquisition/supported-evidence/ibm-aix-collections-detail/discord-desktop-cache.html
## Overview
**Evidence:** Discord Desktop Cache
**Description:** Collect Discord Desktop Cache
**Category:** Applications
**Platform:** aix
**Short Name:** dscrd
**Is Parsed:** No
**Sent to Investigation Hub:** Yes
**Collect File(s):** Yes
## Background
Discord is a communication platform with desktop applications that cache messages, media, and other content locally. The cache contains recent communications, shared files, and user interactions stored in the Application Support directory.
## Data Collected
This collector gathers structured data about discord desktop cache.
## Collection Method
This collector gathers Discord desktop cache data from user-specific Library/Application Support/discord directories, which contains cached messages, images, and communication content.
## Forensic Value
Discord cache is valuable for investigating communications, file sharing, malware distribution through Discord, data leaks, and coordinated attacks. It can reveal conversations, shared malicious files, command and control communications, and threat actor coordination.
---
# DNS Resolvers
> Source: https://kb.binalyze.ai/air/features/acquisition/supported-evidence/ibm-aix-collections-detail/dns-resolvers.html
## Overview
**Evidence:** DNS Resolvers
**Description:** Collect DNS resolvers
**Category:** Network
**Platform:** aix
**Short Name:** dnsr
**Is Parsed:** Yes
**Sent to Investigation Hub:** Yes
**Collect File(s):** No
## Background
DNS resolvers on AIX (Advanced Interactive eXecutive) systems provide configuration information about how the system resolves domain names to IP addresses. This data is essential for understanding network configuration, detecting DNS-related security incidents, and investigating network connectivity issues. DNS resolver configuration affects how applications and services resolve hostnames on AIX systems.
## Data Collected
This collector gathers structured data about dns resolvers.
### DNS Resolvers Data
| Field | Description | Example |
|-------|-------------|---------|
| `Type` | Type | Example value |
| `Address` | Address | Example value |
| `Netmask` | Netmask | Example value |
| `OptionsStr` | Options Str | Example value |
## Collection Method
This collector parses the necessary data from DNS configuration files.
## Forensic Value
This evidence is crucial for forensic investigations as it provides information about DNS configuration and network resolution settings on AIX systems. It helps investigators understand network configuration, detect DNS-related attacks, and investigate network connectivity issues. The data can reveal DNS server configurations, search domains, and resolution options. Analysts can use this information to identify DNS misconfigurations, trace network resolution patterns, and assess AIX system network security posture.
---
# Docker Logs
> Source: https://kb.binalyze.ai/air/features/acquisition/supported-evidence/ibm-aix-collections-detail/docker-logs.html
## Overview
**Evidence:** Docker Logs
**Description:** Collect Docker Logs on Filesystem
**Category:** Applications
**Platform:** aix
**Short Name:** dckl
**Is Parsed:** No
**Sent to Investigation Hub:** Yes
**Collect File(s):** Yes
## Background
Docker Desktop for Mac stores logs for both the VM and host components within user Library containers. These logs capture Docker daemon activities, container operations, networking events, and system interactions.
## Data Collected
This collector gathers structured data about docker logs.
## Collection Method
This collector gathers Docker logs from user-specific Library/Containers directories, including both VM logs (Linux VM running containers) and host logs (Docker Desktop application on macOS).
## Forensic Value
Docker logs are valuable for investigating containerized application activities, suspicious container deployments, privilege escalation attempts, network communications, and understanding container-based attacks or data exfiltration.
---
# File System Enumeration
> Source: https://kb.binalyze.ai/air/features/acquisition/supported-evidence/ibm-aix-collections-detail/file-system-enumeration.html
## Overview
**Evidence:** File System Enumeration
**Description:** Dump file and folder information.
**Category:** DiskFilesystem
**Platform:** aix
**Short Name:** fsenum
**Is Parsed:** Yes
**Sent to Investigation Hub:** Yes
**Collect File(s):** No
## Background
File system enumeration provides comprehensive information about files, directories, and file system structure on Unix-like systems. This data is essential for understanding file system state and detecting unauthorized file modifications.
## Data Collected
This collector gathers structured data about file system enumeration.
### File System Enumeration Data
| Field | Description | Example |
|-------|-------------|---------|
| `GroupId` | Group Id | 123 |
| `UserId` | User Id | 123 |
| `Mode` | Mode | 123 |
| `Dev` | Dev | 123 |
| `Nlink` | Nlink | 123 |
| `Size` | Size | 123 |
| `Ino` | Ino | 123 |
| `Path` | Path | Example value |
| `LastChangeTime` | Last Change Time | 2023-10-15 14:30:25+03:00 |
| `AccessTime` | Access Time | 2023-10-15 14:30:25+03:00 |
| `ModificationTime` | Modification Time | 2023-10-15 14:30:25+03:00 |
## Collection Method
This collector enumerates the file system and records metadata to the `file_system_enumeration` table.
## Forensic Value
This evidence is crucial for forensic investigations as it provides file system information. It helps investigators understand file system state, detect unauthorized file modifications, and investigate file-based attacks. The data can reveal file changes, directory structures, and potential file system vulnerabilities.
---
# Homebrew Logs
> Source: https://kb.binalyze.ai/air/features/acquisition/supported-evidence/ibm-aix-collections-detail/homebrew-logs.html
## Overview
**Evidence:** Homebrew Logs
**Description:** Collect Homebrew Logs
**Category:** Applications
**Platform:** aix
**Short Name:** hmbwl
**Is Parsed:** No
**Sent to Investigation Hub:** Yes
**Collect File(s):** Yes
## Background
Homebrew is a popular package manager for macOS that logs all package installations, updates, and operations. These logs track what software was installed via Homebrew, when, and any errors encountered during package management.
## Data Collected
This collector gathers structured data about homebrew logs.
## Collection Method
This collector gathers all Homebrew log files from user-specific Library/Logs/Homebrew directories, which contain detailed package management activity including installations, updates, and configurations.
## Forensic Value
Homebrew logs are essential for tracking software installations, identifying unauthorized tool deployments, understanding attacker tool setup, and investigating system modifications. They reveal what hacking tools, utilities, or malicious packages were installed.
---
# Hosts
> Source: https://kb.binalyze.ai/air/features/acquisition/supported-evidence/ibm-aix-collections-detail/hosts.html
## Overview
**Evidence:** Hosts
**Description:** Collect hosts
**Category:** Network
**Platform:** aix
**Short Name:** hosts
**Is Parsed:** Yes
**Sent to Investigation Hub:** Yes
**Collect File(s):** No
## Background
collect hosts file on AIX (Advanced Interactive eXecutive) systems provides valuable forensic information for digital investigations. This data is essential for understanding system activity, detecting security incidents, and investigating system-related events. AIX systems provide unique insights into enterprise Unix environments and their security configurations.
## Data Collected
This collector gathers structured data about hosts.
### Hosts Data
| Field | Description | Example |
|-------|-------------|---------|
| `Address` | Address | Example value |
| `HostNames` | Host Names | Example value |
## Collection Method
This collector parses the necessary data from system configuration files and data sources.
## Forensic Value
This evidence is crucial for forensic investigations as it provides information about hosts on AIX systems. It helps investigators understand system configuration, detect security incidents, and investigate system-related events. The data can reveal system activity, configuration details, and potential security vulnerabilities. Analysts can use this information to identify suspicious activities, trace system changes, and assess AIX system security posture.
---
# Install Logs
> Source: https://kb.binalyze.ai/air/features/acquisition/supported-evidence/ibm-aix-collections-detail/install-logs.html
## Overview
**Evidence:** Install Logs
**Description:** Collect Install Logs
**Category:** System
**Platform:** aix
**Short Name:** instl
**Is Parsed:** No
**Sent to Investigation Hub:** Yes
**Collect File(s):** Yes
## Background
macOS install logs record software installation activities including package installations, updates, and application deployments. These logs track what software was installed, when, and by whom.
## Data Collected
This collector gathers structured data about install logs.
## Collection Method
This collector gathers installation log files from /var/log/install*, which contains records of all software installations and updates performed on the system.
## Forensic Value
Install logs are valuable for tracking unauthorized software installations, understanding system configuration changes, identifying malicious software deployment, and establishing timelines of system modifications.
---
# KnowledgeC
> Source: https://kb.binalyze.ai/air/features/acquisition/supported-evidence/ibm-aix-collections-detail/knowledgec.html
## Overview
**Evidence:** KnowledgeC
**Description:** Collect KnowledgeC Database
**Category:** System
**Platform:** aix
**Short Name:** kcdb
**Is Parsed:** No
**Sent to Investigation Hub:** Yes
**Collect File(s):** Yes
## Background
KnowledgeC is a macOS database that stores user activity data including application usage, device connections, media playback, location data, and system events. It's part of Apple's CoreDuet framework used for Siri suggestions and system intelligence.
## Data Collected
This collector gathers structured data about knowledgec.
## Collection Method
This collector gathers the KnowledgeC database and related files from each user's Library/Application Support/Knowledge directory, which contains comprehensive user activity tracking data.
## Forensic Value
KnowledgeC is extremely valuable for forensic investigations, providing detailed user activity timelines, application usage patterns, device connections, location history, and user behavior analysis. It's one of the richest data sources on macOS for understanding user actions.
---
# Log Files
> Source: https://kb.binalyze.ai/air/features/acquisition/supported-evidence/ibm-aix-collections-detail/log-files.html
## Overview
**Evidence:** Log Files
**Description:** Collect log files under /var/log/
**Category:** System
**Platform:** aix
**Short Name:** logs
**Is Parsed:** Yes
**Sent to Investigation Hub:** Yes
**Collect File(s):** No
## Background
Linux log files provide comprehensive records of system events, application activities, and security events. This data is essential for understanding system behavior, detecting security incidents, and reconstructing timelines of events.
## Data Collected
This collector gathers structured data about log files.
## Collection Method
This collector parses the necessary data from the `log_files` table.
## Forensic Value
This evidence is crucial for forensic investigations as it provides comprehensive system activity records. It helps investigators detect system-level attacks, analyze security events, and reconstruct system incidents. The data can reveal system errors, security events, and unauthorized system modifications. Analysts can use this information to identify system compromises, trace malicious activities, and assess Linux security posture.
---
# Mail Logs
> Source: https://kb.binalyze.ai/air/features/acquisition/supported-evidence/ibm-aix-collections-detail/mail-logs.html
## Overview
**Evidence:** Mail Logs
**Description:** Collect Mail Logs
**Category:** System
**Platform:** aix
**Short Name:** maill
**Is Parsed:** No
**Sent to Investigation Hub:** No
**Collect File(s):** Yes
## Background
AIX mail logs are stored in /var/spool (note: not /var/spoon) and contain email delivery logs, mail queue information, and SMTP transaction records from mail transfer agents running on AIX systems.
## Data Collected
This collector gathers structured data about mail logs.
## Collection Method
This collector gathers AIX mail logs and queue files from /var/spool/mail and /var/spool/mqueue directories, capturing email delivery and queue management information.
## Forensic Value
AIX mail logs are important for investigating email-based attacks, spam campaigns, data exfiltration via email, and mail server abuse. They provide evidence of email communications and delivery attempts on AIX mail servers.
## Notes
Artifact collector for AIX. Locations: /var/spoon/mail/*, /var/spoon/mqueue/*
---
# MongoDB Logs
> Source: https://kb.binalyze.ai/air/features/acquisition/supported-evidence/ibm-aix-collections-detail/mongodb-logs.html
## Overview
**Evidence:** MongoDB Logs
**Description:** Collect MongoDB Logs
**Category:** Applications
**Platform:** aix
**Short Name:** mngl
**Is Parsed:** No
**Sent to Investigation Hub:** Yes
**Collect File(s):** Yes
## Background
MongoDB database logs on macOS record database operations, queries, connections, authentication attempts, and errors. These logs vary by installation method including system, Homebrew Intel, and Homebrew Apple Silicon installations.
## Data Collected
This collector gathers structured data about mongodb logs.
## Collection Method
This collector gathers MongoDB logs from multiple installation locations including system directories and various Homebrew installation paths for both Intel and Apple Silicon Macs.
## Forensic Value
MongoDB logs are valuable for investigating database breaches, unauthorized data access, injection attacks, authentication failures, and data exfiltration. They reveal query patterns, connection sources, and database compromise indicators.
---
# Mounts
> Source: https://kb.binalyze.ai/air/features/acquisition/supported-evidence/ibm-aix-collections-detail/mounts.html
## Overview
**Evidence:** Mounts
**Description:** Collect mounts
**Category:** DiskFilesystem
**Platform:** aix
**Short Name:** mounts
**Is Parsed:** Yes
**Sent to Investigation Hub:** Yes
**Collect File(s):** No
## Background
Mount information on AIX systems provides details about mounted file systems, storage devices, and network shares. This data is essential for understanding system storage configuration, detecting unauthorized mounts, and investigating storage-related security incidents. Mount information includes file system types, mount points, device information, and access permissions.
## Data Collected
This collector gathers structured data about mounts.
## Collection Method
This collector parses the necessary data from system mount information.
## Forensic Value
This evidence is crucial for forensic investigations as it provides information about mounted file systems and storage configuration on AIX systems. It helps investigators understand storage layout, detect unauthorized mounts, and investigate storage-related attacks. The data can reveal file system types, mount points, device information, and access patterns. Analysts can use this information to identify suspicious mounts, trace storage access, and assess AIX system security posture.
---
# MySQL Logs
> Source: https://kb.binalyze.ai/air/features/acquisition/supported-evidence/ibm-aix-collections-detail/mysql-logs.html
## Overview
**Evidence:** MySQL Logs
**Description:** Collect MySQL Logs
**Category:** Applications
**Platform:** aix
**Short Name:** myl
**Is Parsed:** No
**Sent to Investigation Hub:** No
**Collect File(s):** Yes
## Background
MySQL database server logs on macOS capture database queries, errors, slow queries, authentication events, and server operations. Log locations vary based on installation method (system, Homebrew Intel, Homebrew Apple Silicon).
## Data Collected
This collector gathers structured data about mysql logs.
## Collection Method
This collector gathers MySQL logs from system directories and Homebrew installations, covering both Intel-based and Apple Silicon architectures, including user-specific Homebrew log directories.
## Forensic Value
MySQL logs are critical for investigating SQL injection attacks, unauthorized database access, data breaches, privilege escalation, and understanding database compromise. They provide query history, authentication attempts, and error patterns.
---
# NGINX Logs
> Source: https://kb.binalyze.ai/air/features/acquisition/supported-evidence/ibm-aix-collections-detail/nginx-logs.html
## Overview
**Evidence:** NGINX Logs
**Description:** Collect NGINX Logs
**Category:** Applications
**Platform:** aix
**Short Name:** ngxl
**Is Parsed:** No
**Sent to Investigation Hub:** Yes
**Collect File(s):** Yes
## Background
NGINX web server logs on macOS capture HTTP requests, errors, and server activities. Like Apache, NGINX can be installed via system packages or Homebrew, resulting in multiple possible log locations.
## Data Collected
This collector gathers structured data about nginx logs.
## Collection Method
This collector gathers NGINX logs from system directories, Intel-based Homebrew installations, Apple Silicon Homebrew installations, and user-specific Homebrew log directories.
## Forensic Value
NGINX logs provide evidence of web attacks, API abuse, DDoS attempts, authentication failures, and suspicious request patterns. They're essential for investigating web-based compromises and analyzing attacker behavior.
---
# Parallels Logs
> Source: https://kb.binalyze.ai/air/features/acquisition/supported-evidence/ibm-aix-collections-detail/parallels-logs.html
## Overview
**Evidence:** Parallels Logs
**Description:** Collect Parallels Logs
**Category:** Applications
**Platform:** aix
**Short Name:** prllgs
**Is Parsed:** No
**Sent to Investigation Hub:** Yes
**Collect File(s):** Yes
## Background
Parallels Desktop is a virtualization solution for macOS that runs Windows and other operating systems. It maintains logs of VM operations, errors, crashes, and problem reports in both user-specific and system-wide locations.
## Data Collected
This collector gathers structured data about parallels logs.
## Collection Method
This collector gathers Parallels logs from user Library directories (parallels.log and Problem Reports) and system-wide Library logs, capturing VM activities and diagnostic information.
## Forensic Value
Parallels logs are valuable for investigating VM-based attacks, malware analysis environments, data exfiltration through VMs, and understanding virtualized system activities. They reveal VM usage patterns, guest OS activities, and potential abuse of virtualization for evasion.
---
# PostgreSQL Logs
> Source: https://kb.binalyze.ai/air/features/acquisition/supported-evidence/ibm-aix-collections-detail/postgresql-logs.html
## Overview
**Evidence:** PostgreSQL Logs
**Description:** Collect PostgreSQL Logs
**Category:** Applications
**Platform:** aix
**Short Name:** pgrl
**Is Parsed:** No
**Sent to Investigation Hub:** Yes
**Collect File(s):** Yes
## Background
PostgreSQL database logs on macOS record database operations, queries, connections, authentication, and errors. Multiple PostgreSQL versions can coexist, and installation methods include system packages and Homebrew for different architectures.
## Data Collected
This collector gathers structured data about postgresql logs.
## Collection Method
This collector gathers PostgreSQL logs from system and Homebrew installations, supporting multiple PostgreSQL versions (postgresql, postgresql@14, etc.) across Intel and Apple Silicon architectures.
## Forensic Value
PostgreSQL logs are essential for investigating database attacks, SQL injection, unauthorized access, data exfiltration, and privilege escalation. They provide detailed query logs, connection information, and authentication history.
---
# Processes
> Source: https://kb.binalyze.ai/air/features/acquisition/supported-evidence/ibm-aix-collections-detail/processes.html
## Overview
**Evidence:** Processes
**Description:** Collect process list
**Category:** System
**Platform:** aix
**Short Name:** process
**Is Parsed:** Yes
**Sent to Investigation Hub:** Yes
**Collect File(s):** No
## Background
Process information on AIX systems provides detailed records of running processes, their attributes, and system resource usage. This data is essential for understanding system activity, detecting malicious processes, and investigating process-related security incidents. AIX process information includes process IDs, command lines, resource usage, and execution context.
## Data Collected
This collector gathers structured data about processes.
### Processes Data
| Field | Description | Example |
|-------|-------------|---------|
| `CWD` | CWD | Example value |
| `ChildrenMajorFaults` | Children Major Faults | 123 |
| `ChildrenMinorFaults` | Children Minor Faults | 123 |
| `Command` | Command | Example value |
| `CommandLine` | Command Line | Example value |
| `EffectiveGroupId` | Effective Group Id | 123 |
| `EffectiveUserId` | Effective User Id | 123 |
| `EffectiveUserName` | Effective User Name | Example value |
| `Environment` | Environment | Example value |
| `Executable` | Executable | Example value |
| `IsExecutableExists` | Is Executable Exists | true |
| `Hash` | Hash | Example value |
| `FileDescriptors` | File Descriptors | Example value |
| `Flags` | Flags | 123 |
| `GroupId` | Group Id | 123 |
| `MajorFaults` | Major Faults | 123 |
| `Maps` | Maps | [] |
| `MinorFaults` | Minor Faults | 123 |
| `Nice` | Nice | 123 |
| `ParentId` | Parent Id | 123 |
| `Priority` | Priority | 123 |
| `ProcessId` | Process Id | 123 |
| `RealGroupId` | Real Group Id | 123 |
| `RealUserId` | Real User Id | 123 |
| `ResidentSize` | Resident Size | 123 |
| `SavedGroupId` | Saved Group Id | 123 |
| `SavedUserId` | Saved User Id | 123 |
| `SessionId` | Session Id | 123 |
| `State` | State | Example value |
| `Threads` | Threads | 123 |
| `TpgId` | Tpg Id | 123 |
| `TtyNr` | Tty Nr | 123 |
| `RealUserName` | Real User Name | Example value |
| `SavedUserName` | Saved User Name | Example value |
| `VMSize` | VM Size | 123 |
| `CSTime` | CS Time | 123 |
| `CUTime` | CU Time | 123 |
| `SystemTime` | System Time | 123 |
| `StartTime` | Start Time | 123 |
| `StartDateTime` | Start Date Time | 2023-10-15 14:30:25+03:00 |
| `UserTime` | User Time | 123 |
## Collection Method
This collector parses the necessary data from system process information and file system.
## Forensic Value
This evidence is crucial for forensic investigations as it provides comprehensive process information for AIX systems. It helps investigators understand system activity, detect malicious processes, and investigate process-related attacks. The data can reveal running applications, resource usage patterns, and execution context. Analysts can use this information to identify suspicious processes, trace process relationships, and assess AIX system security posture.
---
# Shell History
> Source: https://kb.binalyze.ai/air/features/acquisition/supported-evidence/ibm-aix-collections-detail/shell-history.html
## Overview
**Evidence:** Shell History
**Description:** Collect shell history
**Category:** System
**Platform:** aix
**Short Name:** shellhist
**Is Parsed:** Yes
**Sent to Investigation Hub:** Yes
**Collect File(s):** No
## Background
collect shell history on AIX (Advanced Interactive eXecutive) systems provides valuable forensic information for digital investigations. This data is essential for understanding system activity, detecting security incidents, and investigating system-related events. AIX systems provide unique insights into enterprise Unix environments and their security configurations.
## Data Collected
This collector gathers structured data about shell history.
### Shell History Data
| Field | Description | Example |
|-------|-------------|---------|
| `Command` | Command | Example value |
| `HistoryFile` | History File | Example value |
| `UserId` | User Id | 123 |
| `Timestamp` | Timestamp | 2023-10-15 14:30:25+03:00 |
## Collection Method
This collector parses the necessary data from system configuration files and data sources.
## Forensic Value
This evidence is crucial for forensic investigations as it provides information about shell history on AIX systems. It helps investigators understand system configuration, detect security incidents, and investigate system-related events. The data can reveal system activity, configuration details, and potential security vulnerabilities. Analysts can use this information to identify suspicious activities, trace system changes, and assess AIX system security posture.
---
# Sophos Events Database
> Source: https://kb.binalyze.ai/air/features/acquisition/supported-evidence/ibm-aix-collections-detail/sophos-events-database.html
## Overview
**Evidence:** Sophos Events Database
**Description:** Collect Sophos Events Database
**Category:** Applications
**Platform:** aix
**Short Name:** sedb
**Is Parsed:** No
**Sent to Investigation Hub:** Yes
**Collect File(s):** Yes
## Background
Sophos Anti-Virus for Mac maintains an events database (events.db) that stores all security events, threat detections, scan results, and quarantine activities. This SQLite database contains comprehensive security event history.
## Data Collected
This collector gathers structured data about sophos events database.
## Collection Method
This collector gathers the Sophos events.db database file from the system-wide Library/Sophos Anti-Virus directory, which contains structured security event data.
## Forensic Value
The Sophos events database is critical for investigating malware detections, understanding threat timelines, identifying quarantined files, and analyzing security incidents on macOS. It provides detailed, queryable security event history.
---
# Sophos Logs
> Source: https://kb.binalyze.ai/air/features/acquisition/supported-evidence/ibm-aix-collections-detail/sophos-logs.html
## Overview
**Evidence:** Sophos Logs
**Description:** Collect Sophos Logs
**Category:** Applications
**Platform:** aix
**Short Name:** splgs
**Is Parsed:** No
**Sent to Investigation Hub:** Yes
**Collect File(s):** Yes
## Background
Sophos maintains multiple log files on macOS including the main Anti-Virus log, updater log, and LiveQuery osquery logs. These logs capture real-time protection events, update activities, and endpoint detection query results.
## Data Collected
This collector gathers structured data about sophos logs.
## Collection Method
This collector gathers Sophos log files from system-wide Library/Logs directories, including the main antivirus log, update logs, and LiveQuery/osquery logs for endpoint detection and response.
## Forensic Value
Sophos logs provide comprehensive security visibility including virus detections, update status, EDR queries, and system protection events. The LiveQuery logs reveal endpoint detection activities and security monitoring queries executed on the system.
---
# Splashtop Mac Logs
> Source: https://kb.binalyze.ai/air/features/acquisition/supported-evidence/ibm-aix-collections-detail/splashtop-mac-logs.html
## Overview
**Evidence:** Splashtop Mac Logs
**Description:** Collect Splashtop Mac Application Logs
**Category:** Applications
**Platform:** aix
**Short Name:** splttmclg
**Is Parsed:** No
**Sent to Investigation Hub:** Yes
**Collect File(s):** Yes
## Background
Splashtop is a remote desktop solution widely used in business environments. It stores logs in shared directories including streamer logs, business logs (often compressed as ZIP files), and user-specific Library logs.
## Data Collected
This collector gathers structured data about splashtop mac logs.
## Collection Method
This collector gathers Splashtop logs from Users/Shared locations (SplashtopStreamer text files and Splashtop Business archives) and user-specific Library/Logs directories.
## Forensic Value
Splashtop logs are valuable for investigating remote access sessions, unauthorized connections, data transfers, and potential abuse of remote management tools. They help establish timelines of remote access activities often exploited in security incidents.
---
# SSH Authorized Keys
> Source: https://kb.binalyze.ai/air/features/acquisition/supported-evidence/ibm-aix-collections-detail/ssh-authorized-keys.html
## Overview
**Evidence:** SSH Authorized Keys
**Description:** Collect SSH authorized keys
**Category:** Network
**Platform:** aix
**Short Name:** sshauth
**Is Parsed:** Yes
**Sent to Investigation Hub:** Yes
**Collect File(s):** No
## Background
SSH authorized keys contain public keys that are allowed to authenticate to user accounts without passwords. This data is essential for understanding SSH key-based authentication, detecting unauthorized access, and investigating SSH-related security incidents.
## Data Collected
This collector gathers structured data about ssh authorized keys.
## Collection Method
This collector parses the necessary data from SSH authorized keys files.
## Forensic Value
This evidence is crucial for forensic investigations as it provides information about SSH key-based authentication. It helps investigators understand SSH access patterns, detect unauthorized keys, and investigate SSH-related attacks. The data can reveal key-based access, authentication methods, and potential security vulnerabilities.
---
# SSH Configs
> Source: https://kb.binalyze.ai/air/features/acquisition/supported-evidence/ibm-aix-collections-detail/ssh-configs.html
## Overview
**Evidence:** SSH Configs
**Description:** Collect SSH configurations
**Category:** Network
**Platform:** aix
**Short Name:** sshconf
**Is Parsed:** Yes
**Sent to Investigation Hub:** Yes
**Collect File(s):** No
## Background
SSH configuration files contain client-side SSH settings that control connection behavior, authentication methods, and security policies. This data is essential for understanding SSH client configuration, detecting security misconfigurations, and investigating SSH-related security incidents.
## Data Collected
This collector gathers structured data about ssh configs.
## Collection Method
This collector parses the necessary data from SSH configuration files.
## Forensic Value
This evidence is crucial for forensic investigations as it provides information about SSH client configuration and connection settings. It helps investigators understand SSH connection patterns, detect security misconfigurations, and investigate SSH-related attacks. The data can reveal connection preferences, host-specific settings, and authentication methods.
---
# SSH Known Hosts
> Source: https://kb.binalyze.ai/air/features/acquisition/supported-evidence/ibm-aix-collections-detail/ssh-known-hosts.html
## Overview
**Evidence:** SSH Known Hosts
**Description:** Collect SSH known hosts
**Category:** Network
**Platform:** aix
**Short Name:** sshknown
**Is Parsed:** Yes
**Sent to Investigation Hub:** Yes
**Collect File(s):** No
## Background
SSH known hosts files contain public keys of remote hosts that have been previously connected to, providing host verification and preventing man-in-the-middle attacks. This data is essential for understanding SSH connection history, detecting potential security breaches, and investigating SSH-related security incidents.
## Data Collected
This collector gathers structured data about ssh known hosts.
## Collection Method
This collector parses the necessary data from SSH known hosts files.
## Forensic Value
This evidence is crucial for forensic investigations as it provides information about SSH connection history and host trust relationships. It helps investigators understand network connections, detect potential security breaches, and investigate SSH-related attacks. The data can reveal connection patterns, host relationships, and potential security vulnerabilities.
---
# SSH Server Logs
> Source: https://kb.binalyze.ai/air/features/acquisition/supported-evidence/ibm-aix-collections-detail/ssh-server-logs.html
## Overview
**Evidence:** SSH Server Logs
**Description:** Collect SSH Server Logs
**Category:** Applications
**Platform:** aix
**Short Name:** sshl
**Is Parsed:** No
**Sent to Investigation Hub:** No
**Collect File(s):** Yes
## Background
SSH server logs on AIX are recorded through the AIX audit subsystem in /audit. These logs capture SSH connection attempts, authentication events, successful logins, and session activities specific to AIX's OpenSSH implementation.
## Data Collected
This collector gathers structured data about ssh server logs.
## Collection Method
This collector gathers SSH-related audit logs from /audit/*, which contains AIX audit records including SSH daemon authentication and session events.
## Forensic Value
SSH logs on AIX are essential for investigating unauthorized remote access, brute force attacks, SSH key compromises, and lateral movement on AIX systems. They provide IP addresses, usernames, and authentication methods critical for security investigations.
## Notes
Artifact collector for AIX. Locations: /audit/*
---
# SSHD Configs
> Source: https://kb.binalyze.ai/air/features/acquisition/supported-evidence/ibm-aix-collections-detail/sshd-configs.html
## Overview
**Evidence:** SSHD Configs
**Description:** Collect SSHD configurations
**Category:** Network
**Platform:** aix
**Short Name:** sshdconf
**Is Parsed:** Yes
**Sent to Investigation Hub:** Yes
**Collect File(s):** No
## Background
SSH daemon (sshd) configuration files contain settings that control SSH server behavior, security policies, and access controls. This data is essential for understanding SSH server configuration, detecting security misconfigurations, and investigating SSH-related security incidents.
## Data Collected
This collector gathers structured data about sshd configs.
### SSHD Configs Data
| Field | Description | Example |
|-------|-------------|---------|
| `Option` | Option | Example value |
| `Value` | Value | Example value |
## Collection Method
This collector parses the necessary data from SSH daemon configuration files.
## Forensic Value
This evidence is crucial for forensic investigations as it provides information about SSH server configuration and security settings. It helps investigators understand SSH access controls, detect security misconfigurations, and investigate SSH-related attacks. The data can reveal authentication methods, port configurations, user restrictions, and security policies.
---
# SUID Binaries
> Source: https://kb.binalyze.ai/air/features/acquisition/supported-evidence/ibm-aix-collections-detail/suid-binaries.html
## Overview
**Evidence:** SUID Binaries
**Description:** Collect SUID binaries
**Category:** System
**Platform:** aix
**Short Name:** suidbins
**Is Parsed:** Yes
**Sent to Investigation Hub:** Yes
**Collect File(s):** No
## Background
collect suid binaries on AIX (Advanced Interactive eXecutive) systems provides valuable forensic information for digital investigations. This data is essential for understanding system activity, detecting security incidents, and investigating system-related events. AIX systems provide unique insights into enterprise Unix environments and their security configurations.
## Data Collected
This collector gathers structured data about suid binaries.
## Collection Method
This collector parses the necessary data from system configuration files and data sources.
## Forensic Value
This evidence is crucial for forensic investigations as it provides information about suid binaries on AIX systems. It helps investigators understand system configuration, detect security incidents, and investigate system-related events. The data can reveal system activity, configuration details, and potential security vulnerabilities. Analysts can use this information to identify suspicious activities, trace system changes, and assess AIX system security posture.
---
# System Artifacts
> Source: https://kb.binalyze.ai/air/features/acquisition/supported-evidence/ibm-aix-collections-detail/system-artifacts.html
## Overview
**Evidence:** System Artifacts
**Description:** Collect system artifacts (Files of collected evidence. For example: /etc/passwd file)
**Category:** System
**Platform:** aix
**Short Name:** sysartf
**Is Parsed:** Yes
**Sent to Investigation Hub:** Yes
**Collect File(s):** No
## Background
This collector gathers system artifacts information from the Linux system. This data is essential for understanding system activity, detecting security incidents, and investigating system-related events.
## Data Collected
This collector gathers structured data about system artifacts.
## Collection Method
This collector parses configured artifact sources and collects files, recording metadata into the `system_artifacts` table.
## Forensic Value
This evidence is crucial for forensic investigations as it provides system artifacts that reveal system changes, unauthorized activities, and potential security vulnerabilities.
---
# System Logs
> Source: https://kb.binalyze.ai/air/features/acquisition/supported-evidence/ibm-aix-collections-detail/system-logs.html
## Overview
**Evidence:** System Logs
**Description:** Collect System Logs
**Category:** Applications
**Platform:** aix
**Short Name:** sysl
**Is Parsed:** No
**Sent to Investigation Hub:** No
**Collect File(s):** Yes
## Background
macOS system logs contain critical system events, kernel messages, daemon activities, and system-level diagnostics. These logs are stored in /var/log and provide comprehensive system operation details.
## Data Collected
This collector gathers structured data about system logs.
## Collection Method
This collector gathers system log files from /var/log/system*, which includes system.log and related system event logs containing kernel and system daemon messages.
## Forensic Value
System logs are essential for investigating system-level events, boot activities, kernel panics, daemon operations, and system-wide errors. They provide critical timeline information for incident response and system behavior analysis.
---
# Teamviewer Logs
> Source: https://kb.binalyze.ai/air/features/acquisition/supported-evidence/ibm-aix-collections-detail/teamviewer-logs.html
## Overview
**Evidence:** Teamviewer Logs
**Description:** Collect Teamviewer Logs
**Category:** Applications
**Platform:** aix
**Short Name:** tvwl
**Is Parsed:** No
**Sent to Investigation Hub:** Yes
**Collect File(s):** Yes
## Background
TeamViewer is a popular remote access and support tool that maintains detailed logs of connections, network activities, and session information. It stores separate logs for general activities and network-specific events.
## Data Collected
This collector gathers structured data about teamviewer logs.
## Collection Method
This collector gathers TeamViewer log files from user Library directories, including both the main logfile and network-specific logfile that track all remote access sessions and connections.
## Forensic Value
TeamViewer logs are essential for investigating unauthorized remote access, social engineering attacks, data theft, and ransomware deployment. They provide connection IDs, partner IDs, session times, and activities that are frequently involved in security incidents.
---
# ULimit Information
> Source: https://kb.binalyze.ai/air/features/acquisition/supported-evidence/ibm-aix-collections-detail/ulimit-information.html
## Overview
**Evidence:** ULimit Information
**Description:** Collect ulimit information
**Category:** System
**Platform:** aix
**Short Name:** ulimit
**Is Parsed:** Yes
**Sent to Investigation Hub:** Yes
**Collect File(s):** No
## Background
collect ulimit information on AIX (Advanced Interactive eXecutive) systems provides valuable forensic information for digital investigations. This data is essential for understanding system activity, detecting security incidents, and investigating system-related events. AIX systems provide unique insights into enterprise Unix environments and their security configurations.
## Data Collected
This collector gathers structured data about ulimit information.
## Collection Method
This collector parses the necessary data from system configuration files and data sources.
## Forensic Value
This evidence is crucial for forensic investigations as it provides information about ulimit information on AIX systems. It helps investigators understand system configuration, detect security incidents, and investigate system-related events. The data can reveal system activity, configuration details, and potential security vulnerabilities. Analysts can use this information to identify suspicious activities, trace system changes, and assess AIX system security posture.
---
# User Groups
> Source: https://kb.binalyze.ai/air/features/acquisition/supported-evidence/ibm-aix-collections-detail/user-groups.html
## Overview
**Evidence:** User Groups
**Description:** Collect user group list
**Category:** System
**Platform:** aix
**Short Name:** groups
**Is Parsed:** Yes
**Sent to Investigation Hub:** Yes
**Collect File(s):** No
## Background
collect user groups on AIX (Advanced Interactive eXecutive) systems provides valuable forensic information for digital investigations. This data is essential for understanding system activity, detecting security incidents, and investigating system-related events. AIX systems provide unique insights into enterprise Unix environments and their security configurations.
## Data Collected
This collector gathers structured data about user groups.
## Collection Method
This collector parses the necessary data from system configuration files and data sources.
## Forensic Value
This evidence is crucial for forensic investigations as it provides information about user groups on AIX systems. It helps investigators understand system configuration, detect security incidents, and investigate system-related events. The data can reveal system activity, configuration details, and potential security vulnerabilities. Analysts can use this information to identify suspicious activities, trace system changes, and assess AIX system security posture.
---
# Users
> Source: https://kb.binalyze.ai/air/features/acquisition/supported-evidence/ibm-aix-collections-detail/users.html
## Overview
**Evidence:** Users
**Description:** Collect user list
**Category:** System
**Platform:** aix
**Short Name:** users
**Is Parsed:** Yes
**Sent to Investigation Hub:** Yes
**Collect File(s):** No
## Background
User information on AIX systems provides details about system users, their accounts, and access configurations. This data is essential for understanding system access, detecting unauthorized accounts, and investigating user-related security incidents. AIX user information includes user IDs, group memberships, home directories, and shell configurations.
## Data Collected
This collector gathers structured data about users.
## Collection Method
This collector parses the necessary data from the `/etc/passwd` file.
## Forensic Value
This evidence is crucial for forensic investigations as it provides information about system users and their configurations on AIX systems. It helps investigators understand user accounts, detect unauthorized access, and investigate user-related attacks. The data can reveal user privileges, group memberships, and access patterns. Analysts can use this information to identify suspicious accounts, trace user activities, and assess AIX system security posture.
---
# Wifi Logs
> Source: https://kb.binalyze.ai/air/features/acquisition/supported-evidence/ibm-aix-collections-detail/wifi-logs.html
## Overview
**Evidence:** Wifi Logs
**Description:** Collect Wifi Logs
**Category:** System
**Platform:** aix
**Short Name:** wifil
**Is Parsed:** No
**Sent to Investigation Hub:** Yes
**Collect File(s):** Yes
## Background
macOS WiFi logs contain wireless network connection events, authentication attempts, network transitions, and WiFi-related errors. These logs track all wireless network activity on the system.
## Data Collected
This collector gathers structured data about wifi logs.
## Collection Method
This collector gathers WiFi log files from /var/log/wifi*, which includes detailed wireless network connection logs, authentication events, and network diagnostics.
## Forensic Value
WiFi logs help establish device location history through network connections, identify unauthorized network access attempts, track network-based attacks, and reconstruct user movement and connectivity patterns.
---
# YUM History
> Source: https://kb.binalyze.ai/air/features/acquisition/supported-evidence/ibm-aix-collections-detail/yum-history.html
## Overview
**Evidence:** YUM History
**Description:** Collect YUM history
**Category:** System
**Platform:** aix
**Short Name:** yumhist
**Is Parsed:** Yes
**Sent to Investigation Hub:** Yes
**Collect File(s):** No
## Background
collect yum history on AIX (Advanced Interactive eXecutive) systems provides valuable forensic information for digital investigations. This data is essential for understanding system activity, detecting security incidents, and investigating system-related events. AIX systems provide unique insights into enterprise Unix environments and their security configurations.
## Data Collected
This collector gathers structured data about yum history.
## Collection Method
This collector parses the necessary data from system configuration files and data sources.
## Forensic Value
This evidence is crucial for forensic investigations as it provides information about yum history on AIX systems. It helps investigators understand system configuration, detect security incidents, and investigate system-related events. The data can reveal system activity, configuration details, and potential security vulnerabilities. Analysts can use this information to identify suspicious activities, trace system changes, and assess AIX system security posture.
---
# YUM Sources
> Source: https://kb.binalyze.ai/air/features/acquisition/supported-evidence/ibm-aix-collections-detail/yum-sources.html
## Overview
**Evidence:** YUM Sources
**Description:** Collect YUM sources
**Category:** System
**Platform:** aix
**Short Name:** yumsrcs
**Is Parsed:** Yes
**Sent to Investigation Hub:** Yes
**Collect File(s):** No
## Background
collect yum sources on AIX (Advanced Interactive eXecutive) systems provides valuable forensic information for digital investigations. This data is essential for understanding system activity, detecting security incidents, and investigating system-related events. AIX systems provide unique insights into enterprise Unix environments and their security configurations.
## Data Collected
This collector gathers structured data about yum sources.
## Collection Method
This collector parses the necessary data from system configuration files and data sources.
## Forensic Value
This evidence is crucial for forensic investigations as it provides information about yum sources on AIX systems. It helps investigators understand system configuration, detect security incidents, and investigate system-related events. The data can reveal system activity, configuration details, and potential security vulnerabilities. Analysts can use this information to identify suspicious activities, trace system changes, and assess AIX system security posture.
---
# ESXi Collections
> Source: https://kb.binalyze.ai/air/features/acquisition/supported-evidence/esxi-collections.html
## **ESXi Evidence List**
---
# Account Info
> Source: https://kb.binalyze.ai/air/features/acquisition/supported-evidence/esxi-collections-detail/account-info.html
## Overview
**Evidence:** Account Info
**Description:** ESXi Account Info
**Category:** System
**Platform:** esxi
**Short Name:** accinfo
**Is Parsed:** Yes
**Sent to Investigation Hub:** Yes
**Collect File(s):** No
## Background
Local ESXi accounts define administrative and service access to the hypervisor. Enumerating them supports auditing and detection of unauthorized users.
## Data Collected
This collector gathers structured data about account info.
### Account Info Data
| Field | Description | Example |
|-------|-------------|---------|
| `AccessTime` | Access Time | 2023-10-15 14:30:25+03:00 |
| `AccessCount` | Access Count | 123 |
| `URL` | URL | Example value |
| `Browser` | Browser | Example value |
| `Title` | Title | Example value |
| `VisitDuration` | Visit Duration | Example value |
| `Referrer` | Referrer | Example value |
| `TypedCount` | Typed Count | 123 |
| `IsHidden` | Is Hidden | true |
| `TransitionType` | Transition Type | Example value |
| `VisitID` | Visit ID | 123 |
| `TransitionQualifiers` | Transition Qualifiers | Example value |
| `User` | User | Example value |
| `Profile` | Profile | Example value |
| `HistoryFilePath` | History File Path | Example value |
## Collection Method
This collector parses esxcli system account list output captured in a text file to enumerate local user accounts and descriptions.
## Forensic Value
Account inventories enable validation against policy, detection of rogue accounts, and correlation with authentication events.
---
# Active Connections
> Source: https://kb.binalyze.ai/air/features/acquisition/supported-evidence/esxi-collections-detail/active-connections.html
## Overview
**Evidence:** Active Connections
**Description:** List active TCP/IP connections
**Category:** Network
**Platform:** esxi
**Short Name:** aconns
**Is Parsed:** Yes
**Sent to Investigation Hub:** Yes
**Collect File(s):** No
## Background
Active TCP/IP connections on ESXi hosts reveal network communication between the hypervisor and external systems, including management interfaces, storage networks, and VM traffic. This data is crucial for identifying unauthorized network access and detecting lateral movement.
## Data Collected
This collector gathers structured data about active connections.
### Active Connections Data
| Field | Description | Example |
|-------|-------------|---------|
| `AccessTime` | Access Time | 2023-10-15 14:30:25+03:00 |
| `AccessCount` | Access Count | 123 |
| `URL` | URL | Example value |
| `Browser` | Browser | Example value |
| `Title` | Title | Example value |
| `VisitDuration` | Visit Duration | Example value |
| `Referrer` | Referrer | Example value |
| `TypedCount` | Typed Count | 123 |
| `IsHidden` | Is Hidden | true |
| `TransitionType` | Transition Type | Example value |
| `VisitID` | Visit ID | 123 |
| `TransitionQualifiers` | Transition Qualifiers | Example value |
| `User` | User | Example value |
| `Profile` | Profile | Example value |
| `HistoryFilePath` | History File Path | Example value |
## Collection Method
This collector parses the output of 'esxcli network ip connection list' command, extracting protocol type, send/receive queue sizes, local and foreign addresses with ports, connection states, world IDs, congestion control algorithms, and associated world names for each active connection.
## Forensic Value
Network connection data exposes active communication channels, potentially revealing backdoors, C2 connections, unauthorized management access, or suspicious inter-host communication. Analyzing connection states, world names, and remote endpoints helps investigators detect malicious network activity and trace attacker movements.
---
# Advanced Configuration
> Source: https://kb.binalyze.ai/air/features/acquisition/supported-evidence/esxi-collections-detail/advanced-configuration.html
## Overview
**Evidence:** Advanced Configuration
**Description:** ESXi Advanced Configuration
**Category:** System
**Platform:** esxi
**Short Name:** advconf
**Is Parsed:** Yes
**Sent to Investigation Hub:** Yes
**Collect File(s):** No
## Background
ESXi advanced configuration settings control low-level hypervisor behavior, security policies, and system parameters. These settings can be modified to weaken security, enable backdoors, or alter logging behavior, making them valuable for detecting unauthorized system modifications.
## Data Collected
This collector gathers structured data about advanced configuration.
### Advanced Configuration Data
| Field | Description | Example |
|-------|-------------|---------|
| `AccessTime` | Access Time | 2023-10-15 14:30:25+03:00 |
| `AccessCount` | Access Count | 123 |
| `URL` | URL | Example value |
| `Browser` | Browser | Example value |
| `Title` | Title | Example value |
| `VisitDuration` | Visit Duration | Example value |
| `Referrer` | Referrer | Example value |
| `TypedCount` | Typed Count | 123 |
| `IsHidden` | Is Hidden | true |
| `TransitionType` | Transition Type | Example value |
| `VisitID` | Visit ID | 123 |
| `TransitionQualifiers` | Transition Qualifiers | Example value |
| `User` | User | Example value |
| `Profile` | Profile | Example value |
| `HistoryFilePath` | History File Path | Example value |
## Collection Method
This collector parses the advanced configuration file containing key-value pairs of ESXi system settings, extracting configuration parameter names and their corresponding values as defined in the host's advanced options.
## Forensic Value
Advanced configuration analysis reveals security policy changes, unauthorized parameter modifications, and potential indicators of compromise. Comparing settings against baselines helps detect malicious configuration changes, disabled security features, or altered logging that may hide attacker activities.
---
# Advanced Settings
> Source: https://kb.binalyze.ai/air/features/acquisition/supported-evidence/esxi-collections-detail/advanced-settings.html
## Overview
**Evidence:** Advanced Settings
**Description:** ESXi Advanced Settings
**Category:** System
**Platform:** esxi
**Short Name:** advsettings
**Is Parsed:** Yes
**Sent to Investigation Hub:** Yes
**Collect File(s):** No
## Background
ESXi advanced settings provide granular control over hypervisor behavior, including security policies, resource allocation, logging verbosity, and feature toggles. These settings can be weaponized by attackers to weaken security, disable logging, or modify system behavior for persistence.
## Data Collected
This collector gathers structured data about advanced settings.
### Advanced Settings Data
| Field | Description | Example |
|-------|-------------|---------|
| `AccessTime` | Access Time | 2023-10-15 14:30:25+03:00 |
| `AccessCount` | Access Count | 123 |
| `URL` | URL | Example value |
| `Browser` | Browser | Example value |
| `Title` | Title | Example value |
| `VisitDuration` | Visit Duration | Example value |
| `Referrer` | Referrer | Example value |
| `TypedCount` | Typed Count | 123 |
| `IsHidden` | Is Hidden | true |
| `TransitionType` | Transition Type | Example value |
| `VisitID` | Visit ID | 123 |
| `TransitionQualifiers` | Transition Qualifiers | Example value |
| `User` | User | Example value |
| `Profile` | Profile | Example value |
| `HistoryFilePath` | History File Path | Example value |
## Collection Method
This collector parses advanced system settings, extracting configuration keys, current values, default values, and setting descriptions from the ESXi advanced options database.
## Forensic Value
Advanced settings analysis reveals security weakening modifications, identifies disabled security features, detects altered logging configurations that hide attacker activity, and exposes non-standard settings that may indicate compromise. Comparing against security baselines highlights suspicious deviations.
---
# CollectInfo
> Source: https://kb.binalyze.ai/air/features/acquisition/supported-evidence/esxi-collections-detail/collectinfo.html
## Overview
**Evidence:** CollectInfo
**Description:** CollectInfo
**Category:** System
**Platform:** esxi
**Short Name:** cinfo
**Is Parsed:** Yes
**Sent to Investigation Hub:** Yes
**Collect File(s):** No
## Background
Collection information tracks file-level details for collected artifacts including file paths, sizes, hashes, and timestamps. This metadata validates evidence integrity, supports deduplication, and provides file-level provenance for collected evidence.
## Data Collected
This collector gathers structured data about collectinfo.
### CollectInfo Data
| Field | Description | Example |
|-------|-------------|---------|
| `AccessTime` | Access Time | 2023-10-15 14:30:25+03:00 |
| `AccessCount` | Access Count | 123 |
| `URL` | URL | Example value |
| `Browser` | Browser | Example value |
| `Title` | Title | Example value |
| `VisitDuration` | Visit Duration | Example value |
| `Referrer` | Referrer | Example value |
| `TypedCount` | Typed Count | 123 |
| `IsHidden` | Is Hidden | true |
| `TransitionType` | Transition Type | Example value |
| `VisitID` | Visit ID | 123 |
| `TransitionQualifiers` | Transition Qualifiers | Example value |
| `User` | User | Example value |
| `Profile` | Profile | Example value |
| `HistoryFilePath` | History File Path | Example value |
## Collection Method
This collector records metadata for each collected file, capturing file paths, file sizes, cryptographic hashes (for integrity verification), access/modification/change timestamps, and file permissions.
## Forensic Value
Collection metadata ensures evidence integrity through hash verification, supports duplicate detection, enables timestamp analysis, and provides detailed inventory of collected artifacts. Hash values prove file integrity and detect tampering, while timestamps establish file timeline context.
---
# CPU Info
> Source: https://kb.binalyze.ai/air/features/acquisition/supported-evidence/esxi-collections-detail/cpu-info.html
## Overview
**Evidence:** CPU Info
**Description:** ESXi CPU Info
**Category:** System
**Platform:** esxi
**Short Name:** cpuinfo
**Is Parsed:** Yes
**Sent to Investigation Hub:** Yes
**Collect File(s):** No
## Background
ESXi CPU information provides detailed processor characteristics including core counts, speeds, cache configurations, and architecture details. This data establishes hardware baseline for the investigated host and can reveal hardware-specific vulnerabilities or performance anomalies that may indicate cryptomining or resource abuse.
## Data Collected
This collector gathers structured data about cpu info.
### CPU Info Data
| Field | Description | Example |
|-------|-------------|---------|
| `CPUID` | CPUID | 123 |
| `PackageID` | Package ID | 123 |
| `Family` | Family | 123 |
| `Model` | Model | 123 |
| `Type` | Type | 123 |
| `Stepping` | Stepping | 123 |
| `Brand` | Brand | Example value |
| `CoreSpeed` | Core Speed | 123 |
| `BusSpeed` | Bus Speed | 123 |
| `APICID` | APICID | Example value |
| `Node` | Node | 123 |
| `L2CacheSize` | L2Cache Size | 123 |
| `L2CacheAssociativity` | L2Cache Associativity | 123 |
| `L2CacheLineSize` | L2Cache Line Size | 123 |
| `L2CacheCPUCount` | L2Cache CPU Count | 123 |
| `L3CacheSize` | L3Cache Size | 123 |
| `L3CacheAssociativity` | L3Cache Associativity | 123 |
| `L3CacheLineSize` | L3Cache Line Size | 123 |
| `L3CacheCPUCount` | L3Cache CPU Count | 123 |
## Collection Method
This collector parses CPU information files, extracting processor IDs, package/core/thread counts, vendor details, model numbers, family information, stepping, CPU speeds, bus speeds, APIC IDs, NUMA node assignments, and L2/L3 cache specifications for each physical CPU package.
## Forensic Value
CPU configuration data helps validate host identity, detect hardware changes, and identify resource exhaustion patterns. Unusual CPU utilization correlated with CPU capabilities may indicate cryptomining, resource hijacking, or VM escape attempts. Cache and NUMA topology also assist in understanding side-channel attack feasibility.
---
# Datastores
> Source: https://kb.binalyze.ai/air/features/acquisition/supported-evidence/esxi-collections-detail/datastores.html
## Overview
**Evidence:** Datastores
**Description:** ESXi Datastores for all Virtual Machines
**Category:** DiskFilesystem
**Platform:** esxi
**Short Name:** dstr
**Is Parsed:** Yes
**Sent to Investigation Hub:** Yes
**Collect File(s):** No
## Background
ESXi datastores are storage containers where virtual machine files, ISOs, and templates are stored. Understanding datastore configuration is essential for tracking VM artifacts, identifying unauthorized data access, and investigating storage-based attacks or data exfiltration.
## Data Collected
This collector gathers structured data about datastores.
### Datastores Data
| Field | Description | Example |
|-------|-------------|---------|
| `AccessTime` | Access Time | 2023-10-15 14:30:25+03:00 |
| `AccessCount` | Access Count | 123 |
| `URL` | URL | Example value |
| `Browser` | Browser | Example value |
| `Title` | Title | Example value |
| `VisitDuration` | Visit Duration | Example value |
| `Referrer` | Referrer | Example value |
| `TypedCount` | Typed Count | 123 |
| `IsHidden` | Is Hidden | true |
| `TransitionType` | Transition Type | Example value |
| `VisitID` | Visit ID | 123 |
| `TransitionQualifiers` | Transition Qualifiers | Example value |
| `User` | User | Example value |
| `Profile` | Profile | Example value |
| `HistoryFilePath` | History File Path | Example value |
## Collection Method
This collector parses the datastore information file obtained via vim-cmd vmsvc/get.datastores command. It extracts datastore name, URL, capacity, free space, accessibility status, type (VMFS, NFS, etc.), and multi-host access configuration for each datastore attached to virtual machines.
## Forensic Value
Datastore metadata provides visibility into storage capacity, accessibility, and sharing configuration. This information helps investigators identify suspicious storage mounts, trace VM file locations, detect capacity anomalies that may indicate data staging, and validate storage security policies.
---
# Disk Usage
> Source: https://kb.binalyze.ai/air/features/acquisition/supported-evidence/esxi-collections-detail/disk-usage.html
## Overview
**Evidence:** Disk Usage
**Description:** ESXi Disk Usage
**Category:** DiskFilesystem
**Platform:** esxi
**Short Name:** diskusg
**Is Parsed:** Yes
**Sent to Investigation Hub:** Yes
**Collect File(s):** No
## Background
ESXi disk usage statistics track storage consumption across filesystems, partitions, and volumes on the hypervisor. Monitoring disk usage helps identify suspicious storage patterns, detect data staging for exfiltration, and reveal space exhaustion attacks or log file tampering.
## Data Collected
This collector gathers structured data about disk usage.
### Disk Usage Data
| Field | Description | Example |
|-------|-------------|---------|
| `AccessTime` | Access Time | 2023-10-15 14:30:25+03:00 |
| `AccessCount` | Access Count | 123 |
| `URL` | URL | Example value |
| `Browser` | Browser | Example value |
| `Title` | Title | Example value |
| `VisitDuration` | Visit Duration | Example value |
| `Referrer` | Referrer | Example value |
| `TypedCount` | Typed Count | 123 |
| `IsHidden` | Is Hidden | true |
| `TransitionType` | Transition Type | Example value |
| `VisitID` | Visit ID | 123 |
| `TransitionQualifiers` | Transition Qualifiers | Example value |
| `User` | User | Example value |
| `Profile` | Profile | Example value |
| `HistoryFilePath` | History File Path | Example value |
## Collection Method
This collector parses disk usage reports, extracting filesystem mount points, total capacity, used space, available space, usage percentages, and mount status for each storage volume accessible to the ESXi host.
## Forensic Value
Disk usage patterns reveal anomalous storage consumption that may indicate malware staging areas, log file manipulation to hide evidence, or denial-of-service attempts via disk exhaustion. Comparing usage trends helps identify rapid changes consistent with data exfiltration or malicious file placement.
---
# Environment Variables
> Source: https://kb.binalyze.ai/air/features/acquisition/supported-evidence/esxi-collections-detail/environment-variables.html
## Overview
**Evidence:** Environment Variables
**Description:** ESXi Environment Variables
**Category:** System
**Platform:** esxi
**Short Name:** envvar
**Is Parsed:** Yes
**Sent to Investigation Hub:** Yes
**Collect File(s):** No
## Background
Environment variables in ESXi control process execution contexts, system paths, configuration locations, and runtime behavior. Attackers may inject malicious paths, proxy settings, or library preloads via environment variables to enable persistence or hijack system processes.
## Data Collected
This collector gathers structured data about environment variables.
### Environment Variables Data
| Field | Description | Example |
|-------|-------------|---------|
| `AccessTime` | Access Time | 2023-10-15 14:30:25+03:00 |
| `AccessCount` | Access Count | 123 |
| `URL` | URL | Example value |
| `Browser` | Browser | Example value |
| `Title` | Title | Example value |
| `VisitDuration` | Visit Duration | Example value |
| `Referrer` | Referrer | Example value |
| `TypedCount` | Typed Count | 123 |
| `IsHidden` | Is Hidden | true |
| `TransitionType` | Transition Type | Example value |
| `VisitID` | Visit ID | 123 |
| `TransitionQualifiers` | Transition Qualifiers | Example value |
| `User` | User | Example value |
| `Profile` | Profile | Example value |
| `HistoryFilePath` | History File Path | Example value |
## Collection Method
This collector parses system environment variables, extracting variable names and their assigned values from the ESXi shell environment and system-wide configuration contexts.
## Forensic Value
Environment variable analysis reveals configuration tampering, malicious PATH manipulations, suspicious LD_PRELOAD entries, unauthorized proxy configurations, and other environment-based persistence mechanisms. Comparing against baselines identifies unauthorized modifications that enable privilege escalation or process hijacking.
---
# Filesystem Info
> Source: https://kb.binalyze.ai/air/features/acquisition/supported-evidence/esxi-collections-detail/filesystem-info.html
## Overview
**Evidence:** Filesystem Info
**Description:** ESXi Filesystem Info
**Category:** DiskFilesystem
**Platform:** esxi
**Short Name:** fsinfo
**Is Parsed:** Yes
**Sent to Investigation Hub:** Yes
**Collect File(s):** No
## Background
ESXi filesystem listings show datastores and mount points, including capacity and free space. This informs where VMs and logs reside and whether storage constraints affect behavior.
## Data Collected
This collector gathers structured data about filesystem info.
### Filesystem Info Data
| Field | Description | Example |
|-------|-------------|---------|
| `MountPoint` | Mount Point | Example value |
| `VolumeName` | Volume Name | Example value |
| `UUID` | UUID | Example value |
| `Mounted` | Mounted | Example value |
| `Type` | Type | Example value |
| `Size` | Size | 123 |
| `Free` | Free | 123 |
## Collection Method
This collector parses esxcli storage filesystem list output captured in a text file, extracting mount points, UUIDs, types, and size/free metrics.
## Forensic Value
Filesystem context supports locating evidence, understanding storage layout, and correlating VM activity with datastore resources.
---
# Firewall Ruleset
> Source: https://kb.binalyze.ai/air/features/acquisition/supported-evidence/esxi-collections-detail/firewall-ruleset.html
## Overview
**Evidence:** Firewall Ruleset
**Description:** ESXi Firewall Ruleset
**Category:** Network
**Platform:** esxi
**Short Name:** fwruleset
**Is Parsed:** Yes
**Sent to Investigation Hub:** Yes
**Collect File(s):** No
## Background
ESXi's built-in firewall protects management interfaces by controlling inbound and outbound network traffic. Firewall rules define which services are accessible and from where, making rule configuration critical for preventing unauthorized remote access and detecting rule tampering.
## Data Collected
This collector gathers structured data about firewall ruleset.
### Firewall Ruleset Data
| Field | Description | Example |
|-------|-------------|---------|
| `Name` | Name | Example value |
| `Enabled` | Enabled | Example value |
## Collection Method
This collector parses firewall ruleset configuration, extracting rule names, enabled/disabled status, allowed IP addresses or networks, port numbers, protocol types, and direction specifications for each defined firewall rule.
## Forensic Value
Firewall rule analysis reveals security policy violations, detects unauthorized rule modifications that enable remote access, identifies overly permissive rules, and exposes attempts to disable security controls. Comparing rules against security baselines helps identify compromise indicators and policy violations.
---
# Hardware Clock Time
> Source: https://kb.binalyze.ai/air/features/acquisition/supported-evidence/esxi-collections-detail/hardware-clock-time.html
## Overview
**Evidence:** Hardware Clock Time
**Description:** Display the current hardware clock time
**Category:** System
**Platform:** esxi
**Short Name:** hwclk
**Is Parsed:** Yes
**Sent to Investigation Hub:** Yes
**Collect File(s):** No
## Background
Hardware clock (RTC) maintains system time independently of the operating system. Time accuracy is critical for forensic timeline analysis, log correlation, and detecting time-based anti-forensics techniques like timestomping or clock manipulation to hide malicious activities.
## Data Collected
This collector gathers structured data about hardware clock time.
### Hardware Clock Time Data
| Field | Description | Example |
|-------|-------------|---------|
| `AccessTime` | Access Time | 2023-10-15 14:30:25+03:00 |
| `AccessCount` | Access Count | 123 |
| `URL` | URL | Example value |
| `Browser` | Browser | Example value |
| `Title` | Title | Example value |
| `VisitDuration` | Visit Duration | Example value |
| `Referrer` | Referrer | Example value |
| `TypedCount` | Typed Count | 123 |
| `IsHidden` | Is Hidden | true |
| `TransitionType` | Transition Type | Example value |
| `VisitID` | Visit ID | 123 |
| `TransitionQualifiers` | Transition Qualifiers | Example value |
| `User` | User | Example value |
| `Profile` | Profile | Example value |
| `HistoryFilePath` | History File Path | Example value |
## Collection Method
This collector captures the current hardware clock time from the system's Real-Time Clock (RTC), recording the timestamp at collection to establish a time reference point for the investigation.
## Forensic Value
Hardware clock comparison with system time reveals time synchronization issues, detects deliberate clock manipulation used to evade detection or hide activity timing, and provides an independent time source for validating event timelines when system time may have been tampered with.
---
# Info
> Source: https://kb.binalyze.ai/air/features/acquisition/supported-evidence/esxi-collections-detail/info.html
## Overview
**Evidence:** Info
**Description:** Info
**Category:** System
**Platform:** esxi
**Short Name:** info
**Is Parsed:** Yes
**Sent to Investigation Hub:** Yes
**Collect File(s):** No
## Background
Case information metadata tracks collection details, timestamps, tool versions, and case identifiers. This metadata provides provenance for collected evidence, establishes chain of custody, and documents the collection environment and methodology.
## Data Collected
This collector gathers structured data about info.
### Info Data
| Field | Description | Example |
|-------|-------------|---------|
| `AccessTime` | Access Time | 2023-10-15 14:30:25+03:00 |
| `AccessCount` | Access Count | 123 |
| `URL` | URL | Example value |
| `Browser` | Browser | Example value |
| `Title` | Title | Example value |
| `VisitDuration` | Visit Duration | Example value |
| `Referrer` | Referrer | Example value |
| `TypedCount` | Typed Count | 123 |
| `IsHidden` | Is Hidden | true |
| `TransitionType` | Transition Type | Example value |
| `VisitID` | Visit ID | 123 |
| `TransitionQualifiers` | Transition Qualifiers | Example value |
| `User` | User | Example value |
| `Profile` | Profile | Example value |
| `HistoryFilePath` | History File Path | Example value |
## Collection Method
This collector captures case metadata including case ID, collection timestamp, collector version, operator information, target system details, and collection parameters used during evidence acquisition.
## Forensic Value
Case metadata ensures evidence integrity, establishes timeline accuracy, supports chain of custody documentation, and provides context for investigation reconstruction. Proper case information is essential for legal admissibility and forensic report generation.
---
# IP Interface Info
> Source: https://kb.binalyze.ai/air/features/acquisition/supported-evidence/esxi-collections-detail/ip-interface-info.html
## Overview
**Evidence:** IP Interface Info
**Description:** ESXi IP Interface Info
**Category:** Network
**Platform:** esxi
**Short Name:** ipifaceinfo
**Is Parsed:** Yes
**Sent to Investigation Hub:** Yes
**Collect File(s):** No
## Background
IP interface configuration on ESXi defines network addressing, routing, and connectivity for management, vMotion, and storage networks. IP settings control how the hypervisor communicates on networks and can be modified to redirect traffic or enable unauthorized network access.
## Data Collected
This collector gathers structured data about ip interface info.
### IP Interface Info Data
| Field | Description | Example |
|-------|-------------|---------|
| `AccessTime` | Access Time | 2023-10-15 14:30:25+03:00 |
| `AccessCount` | Access Count | 123 |
| `URL` | URL | Example value |
| `Browser` | Browser | Example value |
| `Title` | Title | Example value |
| `VisitDuration` | Visit Duration | Example value |
| `Referrer` | Referrer | Example value |
| `TypedCount` | Typed Count | 123 |
| `IsHidden` | Is Hidden | true |
| `TransitionType` | Transition Type | Example value |
| `VisitID` | Visit ID | 123 |
| `TransitionQualifiers` | Transition Qualifiers | Example value |
| `User` | User | Example value |
| `Profile` | Profile | Example value |
| `HistoryFilePath` | History File Path | Example value |
## Collection Method
This collector parses IP interface information, extracting interface names, IP addresses, netmasks, broadcast addresses, MAC addresses, MTU settings, interface states, and network type assignments for each configured IP interface.
## Forensic Value
IP interface data reveals network addressing schemes, detects unauthorized IP assignments, identifies network type misconfigurations, and traces communication paths. Comparing interface configurations against network diagrams helps detect rogue network connections or man-in-the-middle attack setups.
---
# Kernel Info
> Source: https://kb.binalyze.ai/air/features/acquisition/supported-evidence/esxi-collections-detail/kernel-info.html
## Overview
**Evidence:** Kernel Info
**Description:** ESXi Kernel Info
**Category:** System
**Platform:** esxi
**Short Name:** kerninfo
**Is Parsed:** Yes
**Sent to Investigation Hub:** Yes
**Collect File(s):** No
## Background
ESXi kernel (VMkernel) information provides details about the hypervisor's core operating system layer, including version, build numbers, and loaded modules. Kernel information is essential for identifying vulnerable versions, detecting unauthorized kernel modifications, and validating patch levels.
## Data Collected
This collector gathers structured data about kernel info.
### Kernel Info Data
| Field | Description | Example |
|-------|-------------|---------|
| `AccessTime` | Access Time | 2023-10-15 14:30:25+03:00 |
| `AccessCount` | Access Count | 123 |
| `URL` | URL | Example value |
| `Browser` | Browser | Example value |
| `Title` | Title | Example value |
| `VisitDuration` | Visit Duration | Example value |
| `Referrer` | Referrer | Example value |
| `TypedCount` | Typed Count | 123 |
| `IsHidden` | Is Hidden | true |
| `TransitionType` | Transition Type | Example value |
| `VisitID` | Visit ID | 123 |
| `TransitionQualifiers` | Transition Qualifiers | Example value |
| `User` | User | Example value |
| `Profile` | Profile | Example value |
| `HistoryFilePath` | History File Path | Example value |
## Collection Method
This collector parses kernel information files, extracting VMkernel version strings, build identifiers, release information, and compilation timestamps from ESXi kernel metadata sources.
## Forensic Value
Kernel version data helps identify known vulnerabilities, validate patch compliance, and detect version inconsistencies that may indicate rootkit installation or system tampering. Build information also assists in timeline reconstruction and verifying legitimate system updates versus malicious modifications.
---
# Module List
> Source: https://kb.binalyze.ai/air/features/acquisition/supported-evidence/esxi-collections-detail/module-list.html
## Overview
**Evidence:** Module List
**Description:** List ESXi Modules
**Category:** System
**Platform:** esxi
**Short Name:** modlist
**Is Parsed:** Yes
**Sent to Investigation Hub:** Yes
**Collect File(s):** No
## Background
ESXi kernel modules extend hypervisor functionality with device drivers, storage adapters, and system services. Loaded modules represent active kernel components and can include malicious kernel-mode rootkits or unauthorized driver installations that compromise hypervisor security.
## Data Collected
This collector gathers structured data about module list.
### Module List Data
| Field | Description | Example |
|-------|-------------|---------|
| `AccessTime` | Access Time | 2023-10-15 14:30:25+03:00 |
| `AccessCount` | Access Count | 123 |
| `URL` | URL | Example value |
| `Browser` | Browser | Example value |
| `Title` | Title | Example value |
| `VisitDuration` | Visit Duration | Example value |
| `Referrer` | Referrer | Example value |
| `TypedCount` | Typed Count | 123 |
| `IsHidden` | Is Hidden | true |
| `TransitionType` | Transition Type | Example value |
| `VisitID` | Visit ID | 123 |
| `TransitionQualifiers` | Transition Qualifiers | Example value |
| `User` | User | Example value |
| `Profile` | Profile | Example value |
| `HistoryFilePath` | History File Path | Example value |
## Collection Method
This collector parses loaded kernel module information, extracting module names, descriptions, versions, vendor information, license types, load addresses, module sizes, and dependency relationships for each currently loaded VMkernel module.
## Forensic Value
Module analysis reveals unauthorized kernel extensions, detects known malicious modules, validates driver integrity, and identifies unsigned or suspicious kernel components. Comparing module lists against baselines helps discover rootkits, backdoors, or compromised drivers that operate at the highest privilege level.
---
# Multipathing Info
> Source: https://kb.binalyze.ai/air/features/acquisition/supported-evidence/esxi-collections-detail/multipathing-info.html
## Overview
**Evidence:** Multipathing Info
**Description:** ESXi Multipathing Info
**Category:** DiskFilesystem
**Platform:** esxi
**Short Name:** mpathinfo
**Is Parsed:** Yes
**Sent to Investigation Hub:** Yes
**Collect File(s):** No
## Background
ESXi multipathing provides redundant storage connectivity by maintaining multiple paths between the host and storage devices. This configuration is critical for high availability and helps identify storage-related security events and misconfigurations.
## Data Collected
This collector gathers structured data about multipathing info.
### Multipathing Info Data
| Field | Description | Example |
|-------|-------------|---------|
| `AccessTime` | Access Time | 2023-10-15 14:30:25+03:00 |
| `AccessCount` | Access Count | 123 |
| `URL` | URL | Example value |
| `Browser` | Browser | Example value |
| `Title` | Title | Example value |
| `VisitDuration` | Visit Duration | Example value |
| `Referrer` | Referrer | Example value |
| `TypedCount` | Typed Count | 123 |
| `IsHidden` | Is Hidden | true |
| `TransitionType` | Transition Type | Example value |
| `VisitID` | Visit ID | 123 |
| `TransitionQualifiers` | Transition Qualifiers | Example value |
| `User` | User | Example value |
| `Profile` | Profile | Example value |
| `HistoryFilePath` | History File Path | Example value |
## Collection Method
This collector parses the pre-generated multipathing information file (esx_multipathing_info.txt), extracting path details including runtime names, device identifiers, adapter information, plugin types, path states, and transport protocols for each configured storage path.
## Forensic Value
Multipath configuration reveals storage topology, adapter relationships, and path states. Analyzing this data helps identify unauthorized storage modifications, detect compromised storage paths, and validate storage security configurations during incident investigations.
---
# Networks
> Source: https://kb.binalyze.ai/air/features/acquisition/supported-evidence/esxi-collections-detail/networks.html
## Overview
**Evidence:** Networks
**Description:** ESXi Networks for all Virtual Machines
**Category:** Network
**Platform:** esxi
**Short Name:** ntwk
**Is Parsed:** Yes
**Sent to Investigation Hub:** Yes
**Collect File(s):** No
## Background
ESXi VM network summaries describe port groups, accessibility, and IP pool associations, providing a view of virtual networking and connectivity.
## Data Collected
This collector gathers structured data about networks.
### Networks Data
| Field | Description | Example |
|-------|-------------|---------|
| `AccessTime` | Access Time | 2023-10-15 14:30:25+03:00 |
| `AccessCount` | Access Count | 123 |
| `URL` | URL | Example value |
| `Browser` | Browser | Example value |
| `Title` | Title | Example value |
| `VisitDuration` | Visit Duration | Example value |
| `Referrer` | Referrer | Example value |
| `TypedCount` | Typed Count | 123 |
| `IsHidden` | Is Hidden | true |
| `TransitionType` | Transition Type | Example value |
| `VisitID` | Visit ID | 123 |
| `TransitionQualifiers` | Transition Qualifiers | Example value |
| `User` | User | Example value |
| `Profile` | Profile | Example value |
| `HistoryFilePath` | History File Path | Example value |
## Collection Method
This collector parses vim-cmd vmsvc/get.networks output captured in a text file, extracting network records for each VM.
## Forensic Value
Network mappings support scoping of east-west traffic, identifying exposed segments, and correlating VM communications during incident response.
---
# NIC List
> Source: https://kb.binalyze.ai/air/features/acquisition/supported-evidence/esxi-collections-detail/nic-list.html
## Overview
**Evidence:** NIC List
**Description:** List ESXi NICs
**Category:** Network
**Platform:** esxi
**Short Name:** niclist
**Is Parsed:** Yes
**Sent to Investigation Hub:** Yes
**Collect File(s):** No
## Background
Physical network interface cards (NICs) connect ESXi hosts to network infrastructure. NIC configuration and status information reveals network connectivity, adapter associations, link states, and potential hardware tampering or unauthorized network device additions.
## Data Collected
This collector gathers structured data about nic list.
### NIC List Data
| Field | Description | Example |
|-------|-------------|---------|
| `Name` | Name | Example value |
| `PCI` | PCI | Example value |
| `Driver` | Driver | Example value |
| `Link` | Link | Example value |
| `Speed` | Speed | Example value |
| `Duplex` | Duplex | Example value |
| `MAC` | MAC | Example value |
| `MTU` | MTU | 123 |
| `Description` | Description | Example value |
## Collection Method
This collector parses NIC enumeration data, extracting interface names, descriptions, MAC addresses, PCI device information, driver details, link states, speeds, duplex settings, and administrative status for each physical network adapter.
## Forensic Value
NIC inventory helps validate physical network connections, detect rogue network adapters, identify driver-based attacks or rootkits, and trace network paths used during incidents. MAC addresses and PCI information assist in hardware identification and change detection.
---
# Open Files
> Source: https://kb.binalyze.ai/air/features/acquisition/supported-evidence/esxi-collections-detail/open-files.html
## Overview
**Evidence:** Open Files
**Description:** List Open Files
**Category:** System
**Platform:** esxi
**Short Name:** ofiles
**Is Parsed:** Yes
**Sent to Investigation Hub:** Yes
**Collect File(s):** No
## Background
Open file descriptors on ESXi reveal active file access by processes, including VM disk files, configuration files, log files, and system resources. This snapshot captures what files were being accessed at collection time, providing evidence of process behavior and file manipulation.
## Data Collected
This collector gathers structured data about open files.
### Open Files Data
| Field | Description | Example |
|-------|-------------|---------|
| `AccessTime` | Access Time | 2023-10-15 14:30:25+03:00 |
| `AccessCount` | Access Count | 123 |
| `URL` | URL | Example value |
| `Browser` | Browser | Example value |
| `Title` | Title | Example value |
| `VisitDuration` | Visit Duration | Example value |
| `Referrer` | Referrer | Example value |
| `TypedCount` | Typed Count | 123 |
| `IsHidden` | Is Hidden | true |
| `TransitionType` | Transition Type | Example value |
| `VisitID` | Visit ID | 123 |
| `TransitionQualifiers` | Transition Qualifiers | Example value |
| `User` | User | Example value |
| `Profile` | Profile | Example value |
| `HistoryFilePath` | History File Path | Example value |
## Collection Method
This collector parses the output of system commands listing open file descriptors, extracting process IDs, file paths, file types, access modes, and file descriptor numbers for each open file on the ESXi host.
## Forensic Value
Open file data exposes active process file access patterns, helps identify processes accessing sensitive files, detects unauthorized file modifications in progress, and reveals temporary files or sockets used by malware. Cross-referencing with process data provides complete picture of file-based attacker activities.
---
# PCI Info
> Source: https://kb.binalyze.ai/air/features/acquisition/supported-evidence/esxi-collections-detail/pci-info.html
## Overview
**Evidence:** PCI Info
**Description:** ESXi PCI Info
**Category:** DiskFilesystem
**Platform:** esxi
**Short Name:** pciinfo
**Is Parsed:** Yes
**Sent to Investigation Hub:** Yes
**Collect File(s):** No
## Background
PCI device enumeration provides comprehensive hardware inventory including network cards, storage controllers, GPUs, and other expansion devices. This baseline establishes expected hardware configuration and helps detect unauthorized physical device additions or modifications.
## Data Collected
This collector gathers structured data about pci info.
### PCI Info Data
| Field | Description | Example |
|-------|-------------|---------|
| `Address` | Address | Example value |
| `Segment` | Segment | Example value |
| `Bus` | Bus | Example value |
| `Slot` | Slot | Example value |
| `Function` | Function | Example value |
| `VMKernelName` | VM Kernel Name | Example value |
| `VendorName` | Vendor Name | Example value |
| `DeviceName` | Device Name | Example value |
| `ConfiguredOwner` | Configured Owner | Example value |
| `CurrentOwner` | Current Owner | Example value |
| `VendorID` | Vendor ID | Example value |
| `DeviceID` | Device ID | Example value |
| `SubVendorID` | Sub Vendor ID | Example value |
| `SubDeviceID` | Sub Device ID | Example value |
| `DeviceClass` | Device Class | Example value |
| `DeviceClassName` | Device Class Name | Example value |
| `ProgrammingInterface` | Programming Interface | Example value |
| `RevisionID` | Revision ID | Example value |
| `InterruptLine` | Interrupt Line | Example value |
| `IRQ` | IRQ | 123 |
| `InterruptVector` | Interrupt Vector | Example value |
| `PCIPin` | PCI Pin | Example value |
| `SpawnedBus` | Spawned Bus | Example value |
| `Flags` | Flags | Example value |
| `ModuleID` | Module ID | 123 |
| `ModuleName` | Module Name | Example value |
| `Chassis` | Chassis | 123 |
| `PhysicalSlot` | Physical Slot | 123 |
| `SlotDescription` | Slot Description | Example value |
| `DeviceLayerBusAddress` | Device Layer Bus Address | Example value |
| `PassThruCapable` | Pass Thru Capable | Example value |
| `ParentDevice` | Parent Device | Example value |
| `DependentDevice` | Dependent Device | Example value |
| `ResetMethod` | Reset Method | Example value |
| `FPTSharable` | FPT Sharable | Example value |
| `NUMANode` | NUMA Node | 123 |
| `ExtendedDeviceID` | Extended Device ID | 123 |
| `ExtendedDeviceName` | Extended Device Name | Example value |
## Collection Method
This collector parses PCI device information, extracting bus addresses, device IDs, vendor IDs, device classes, subsystem information, driver associations, and device names for all PCI and PCIe devices visible to the ESXi host.
## Forensic Value
PCI device inventory validates hardware configuration, detects rogue devices like hardware keyloggers or network taps, identifies unauthorized passthrough configurations, and reveals hardware-based attack vectors. Device ID changes or unexpected additions indicate physical tampering or malicious hardware implants.
---
# Permission Info
> Source: https://kb.binalyze.ai/air/features/acquisition/supported-evidence/esxi-collections-detail/permission-info.html
## Overview
**Evidence:** Permission Info
**Description:** ESXi Permission Info
**Category:** System
**Platform:** esxi
**Short Name:** perminfo
**Is Parsed:** Yes
**Sent to Investigation Hub:** Yes
**Collect File(s):** No
## Background
Permission information defines user and group access rights to ESXi resources, VMs, datastores, and management functions. Permission assignments control what actions users can perform and are frequently targeted for privilege escalation attacks or persistence establishment.
## Data Collected
This collector gathers structured data about permission info.
### Permission Info Data
| Field | Description | Example |
|-------|-------------|---------|
| `Principal` | Principal | Example value |
| `IsGroup` | Is Group | Example value |
| `RoleName` | Role Name | Example value |
| `RoleDescription` | Role Description | Example value |
## Collection Method
This collector parses permission assignments, extracting user/group identifiers, assigned roles, permission levels, resource targets (VMs, hosts, datastores), inheritance settings, and effective permissions for each access control entry.
## Forensic Value
Permission analysis reveals unauthorized privilege grants, identifies excessive permissions, detects role assignment anomalies, and traces access control modifications. Unexpected permission changes or overly broad grants indicate potential compromise or insider threat activity.
---
# Processes
> Source: https://kb.binalyze.ai/air/features/acquisition/supported-evidence/esxi-collections-detail/processes.html
## Overview
**Evidence:** Processes
**Description:** Collect Processes
**Category:** System
**Platform:** esxi
**Short Name:** process
**Is Parsed:** Yes
**Sent to Investigation Hub:** Yes
**Collect File(s):** No
## Background
On ESXi, process snapshots capture running services and daemons that manage hypervisor operations and virtual machines. This visibility is key for detecting unauthorized services and runtime anomalies.
## Data Collected
This collector gathers structured data about processes.
### Processes Data
| Field | Description | Example |
|-------|-------------|---------|
| `WID` | WID | 123 |
| `CID` | CID | 123 |
| `Name` | Name | Example value |
| `GID` | GID | 123 |
| `PGID` | PGID | 123 |
| `SID` | SID | 123 |
| `PCID` | PCID | 123 |
| `Type` | Type | Example value |
| `State` | State | Example value |
| `Wait` | Wait | Example value |
| `CPU` | CPU | Example value |
| `Time` | Time | Example value |
| `SecurityDomain` | Security Domain | Example value |
| `UserSpace` | User Space | Example value |
| `Command` | Command | Example value |
## Collection Method
This collector parses a pre-generated detailed process snapshot text file, tokenizes columns, and normalizes per-process attributes including identifiers, state, CPU/time fields, and command line.
## Forensic Value
Process listings reveal active components, potential malicious or misconfigured services, and support timeline correlation with host events and VM operations.
---
# Routes
> Source: https://kb.binalyze.ai/air/features/acquisition/supported-evidence/esxi-collections-detail/routes.html
## Overview
**Evidence:** Routes
**Description:** List Routes
**Category:** Network
**Platform:** esxi
**Short Name:** routes
**Is Parsed:** Yes
**Sent to Investigation Hub:** Yes
**Collect File(s):** No
## Background
ESXi network routing entries reflect layer-3 reachability and ARP neighbor state for the host. Understanding routes aids in mapping connectivity and potential egress paths.
## Data Collected
This collector gathers structured data about routes.
### Routes Data
| Field | Description | Example |
|-------|-------------|---------|
| `Neighbor` | Neighbor | Example value |
| `MAC` | MAC | Example value |
| `Interface` | Interface | Example value |
| `Expiry` | Expiry | Example value |
| `Type` | Type | Example value |
## Collection Method
This collector parses a pre-generated esx network routes text file and normalizes route neighbor, interface, MAC, expiry, and type fields.
## Forensic Value
Routing data provides network context for lateral movement, external communications, and validates expected network topology during investigations.
---
# Routing Table Info
> Source: https://kb.binalyze.ai/air/features/acquisition/supported-evidence/esxi-collections-detail/routing-table-info.html
## Overview
**Evidence:** Routing Table Info
**Description:** ESXi Routing Table Info
**Category:** Network
**Platform:** esxi
**Short Name:** routetable
**Is Parsed:** Yes
**Sent to Investigation Hub:** Yes
**Collect File(s):** No
## Background
The ESXi routing table defines how network packets are forwarded between different networks and interfaces. It contains critical information about network topology, gateway configurations, and network segmentation that can reveal unauthorized routing changes or network-based attack paths.
## Data Collected
This collector gathers structured data about routing table info.
### Routing Table Info Data
| Field | Description | Example |
|-------|-------------|---------|
| `AccessTime` | Access Time | 2023-10-15 14:30:25+03:00 |
| `AccessCount` | Access Count | 123 |
| `URL` | URL | Example value |
| `Browser` | Browser | Example value |
| `Title` | Title | Example value |
| `VisitDuration` | Visit Duration | Example value |
| `Referrer` | Referrer | Example value |
| `TypedCount` | Typed Count | 123 |
| `IsHidden` | Is Hidden | true |
| `TransitionType` | Transition Type | Example value |
| `VisitID` | Visit ID | 123 |
| `TransitionQualifiers` | Transition Qualifiers | Example value |
| `User` | User | Example value |
| `Profile` | Profile | Example value |
| `HistoryFilePath` | History File Path | Example value |
## Collection Method
This collector parses the routing table file (esx_routing_table.txt), extracting network destinations, netmasks, gateway addresses, and associated network interfaces for each routing entry in the ESXi host's routing configuration.
## Forensic Value
Routing table analysis helps identify unauthorized route modifications, detect network pivoting attempts, validate network segmentation, and trace potential lateral movement paths. Unusual routes or gateway changes may indicate compromise or misconfiguration that enabled unauthorized network access.
---
# SCSI Info
> Source: https://kb.binalyze.ai/air/features/acquisition/supported-evidence/esxi-collections-detail/scsi-info.html
## Overview
**Evidence:** SCSI Info
**Description:** ESXi SCSI Info
**Category:** DiskFilesystem
**Platform:** esxi
**Short Name:** scsiinfo
**Is Parsed:** Yes
**Sent to Investigation Hub:** Yes
**Collect File(s):** No
## Background
SCSI storage devices and adapters connect ESXi hosts to local and remote storage systems. SCSI device inventory reveals storage topology, LUN mappings, and adapter configurations that are essential for understanding data storage architecture and detecting unauthorized storage access.
## Data Collected
This collector gathers structured data about scsi info.
### SCSI Info Data
| Field | Description | Example |
|-------|-------------|---------|
| `DeviceType` | Device Type | Example value |
| `Size` | Size | Example value |
| `DisplayName` | Display Name | Example value |
| `MultipathPlugin` | Multipath Plugin | Example value |
| `ConsoleDevice` | Console Device | Example value |
| `DevfsPath` | Devfs Path | Example value |
| `Vendor` | Vendor | Example value |
| `Model` | Model | Example value |
| `Revision` | Revision | Example value |
| `SCSILevel` | SCSI Level | Example value |
| `IsPseudo` | Is Pseudo | Example value |
| `Status` | Status | Example value |
| `IsRDMCapable` | Is RDM Capable | Example value |
| `IsRemovable` | Is Removable | Example value |
| `IsLocal` | Is Local | Example value |
| `IsSSD` | Is SSD | Example value |
| `OtherNames` | Other Names | Example value |
| `VAAIStatus` | VAAI Status | Example value |
## Collection Method
This collector parses SCSI device information, extracting device names, adapter types, target IDs, LUN numbers, vendor identifiers, product information, device sizes, and operational states for each SCSI device visible to the ESXi host.
## Forensic Value
SCSI configuration analysis helps identify unauthorized LUN presentations, detect rogue storage devices, validate storage security configurations, and trace data access paths. Unexpected SCSI devices or LUN changes may indicate storage-based data exfiltration attempts or unauthorized backup access.
---
# Security Policy Domain
> Source: https://kb.binalyze.ai/air/features/acquisition/supported-evidence/esxi-collections-detail/security-policy-domain.html
## Overview
**Evidence:** Security Policy Domain
**Description:** ESXi Security Policy Domain
**Category:** System
**Platform:** esxi
**Short Name:** secpoldomain
**Is Parsed:** Yes
**Sent to Investigation Hub:** Yes
**Collect File(s):** No
## Background
Security policy domains define access control, authentication, and authorization rules for ESXi resources. These policies govern who can access what resources and with what privileges, making them critical for understanding security boundaries and detecting privilege escalation or unauthorized access.
## Data Collected
This collector gathers structured data about security policy domain.
### Security Policy Domain Data
| Field | Description | Example |
|-------|-------------|---------|
| `DomainName` | Domain Name | Example value |
| `EnforcementLevel` | Enforcement Level | Example value |
## Collection Method
This collector parses security policy domain configurations, extracting domain names, role assignments, permission sets, user and group mappings, and access control rules for each configured security domain.
## Forensic Value
Security policy analysis reveals unauthorized privilege escalations, identifies overly permissive access grants, detects policy violations, and exposes security weakening modifications. Comparing policies against security baselines helps identify compromise indicators and unauthorized access enablement.
---
# Syslog Config Info
> Source: https://kb.binalyze.ai/air/features/acquisition/supported-evidence/esxi-collections-detail/syslog-config-info.html
## Overview
**Evidence:** Syslog Config Info
**Description:** ESXi Syslog Config Info
**Category:** System
**Platform:** esxi
**Short Name:** syslogcfg
**Is Parsed:** Yes
**Sent to Investigation Hub:** Yes
**Collect File(s):** No
## Background
ESXi syslog configuration controls system logging behavior, including storage locations, remote forwarding, and log retention. Logging configuration is a prime target for attackers seeking to cover their tracks by disabling logging or redirecting logs away from legitimate monitoring systems.
## Data Collected
This collector gathers structured data about syslog config info.
### Syslog Config Info Data
| Field | Description | Example |
|-------|-------------|---------|
| `AccessTime` | Access Time | 2023-10-15 14:30:25+03:00 |
| `AccessCount` | Access Count | 123 |
| `URL` | URL | Example value |
| `Browser` | Browser | Example value |
| `Title` | Title | Example value |
| `VisitDuration` | Visit Duration | Example value |
| `Referrer` | Referrer | Example value |
| `TypedCount` | Typed Count | 123 |
| `IsHidden` | Is Hidden | true |
| `TransitionType` | Transition Type | Example value |
| `VisitID` | Visit ID | 123 |
| `TransitionQualifiers` | Transition Qualifiers | Example value |
| `User` | User | Example value |
| `Profile` | Profile | Example value |
| `HistoryFilePath` | History File Path | Example value |
## Collection Method
This collector parses syslog daemon configuration files and settings, extracting global log destinations, protocol settings (UDP/TCP/TLS), port numbers, certificate configurations for secure logging, and filtering rules.
## Forensic Value
Syslog configuration analysis identifies logging gaps, detects tampering with log forwarding, reveals unauthorized log destinations, and validates log integrity protection mechanisms. Configuration changes or disabled logging indicate potential evidence destruction attempts.
---
# Syslog Logger Info
> Source: https://kb.binalyze.ai/air/features/acquisition/supported-evidence/esxi-collections-detail/syslog-logger-info.html
## Overview
**Evidence:** Syslog Logger Info
**Description:** ESXi Syslog Logger Info
**Category:** System
**Platform:** esxi
**Short Name:** sloggerinfo
**Is Parsed:** Yes
**Sent to Investigation Hub:** Yes
**Collect File(s):** No
## Background
Syslog configuration determines where ESXi logs are stored and forwarded. Proper logging is essential for forensic investigations, and attackers often modify syslog settings to prevent log generation, redirect logs to attacker-controlled servers, or disable remote logging to hide their activities.
## Data Collected
This collector gathers structured data about syslog logger info.
### Syslog Logger Info Data
| Field | Description | Example |
|-------|-------------|---------|
| `AccessTime` | Access Time | 2023-10-15 14:30:25+03:00 |
| `AccessCount` | Access Count | 123 |
| `URL` | URL | Example value |
| `Browser` | Browser | Example value |
| `Title` | Title | Example value |
| `VisitDuration` | Visit Duration | Example value |
| `Referrer` | Referrer | Example value |
| `TypedCount` | Typed Count | 123 |
| `IsHidden` | Is Hidden | true |
| `TransitionType` | Transition Type | Example value |
| `VisitID` | Visit ID | 123 |
| `TransitionQualifiers` | Transition Qualifiers | Example value |
| `User` | User | Example value |
| `Profile` | Profile | Example value |
| `HistoryFilePath` | History File Path | Example value |
## Collection Method
This collector parses syslog logger configuration, extracting log rotation settings, local storage paths, remote syslog server destinations, log levels, and facility assignments for each configured logging component.
## Forensic Value
Syslog configuration analysis reveals logging tampering, identifies disabled or redirected logs, detects unauthorized remote syslog destinations, and exposes gaps in log coverage. Missing or modified syslog settings may indicate anti-forensics techniques used to evade detection and hide malicious activity.
---
# System
> Source: https://kb.binalyze.ai/air/features/acquisition/supported-evidence/esxi-collections-detail/system.html
## Overview
**Evidence:** System
**Description:** System
**Category:** System
**Platform:** esxi
**Short Name:** sys
**Is Parsed:** Yes
**Sent to Investigation Hub:** Yes
**Collect File(s):** No
## Background
ESXi host system information summarizes platform identity, kernel details, time settings, proxy configuration, and hardware identifiers. This provides baseline context for the hypervisor under investigation.
## Data Collected
This collector gathers structured data about system.
### System Data
| Field | Description | Example |
|-------|-------------|---------|
| `AccessTime` | Access Time | 2023-10-15 14:30:25+03:00 |
| `AccessCount` | Access Count | 123 |
| `URL` | URL | Example value |
| `Browser` | Browser | Example value |
| `Title` | Title | Example value |
| `VisitDuration` | Visit Duration | Example value |
| `Referrer` | Referrer | Example value |
| `TypedCount` | Typed Count | 123 |
| `IsHidden` | Is Hidden | true |
| `TransitionType` | Transition Type | Example value |
| `VisitID` | Visit ID | 123 |
| `TransitionQualifiers` | Transition Qualifiers | Example value |
| `User` | User | Example value |
| `Profile` | Profile | Example value |
| `HistoryFilePath` | History File Path | Example value |
## Collection Method
This collector parses a pre-generated system information text artifact (system_info.txt) from the case content, extracting fields such as computer name, UUID, serial, OS version, kernel details, proxy settings, architecture, platform, and time data.
## Forensic Value
System metadata establishes host identity and environment, enabling correlation across artifacts, validating time sources, and supporting scoping in multi-host investigations.
---
# User Info
> Source: https://kb.binalyze.ai/air/features/acquisition/supported-evidence/esxi-collections-detail/user-info.html
## Overview
**Evidence:** User Info
**Description:** ESXi User Info
**Category:** System
**Platform:** esxi
**Short Name:** userinfo
**Is Parsed:** Yes
**Sent to Investigation Hub:** Yes
**Collect File(s):** No
## Background
ESXi user session information tracks active and recent user logins, including administrator and service account access. This data is critical for identifying unauthorized access, establishing user activity timelines, and detecting compromised credentials or suspicious login patterns.
## Data Collected
This collector gathers structured data about user info.
### User Info Data
| Field | Description | Example |
|-------|-------------|---------|
| `Name` | Name | Example value |
| `Terminal` | Terminal | Example value |
| `SessionTime` | Session Time | Example value |
| `Date` | Date | Example value |
| `IP` | IP | Example value |
## Collection Method
This collector parses the user information file (user_info.txt), extracting username, terminal/session type, login timestamp with date, and source IP address for each user session recorded on the ESXi host.
## Forensic Value
User login records provide evidence of account access, help establish user activity timelines, and identify suspicious login sources. Analyzing login times, source IPs, and session types helps detect unauthorized access, credential misuse, and potential lateral movement from compromised accounts.
---
# VIB Info
> Source: https://kb.binalyze.ai/air/features/acquisition/supported-evidence/esxi-collections-detail/vib-info.html
## Overview
**Evidence:** VIB Info
**Description:** ESXi VIB Info
**Category:** System
**Platform:** esxi
**Short Name:** vibinfo
**Is Parsed:** Yes
**Sent to Investigation Hub:** Yes
**Collect File(s):** No
## Background
vSphere Installation Bundles (VIBs) are software packages that extend ESXi functionality with drivers, agents, and system tools. VIB inventory tracks installed software, patch levels, and third-party additions, providing visibility into the software attack surface.
## Data Collected
This collector gathers structured data about vib info.
### VIB Info Data
| Field | Description | Example |
|-------|-------------|---------|
| `Name` | Name | Example value |
| `Version` | Version | Example value |
| `Vendor` | Vendor | Example value |
| `AcceptanceLevel` | Acceptance Level | Example value |
| `InstallDate` | Install Date | Example value |
## Collection Method
This collector parses VIB package information, extracting package names, versions, vendors, installation dates, acceptance levels, signatures, and package descriptions for each installed VIB on the ESXi host.
## Forensic Value
VIB analysis helps identify unauthorized software installations, detect malicious packages masquerading as legitimate tools, validate patch compliance, and trace software-based persistence mechanisms. Unsigned or community-level VIBs warrant additional scrutiny as potential compromise vectors.
---
# VmkNicList
> Source: https://kb.binalyze.ai/air/features/acquisition/supported-evidence/esxi-collections-detail/vmkniclist.html
## Overview
**Evidence:** VmkNicList
**Description:** List VmkNicList
**Category:** Network
**Platform:** esxi
**Short Name:** vmkniclist
**Is Parsed:** Yes
**Sent to Investigation Hub:** Yes
**Collect File(s):** No
## Background
VMkernel network interfaces (vmknic) provide ESXi management, vMotion, storage, and fault tolerance network connectivity. These interfaces are critical for hypervisor operations and can be targets for network-based attacks or misconfigurations that expose management networks.
## Data Collected
This collector gathers structured data about vmkniclist.
### VmkNicList Data
| Field | Description | Example |
|-------|-------------|---------|
| `Interface` | Interface | Example value |
| `PortGroup` | Port Group | Example value |
| `IPFamily` | IP Family | Example value |
| `IPAddress` | IP Address | Example value |
| `Netmask` | Netmask | Example value |
| `Broadcast` | Broadcast | Example value |
| `MAC` | MAC | Example value |
| `MTU` | MTU | 123 |
| `TSOMSS` | TSOMSS | 123 |
| `Enabled` | Enabled | Example value |
| `Type` | Type | Example value |
| `NetStack` | Net Stack | Example value |
## Collection Method
This collector parses VMkernel NIC information, extracting interface names, DHCP/IPv6 settings, IP addresses, MAC addresses, MTU sizes, TSO/MSS values, enabled status, interface types, and network stack assignments for each configured VMkernel adapter.
## Forensic Value
VMkernel interface configuration reveals management network topology, potential security misconfigurations, and unauthorized network modifications. Analyzing IP assignments, MAC addresses, and network stack associations helps detect rogue interfaces, validate network isolation, and identify attack vectors targeting hypervisor management.
---
# Vswitch Standard Info
> Source: https://kb.binalyze.ai/air/features/acquisition/supported-evidence/esxi-collections-detail/vswitch-standard-info.html
## Overview
**Evidence:** Vswitch Standard Info
**Description:** ESXi Vswitch Standard Info
**Category:** Network
**Platform:** esxi
**Short Name:** vswitchstdinfo
**Is Parsed:** Yes
**Sent to Investigation Hub:** Yes
**Collect File(s):** No
## Background
Virtual Standard Switches (vSwitch) provide network connectivity for virtual machines and VMkernel interfaces. vSwitch configuration defines network segmentation, security policies, and traffic shaping, making it critical for understanding network topology and detecting unauthorized network modifications.
## Data Collected
This collector gathers structured data about vswitch standard info.
### Vswitch Standard Info Data
| Field | Description | Example |
|-------|-------------|---------|
| `Name` | Name | Example value |
| `Class` | Class | Example value |
| `NumPorts` | Num Ports | 123 |
| `UsedPorts` | Used Ports | 123 |
| `ConfiguredPorts` | Configured Ports | 123 |
| `MTU` | MTU | 123 |
| `CDPStatus` | CDP Status | Example value |
| `BeaconEnabled` | Beacon Enabled | Example value |
| `BeaconInterval` | Beacon Interval | 123 |
| `BeaconThreshold` | Beacon Threshold | 123 |
| `BeaconRequiredBy` | Beacon Required By | Example value |
| `Uplinks` | Uplinks | Example value |
| `PortGroups` | Port Groups | Example value |
## Collection Method
This collector parses standard vSwitch configuration data, extracting switch names, number of ports, configured port groups, uplink associations, NIC teaming policies, security settings, traffic shaping parameters, and VLAN configurations.
## Forensic Value
vSwitch configuration analysis reveals network segmentation policies, detects promiscuous mode enabling that could indicate packet sniffing, identifies unauthorized VLAN access, and exposes network policy violations that may facilitate lateral movement or data exfiltration.
---
# WBEM Info
> Source: https://kb.binalyze.ai/air/features/acquisition/supported-evidence/esxi-collections-detail/wbem-info.html
## Overview
**Evidence:** WBEM Info
**Description:** ESXi WBEM Info
**Category:** System
**Platform:** esxi
**Short Name:** wbeminfo
**Is Parsed:** Yes
**Sent to Investigation Hub:** Yes
**Collect File(s):** No
## Background
Web-Based Enterprise Management (WBEM) services enable CIM (Common Information Model) based hardware monitoring and management on ESXi. WBEM configuration controls remote hardware management access and can be exploited if improperly secured or modified to enable unauthorized hardware monitoring.
## Data Collected
This collector gathers structured data about wbem info.
### WBEM Info Data
| Field | Description | Example |
|-------|-------------|---------|
| `Enabled` | Enabled | Example value |
| `WSManagementService` | WS Management Service | Example value |
| `EnableHTTPS` | Enable HTTPS | Example value |
| `AuthorizationModel` | Authorization Model | Example value |
| `Port` | Port | 123 |
| `HTTPProcs` | HTTP Procs | 123 |
| `HTTPSProcs` | HTTPS Procs | 123 |
| `ProviderProcs` | Provider Procs | 123 |
| `KeepaliveTimeout` | Keepalive Timeout | 123 |
| `KeepaliveMaxRequests` | Keepalive Max Requests | 123 |
| `ProviderSampleInterval` | Provider Sample Interval | 123 |
| `ProviderTimeoutInterval` | Provider Timeout Interval | 123 |
| `HTTPMaxContentLength` | HTTP Max Content Length | 123 |
| `MaxMessageLength` | Max Message Length | 123 |
| `ThreadStackSize` | Thread Stack Size | 123 |
| `ProviderResourcePoolOverride` | Provider Resource Pool Override | Example value |
| `SSLCipherList` | SSL Cipher List | Example value |
| `ThreadpoolSize` | Threadpool Size | 123 |
| `Readonly` | Readonly | Example value |
| `LogLevel` | Log Level | Example value |
| `ServiceLocationProtocolPID` | Service Location Protocol PID | 123 |
| `WSManagementPID` | WS Management PID | 123 |
| `CIMObjectManagerPID` | CIM Object Manager PID | 123 |
| `EnabledSSLProtocols` | Enabled SSL Protocols | Example value |
| `EnabledSystemSSLProtocols` | Enabled System SSL Protocols | Example value |
| `EnabledRunningSSLProtocols` | Enabled Running SSL Protocols | Example value |
## Collection Method
This collector parses WBEM service configuration, extracting service status, port settings, authentication requirements, SSL/TLS configurations, and access control settings for the WBEM management interface.
## Forensic Value
WBEM configuration analysis reveals remote management exposure, identifies weakened authentication settings, detects unauthorized service modifications, and exposes potential backdoor access through management interfaces. Unexpected WBEM access or configuration changes warrant investigation.
---
# Disk and Volume Imaging
> Source: https://kb.binalyze.ai/air/features/acquisition/disk-and-volume-imaging/index.html
The acquisition of physical disk images and volume images can be done via an **Acquire Image Task** in the UI or by using commands in an [**interACT** ](../../interact/)**session**.
In addition to NTFS and FAT, AIR also supports the logical imaging of ext4 and ext3 volumes, as well as physical disk imaging, which is possible from all operating systems supported by the AIR Responder.
:::caution
When performing forensic disk imaging on Mac devices with T2 or later chips, obtaining a physical disk image of APFS volumes is often ineffective. This is because the data on these disks is encrypted, and decryption is exclusively managed by the chip that originally encrypted the data. Consequently, decryption can only occur during the acquisition process using that specific chip.
For most investigative purposes, a logical collection of files using AIR acquisition profiles typically provides sufficient information. This method, supported by AIR, enables investigators to access and analyze the file system and its contents efficiently, thereby bypassing the complexities associated with Apple Silicon APFS-encrypted physical disk images.
For detailed guidance on macOS disk imaging, see [macOS Disk Imaging](macos-disk-imaging).
:::
In the AIR UI, select **Assets** from the Main Menu, then navigate to **Devices** and select the asset you wish to image. In the Asset Info window, click the **Asset Actions** button to reveal a drop-down menu listing the actions available for that asset. **Acquire Image** is one such option:
Disk and Volume Imaging: Acquire an image from a single asset
The Acquire Image wizard will now walk you through the steps needed to take a forensic image from the asset:
1. Choose a Task Name.
2. Select or create a case to which the image should be associated.
3. Choose **either** the Volume or Disk tab (note that the size is displayed, so you can ensure the Repository has enough free space to hold the collected image).
4. If there is more than one disk or volume, you can select the desired one by searching, filtering, or manually selecting it.
Disk and Volume Imaging: The Volume and Disk tabs
Having chosen what is to be imaged, you can now configure/set up the image file:
1. Select an Evidence Repository to which the image file can be saved.
2. Select your image format, RAW (dd) or EWF2 (Ex01), which is currently supported.
3. For RAW (dd) **only**, a toggle switch provides users with the option to enable or disable the consolidation of physical disk or volume image files into a single zip file, eliminating the need to split them into separate chunks.
4. For RAW (dd), if the 'single zip file' option is not toggled on, users will have the option to choose the size of image file chunks. If you want to use AIR's File Explorer to browse the image file, the image must be supplied to AIR from an SMB, SFTP, Amazon S3 bucket, Azure Blob Storage, or Google Cloud Storage shared location, where it needs to be saved as **a single contiguous RAW file or an EWF file which can be** **segmented.**
5. Users can also choose to skip a configurable number of bytes before starting the imaging process.
Disk and Volume Imaging: Configuration setting for the image files
In the 'Resource Limits' section, as with other AIR taskings, you can set limits on the network bandwidth used during the image acquisition process. Meanwhile, the 'Compression and Encryption' section provides options for conserving storage space and enhancing the security of the gathered evidence.
The output of your imaging task will be located in the evidence repository you selected when building the task in the wizard. The metadata associated with the acquisition will also be found there and this is explained here: [Understanding errors documented in the metadata.yml file](imaging-with-interact#understanding-errors-documented-in-the-metadata.yml-file)
The acquired image can be investigated using the AIR [File Explorer](../../file-explorer/).
---
# Imaging with interACT
> Source: https://kb.binalyze.ai/air/features/acquisition/disk-and-volume-imaging/imaging-with-interact.html
interACT has an imaging command with several options/switches to allow users to read a disk or volume and write its contents out as a .dd file. As seen on the previous page, this can also be done from the AIR UI but remains here in interACT for those who prefer to image from the command line.
## interACT Imaging Options
   --list, -l                           list available disk/volume devices (default: false)
   --input value, -i value              read disk device from given input
   --output value, -o value             write output file(s) to a repository or directory. Use 'repository' to upload to evidence repository set at session start
   --max-chunk-size value, -c value     maximum chunk size in bytes or use suffix K,M,G. Use 0 to use dynamically calculated chunk size (default: "512M")
   --chunk-retry-count value, -r value  number of retries for chunk creation attempts when output is repository. If output is a directory, this flag is ignored (default: 1024)
   --start-offset value, -s value       start offset in bytes or use suffix K,M,G (default: "0")
   --max-chunk-count value, -n value    maximum number of chunks to create. 0 value dynamically calculates the number of chunks (default: 0)
   --block-size value, -b value         input block size in bytes or use suffix K,M,G. This must be multiple of logical sector size. Bigger values will result in faster reads but will skip the same amount of data on each read if read error occurs. 1M is a good value for most cases. (default: "1M")
   --file-prefix value, -p value        prefix for output file name(s)
   --no-proxy                           bypass proxy if enabled while transferring file to a repository (default: false)
   --bandwidth-limit value              maximum bandwidth limit in bytes or use suffix K,M,G (default: "0")
   --help, -h                           show help
Here is an example of an imaging command in its simplest form:
```
image -i E: -o OutputFolder2
```
In this command, the `-i` flag is used to specify the input source for the `image` command.
Here's a breakdown of the command:
* `image`: This is the name of a command or script that is used to create an image (a copy) of a disk or volume.
* `-i E:`: This flag specifies the input source for the image creation process. In this case, `E:` represents a disk or volume identifier on the system. It indicates that the image creation process should target the contents of the disk or volume associated with the drive letter `E:`.
* `-o OutputFolder2`: This flag specifies the output destination for the image file. The image file generated by the command will be stored in the `OutputFolder2` directory.
## Imaging output and the metadata.yml file
To inspect the results of the command shown above, `image -i E: -o OutputFolder2,` we can navigate to the folder using interACT and list the contents as shown below:
Imaging with interACT: Output and associated metadata file
In this case, we see that there are two image chunks; image.001.zip and image.002.zip, along with a file named metadata.yml. This file exists in your output folder even when you use the AIR UI to image a disk or volume.
This metadata file can be read in the shell with the 'cat' command. It provides information about your image including the source, imaging start and end times, size, and hash values:
Imaging with interACT: Contents of metadata.yml
## Understanding errors documented in the metadata.yml file
From time to time all imaging tools will have issues with areas of the the disk that can not be read. In such cases, AIR will report errors in the metadata.yml file and they will be recorded as shown below:
```xml
metadata:
Hostname: Win10-002
Source: '\\.\E:'
Target: C:\Users\OutputFolder2
StartTime: 2024-03-19T19:58:21.2390559-07:00
BlockSize: 1048576
StartOffset: 0
Duration: 7.734205s
ChunkSizeInBytes: 536870912
BytesRead: 1073737728
ReadDuration: 466.9625ms
SeekDuration: 0s
BytesWritten: 1073737728
NumberOfChunks: 2
WriteDuration: 7.249291s
Compression: true
Encryption: false
Hash:
MD5: fca9b2842db5decdf894327adf4a1ed9
SHA1: ad6a937e97fa73e64d6d0fdabb0a357ca01c9df4
SHA256: eeb5961f8f83ae3d70495831da307d429c6ffe881364c5396da76408a8ad8224
ReadErrorTable:
Errors:
0: error-1
1: error-2
Regions:
- Offset: 0
Size: 1048576
RefError: 0
- Offset: 2097152
Size: 1048576
RefError: 1
```
This imaging metadata report outlines the process and outcome of an imaging operation carried out in AIR. The report provides details about the operation, including the source, target, data transfer metrics, and errors encountered. Let's break down the key parts and interpret the errors mentioned in the report:
#### Basic Operation Details
* **Hostname**: Win10-002 indicates the machine name where the operation was performed.
* **Source**: '\\.\E:' shows that imaging was done from a device mounted at E: (likely a disk drive).
* **Target**: C:\Users\OutputFolder2 is where the imaged data was written.
* **StartTime**: The operation started on March 19, 2024, at 19:58:21 local time.
* **Duration**: It took approximately 7.73 seconds to complete.
* **Compression**: Enabled, indicating the data was compressed during the imaging process.
* **Encryption**: Not used during this imaging operation.
#### Data Transfer Metrics
* **BytesRead and BytesWritten**: Both are 1,073,737,728 bytes, indicating that a bit over 1 GB of data was read from the source and written to the target.
* **NumberOfChunks**: 2 chunks of data were processed, aligning with the bytes read/written and chunk size.
* **ChunkSizeInBytes**: Each chunk was 536,870,912 bytes, about 512 MB, which fits the total data size indicating two chunks were necessary.
* **ReadDuration and WriteDuration**: Reading took under half a second, whereas writing took the majority of the operation time (about 7.25 seconds).
#### Errors and Their Implications
The `ReadErrorTable` section is particularly noteworthy as it outlines issues encountered during the read operation:
* **Errors Listed**: Two errors, `error-1` and `error-2`, were encountered during the imaging process.
* **Regions Affected**:
* The first error occurred at the very beginning of the read operation (Offset: 0), affecting 1,048,576 bytes (1 MB).
* The second error occurred after skipping the next 1 MB chunk (notably absent from the errors), affecting the third 1 MB segment of data (Offset: 2,097,152).
#### Interpreting the Errors
* The presence of read errors in specific regions suggests issues with the source device at those locations. This could be due to bad sectors, physical damage, or corruption within the disk's storage.
* The operation continued despite these errors, which is common in forensic imaging processes where the goal is to recover as much data as possible, even in the presence of damaged or inaccessible areas.
* The absence of errors for the second 1 MB segment (from 1,048,576 to 2,097,152 bytes) indicates that not all regions of the source had issues, highlighting the localized nature of the problems.
---
# macOS Disk Imaging
> Source: https://kb.binalyze.ai/air/features/acquisition/disk-and-volume-imaging/macos-disk-imaging.html
## Executive Summary
Apple's APFS file system uses a **shared-container architecture**. This has important implications for forensic imaging:
- You can only obtain a forensically sound macOS image by acquiring an **entire APFS container**.
- It is **not possible** to acquire a usable APFS volume-level image, because APFS volumes do not contain the full metadata required to stand alone.
- This applies to Intel and Apple Silicon systems, encrypted and unencrypted APFS, and all imaging tools including AIR and `dd`.
:::tip
AIR fully supports forensically sound disk-level acquisition on macOS when SIP is disabled. The resulting full-container images can be analysed in AIR or third-party forensic tools.
:::
## Understanding APFS Forensic Imaging
APFS containers host multiple volumes that share critical metadata:
- Object maps
- Checkpoints and snapshots
- Allocation tables
- Encryption state
Because APFS volumes cannot function independently, volume-only images cannot be mounted or parsed. **Forensically valid macOS imaging requires acquiring an entire APFS container.**
## System Integrity Protection (SIP)
macOS includes a security technology called **System Integrity Protection (SIP)**. This technology restricts user access to certain folders and processes to protect the operating system from malicious software.
:::caution
**SIP Must Be Disabled for Disk Imaging**
If SIP is enabled on a macOS machine, disk image acquisition is not possible. When you attempt to assign an image task to a machine with SIP enabled, the AIR Console displays a warning.
:::
macOS Disk Imaging: AIR Console warning when SIP is enabled
### Disabling SIP
To proceed with acquiring a disk image, SIP must be disabled. This requires booting the Mac into **Recovery Mode**. The method to access Recovery Mode varies depending on whether the Mac is Intel-based or Apple Silicon-based.
#### For Intel-based Macs
1. Restart your Mac.
2. Immediately press and hold **Command-R** until you see the startup screen.
3. If you see a lock, enter the password for your Mac.
#### For Apple Silicon Macs
1. On your Mac, choose **Apple menu > Shut Down**.
2. Press and hold the **power button** on your Mac until the system volume and the Options button appear.
3. Click the **Options** button, then click **Continue**.
#### Disabling SIP via Terminal
Once in Recovery Mode:
1. Select **Terminal** from the **Utilities** menu.
2. Enter the following command:
```bash
csrutil disable
```
3. After successfully disabling SIP, restart the machine.
You should now see that the warning in the AIR Console has disappeared, allowing you to assign a disk image acquisition task to the responder.
## Acquiring a Disk Image on macOS
### What You Can Do with AIR
#### Full APFS Container Imaging (Supported)
AIR can acquire a full, block-level image of the physical disk (capturing the APFS container) once SIP is disabled. A full-container image:
- Contains all APFS metadata and structure
- Is accepted by APFS-aware forensic tools
- Can be used directly inside AIR
**This is the correct and only method for creating a forensically sound image of an APFS container.**
#### APFS Volume-Level Imaging (Not Possible)
AIR, like all forensic tools, cannot produce a valid standalone image of an APFS volume. Volume images:
- Cannot be mounted
- Cannot be parsed
- Are not forensically useful
:::note
This is a limitation of APFS itself, not AIR. The same behaviour occurs with any imaging tool including the native `dd` command.
:::
### Disk Tab vs Volume Tab
When you select the **Acquire Image** task, you are presented with two tabs: **Disk** and **Volume**.
#### Disk Tab
The Disk tab (as seen below) displays entries that represent the system’s physical disks or virtual disk devices. APFS containers reside inside these disks, not at the same level.
**Best forensic choice** (The most common case)
On almost all APFS Macs: **rdisk0 is the actual physical internal SSD**
All other rdisk entries (rdisk1–rdisk4) are synthesized or virtual devices (APFS Preboot stores, VM stores, snapshots, container-derived devices, or disk images mounted in the OS)
Therefore, in most cases, to get a complete, integrity-preserving image you should acquire:
**/dev/rdisk0 — the full physical disk**
macOS Disk Imaging: APFS disk view showing available physical disks
Images acquired from the Disk tab for APFS containers can be mounted and verified as accessible file systems.
### Identifying the Correct APFS Container
macOS systems—particularly Apple Silicon Macs—often contain **multiple APFS containers** on a single physical disk. These may include separate containers for system recovery, preboot, and virtual machine storage, in addition to the primary system container.
For forensic purposes, the container of interest is typically **the largest one**, which houses the **Macintosh HD** system volume and the associated **Data** volume containing user files. In the AIR Disk tab, this is usually represented by the primary physical disk entry (e.g., `/dev/rdisk0`). Examiners should verify the container contents after acquisition to confirm they have captured the intended system and user data.
#### Volume Tab
The Volume tab displays individual volumes. For APFS volumes, acquisition from this tab will fail due to the container architecture limitations.
macOS Disk Imaging: Volumes tab showing available volumes
Attempting to acquire an APFS volume image results in an error:
macOS Disk Imaging: Volume imaging fails due to APFS architecture
### Verifying a Successful Acquisition
After acquiring a full APFS container image, you can verify the image by mounting it in a forensic tool or within AIR.
macOS Disk Imaging: Test the mounted image to verify acquisition success
## File System Support and Expected Outcomes
The following table summarises acquisition behaviour across different file systems:
| File System | Disk Tab | Volume Tab | Image Usability |
|-------------|----------|------------|-----------------|
| **APFS** | ✅ Supported | ❌ Not possible | Usable (full container only) |
| **APFS (Encrypted)** | ✅ Supported | ❌ Not possible | Usable (full container only) |
| **APFS (Case-Sensitive)** | ✅ Supported | ❌ Not possible | Usable (full container only) |
| **APFS (Case-Sensitive, Encrypted)** | ✅ Supported | ❌ Not possible | Usable (full container only) |
| **Mac OS Extended (HFS+)** | Does not appear | ✅ Supported | Usable |
| **Mac OS Extended (Case-Sensitive)** | Does not appear | ✅ Supported | Usable |
| **MS-DOS (FAT)** | Does not appear | ✅ Supported | Often not usable |
| **ExFAT** | Does not appear | ✅ Supported | Often not usable |
## Working With APFS Images
A full APFS container image acquired via AIR can be:
- Mounted in forensic tools
- Processed by AIR
- Parsed by APFS libraries
It contains snapshots, deleted artifacts, system and user data, and full filesystem structure.
## Recommended Workflow
1. **Disable SIP** via Recovery Mode
2. **Acquire an APFS container** from the Disk tab
3. **Validate hashes** to confirm integrity
4. **Mount/import image** in your forensic tool
5. **Analyse** the complete APFS dataset
## Key Takeaways
:::tip
**Summary**
1. **APFS volumes cannot be imaged individually** — this is a limitation of APFS architecture, not AIR.
2. **Full APFS container imaging is required** for forensically sound macOS acquisition.
3. **SIP must be disabled** before attempting disk image acquisition.
4. **AIR fully supports correct APFS acquisition** — use the Disk tab for APFS systems.
5. **HFS+ (Mac OS Extended) volumes** can be successfully acquired and mounted from the Volume tab.
6. For **encrypted APFS volumes** on T2/Apple Silicon Macs, consider using **logical collection** via acquisition profiles as an alternative to physical imaging.
:::
## Related Pages
- [Disk and Volume Imaging Overview](./)
- [Imaging with interACT](imaging-with-interact)
---
# Scheduling Tasks
> Source: https://kb.binalyze.ai/air/features/acquisition/scheduling-tasks.html
Scheduling tasks in AIR not only enables the automation of acquisitions and DRONE analysis, but it transforms AIR into a proactive DFIR platform. By setting up scheduled tasks for regular collections and automated DRONE analysis, AIR can proactively identify issues that might well go unnoticed by other security systems.
Instead of waiting for alerts from external sources, AIR takes the initiative to regularly collect and analyze assets according to a predefined schedule and acquisition profile. This proactive approach allows organizations to stay ahead of potential threats and vulnerabilities by detecting issues early on, even before they manifest as security incidents.
By integrating task scheduling into security operations, organizations can enhance their defense strategies and strengthen their overall security posture. Additionally, it ensures that the 'best evidence' is automatically acquired and forensically preserved, facilitating further investigation when needed.
Investigators simply use the tasking wizard to schedule tasks for the following activities:
* Evidence collections.
* Hunt/Triage/Threat Hunting.
* Disk and Volume Imaging.
* Auto Asset Tagging.
To set up a scheduled task, please follow the steps below:
## Step 1 - Assets
1. Choose the Asset(s) on which you wish to schedule tasks - the Bulk Action Bar will be available if you choose more than one asset.
2. Create a Task Name if required.
3. Allocate the task to a case.
4. Select 'Schedule for later'
Scheduling Tasks: Schedule for later
## **Step 2 - Setup**
1. Select the time zone that determines when the task is executed. You have the flexibility to execute the task in the local time zone of each selected asset or simultaneously across all assets by choosing a single time zone.
2. Select a start date and time for the task.
3. If required, toggle the Repeat switch on and set the cadence or recurrence rate.
4. Select when or whether you want to end the schedule.
5. Lastly, choose the acquisition profile you wish to apply to the scheduled task.
:::caution
**Note:** Scheduled tasks cannot be repeated within a "Case". This is because there is no destination for the task results when a Case is closed, leaving them without a location to be sent to.
:::
Scheduling Tasks: Setting up the scheduled task
### User Privileges for Task Scheduling:
* AIR administrators can now restrict users from scheduling tasks or editing existing ones:
* **Schedule Task**: Enables users to "Schedule for later." Without this privilege, this option is disabled, and a tooltip explains the restriction.
* **Update Scheduled Task**: Allows users to edit scheduled tasks. If this privilege is not granted, the "Edit" button is disabled, accompanied by an explanatory tooltip.
## Step 3 - Customization
* This step allows you to use the policies already set as an organizational policy or, if you have the necessary privileges, make changes to:
* Where the collected evidence is to be saved.
* Apply a Resource limit to the task assignment to reduce potential impacts on the asset.
* Enable compression and encryption to be applied to the collected evidence.
Scheduling Tasks: Customization of options
## Step 4 - Analysis
In this final step, you can enable or disable the DRONE and MITRE ATT\&CK Analyzers.
We highly recommend keeping both analyzers active as they have minimal impact on resources. The MITRE ATT\&CK analyzer runs on live assets and, when combined with other analyzers, facilitates immediate identification of potentially compromised assets. This allows for efficient prioritization of investigative efforts.
Scheduling Tasks: Toggle options for DRONE
### **The results of all tasks, along with their associated reports, are accessible via the Investigation Hub.**
Links to these reports within the Investigation Hub can be found in the following three locations:
1. Tasks, via the main menu.
2. The page for the individual Asset > Acquisitions.
3. And finally, Case Acquisitions, if the task is sent to a Case.
:::tip
Tasks scheduled through the console will execute as planned. However, if an asset is offline at the scheduled time, it will automatically receive and carry out the task upon its next connection.
:::
## How to edit existing Scheduled Tasks
Managing scheduled tasks has never been easier. The Edit Scheduled Task feature allows you to modify existing scheduled tasks, eliminating the need to cancel and reconfigure them.
You can easily add or remove assets without needing to restart the task, saving valuable time and enhancing workflow efficiency. After selecting the assets, you can then update the task setup, customize options, and manage follow-up actions, streamlining the task management process for a smoother and faster workflow.
To modify a scheduled task, go to your Task listings page and filter by Status > Scheduled to display only the scheduled tasks:
From the filtered results, selecting the ‘eye’ icon presents you with the Task Details and the ellipse with Edit or Delete Task options:
Scheduling Tasks: Edit or Delete Task options
The Edit Scheduled Task Wizard will now open, allowing the user to toggle off the "Only Selected Assets" switch (as shown below). This now reveals all other available assets that can be added to the scheduled task:
Scheduling Tasks: Select the assets requiring an edit to scheduled task
Step 2, the Setup, allows you to edit the Task Name, the Schedule, and even the acquisition profile to be used:
Scheduling Tasks: Edits
Steps 3 and 4, Customization and Analysis, are fully configurable, allowing you to edit the scheduled task as needed.
---
# Task Creation
> Source: https://kb.binalyze.ai/air/features/acquisition/task-creation/index.html
## Introduction to Task Creation in AIR
Tasks in AIR are operations assigned to assets via the AIR console, either manually or automatically through triggers. Each task can comprise multiple 'tasking assignments,' where a single task on one asset is a 'tasking assignment,' but the term 'task' can also describe the same tasking assignment across many assets. These tasks facilitate various operational needs and can be categorized into three types:
### Types of Tasks
1. **Manual Tasks:**
* These are assigned manually by users directly through the AIR console.
2. **Scheduled Tasks:**
* Created by users to commence at a future time. Scheduled tasks can be one-time events or recurring at daily, weekly, or monthly intervals.
3. **Triggered Tasks:**
* Automatically assigned to assets in response to trigger requests from integrated SIEM, SOAR, or EDR solutions.
Tasks enhance operational efficiency by allowing flexible and automated responses to various cybersecurity scenarios, ensuring that your assets are continually monitored and managed effectively.
### Activities that Generate Tasking Assignments
In AIR, tasking assignments are generated by various activities that target asset operations, including:
1. **Data Acquisition:**
* Initiating the collection of digital evidence from an asset. This can be a comprehensive acquisition or targeted to specific evidence types.
2. **Hunt/Triage:**
* Running predefined or custom rules (YARA, Sigma, osquery) to identify suspicious activities or indicators of compromise on the assets.
3. **interACT Sessions:**
* Establishing a secure remote shell session to manually investigate and interact with the asset in real-time.
4. **Baseline Acquisition and Comparison:**
* Running comparisons to detect deviations from a predefined baseline state of the asset and acquiring baseline data.
5. **Disk/Volume Imaging:**
* Capturing the complete state of disks or volumes for comprehensive forensic analysis.
6. **Auto Tagging:**
* Automatically tagging assets based on predefined criteria for easier management and identification.
7. **Calculating Hash:**
* Generating hash values for files to ensure data integrity and assist in identifying duplicate or tampered files.
8. **Offline Acquisition and Offline Hunt/Triage:**
* Performing data acquisition and triage on assets that are not connected to the network.
### Administrative Tasks
Some more 'administrative' activities also generate tasking assignments and these include:
* **Shutdown, Reboot, and Uninstall:**
* Remotely managing the power state and software configuration of assets.
* **Isolation:**
* Isolating an asset from the network to prevent further compromise.
* **Responder Deployment:**
* Deploying response tools to the asset for immediate action.
* **Purge Local Data and Retry Upload:**
* Managing data on the asset, including purging local data and retrying data uploads.
* **Migration and Version Update:**
* Migrating data between systems and updating software versions.
* **Log Retrieval:**
* Collecting logs for further analysis and troubleshooting.
By understanding and utilizing these task types, users can streamline their incident response and investigation workflows, improving overall security posture and response times.
Tasks are saved at the organization level and can be reviewed comprehensively by navigating to the main AIR menu > Tasks:
Task Creation: Where to review all organization tasks
Individual tasking assignments (one task on one asset) for an asset can also be reviewed by visiting the specific asset. From the secondary menu, you can select "All Tasks" or utilize the filtered tasks view to focus on specific task types.
**Let's now take a look at how to create a Task in AIR**
## Starting an Acquisition
There are two primary ways to begin an acquisition task in AIR:
### Quick Start Action Button
The **Quick Start** action button in the top navigation bar provides rapid access to common actions. The **Acquire Evidence** option now expands into a submenu offering three distinct acquisition paths:
* **From Device** — Acquire evidence directly from connected assets in your fleet
* **From Disk Image** — Acquire evidence from uploaded disk images _(New)_
* **From Cloud** — Acquire evidence from cloud sources _(Coming Soon)_
Task Creation: The Quick Start Action Button
This menu structure guides analysts toward the appropriate evidence acquisition path based on the investigative context—whether targeting live devices, forensic images, or cloud environments.
### From the Assets Page
Alternatively, you can initiate acquisition tasks directly from the **Assets** page by selecting one or more assets and using the action buttons. This approach is ideal when you have already identified specific assets to investigate.
## Step 1 - Assets
**Select the Asset(s)** on which you wish to execute tasks - In the example below we will **Acquire Evidence** from an asset named JackWhite:
Task Creation: The Acquire Evidence Action Button selected for the asset JackWhite
**The Bulk Action Bar** will be available if you choose more than one asset:
Task Creation: The Bulk Action Bar indicating 2 assets selected
## **Step 2 - Setup**
Task Creation: Step 2 - Setup
1. **Optionally specify a Task Name.** If left blank, one will be automatically generated based on the task type, sequence number, and date/time.
2. **Allocate the task to a Case. This is important if you need to build a case for an ongoing investigation and you plan to investigate this asset further or other assets as part of the same investigation.** All investigation activity can be recorded within Cases. A Case can be thought of as a container into which activity for a particular investigation can be grouped, making Incident Response management and investigations easier, especially as the Case will also be presented in the [Investigation Hub](../../investigation-hub/using-the-investigation-hub).
3. Select Now as a **Task Start Time to execute the task immediately.**
4. Choose an **Acquisition Profile** (e.g., Compromise Assessment, Full Acquisition, etc). We offer many ‘out of the box’ profiles, but you can also create and save your own as needed.
:::note
**Acquisition Profile Platform Visibility**\
As shown in the bottom-right of the screenshot above, AIR now displays the supported operating systems, Windows, Linux, or macOS, within each acquisition profile. This helps ensure analysts select valid profiles for the target asset.
:::
## Step 3 - Customization
This step allows you to apply the existing organizational policy or, if you have the appropriate privileges, customize the following settings:
* **Specify where the collected evidence should be saved.** You can choose a local path on the asset—configurable per operating system—or direct the collection to an external evidence repository.
* **Optionally apply resource limits**—including CPU, bandwidth, and disk space—to the task assignment to minimize potential impact on the asset.
* Enable compression and encryption to be applied to the collected evidence.
Task Creation: Customization of options
## Step 4 - Analysis
**In this final step, you can choose to enable or disable the automated DRONE and MITRE ATT\&CK analyzers.**\
We strongly recommend keeping both enabled—they have minimal impact on system resources and provide prioritized threat intelligence to help accelerate your investigations. The MITRE ATT\&CK analyzer runs directly on live assets and, when combined with other analyzers, enables immediate identification of potentially compromised systems. This streamlines your workflow by helping you focus on the most critical areas first.
Task Creation: Toggle options for DRONE, MITRE ATT&CK and AIR analyzers
#### Keyword Searches
**Step 4, ‘Analysis’, also provides the option to add individual keywords or upload keyword list files.**\
This enables DRONE to perform targeted searches, helping investigators conduct more focused and efficient analysis within their evidence collections.
**Keyword Lists Features:**
* No character limit for keyword lists, but a **1 MB file size limit** applies.
* Each keyword must be on a new line for proper search functionality.
* Keyword searches are limited to data within the **Case.db** (excluding CSV files).
* Keyword searches are supported by regex, read more here: [**Regex in AIR**](regex-in-drone)
* This search functionality extends to **event log data** collected by Sigma analyzers, including:
* **Windows**: Event Record Analyzer
* **Linux**: Syslog Analyzer
* **macOS**: Audit Event Analyzer
:::note
Keyword searches are limited to **data within the Case.db** and do not include content within any CSV files prepared by AIR (eg; $mft, $UsnJrnl). Additionally, the search will not cover the contents of files on or collected from the asset.
:::
This feature offers investigators greater flexibility and precision in their searches, significantly enhancing DRONE's capabilities. Regex support will be added soon in an upcoming release.
### **The results of all tasks—and their associated reports—are accessible via the Investigation Hub.**
Links to these reports within the Investigation Hub can be found in the following three locations::
1. Tasks, via the main menu.
2. The page for the individual Asset > Acquisitions.
3. And finally, Case Acquisitions, if the task is sent to a Case.
1\) Accessing the Tasks via the main menu:
Task Creation: Accessing the Task report via Tasks in the main menu
Clicking the ‘eye’ icon in the Actions column opens the Task Details view, where you can access the data associated with the acquisition task via the link to the Investigation Hub.
Task Creation: Accessing the Task report via Task Details
2\) Below we see a report being accessed from the Assets menu:
Task Creation: Accessing the Task report via the Assets menu
3\) And finally a report from the Case Acquisition page but only if you have sent it here:
Task Creation: Accessing the Task report via the Cases menu
---
# Asset Management with Persistent Saved Filters
> Source: https://kb.binalyze.ai/air/features/acquisition/task-creation/asset-management-with-persistent-saved-filters.html
Managing large-scale asset inventories enables users to save and quickly apply custom filters, facilitating efficient asset management.
Persistent Saved Filters enable users to create and store custom asset filters, making it easier to locate and manage assets without having to reapply filter conditions in each session.
:::tip
**Persistent Saved Filters** operate at the organizational level for asset management, meaning any filters you create for asset management will persist only within the organization where they were defined. If you switch to a different organization, those filters will not be visible. This feature is currently limited to asset management and does not apply to other sections of the platform.
:::
### **Key Benefits**
* Users can save custom filters for frequently used asset searches.
* Saved filters allow for quick application, streamlining asset management.
* Bulk actions and asset monitoring can be performed without re-entering filter conditions.
* Quick actions on saved filters enable faster asset selection.
### **How to Use Persistent Saved Filters**
#### **Step 1: Apply Filters to Your Asset List**
Navigate to the secondary menu on the **Assets** page and click the **'+'** icon to create a **Preset Filter**. The **Save Preset Filter** window will open, allowing you to configure a custom **Asset Filter** that remains persistent for your user account.
Asset Management with Persistent Saved Filters: Save Preset Filter
#### **Step 2: C**onfigure a custom **Asset Filter**
Use the filtering options to build a filter to refine the asset list based on criteria such as status, tags, or isolation state.
Asset Management with Persistent Saved Filters: Save Preset Filter
#### **Step 3: Save a Custom Filter**
After applying the desired filter conditions, enter a name for the filter and click **"Save,"** to confirm your selection.
#### **Step 3: Access and Apply Saved Filters**
Select the newly saved filter from the Preset Filters drop down list in the secondary menu to instantly apply it.
Asset Management with Persistent Saved Filters: Apply Saved Preset Filter
#### **Step 4: Manage Saved Filters**
Users can edit or delete their saved filters anytime by clicking the three-dot menu next to the preset filter name. This menu also provides access to **Quick Actions**, enabling bulk operations directly from saved filters.
Asset Management with Persistent Saved Filters: Manage Saved Preset Filters
:::caution
**Important Notes**
Saved filters are per-user, meaning each user can only see and manage their own filters.\
Preset filters remain unchanged; predefined system filters such as Managed Assets and Isolated Assets are still available.\
Filters persist across sessions, ensuring users do not need to reapply them after logging out.
:::
---
# Regex in DRONE:
> Source: https://kb.binalyze.ai/air/features/acquisition/task-creation/regex-in-drone.html
When performing keyword searches in DRONE, you can leverage regular expressions (POSIX regex) for more flexible and advanced search capabilities. Here’s how it works:
#### 1. **Regex Search Format**:
To use regex, your keyword must be enclosed between `/ /` slashes. For example:
* `/\d+/` – This will search for one or more digits.
* `/[a-z]+/i` – This will search for one or more lowercase letters and is **case-insensitive** (thanks to the `i` flag).
You can also include optional flags at the end of the regex to modify its behavior:
* **g**: Global (search all occurrences).
* **m**: Multiline (match across multiple lines).
* **i**: Case-insensitive (ignore letter case).
* **s**: Dot matches newline (dot `.` will match any character, including newlines).
**Example**:\
`/[A-Z]+\d+/i` – This will match sequences like "ABC123" or "abc123" regardless of case.
#### 2. **Wildcard Search**:
If your search contains wildcard patterns like `*?` (indicating lazy quantifiers), it will be treated as a **wildcard search** instead of a regex search.
* For example, `abc*?` will match "abc", "abcd", "abcxyz", etc.
#### 3. **String Contains Search**:
If your input doesn’t match the regex format and doesn’t contain wildcard symbols, DRONE will perform a **case-insensitive "string contains" search**.
* For example, searching for `example` will return results containing "example", "Example", or "EXAMPLE".
---
# Task Cancellation and Deletion
> Source: https://kb.binalyze.ai/air/features/acquisition/task-creation/task-cancellation-and-deletion.html
### Viewing and Managing Tasks
All tasks within AIR can be centrally managed at the organizational level from a dedicated **Tasks** page. This view is accessible from the **Main Menu** by selecting **Tasks**.
From this interface, users can:
* View a **comprehensive list of all tasks** associated with the currently selected organization.
* Filter and monitor tasks across their lifecycle, including those that are:
* **Completed**
* **In progress**
* **Cancelled**
* **Failed**
This consolidated view is essential for maintaining operational oversight and ensuring that investigation and response workflows are being executed as expected.
For each task, detailed information such as task type (e.g., acquisition, triage, timeline generation), status, and associated endpoints is available, allowing for granular tracking and auditability.
The blue **‘eye’** icon at the end of each task entry allows users to view detailed information about the task.
Task Cancellation and Deletion: Details icon
In the **Task Details** window, there are two tabs: **Information** and **Assigned To**. The **Information** tab displays details such as the creator of the task, the policy applied, the DRONE analyzers used, and the selected acquisition profile.
Task Cancellation and Deletion: Task Details
The **Assigned To** tab provides information about the assets to which the task has been assigned. For each asset, an **Actions** menu is available, enabling investigators to:
* **Delete the task**
* **Purge local data** from the endpoint
* **Add the data to a case**
* Note: Data can be added to multiple cases simultaneously
* **Send the data to a timeline** for correlation and analysis
* **Use the collected data to perform a Compare task** against other acquisitions
Task Cancellation and Deletion: Options avaiable under Actions
## Bulk Task Cancellation and Deletion
Managing large volumes of tasks is now faster and more efficient with the introduction of **Bulk Task Cancellation** and **Bulk Task Deletion** capabilities.
### Bulk Task Cancellation
Users can now cancel one or more tasks directly from the **Tasks** view using the familiar **bulk action toolbar**. This is particularly useful for streamlining task management across environments with high automation or frequent testing.
Key features include:
* Full support for **advanced filtering**, allowing users to quickly identify tasks based on:
* Task type
* Task name
* Source
* Status
* As seen below, once tasks are selected, the bulk action bar automatically appears, displaying a task count (this count reflects the number of tasks selected, not the number of affected assets).
Task Cancellation and Deletion: Bulk actions
Selecting **Cancel Task** will cancel both the **Assigned** and **Processing** tasks listed above as soon as the user selects 'Yes' in the warning message that appears:
Task Cancellation and Deletion: Warning message
Both tasks will then be marked with the status **“Cancelled.”**
Task Cancellation and Deletion: Task cancelled
### Bulk Task Deletion
In addition to cancellation, users can now delete multiple tasks in one action. When selecting the **Delete Tasks** option from the bulk action bar, two deletion modes are available:
* **Delete Task Only**\
Removes the task from the console, but leaves any associated data intact on the endpoint.
* **Delete and Purge Local Data**\
Deletes the task and removes all associated local data from the target asset(s).
Task Cancellation and Deletion: Bulk operations
***
:::caution
**Confirmation Warning for Large-Scale Tasking**
:::
To safeguard against unintentional bulk operations, AIR now includes an automatic confirmation prompt when tasking operations affect **70% or more of your assets**.
#### How It Works
Whenever a task—such as **isolation**, **acquisition**, or **triage**—is configured to target a large portion of your asset inventory, AIR will **pause execution** and display a confirmation dialog. This gives you a chance to review and confirm the action before it proceeds.
This safeguard also applies to **API-based tasking**, providing an additional layer of protection for automated workflows.
#### Benefits
* **Accidental Prevention**\
Prevents disruptive actions, such as isolating thousands of endpoints due to misconfiguration or scripting errors.
* **Operational Awareness**\
Reinforces deliberate decision-making before initiating potentially high-impact operations.
* **Consistent Safety**\
Applies equally to both console-initiated and API-triggered tasks.
> This feature ensures safer operation at scale, giving you greater confidence when managing thousands of assets in AIR.
---
# Auto Tagging & Tags
> Source: https://kb.binalyze.ai/air/features/auto-tagging-and-tags/index.html
## Overview
Conducting cybersecurity investigations and digital forensics at scale requires a well-structured classification of your assets.
Understanding the number and types of assets, such as web servers, domain controllers, or application servers, significantly reduces response time. This enables you to focus on specific groups of devices within your network, ultimately enhancing situational awareness during an investigation.
## How it works
Auto Tagging is a feature of AIR that lets you automatically tag assets based on conditions such as:
* Existence of a file or directory
* Existence of a running process
* Hostnames, IP addresses, and Subnets
* Custom osquery conditions
Additionally, you can seamlessly combine conditions using AND/OR logic alongside environment variables for greater flexibility.
This feature can be enabled or disabled from the Auto Asset Tagging section in `Settings>Features>Auto Asset Tagging.`
Once enabled, any newly added asset will automatically be assigned a task to query the Auto Tagging conditions. Based on the results, AIR will apply the appropriate Tag Name to the asset.
If you need to re-run tagging on all assets, you can do so by clicking the "Run Now" button on the Auto Tagging page. Alternatively, you can run the tagging process for individual assets from the Asset page or select multiple assets and execute the task using the Bulk Action feature.
Auto Tagging can be saved in AIR Libraries, specifically for individual organizations or universally across all organizations. This capability enables users to create and apply incident-specific Auto Tags selectively, thereby avoiding unnecessary use or exposure of a rule outside the intended organizational context.
There are a number of out-of-the-box supported Auto Tags such as those listed below, but as we now know, you can also create custom tags whenever you need them:
* Apache
* Redis
* Mysql
* Rabbitmq
* Docker
* Kubernetes
* Domain Controller
* IIS Web Server
* Web Server
* Mail Server
* MSSQL Server
When we examine the Auto Tag conditions set for tagging an Apache Server, we can see that the AIR Responder will evaluate five conditions, all of which are independent of each other, as the OR switch is active. So, if any one of these conditions exists, the Apache Tag will be applied to the asset:
Auto Tagging & Tags: Conditions
It is possible for a user to create, edit, and delete the parameters shown below, but only if they have permission to do so:
Parameter
Matching Criteria
Value
Process
Running / Not Running
Process name or wildcard
File
Exists / Not Exists
File name or wildcard
Directory
Exists / Not Exists
Directory name or wildcard
Hostname
Is / Contains / Start With / End With
Hostname or wildcard
IP Address
Is / Contains / Start With / End With
IP Address or wildcard
Subnet
Is / Contains / Start With / End With
Subnet or wildcard
osquery
osquery format supported
osquery format supported
AIR has very granular permission control over Users and Roles, and within Roles, there are currently over 114 individually configurable privileges. Six of these allow Global Administrators to determine what users can do within the Auto Asset Tagging feature:
Auto Tagging & Tags: User Privileges
:::tip
Read more about how AIR uses **Auto Tagging** to speed up your investigations here:\
[**The Power of Auto Asset Tagging in DFIR**](https://www.binalyze.com/blog/dfir-lab/the-power-of-auto-asset-tagging-in-dfir)
:::
Any Auto Tags used in a Tasking Assignment are displayed under the Information tab in the Task Details window. In the example below, we can see that the Tagging Rule for Domain Controller has been run along with 17 others that are related by clicking on the ‘**+17**’ link:
Auto Tagging & Tags: AAT rules run in a task shown in Task Details
---
# Tags
> Source: https://kb.binalyze.ai/air/features/auto-tagging-and-tags/tags.html
When you need to perform actions on multiple assets, the **Tagging** feature makes management easier by allowing you to group assets based on assigned tags. This helps streamline bulk operations and improves visibility across your environment.
AIR supports tags in three complementary ways:
- **Asset Tag Catalog** — create and manage your organization's tag vocabulary in Libraries, before or without assigning tags to assets.
- **Manual tagging** — assign or remove tags on selected assets from the Assets page.
- **Auto (Asset) Tagging** — automatically tag assets when rules match (for example after AIR Responder deployment). Auto Tagging can also be re-run at any time to reflect changes or updates. See the previous page for Auto Tagging rules.
:::note
You can add multiple tags to a single asset.
:::
## Asset Tag Catalog
The **Asset Tag Catalog** is the organization-scoped library of tag names available in AIR. Use it to prepare taxonomy ahead of investigations, keep naming consistent, and manage tags without first attaching them to assets.
### Open the catalog
1. Go to **Libraries** in the main menu.
2. Select **Asset Tags**.
The catalog lists tags for your selected / authorized organizations, including:
- Tag name
- **Assigned Assets** count
- Created date
### Create a tag in the catalog
1. Open **Libraries → Asset Tags**.
2. Click **Add New**.
3. Enter a tag name and select the organization (when more than one organization is available).
4. Save.
The new tag appears in the catalog with **Assigned Assets** set to `0`, and becomes available in the Assets sidebar and when assigning tags to assets.
Tag names must be unique **within each organization**. The same name can exist in different organizations.
### Rename a tag
1. In **Libraries → Asset Tags**, open the row actions menu (**⋯**) for the tag.
2. Choose **Edit Tag**.
3. Enter the new name and save.
Renaming updates the catalog entry and updates that tag name on assets that already use it (for the same organization). Filters and sidebar labels then use the new name.
:::tip
You can also rename a tag from the Assets page sidebar: hover the tag, open its actions menu (**⋯**), and choose **Edit Tag**.
:::
### Delete tags
Deleting a catalog tag permanently removes it from the organization catalog and removes it from any assets that had it assigned. The assets themselves are not deleted.
**Single delete**
1. Open the row actions menu (**⋯**) for the tag.
2. Choose **Delete** and confirm.
**Bulk delete**
1. Select one or more tags with the checkboxes.
2. In the bulk action bar, choose **Delete** and confirm.
### Jump to assets that have a tag
In the catalog, click the **Assigned Assets** count for a tag. AIR opens the Assets view with that tag filter applied, so you can review matching assets and run acquisition, triage, or other tasks on the filtered set.
## Create and manage tags from the Assets sidebar
On the Assets page, the left-hand **Tags** tree shows the catalog for the current organization context.
### Create a tag from the sidebar
1. Go to **Assets**.
2. In the Tags section header, open the actions menu (**⋯**).
3. Choose **New Tag**, enter a name, and save.
The tag is added to the catalog and appears in the sidebar immediately—even if no assets are assigned yet.
### Filter assets by tag
1. Expand the Tags section in the Assets sidebar.
2. Select a tag to filter the asset list to assets that have that tag.
You can then apply acquisition, triage, or other tasks to the filtered assets.
## Assign tags to assets (manual tagging)
To create Tags for your assets—or assign existing catalog tags:
1. Navigate to **Assets** in the Main Menu and select the assets to which you want to assign tags.
2. Open the add/remove tags dialogue. Search the drop-down list for an existing Tag, or type a new Tag name and click **Add this as a new tag**.
Tags: Adding a new Tag (for example rm2)
3. From the same dialogue box, you can remove Tags from the selection by selecting the cross.
4. After tags are assigned, filter your assets by tag (sidebar or filters) to view specific groups and apply relevant acquisition or triage tasks just to them.
Typing a new name during assignment also adds that tag to the organization's Asset Tag Catalog.
## Auto Tagging and the catalog
When you create or update an **Auto Asset Tag** rule, AIR also ensures the rule's tag exists in the Asset Tag Catalog for the organizations covered by that rule:
- If the rule targets specific organizations, the catalog tag is created for those organizations.
- If the rule applies to all organizations, the catalog tag is created for every organization.
That means rule-defined tags show up in **Libraries → Asset Tags** and the Assets sidebar as soon as the rule is saved—without waiting for the first matching asset.
For how Auto Tagging rules work and when they run, see the Auto Tagging page in this section.
## Quick reference
| Goal | Where |
| --- | --- |
| Pre-create or manage tag names | **Libraries → Asset Tags** |
| Create a tag without leaving Assets | Assets sidebar → Tags → **⋯** → **New Tag** |
| Rename a tag | Catalog row **⋯** → **Edit Tag**, or Assets sidebar tag **⋯** → **Edit Tag** |
| See assets that have a tag | Catalog **Assigned Assets** count, or select the tag in the Assets sidebar |
| Assign / remove tags on assets | Assets page → select assets → add/remove tags dialogue |
| Auto-apply tags by rule | Auto Tagging (previous page); rule save also creates the catalog entry |
---
# Chain Of Custody
> Source: https://kb.binalyze.ai/air/features/acquisition/chain-of-custody.html
At AIR, we use **SHA-256** to hash all of the files collected by AIR, and then we take this to the **next level**. We achieve this by further hashing our .ppc collection file and sending that value to a Trusted Timestamp Server to generate a certificate.
This not only proves that the report and all of the data associated with it exist exactly as it did on acquisition, but it did so at the date and time notarized by a Trusted Timestamp Authority (TSA) certificate.
Thanks to RFC3161, you can not only prove that the data content is 100% intact, but also that the date and time of collection are guaranteed.
### Trust in RFC 3161
Request for Comments (RFC) is a system that has been adopted as the official documentation of Internet specifications, communications protocols, procedures, and events. Used initially to record unofficial notes related to the ARPANET project in 1969, the system is now considered a standard-setting body for the Internet and its connected systems.
A published RFC will undergo a review and revision process, overseen by several groups, including the Internet Engineering Task Force (IETF), a large, open international community of network designers, operators, vendors, and researchers. As part of their collective role, they review the evolution of everything related to the development of internet architecture and the smooth operation of the internet. A list of RFC 3161-compliant Time Stamping Authorities (TSAs) can be found [here.](https://gist.github.com/Manouchehri/fd754e402d98430243455713efada710) When choosing TSAs, users may want to consider whether their implementation of RFC 3161 has been qualified by organizations such as eIDAS (Electronic Identification and Trust Services).
RFC3161 defines how trusted timestamping leverages public-key cryptography and the Internet X.509 Public Key Infrastructure Time-Stamp Protocol (TSP) sets the required protocols for standardization.
One way to use a TSA allows a requestor to take the hash they’ve generated for the total of their collected data set, send that hash to the TSA, and receive in return a Timestamp Request Token (TST). This TST can be saved and, at any later time, used to verify both the content of the collection and the date and time at which the collection took place.
The RFC 3161 capability is not unique and is available from a whole range of independent third parties. This is important as any in-house time-stamping process could be open to challenge or criticism due to its lack of independence or verified accuracy.
### How does this work in AIR?
In the AIR platform, when you send a collection task to an asset's responder, the responder will build the collection on the asset in a directory named ‘Cases’. This collection is in a .zip file, with a filename that starts with the date and time of the collection. If you expand the .zip file, you’ll note that the collected data has been added while maintaining the directory tree structure. This is good news if you want or need to further investigate the collection in other forensic solutions.
Chain of Custody: Collection directory structure
At the root of the collection shown above, you can see the Case.ppc file. This is another .zip container, and if you expand this, you can inspect the contents.
The hash values for the collected files are available in the Investigation Hub, from where they can be exported as a .csv file:
Chain of Custody: Hashes of acquired files are located in the Investigation Hub
With AIR, RFC 3161 timestamping is enabled by default. This means the hash value of your collection. ppc file is sent to the TSA, and their TST response is automatically saved as metadata for that collection in the AIR console. You can download and verify the TST from here at any time you or others need to.
Chain of Custody: Metadata button reveals RFC 3161 download
You can also disable the RFC3161 Timestamping functionality at any time via the AIR Settings > Features page.
### How to verify the .ppc via the RFC 3161 Timestamp Token
To verify the .ppc via RFC 3161, the first step is to download the TST from the metadata button in the AIR asset details > Task tab (as shown in the screenshot above, labeled "Metadata button reveals RFC 3161 download").
In the example below we have changed the name of the TST to ‘RFC3161 timestamp.tsr’ and saved it to the downloads folder.
We can then open a shell session and change the directory to the downloads folder.
To see the information in the TST Run: `openssl ts -reply -in RFC3161\ timestamp.tsr -token_in -token_out -text` and in the output, you’ll see the hash of your .ppc and the Timestamp
Chain of Custody: openssl used to view ppc hash and timestamp
To verify this TST, we now need to download the root certificate from a TSA: [https://cacerts.XXXX.com/XXXXtAssuredIDRootCA.crt.pem](https://cacerts.digicert.com/DigiCertAssuredIDRootCA.crt.pem).
We will also need the following TSA certificates from the TSA server to build a ‘chain certificate’. In this case, I took the content of each .cer file, in the order shown, and concatenated them into one file that I named ‘CHAIN.pem’.
[TSACertificate.cer](https://knowledge.digicert.com/content/dam/digicertknowledgebase/attachments/time-stamp/TSACertificate.cer)
XXXX[TrustedG4RSA4096SHA256TimeStampingCA.cer](https://knowledge.digicert.com/content/dam/digicertknowledgebase/DigiCertTrustedG4RSA4096SHA256TimeStampingCA.cer)
XXXX[TrustedRootG4.cer](https://knowledge.digicert.com/content/dam/digicertknowledgebase/DigiCertTrustedRootG4.cer)
With all these files remaining in the same directory, I then ran the following command to verify the TST: `openssl ts -verify -CAfile XXXXAssuredIDRootCA.crt.pem -untrusted CHAIN.pem -data TASK.ppc -in RFC3161\ timestamp.tsr -token_in`
Chain of Custody: openssl with certificate chain used to verify TST
This simple verification ‘ok’ message confirms that the TST is correct, indicating that my data is sound and that it existed at the date and time shown by the timestamp
### Conclusion - Robust best practice
Thanks to the RFC 3161 and SHA-256 hashing features of AIR, it’s now possible to prove that not only is your data content 100% intact but that it existed at a particular moment in time. So we can now be sure that we know exactly what was collected and when it was collected. In short, RFC 3161 provides immutable timestamping for an effective chain of custody to maintain forensic integrity.
Chain of Custody: Process flow to receive a TST in AIR
---
# Compare
> Source: https://kb.binalyze.ai/air/features/compare.html
## Baseline analysis with Compare
The Compare feature enables proactive forensics through baseline analysis, allowing investigators to focus on forensic evidence from the earliest stages of an investigation. Using a patent-pending approach, it identifies and highlights forensic artifacts—added, modified, or deleted—between asset snapshots.
This analysis, completed in just 5 seconds, enhances security by addressing vulnerabilities before they can be exploited, without disrupting ongoing operations. The Compare feature supports both standard and offline acquisitions, providing detailed metadata to help investigators comprehensively understand potential security risks.\
Compare analysis is performed directly on the Console, eliminating the need for direct access to assets.
The scope of baseline analysis is strategically based on areas commonly abused by attackers. These include:
macOS
Linux
Windows
AutoLoadedProcs
System
System
ChromeExtensions
CronJobs
NetworkAdapters
DiskEncryptions
DNSResolvers
Hosts
ETCHosts
Hosts
AutorunsServices
ETCProtocols
IPRoutes
AutorunsRegistry
ETCServices
IPTables
AutorunsScheduledTasks
GatekeeperApps
KernelModules
AutorunsStartupFolder
InstalledApps
Mounts
InstalledApplications
KextInfo
NetworkInterfaces
Drivers
LaunchdOverrides
SystemArtifacts
FirewallRules
SipStatus
Users
SysExtInfo
### How to Use Baseline Analysis with Compare
1. **Select the Asset for analysis.**
2. **Initiate Compare Task:**
* Navigate to 'Compare' under Asset Actions.
Compare: Initiating Compare Analysis under Asset Actions
3. **Specify the Acquisitions to Compare**
* Specify two acquisitions to compare or create a new baseline by clicking "Acquire Baseline".
Compare: Selecting Acquisitions to Compare
4. **Review the Results**
* Once the task is complete, review the results DRONE report.
Compare: Reviewing Results
* Explore the fine-grained details on the property level.
Compare: Explore items Added, Changed, Deleted
5. **Integrate with Investigations:**
* Leverage the insights gained from the comparison analysis to compare and inform ongoing digital investigations.
By incorporating Baseline Analysis with Compare into the DFIR process, you empower your team with a proactive and efficient approach to identifying and mitigating potential security risks. This feature is a valuable asset in maintaining a robust cybersecurity posture.
---
# Console Audit Logs
> Source: https://kb.binalyze.ai/air/features/console-audit-logs.html
## Overview
The Audit Log feature is designed to provide detailed and comprehensive logging information about all actions performed within the platform. This ensures a solid' chain of custody’, transparency, and accountability, and it also supports investigations by maintaining a clear record of all activities.
The Audit Logs can be searched, filtered, and exported at the Organization level.
Audit Logs are accessed via the Activity button in the main menu and then from Audit Logs in the secondary menu:
Console Audit Logs: Activity > Audit Logs
Each log entry can have additional properties to view, such as what individual interACT command was run and by whom:
Console Audit Logs: Expand log entry
:::note
**Important to know:**
The audit log retention policy is designed to optimize platform performance and data management. Users are encouraged to regularly back up their audit logs to prevent data loss.
:::
### Audit Log Retention
* **Exporting Logs:** As of version 4.19, when exporting audit logs from the console user interface, only logs from the last three months will be included in the export.
* This ensures that users will always have access to the most recent audit logs in the UI while maintaining the ‘historical logs’.
Information about the retention policy is displayed on the Audit logs page in the Tool Tip as shown below:
Console Audit Logs: Warning tooltip
This message says, "Audit logs are retained for 3 months from the date of creation and will be automatically deleted after this period."
The Audit Log advanced filter date and time selection columns are limited to the last 3 months:
Console Audit Logs: Advanced filter
### Audit Log Export
There are three options to export your Audit Logs:
* **Export Logs:** Export the logs directly from the console’s Audit Log page.
* **Send Logs to Syslog Server:** Utilize the feature in settings to send logs to your Syslog Server.
* **Use the API:** Refer to our API documentation to retrieve Audit Logs.
See below:
At the **Organization level,** users can search and filter audit logs within the Console and easily export them in CSV format.
To do this, use the Export button located at the top right corner of the user interface. This action will generate a ZIP file containing the filtered audit logs in CSV format, making it convenient for further analysis and record-keeping:
Console Audit Logs: Search, Advanced Filter, and Export options
### Syslog/SIEM Integration
When **Syslog / SIEM Integration** is enabled under **Settings > Features > Syslog / SIEM**, events transmitted to your Syslog server or SIEM are sent as **Common Event Format (CEF)** messages.
Administrators can choose how much event data is streamed: **send all events** (default), **include only selected event types**, or **exclude specified event types**. This helps security operations teams keep SIEM feeds concise and actionable while still ensuring critical activities can be forwarded when your configuration requires it.
Analytics in the Console also surfaces adoption metrics for Syslog filtering, helping administrators review how the feature is used after configuration changes.
Console Audit Logs: Integrated with Syslog/SIEM
## Audit Logs via the API
The API can be used to export your audit logs - for documentation visit: [https://docs.binalyze.com/air/api#5bc2d708-51b9-4fec-abbd-2fe2f6220dd9](https://docs.binalyze.com/air/api#5bc2d708-51b9-4fec-abbd-2fe2f6220dd9)
Console Audit Logs: Audit Logs via the API
---
# Disk Image Evidence Acquisition
> Source: https://kb.binalyze.ai/air/features/disk-image-evidence-acquisition.html
AIR can be used to acquire forensic evidence directly from full disk or volume images in the **RAW (dd), EWF (E01/Ex01), VHD/X, or VMDK formats**. Instead of manually mounting and parsing an image, AIR extracts the forensic artifacts and timeline events you select and makes them available for investigation in the console - the same evidence experience you get from a live asset.
Evidence is acquired using **Plaso (log2timeline)**, the industry-standard forensic timeline engine. AIR runs Plaso against the disk image with the parsers, paths, and filters defined in your Acquisition Profile, reading the image without modifying it, and packages the extracted events as a case file that is imported into the console.
Two acquisition methods are available, so you can choose the best fit for where your disk image lives:
* **Over the Network**: AIR runs acquisition over the network and imports the result automatically. Best for disk images already added to AIR from an evidence repository.
* **Off-Network**: Fastest option for local disk images. Run acquisition locally on the machine that can access the disk image, then upload the result to AIR.
Disk Image Evidence Acquisition: Quick Start - Acquire Evidence - From Disk Image
:::note
Disk Image Evidence Acquisition is currently a **Preview** feature. The wizard is available from the Quick Start menu and from Disk Image assets when the feature is enabled for your console.
:::
## Prerequisites
* For **Over the Network** acquisition, the disk image must first be added to AIR as a **Disk Image asset** from your **SMB, SFTP, Amazon S3 bucket, Azure Blob storage, or Google Cloud Storage** evidence repository; segmented files are supported - select the first segment of the image. See the [File Explorer](file-explorer/README.md) documentation for the three-step 'Add New' asset process.
* For **Off-Network** acquisition, no evidence repository is needed - you only need a machine (currently Windows 64-bit) that can access the disk image file locally.
Disk Image Evidence Acquisition: Disk Image assets
## Disk Image Acquisition Profiles
An **Acquisition Profile** defines what evidence is extracted from the disk image. AIR ships with two system profiles:
* **Full**: Parses all files on the image.
* **Smart**: A curated selection of forensically valuable paths and evidence types (over 1,900 paths and 219 evidence types), offering the best balance of speed and coverage.
You can also create your own profiles. From the Main Menu, select **Libraries**, then select **Disk Image Acquisition Profiles** from the Secondary Menu and click **'+ Add New'**:
* **Parse All Files**: Process every file on the image instead of a filtered selection.
* **Path or pattern**: Enter a path or pattern to select files or folders you want to include. You can use wildcards to match multiple files or locations at once.
* **Image Evidence Collection (Plaso)**: Select the evidence types (parsers) to run against the matched files.
Disk Image Evidence Acquisition: Disk Image Acquisition Profiles library
Disk Image Evidence Acquisition: Editing an Acquisition Profile
## Acquiring Evidence Over the Network
With over-the-network acquisition, AIR connects to the evidence repository holding your disk image, runs the acquisition, and imports the result automatically - no manual steps after starting the task.
1. From the Quick Start menu, select **Acquire Evidence**, then **From Disk Image**. Alternatively, open a Disk Image asset and select **More Actions** > **Acquire Evidence** > **Over the Network**, or select multiple images from the Disk Images table and use the bulk **Acquire Evidence** action:
Disk Image Evidence Acquisition: Acquire Evidence from a Disk Image asset
2. In the **Acquisition Method** step, select **Over the Network** and choose one or more Disk Image assets from the **Asset Selection** table, then click **Next**:
Disk Image Evidence Acquisition: Select assets for over-the-network acquisition
3. In the **Setup** step, configure the task and click **Start**:
* **Task Name**: Leave empty to auto-generate.
* **Case**: Optionally associate the acquisition with a case.
* **Acquisition Profile**: Select **Full**, **Smart**, or one of your custom profiles.
* **Evidence Collection Period**: Select the time range for evidence collected from the disk image.
* **File Limits**: Select which files to include by Created, Accessed, or Modified date (**File Dates Range**), and skip files larger than the **Max File Size** (250 MiB by default).
Disk Image Evidence Acquisition: Setup step for over-the-network acquisition
Disk Image Evidence Acquisition: Selecting an Acquisition Profile
:::caution
Acquisition runs over the network, so speed depends on your connection. Large disk images may take a long time to complete.
:::
The task appears under **Tasks** with the type **Disk Image Acquisition**. You can follow its progress as AIR enumerates and scans the files on the image. Completed acquisitions are listed on the asset under **Tasks** > **Acquisition**, where the acquired evidence can be downloaded or opened for investigation:
Disk Image Evidence Acquisition: Completed acquisition tasks on a Disk Image asset
## Acquiring Evidence Off-Network
Off-network acquisition is designed for disk images that AIR cannot reach - for example, an image sitting on an analyst workstation, an air-gapped lab machine, or a host without connectivity to the AIR Console. AIR prepares a portable acquisition package; you run it next to the image and bring the result back to the console.
### Creating the Off-Network task package
1. From the Quick Start menu, select **Acquire Evidence**, then **From Disk Image**. **Off-Network** is the default **Acquisition Method**.
2. Keep **Include Acquisition Binary** selected to include the binary in the download. Clear it only if the target machine already has the latest binary. Click **Next**:
Disk Image Evidence Acquisition: Off-Network acquisition method
3. In the **Setup** step, configure the **Task Name**, **Acquisition Profile**, **Evidence Collection Period**, and **File Limits** exactly as you would for an over-the-network task, then select **Download Task** or **Share Task**:
Disk Image Evidence Acquisition: Off-Network setup with Download Task and Share Task
* **Download Task** downloads the Off-Network Disk Image Evidence Acquisition package as a zip file directly.
* **Share Task** generates a download link you can pass to the analyst who will run the acquisition.
:::caution
The Off-Network Disk Image Evidence Acquisition package shared via **Share Task** will be available to anyone with the link. No authentication is required. Handle the package securely - the task file contains the acquisition configuration for your case.
:::
Disk Image Evidence Acquisition: Package download and next steps
### Running the acquisition locally
The package contains a **Task.dat** file (the acquisition configuration created by the AIR Console), the acquisition binary together with a **prebuilt Plaso runtime**, and a README. The Plaso runtime ships inside the package and is used directly by the acquisition binary, so nothing needs to be installed on the target machine - no Python, no separate Plaso setup.
1. Extract the package to a directory on a host that can access the disk image.
2. Run the acquisition binary with a double-click or from a Terminal. The program reads the **Task.dat** file located in the same folder as the executable.
3. When prompted, enter the absolute path to the disk image (.vhdx / .E01 / .dd / ...). You can also pass the path on the command line to skip the prompt:
```bash
galileo_windows_amd64.exe --image-path "D:\Evidence\workstation01.E01"
```
The binary launches the bundled Plaso engine against the disk image; the image is read directly and never modified, and no files from it are extracted to disk. Progress is printed in the Terminal while the acquisition is running. When it finishes, the result is written as a case file (`Case.ppc`) to a timestamped folder next to the executable (use `--output-dir` to change the location).
:::note
**Tool Tips for Off-Network acquisition:**
* **Segmented images**: Point the binary at the first segment of the image (e.g. `.E01` or `.001`); the remaining segments are picked up automatically.
* **BitLocker-protected volumes**: Place a file containing the recovery password next to the image, named by appending `.key` to the image file name (e.g. `image.vhdx.key`), before starting the acquisition.
:::
### Importing the result into AIR
1. Return to the AIR Console and open the **Disk Image Off-Network** page (also linked from the wizard's **Next steps** as 'adding a new disk image' or 'selecting an existing disk image').
2. Optionally select a **Case**, then drag the result file into the import area or click browse (supports **.ppc** and **.zip**).
3. Click **Import**. The result is imported as a Disk Image asset, and the task appears as **Offline Disk Image Acquisition** on the asset - the acquired evidence is then available in the console, the same as an over-the-network acquisition.
Disk Image Evidence Acquisition: Disk Image Off-Network import page
## Notes and Limitations
* The off-network acquisition binary is currently available for **Windows (64 Bit)**.
* Hash calculation is unavailable for off-network disk images because the source image is not reachable by AIR.
* The off-network task package never contains evidence repository credentials - only the acquisition configuration (evidence types, paths or patterns, date ranges, and file limits).
* Over-the-network acquisition requires the Disk Image asset to be **Managed**, i.e. reachable through its evidence repository.
---
# DRONE
> Source: https://kb.binalyze.ai/air/features/drone/index.html
[What is DRONE?](what-is-drone)
[What is an Analysis Pipeline?](what-is-an-analysis-pipeline)
[Server-side DRONE Analysis](server-side-drone-analysis)
[Analyzers](analyzers)
[DRONE Integration in Tornado](../tornado-preview-version/tornado-drone-integration)
[MITRE ATT&CK Analyzer changelog](mitre-att-and-ck-analyzer-changelog)
---
# What is DRONE?
> Source: https://kb.binalyze.ai/air/features/drone/what-is-drone.html
DRONE is AIR's automated compromise assessment feature, providing a powerful decision support system to accelerate security investigations. It automatically analyzes collected evidence and live assets using a library of always-up-to-date analyzers maintained by the Binalyze threat hunting team.
DRONE can be executed in multiple operation contexts:
* **Responder-side (Assets)**: Analysis takes place via the Responder on the asset as part of an evidence collection or threat hunt.
* **Server-side (Console)**: Previously collected evidence is analyzed or reanalyzed directly on the AIR database server, without any requirement to reconnect to the original asset. Learn more in [Server-side DRONE Analysis](server-side-drone-analysis).
* **Tornado-integrated (Cloud Evidence)**: In Tornado workflows, DRONE analyzes collected cloud evidence locally in the Tornado application and packages findings into the case output for downstream investigation workflows. Learn more in [DRONE Integration in Tornado](../tornado-preview-version/tornado-drone-integration).
By automatically classifying findings as High, Medium, Low, or Matched, DRONE pinpoints anomalies and potential indicators of compromise, dramatically reducing investigation time and effort.
Read more about DRONE, AIR’s built-in automated compromise assessment technology here: [**Automated Compromise Assessment with DRONE**](https://www.binalyze.com/blog/dfir-lab/automated-compromise-assessment-with-drone)
---
# Server-side DRONE Analysis (Run DRONE Anytime)
> Source: https://kb.binalyze.ai/air/features/drone/server-side-drone-analysis.html
import Embed from '@/components/Embed.astro';
## Overview
Server-side DRONE Analysis enables investigators to run or re-run DRONE analysis **entirely on the AIR Console** against previously collected evidence, without requiring live connectivity to the original asset. This capability allows analysts to retrospectively analyze evidence (PPC files or off-network imports) using the latest DRONE analyzers, keywords, and detection logic, while preserving forensic integrity and investigative continuity.
This feature is particularly valuable when DRONE analysis was not enabled during the original acquisition, when evidence is collected from resource-constrained or offline assets, or when updated threat intelligence needs to be validated against historical evidence.
Within the AIR user interface, this capability is exposed as **Re-Analyze** on the Investigation Hub case Dashboard page as shown in the following demonstration:
---
## What is Server-side DRONE Analysis?
Server-side DRONE Analysis is a DRONE execution mode that operates exclusively on **already collected evidence** stored within a case. Instead of executing analyzers on the responder during acquisition, DRONE processors run on the AIR Console and analyze the existing PPC evidence package.
Key characteristics:
* No connection to the asset or responder is required
* Analysis is performed against stored evidence
* Results are written back into the original case
* Existing findings are preserved and extended, not duplicated
This approach decouples evidence acquisition from analysis, giving investigators flexibility over *when* and *where* DRONE analysis is performed.
---
## When should this be used?
Server-side DRONE Analysis is designed for several common investigative scenarios:
### DRONE was not enabled during acquisition
Investigators may choose to skip DRONE during acquisition to:
* Minimize acquisition time
* Reduce responder CPU usage
* Quickly access raw evidence first
Server-side DRONE Analysis allows DRONE to be executed later without re-acquiring evidence.
This enables DRONE findings to be generated even if the original asset is no longer reachable, with any live-asset-only analyses excluded.
### Retrospective analysis with updated detections
As DRONE analyzers, YARA rules, and keyword logic evolve, investigators may need to:
* Validate new threat intelligence
* Re-assess older cases
* Perform retrospective threat hunting
Server-side DRONE Analysis allows existing evidence to be re-processed using the latest detection logic.
### Resource-constrained assets
For older or low-spec systems where responder-side DRONE execution may be undesirable, evidence can be collected quickly and analyzed later on the AIR Console, which typically has greater CPU and memory resources.
---
## How it works
### Running DRONE analysis on off-network (imported) evidence
Server-side DRONE Analysis fully supports **off-network evidence imports**, such as PPC files collected using standalone or offline collectors.
When importing evidence into AIR:
1. Navigate to the relevant case
2. Select **Import Evidence** and upload the PPC (or supported archive)
3. During the import workflow, enable the option to **Run DRONE Analysis**
4. Complete the import
When this option is selected, DRONE analysis is automatically executed **on the AIR Console** against the imported evidence once ingestion is complete. No connection to the asset or responder is required at any stage.
This allows investigators to immediately generate DRONE findings for offline or air-gapped collections, or for evidence acquired outside of a live AIR deployment.
---
1. Evidence is acquired or imported into a case (PPC or supported archive)
2. The investigator selects **Run DRONE Analysis** from:
* The Investigation Hub
* Task details
* Off-network evidence import flow
3. DRONE processors execute on the AIR Console against the stored evidence
4. Findings are generated and written into the existing case context
A visual indicator in the UI shows when server-side DRONE analysis is in progress.
---
## What analyses are supported?
Server-side DRONE Analysis runs all DRONE analyzers that are compatible with evidence-only processing.
### Supported
* Keyword-based analysis (text, regex, wildcard)
* Server-side DRONE analyzers
* Evidence scoring and prioritization
* Findings correlation within the case
### Not supported
Some DRONE analyzers require **live asset** access during acquisition or hunt and therefore **cannot** run server-side on previously collected or imported evidence. Examples include:
* **MITRE ATT&CK Analyzer** — runs YARA scans against DFIR-configured filesystem locations and all running processes on the asset. It executes only on the responder (live device) and does not run when DRONE is re-run against stored case evidence alone.
* Other **responder-dependent** analyzers that need live system state or data not fully represented in the offline evidence package — for example, Event Records Analyzer, Vulnerability Analyzer, Generic Web Shell Analyzer, and Ransomware Analyzer.
In the UI, these analyses appear **greyed out** during server-side re-analysis, indicating they require live asset context and cannot run on imported or offline evidence.
If findings from responder-side DRONE already exist in the case, they are preserved and remain visible alongside server-side results.
---
## Findings behavior
* Existing findings are **not removed**
* Findings are **not duplicated**
* New findings are added where applicable
* Updated detections may enrich or extend prior results
When multiple acquisitions (PPC files) exist for the same asset within a case, server-side DRONE Analysis is executed against all relevant evidence packages.
---
## Forensic considerations
Server-side DRONE Analysis does **not** modify the underlying evidence files. The original PPC remains unchanged, ensuring:
* Forensic soundness
* Integrity-preserving workflows
* A consistent chain of custody
Only analytical outputs (findings and metadata) are added to the case.
---
## Limitations and considerations
* Server-side DRONE Analysis does not replace responder-side DRONE for live context detection
* It should be viewed as complementary, not a substitute
* Performance depends on AIR Console resources and evidence size
---
## Summary
Server-side DRONE Analysis provides investigators with the flexibility to analyze forensic evidence **when needed, where needed**, without dependency on live assets. By separating acquisition from analysis, AIR enables faster workflows, retrospective detection, and robust support for offline and post-incident investigations.
---
# What is an Analysis Pipeline?
> Source: https://kb.binalyze.ai/air/features/drone/what-is-an-analysis-pipeline.html
Traditional security tools often rely heavily on signature-based detection—a method that struggles to keep pace with modern, fast-evolving threats. AIR addresses this challenge by incorporating **DRONE**, an advanced automated analyzer designed to rapidly evaluate collected evidence with forensic precision.
### **The Analysis Pipeline Approach**
At the heart of DRONE is the **Analysis Pipeline**, a modular evaluation framework that scrutinizes each evidence item across multiple stages. Each stage, or pipeline, targets a specific category or characteristic, such as suspicious processes, unusual network behavior, file anomalies, or signs of persistence.
As the evidence progresses through these pipelines, DRONE applies a combination of proprietary analyzers, YARA rules, Sigma rules, and osquery-based logic to assess the forensic significance of each artifact. When an issue is detected, it is logged as a **finding**, with one of four possible **severity classifications**:
* **High** – Confirmed malicious behavior or artifacts indicating critical compromise.
* **Medium** – Indicators of suspicious or potentially unwanted behavior.
* **Low** – Anomalies or uncommon patterns that may warrant further investigation.
* **Matched** – Items flagged through either:
* **Keyword hits**, where the evidence matches one or more pre-defined text, wildcard, or regular expression patterns, or
* **Hunt/Triage rule matches, where custom YARA, Sigma, or osquery rules are applied at the time of acquisition or through manual hunt and triage, identify relevant indicators.**
This **Matched** category is particularly powerful, as it allows analysts to surface evidence linked to threat hunting hypotheses, indicators of compromise (IOCs), or tactical queries — even when the finding does not yet have a known severity level. It ensures investigators never miss contextually important clues, even if those clues are not immediately classifiable as high or medium severity.
#### **Findings in the Investigation Hub**
All findings, including "Matched" hits, are made available in the **Investigation Hub** — AIR’s unified workspace that consolidates triage results, acquisition data, and analysis verdicts from multiple assets and cases. The integration of severity-scored and keyword/triage-matched results enables faster triage, prioritization, and response, especially across large-scale or multi-asset investigations.
For **Sigma-based** DRONE findings, the Console surfaces **rule Author** and **Status** metadata so analysts can filter or group results during review—for example, to focus on confirmed rules and distinguish experimental detections—supporting more targeted security analysis aligned with how your organization values each rule’s maturity and trust.
This methodical and automated analysis pipeline ensures **forensically sound, scalable, and efficient** evidence evaluation, helping analysts quickly home in on what matters most
---
# Analyzers
> Source: https://kb.binalyze.ai/air/features/drone/analyzers.html
DRONE includes two core analyzer components:
1. DRONE analyzers
2. MITRE ATT&CK analyzer
:::note
Tornado also uses DRONE analyzers for cloud-evidence workflows. In that context, analyzers are platform-specific (for example Microsoft 365, Google Workspace, Zoom, and HubSpot), run in Tornado against collected cloud artifacts, and write results to `Drone.db` inside the case package. See [DRONE Integration in Tornado](../tornado-preview-version/tornado-drone-integration).
:::
Updates for the MITRE ATT&CK analyzer are delivered independently of standard AIR or DRONE releases via the AIR platform's MITRE ATT&CK analyzer framework. The version in use can be verified under AIR Settings, and a detailed changelog is maintained in the Knowledge Base.
## DRONE Analyzers
Each analyzer queries specific artifact tables (such as processes, registry, MFT, SRUM, etc.) and runs the data through a series of check functions that score or flag suspicious indicators. These indicators include unsigned executables, masquerading, hacker tool names, suspicious paths, suspicious commands, anomalous timestamps, entropy checks and more. Items that exceed suspicion thresholds are reported with MITRE ATT&CK tags and verdicts ranging from "relevant" to "dangerous."
### Windows Analyzers
#### AmCache Analyzer
Parses: `amcache_file` table
Purpose: Analyze Windows Amcache registry entries for executed files, checking for hacker tools and RMM software
#### AmCache Program Analyzer
Parses: `amcache_program` table
Purpose: Analyze Windows Amcache program entries for application names that may be relevant to the investigation
#### AppCompatCache Analyzer
Parses: `app_compat_cache` table
Purpose: Analyze Windows Application Compatibility Cache for hacker tools and RMM software
#### Application Analyzer
Parses: `installed_applications` table
Purpose: Analyze installed Windows applications for suspicious categories, hacker tools and RMM software
#### Browser Downloads Analyzer
Parses: `browser_downloads` table
Purpose: Analyze browser download history for suspicious file paths, URLs, and referrers
#### Browser History Analyzer
Parses: `browser_history` table
Purpose: Analyze browser history for suspicious URLs and hacker tool references
#### DNS Cache Analyzer
Parses: `dns_cache` table
Purpose: Analyze Windows DNS cache for suspicious domains, crypto domains, and abused TLDs
#### Downloads Analyzer
Parses: `downloads` table
Purpose: Analyze Windows download history for hacker tools and RMM software
#### Dynamo Analyzer
Dynamo is a rule-based analysis engine for digital forensics and incident response (DFIR) investigations.
##### Rule Types
Dynamo supports three rule execution modes:
* SQL Rules: Execute SQL queries directly against forensic databases
* osquery: Execute osquery prompts on the live asset
* UGO Script Rules: Execute custom scripts using the UGO scripting language for complex analysis logic
##### Data Sources
The analyzer can query data from multiple forensic sources:
* The AIR case database: Primary forensic case data repository
* The live system/asset: Using osquery
##### Analysis Functions
Dynamo provides a comprehensive library of built-in analysis functions, including:
* Threat Detection: Suspicious commands, hacking tools, RMM tools, obfuscated strings
* File Analysis: File size, entropy, masquerading, alternate data streams, executable locations
* System Artifacts: Registry keys, scheduled tasks, digital signatures, host processes
* Network Analysis: URL patterns, domain validation, domain categorization
* Command Line: Command patterns, unusual length detection, script execution artifacts
* Trust & Reputation: Publisher validation, application categorization, malicious service detection
* User Analysis: Username patterns, first logon detection, temporal analysis
##### Use Cases
Dynamo is used for suspicious process detection, file system anomaly detection, network activity analysis, registry anomaly detection, command line analysis, timeline correlation, and threat hunting.
#### Event Records Analyzer
Parses: `Windows Event Logs (.evtx files)`
Purpose: Analyze Windows Event Logs using Sigma rules to detect suspicious activity and security incidents
The analyzer processes Windows Event Logs from `\Windows\System32\Winevt\Logs` and applies Sigma detection rules
Events that match detection rules are reported with MITRE ATT&CK tags and severity scores to help prioritize investigation efforts.
Sigma-based findings in DRONE expose additional **rule metadata**, including **Author** and **Status**. In the Investigation Hub, analysts can **filter** or **group** results using these attributes—supporting workflows that prioritize confirmed, production-ready rules and clearly separate experimental or test detections during evidence review. That extra context helps teams tune how they interpret detections based on operational relevance and rule reliability.
#### Hosts File Analyzer
Parses: `hosts` table
Purpose: Analyze the Windows hosts file for suspicious URL mappings
#### $MFT Analyzer
Parses: MFT (Master File Table) CSV files
Purpose: Analyze Windows file system entries for suspicious files, hidden executables, and hacker tools
#### Network Share Analyzer
Parses: `net_shares` table
Purpose: Analyze Windows network shares for rare/uncommon shares and active connections
#### PowerShell History Analyzer
Parses: `powershell_consolehost_history` table
Purpose: Analyze PowerShell command history for hacker tools, RMM software and suspicious commands
#### Prefetch Analyzer
Parses: `prefetch_parsed` and `prefetch_files` tables
Purpose: Analyze Windows Prefetch entries for suspicious executables and hacker tools
#### Process Analyzer
Parses: `processes` table
Purpose: Analyze Windows processes for suspicious behavior, suspicious commmands and processes names of interest.
#### Registry Analyzer
Parses: `autoruns_registry` table
Purpose: Analyze Windows registry autorun entries for suspicious executables and hacker tools
#### Scheduled Task Analyzer
Parses: `autoruns_scheduled_tasks` table
Purpose: Analyze Windows scheduled tasks for suspicious behavior and suspicious commmands
#### ShellBags Analyzer
Parses: `shell_bags` table
Purpose: Analyze Windows ShellBags for suspicious admin share access behavior
#### SRUM Analyzers
Parses: `srum_network_data_usage`, `srum_application_timeline` and `srum_application_resource_usage` tables
Purpose: Analyze Windows System Resource Utilization Monitor data for suspicious application usage including hacker tools and RMM software
#### User Folders Analyzer
Parses: `user_folders` table
Purpose: Analyze Windows user profile folders for suspicious usernames and creation patterns
#### Windows Services Analyzer
Parses: `autoruns_services` table
Purpose: Analyze Windows services for suspicious behavior, known malicious services, hacker tools and suspicious command-line.
### Linux Analyzers
#### CronJob Analyzer
Parses: `cron_jobs` table
Purpose: Analyze Linux/macOS cron jobs for suspicious commands and hacker tools
#### Package Manager Analyzer
Parses: `apt_history` table
Purpose: Analyze the Linux APT package manager history for suspicious installation timestamps
#### Process Analyzer (Linux)
Parses: `processes` table
Purpose: Analyze Linux processes for suspicious behavior, systemd anomalies, and hacker tools
#### Shell History Analyzer
Parses: `shell_history` table
Purpose: Analyze Linux/macOS shell command history for suspicious commands and hacker tools
### Cross-Platform Analyzers
#### Browser History Analyzer
Parses: `browser_history` table
Purpose: Analyze browser history for suspicious URLs and hacker tool references (Windows, Linux, macOS)
#### Browser Downloads Analyzer
Parses: `browser_downloads` table
Purpose: Analyze browser download history for suspicious file paths, URLs, and referrers (Windows, macOS)
### macOS Analyzers
#### Dylib Hijack Analyzer
Parses: `installed_apps` and `apps_dylibs` tables
Purpose: Analyze macOS applications for dynamic library hijacking vulnerabilities
## MITRE ATT&CK Analyzer
The MITRE ATT&CK Analyzer leverages YARA-based scanning with modular, cross-platform capabilities that inspect both the filesystem and live process memory. The analyzer relies on rule sets maintained by the Binalyze threat hunting team and augmented by curated open-source YARA rules.
### Performance Optimizations
There are some limitations implemented for performance optimization:
* On Windows, MITRE ATT&CK Analyzer does not scan the entire drive. It scans a preconfigured list of directories on the system, where 99% of malware has historically been found. To scan the entire drive, users can use the Triage/Hunt module.
* The file size limit is 250MB.
### Detection Results
YARA scan results can be seen under MITRE ATT&CK Fs and MITRE ATT&CK Memory evidence categories. The user can see various details about detection:
* YARA matched strings
* YARA meta information, such as Description, Author name, and References for further reading
* Various date information related to the Filesystem and Process Creation date when the result is found in process memory
---
# MITRE ATT\&CK Analyzer changelog
> Source: https://kb.binalyze.ai/air/features/drone/mitre-att-and-ck-analyzer-changelog.html
## 13.0.0 (23/03/26)
### Dynamo Analyzer / Tornado Microsoft 365
* Added detection for suspicious Microsoft 365 audit log configuration changes, including disabling unified/admin audit logging, narrowing cmdlet/parameter auditing, excluding sensitive cmdlets, and reducing retention below 30 days.
* Added detection for potential brute-force login activity in Microsoft 365 by flagging repeated failed sign-in attempts from the same source IP against a user.
* Added detection for suspicious and high-risk external sharing activity in SharePoint/OneDrive, including anonymous links, "Anyone" scoped sharing links, and guest-targeted sharing actions.
* Added detection for Microsoft 365 mail forwarding rule operations across inbox rules, mailbox-level forwarding, and transport rules to help identify potential BEC persistence and data theft.
* Added detection for mailbox permission changes associated with persistence in BEC cases, including FullAccess, SendAs, SendOnBehalf, and mailbox folder permission modifications.
* Added detection for failed Microsoft 365 logins where MFA was required but not completed or failed.
* Added detection for suspicious OAuth consent grants and related service principal changes that could enable persistent API-level access in Microsoft 365.
### Sigma
* DRONE has been updated with the most recent Sigma rule updates from SigmaHQ and Hayabusa repositories.
## 12.5.2 (10/03/26)
### MITRE ATT\&CK Analyzer / YARA
* False positive fixes.
### Sigma
* DRONE has been updated with the most recent Sigma rule updates from SigmaHQ and Hayabusa repositories.
## 12.5.1 (01/03/26)
### MITRE ATT\&CK Analyzer / YARA
* Rule hotfix.
## 12.5.0 (27/02/26)
### Dynamo Analyzer
* Improved classification of large file transfer and sharing services by refining domain categories and associated MITRE mappings.
* Other smaller improvements including rule updates, quality of life and false positive fixes.
### MITRE ATT\&CK Analyzer / YARA
* Added and enhanced detection for MuddyWater APT group, including Bugsleep backdoor and GhostFetch reflective loader components, with updated attribution and MITRE tagging.
* Other smaller improvements including rule updates, quality of life and false positive fixes.
### Sigma
* DRONE has been updated with the most recent Sigma rule updates from SigmaHQ and Hayabusa repositories.
## 12.4.2 (19/02/26)
### MITRE ATT\&CK Analyzer / YARA
* Added detection for DeskRAT, a Golang-based Remote Access Trojan used by TransparentTribe (APT36) with capabilities including WebSocket-based C2, file exfiltration, and multiple persistence mechanisms targeting defense and government sectors.
* Enhanced detection of LockBit ransomware family with new signatures for LockBit 5.0 variants targeting both Windows and Linux platforms.
* Improved detection for LNK shortcuts executing mshta by relaxing file size limitation.
* Added detection of files containing multiple Windows system reconnaissance commands used during initial attacker enumeration to gather host information, network configuration, user privileges, and system details.
* Enhanced identification of reconnaissance scripts containing commands to obtain system information, now including support for Python (.py) file extensions.
* Other smaller improvements including rule updates, quality of life and false positive fixes.
### Sigma
* DRONE has been updated with the most recent Sigma rule updates from SigmaHQ and Hayabusa repositories.
## 12.4.0 (11/02/26)
### Dynamo Analyzer
* Added false positive command line filtering to reduce alerts from known safe processes in Windows process analysis.
* Introduced a new RunMRU analyzer to identify suspicious commands executed via the RunMRU registry key.
* Enhanced detection of suspicious file extensions in email attachments that are commonly used to deliver malware or exploit vulnerabilities.
* Enhanced identification of various hacker tool names commonly found in forensic evidence.
## MITRE ATT\&CK Analyzer / YARA
* Added detection for CrashFix malicious browser extension from the KongTuke campaign that impersonates legitimate extensions, causes browser crashes, and displays fake security warnings to trick users.
* Added detection of Golang compiled binaries referencing screen capture libraries while excluding known false positives.
* Updated detection of NetSupport remote access software from suspicious to dangerous to reflect its common misuse by adversaries.
* Added detection for Powershell scripts using XOR operations on Base64 encoded content as a method of obfuscation.
### Sigma
* DRONE has been updated with the most recent Sigma rule updates from SigmaHQ and Hayabusa repositories.
## 12.3.0 (05/02/26)
### Dynamo Analyzer
* Removed obsolete functions to improve detection pipeline efficiency in browser history and shimcache embedded rules.
* Refined Cobalt Strike service installation detection by restricting to service-related registry keys.
* Updated suspicious ClickFix command detection to analyze run_command fields for increased accuracy.
* Enhanced suspicious ClickFix path detection by mapping to run_command for better correlation.
* Improved identification of various hacker tool names commonly found in forensic evidence.
### MITRE ATT\&CK Analyzer / YARA
* Added detection for Pulsar RAT, an open-source .NET-based remote administration tool with advanced features like encrypted TLS communication, remote desktop functionality, and keylogging.
* Added detection for Interlock ransomware components including FreeBSD ELF encryptor using AES and RSA, and a custom Windows crypter/packer linked to Interlock and Rhysida ransomware sets.
* Added detection for OrcaC2 loader/stub, a lightweight first-stage dropper, and the full OrcaC2 puppet agent implant with capabilities such as remote command execution, file management, keylogging, and persistence.
* Other smaller improvements including rule updates, quality of life and false positive fixes.
### Sigma
* DRONE has been updated with the most recent Sigma rule updates from SigmaHQ and Hayabusa repositories.
## 12.2.0 (21/01/26)
### MITRE ATT\&CK Analyzer / YARA
* Added detection for VoidLink, an advanced cloud-native Linux malware framework featuring loaders, implants, rootkits, modular plugins, runtime code encryption, adaptive behavior, and support for multiple C2 channels across major cloud providers.
* Added detection for GoExec, a Windows remote execution multitool implementing various lateral movement methods including WMI, DCOM, Task Scheduler, and SCMR.
* Added detection for GoTokenTheft, a Go-based tool targeting Windows token theft and manipulation techniques such as duplication, impersonation, and privilege escalation.
* Added detection for DefendNot, a tool that disables Windows Defender by registering as a fake antivirus using the Windows Security Center API.
* Added detection for EarthWorm network tunneling tool that creates Socks5 proxy servers.
* Enhanced detection for Chaos ransomware with added support for identifying the .NET variant.
* Improved identification of ZIP archives containing only EXE and DLL files indicative of possible sideloading activities.
* Improved filtering for filesystem scanning on Darwin and Linux platforms, simplifying whitelisted paths for broader coverage.
* Other smaller improvements including rule updates, quality of life and false positive fixes.
### Dynamo Analyzer
* Enhanced identification of various hacker tool names commonly found in forensic evidence.
### Sigma
* DRONE has been updated with the most recent Sigma rule updates from SigmaHQ and Hayabusa repositories.
## 12.1.1 (15/01/26)
### MITRE ATT\&CK Analyzer / YARA
* Added detection for MystRodX, a covert dual-mode backdoor for Linux written in C++ featuring passive wake-up mechanisms via DNS and ICMP triggers, with capabilities for file management, reverse shell, and SOCKS proxy functionality.
## 12.1.0 (15/01/26)
### MITRE ATT\&CK Analyzer / YARA
* Added detections for APT10-related malware including a dropper that deploys implants via side loading, modules responsible for loading and deobfuscating REDLEAVES RAT components, obfuscated shellcode files, core REDLEAVES RAT strings, and specific RedLeaves and PlugX binaries.
* Introduced detection for AuthDoor PAM backdoor targeting telecommunications infrastructure by overwriting PAM modules to capture credentials and provide magic password access.
* Added detection for ChronosRAT, a custom remote access trojan used by the CL-STA-0969 cluster that abuses SSH and ICMP for access and command execution in telecom environments.
* Added detection for GTPDoor backdoor leveraging GTP protocol for covert command and control channels in telecom roaming exchange networks, associated with the CL-STA-0969 cluster.
* Added detection for DeadLock ransomware that uses custom stream cipher encryption with time-based keys, employs BYOVD technique to disable EDR, and abuses process hollowing and batch script execution on Windows systems.
* Added detection for Cordscan hacktool, a network scanning and packet capture utility targeting Serving GPRS Support Nodes (SGSN) to gather mobile device location data, used by the CL-STA-0969 cluster.
## 12.0.0 (12/01/26)
### Dynamo Analyzer
* Enhanced identification of various hacker tool names commonly found in forensic evidence.
### MITRE ATT\&CK Analyzer / YARA
* Added detection for the CQTools penetration testing toolkit by CQURE Team, which includes tools for credential dumping, DPAPI exploitation, ARP spoofing, and reverse shell generation.
* Added detection for multiple malicious drivers from the LOLDrivers project using VersionInfo values from the PE header, covering a wide range of driver names associated with various threats and vulnerabilities.
* Added detection for multiple vulnerable drivers from the LOLDrivers project identified by their VersionInfo values, enhancing coverage for known vulnerable driver components.
* Added detection for MgBot backdoor and its various plugin modules including information stealer, keylogger, audio capture, file stealing, clipboard capture, browser credential stealer, and RC4 encryption implementation used by the Evasive Panda APT group.
* Added detection for the remote access trojan ValleyRAT and its C2 configuration pattern used by Silver Fox APT in targeted campaigns.
* Added detection for executables signed with compromised (stolen) certificates including a specific certificate from Guangzhou Kingteller Technology Co., Ltd.
* Added detection for drivers signed by suspicious entities to identify potentially malicious or tampered software drivers.
* Other smaller improvements including rule updates, quality of life and false positive fixes.
### Sigma
* DRONE has been updated with the most recent Sigma rule updates from SigmaHQ and Hayabusa repositories.
## 11.6.0 (25/12/25)
### Dynamo Analyzer
* Removed priority-based process checks that flagged uncommon base priorities as suspicious for certain Windows processes, improving quality and reducing false positives.
* Added detection for suspicious process paths in Windows processes based on command line path patterns indicating potential suspicious activity.
* Added detection of access to administrative shares (like C$, ADMIN$, IPC$) in Windows shellbags data to identify possible lateral movement or administrative activity.
* Enhanced identification of various hacker tool names commonly found in forensic evidence, including detailed descriptions for known credential dumping, privilege escalation, network scanning, and lateral movement tools.
* Added detection for PuTTY cache of accepted host keys which may indicate unauthorized use of PuTTY for remote file transfers.
### Sigma
* DRONE has been updated with the most recent Sigma rule updates from SigmaHQ and Hayabusa repositories.
## 11.5.0 (19/12/25)
### Dynamo Analyzer
* Removed deprecated detection related to admin share names from shellbags embedded rules.
* Corrected identifiers for SRUM analyzers in application, timeline, and network usage embedded rules.
* Enhanced identification of various hacker tool names commonly found in forensic evidence.
### MITRE ATT\&CK Analyzer / YARA
* Added detection for JLORAT, a first-stage infector implant used by the Tomiris APT group targeting foreign ministries, intergovernmental organizations, and government entities since early 2025.
* Enhanced detection by including suspicious keywords such as "ReverseShell" in PDB paths indicating potentially malicious samples.
* Added detection for ReverseSocks5, a reverse SOCKS5 proxy tool used by Tomiris APT group to bypass firewalls and expose internal networks via reverse proxy connections.
* Added detection for a Windows reverse SOCKS5 proxy tool capable of firewall evasion and reverse proxy functionality on Windows platforms.
* Added detection for a Windows kernel driver with usermode interface that can hide processes, file-system, registry objects, and protect processes, linked to privilege escalation techniques.
* Other smaller improvements including rule updates, quality of life and false positive fixes.
### Sigma
* DRONE has been updated with the most recent Sigma rule updates from SigmaHQ and Hayabusa repositories.
## 11.4.1 (10/12/25)
### Dynamo Analyzer
* Enhanced detection of suspicious command line patterns in RunMRU artifacts that may indicate ClickFix social engineering attacks, including expanded matching for Powershell encoded commands and script execution.
* Added identification of suspicious file paths in command line entries frequently used in ClickFix attacks to mislead users into executing malicious commands via the Run dialog.
## 11.4.0 (04/12/25)
### Dynamo Analyzer
* Added new analyzers for disk-image platform including Bash History, Windows LNK Link, Prefetch Execution, Registry AmCache, Registry AppCompatCache (ShimCache), ZSH Shell History, Chrome Cookie, Chrome History File Downloaded, Chrome History Page Visited, Firefox Cookie, Firefox Downloads, Firefox Bookmarks, Firefox Places Page Visited, Fish Shell History, Java Download Index, macOS LSQuarantine, PowerShell Transcript Log, Registry Service, Registry TypedURLs, Registry UserAssist, Registry Winlogon, Safari Downloads, Safari History Visit, ShellBags File Entry, and Syslog Cron Task Run, enhancing detection coverage of various data sources and forensic artifacts.
* Expanded detection of hacker tool names, RMM tool names, and hacker commands across multiple analyzers for various platforms and data types to enhance identification of suspicious activities.
* Updated Windows case detection queries to include new suspicious command patterns such as msiexec, and improved filtering on suspicious environment variables for commands, extensions, and paths to reduce false positives.
### MITRE ATT\&CK Analyzer / YARA
* Added detection for Dystopia Windows RAT, which uses Discord, Telegram, and GitHub as C2 channels and generates backdoors acting as bots on these platforms.
* Other smaller improvements including rule updates, quality of life and false positive fixes.
### Sigma
* DRONE has been updated with the most recent Sigma rule updates from SigmaHQ and Hayabusa repositories.
## 11.3.1 (30/11/25)
### Dynamo Analyzer
* Enhanced detection of hacker and remote monitoring management (RMM) tools by expanding application name checks.
### MITRE ATT\&CK Analyzer / YARA
* Added detection for Akira_V2 ransomware including identification of related binaries and ransom notes.
* Other smaller improvements including rule updates, quality of life and false positive fixes.
### Sigma
* DRONE has been updated with the most recent Sigma rule updates from SigmaHQ and Hayabusa repositories.
## 11.3.0 (28/11/25)
### Dynamo Analyzer
* Enhanced identification of various hacker tool names commonly found in forensic evidence.
### MITRE ATT\&CK Analyzer / YARA
* Updated detection for C# and .NET red/black-team offensive tools using typelib GUIDs, improving detection coverage for suspicious and malicious activities on Windows platforms.
* Added detection for open source AdaptixC2 post exploitation framework, found being used in real world attacks.
* Improved detection of suspicious command line utilities such as XstExport, enhancing visibility into email extraction tools from Outlook files.
* Other smaller improvements including rule updates, quality of life and false positive fixes.
### Sigma
* DRONE has been updated with the most recent Sigma rule updates from SigmaHQ and Hayabusa repositories.
## 11.2.3 (25/11/25)
### Dynamo Analyzer
* Enhanced detection of generic crypto mining related domains in dns cache.
## 11.2.2 (25/11/25)
### MITRE ATT\&CK Analyzer / YARA
Added detection for the malicious JavaScript worm involved in the Shai-Hulud Second Coming npm supply-chain attack.
## 11.2.1 (23/11/25)
### MITRE ATT\&CK Analyzer / YARA
* Added detection for PowerChell tool to identify attempts to bypass AMSI, disable ETW logging, and evade PowerShell security features on Windows.
*Added detection for gs-netcat from Global Socket Toolkit, capable of creating reverse shells and bypassing NAT/firewalls, covering Windows, Linux, and macOS.
## 11.2.0 (20/11/25)
### Dynamo Analyzer
* Enhanced identification of various hacker tool names commonly found in forensic evidence.
### MITRE ATT\&CK Analyzer / YARA
* Added detection for PlushDaemon backdoors and associated malware used by a Chinese APT group, improving attribution capabilities.
* Added detection for EdgeStepper, a Go-based network implant by PlushDaemon APT, which redirects DNS queries for adversary-in-the-middle attacks on software updates.
* Improved detection of Gh0stRAT remote access Trojan with additional string signatures.
* Expanded detection of INC ransomware (also known as Lynx) including references to new intelligence sources.
* Added detection for Kraken ransomware, a cross-platform threat with Windows, Linux, and ESXi variants, known for double extortion, specific ransom note, and advanced encryption methods.
* Added detection for Aspia remote desktop and file transfer software, highlighting its potential use in unauthorized remote access scenarios.
* Added detection for Ollama.sys malicious driver and its droppers, designed to bypass security controls and facilitate attacks.
* Improved detection for hlpdrv.sys malicious driver used to disable Windows Defender, observed in Akira ransomware incidents.
* Other smaller improvements including rule updates, quality of life and false positive fixes.
### Sigma
* DRONE has been updated with the most recent Sigma rule updates from SigmaHQ and Hayabusa repositories.
## 11.1.0 (14/11/25)
### Dynamo Analyzer
* Enhanced identification of various hacker tool names commonly found in forensic evidence, including new entries for Base64 encoded command execution and additional remote access software names such as Gorelo Remote Management tools.
### MITRE ATT\&CK Analyzer / YARA
* Added detection for Venom C2, a dependency-free Python3 Command & Control framework used for redteam persistence targeting Windows, Linux, and Darwin platforms.
* Added detection for IndonesianFoods worm, related to a coordinated NPM supply chain attack involving widespread publication of malicious packages using Indonesian names and food terms.
* Enhanced detection of Gorelo RMM, a remote access software used by adversaries to establish command and control channels within networks.
* Added detection for hidden LNK shortcuts placed in Startup folders, highlighting potential defense evasion techniques on Windows systems.
* Other smaller improvements including rule updates, quality of life and false positive fixes.
### Sigma
* DRONE has been updated with the most recent Sigma rule updates from SigmaHQ and Hayabusa repositories.
## 11.0.0 (07/11/25)
### Dynamo Analyzer
* Added new SRUM Application Timeline Analyzer for identifying hacker and remote monitoring management (RMM) tool activities on Windows systems.
* Enhanced identification of various hacker tool names commonly found in forensic evidence.
### MITRE ATT\&CK Analyzer / YARA
* Added multiple detections for popular remote access and RMM software including FleetDeck, GoToResolve, Miradore, N-Able, Nezha agent, and PDQ software to identify potential interactive command and control channels used by adversaries.
* Added new detection for RustScan, a fast port scanner written in Rust, to catch network reconnaissance activities.
* Enhanced detection for Vidar Stealer with expanded coverage of version 2.0 featuring advanced anti-analysis, multithreading, and credential theft capabilities across various platforms and targets.
* Other smaller improvements including rule updates, quality of life and false positive fixes.
### Sigma
* DRONE has been updated with the most recent Sigma rule updates from SigmaHQ and Hayabusa repositories.
## 10.9.0 (05/10/25)
### Dynamo Analyzer
* Added detection for suspicious commands in Windows registry Environment variables, targeting command lines containing suspicious command names such as powershell, wmic, cscript, regsvr32, and others.
* Added detection for suspicious extensions in Windows registry Environment variables to identify potentially harmful scripts and executable extensions commonly used in attacks.
* Added detection for suspicious file paths in Windows registry Environment variables that reference locations like Public, Temp folders, and various user directories often abused in persistence techniques.
* Added detection of suspicious PowerShell commands in Windows registry Environment variables, highlighting hidden or encoded execution patterns linked to sophisticated threats.
* Added detection for suspicious command execution within the RunMRU registry key to identify potential ClickFix social engineering attack activity via deceptive user-invoked commands.
* Enhanced detection of suspicious paths in the Run registry key by including additional user directory paths to better capture usage of potentially unsafe file locations.
### MITRE ATT\&CK Analyzer / YARA
* Enhanced detection for the PipeMagic modular backdoor used by the Storm-2460 threat actor by refining network signature matching for improved accuracy.
* Improved detection of NetSupport remote access software, a legitimate tool sometimes misused by adversaries, by adding configuration pattern matching to identify malicious usage.
* Other smaller improvements including rule updates, quality of life, and false positive fixes.
### Sigma
* DRONE has been updated with the most recent Sigma rule updates from SigmaHQ and Hayabusa repositories.
## 10.8.4 (24/10/25)
### MITRE ATT\&CK Analyzer / YARA
* Added detection for Ave Maria RAT (Warzone RAT), a stealthy remote access trojan that enables unauthorized control of victim systems, supporting functionalities such as data theft, privilege escalation, remote desktop control, email credential collection, and browser credential parsing.
### Sigma
* DRONE has been updated with the most recent Sigma rule updates from SigmaHQ and Hayabusa repositories.
## 10.8.3 (22/10/25)
### Dynamo Analyzer
* Added new analyzers for SRUM data on Windows: application resource usage and network data usage, improving detection of hacker and remote management tool activities based on SRUM telemetry.
## 10.8.2 (21/10/25)
### MITRE ATT\&CK Analyzer / YARA
* Added detection for a novel sophisticated multi-stage Java/JavaScript based backdoor that establishes persistent network communication, executes commands, escalates privileges, performs system reconnaissance, and tunnels traffic through proxies while employing various evasion techniques.
## 10.8.1 (20/10/25)
### MITRE ATT\&CK Analyzer / YARA
* Updated generic webshell ruleset created by Arnim Rupp (https://github.com/ruppde).
### Sigma
* DRONE has been updated with the most recent Sigma rule updates from SigmaHQ and Hayabusa repositories.
## 10.8.0 (10/10/25)
### Dynamo Analyzer
* Enhanced identification of various hacker tool, remote monitoring and management (RMM), and suspicious commands across multiple data sources including amcache, application lists, browser downloads, browser history, cron jobs, DNS cache, downloads, PowerShell logs, prefetch data, Windows process information, registry entries, scheduled tasks, services, shellbags, shell history, shimcache, and SRUM data by adding detailed descriptions and MITRE ATT&CK tags where applicable.
* Improved data querying and processing in downloads analysis by selecting comprehensive dataset to support better detection coverage.
* Added a new Browser Downloads Analyzer for Windows and macOS platforms to detect hacker and RMM tools through target path, URL, and referrer analysis with MITRE ATT&CK integration.
* Updated Amcache analyzer title to "Amcache Program Analyzer" to better reflect its purpose.
### Sigma
* DRONE has been updated with the most recent Sigma rule updates from SigmaHQ and Hayabusa repositories.
## 10.7.1 (07/10/25)
### Dynamo Analyzer
* Added new Amcache Analyzer to detect and report suspicious programs based on Amcache data from Windows systems.
## 10.7.0 (07/10/25)
### MITRE ATT\&CK Analyzer / YARA
* Added detection for the modular PipeMagic backdoor used by Storm-2460 threat actor with detailed identification patterns.
* Enhanced detection of BadSpace backdoor with updated version and improved verdict severity to dangerous.
* Introduced detection for ThrottleStop vulnerable driver exploiting local privilege escalation.
* Added detection for Cloudflare Tunnel client (cloudflared) potentially abused for malicious protocol tunneling, linked to Akira ransomware campaigns.
* Enhanced detection of Veeamp credential dumping tool targeting Veeam backup management SQL databases with refined string signatures.
* Added detection for XiebroC2 command and control framework used in MS-SQL server attacks, covering multiple platforms and including various signature patterns for its components.
### Dynamo Analyzer
* Enhanced identification of various hacker tool names commonly found in forensic evidence.
* Improved classification of Remote Access software (RMM tools) with updated patterns and additional tool identifiers to reduce false positives and increase coverage.
### Sigma
* DRONE has been updated with the most recent Sigma rule updates from SigmaHQ and Hayabusa repositories.
## 10.6.3 (29/09/25)
### MITRE ATT\&CK Analyzer / YARA
* Added detection for the Turla APT group Kazuar backdoor, linked to the FSB-affiliated cyberespionage targeting governments and diplomatic sectors.
### Dynamo Analyzer
* Added detection for browser-stored passwords across macOS, Windows, and Linux platforms to identify saved credentials vulnerable to credential theft by infostealers. This includes accounts actively saved and not blacklisted by user, highlighting risks despite OS encryption protections.
### Sigma
* DRONE has been updated with the most recent Sigma rule updates from SigmaHQ and Hayabusa repositories.
## 10.6.2 (26/09/25)
### MITRE ATT\&CK Analyzer / YARA
* Added detection for binaries designed to dump credentials using WerfaultSecure, enhancing credential access threat identification.
* Added detection for binaries designed to create processes as Protected Process Light (PPL), improving defense evasion monitoring.
* Enhanced detection of potentially obfuscated VBScript code commonly used for evasion purposes.
* Other smaller improvements including rule updates, quality of life and false positive fixes.
### Sigma
* DRONE has been updated with the most recent Sigma rule updates from SigmaHQ and Hayabusa repositories.
## 10.6.1 (25/09/25)
### MITRE ATT\&CK Analyzer / YARA
* Added improved detection for Quasar RAT by expanding signature strings focused on keylogger functionality and reverse proxy capabilities, enhancing detection reliability for this malware family.
* Other smaller improvements including rule updates, quality of life and false positive fixes.
### Dynamo Analyzer
* Improved identification of hacker and remote monitoring management (RMM) tool names by adding matched field tracking for more accurate reporting in amcache, applications, browser history, and downloads modules.
* Refined reporting to utilize matched fields where available, enhancing clarity of forensic data outputs across multiple embedded rules.
* Removed redundant checks for hacker commands in prefetch rules to streamline processing.
* Implemented enhanced date handling in process monitoring, adding explicit creation time tracking for more precise temporal context.
* Enhanced identification of various hacker tool names commonly found in forensic evidence.
### Sigma
* DRONE has been updated with the most recent Sigma rule updates from SigmaHQ and Hayabusa repositories.
## 10.6.0 (19/09/25)
### MITRE ATT\&CK Analyzer / YARA
* Improved detection of base64 encoded Powershell commands.
* Updated detection for suspicious Powershell command abbreviations frequently used by malware.
* Enhanced identification of Rclone, a tool used for syncing files with cloud storage services in ransomware campaigns, expanding platform coverage to Windows, Linux, and macOS.
* Other smaller improvements including rule updates, quality of life and false positive fixes.
### Dynamo Analyzer
* Added SRUM Analyzer to parse and enrich SRUM data.
## 10.5.5 (17/09/25)
### MITRE ATT\&CK Analyzer / YARA
Added detection for a malicious script involved in a supply chain attack on over 40 npm packages. The malware uses TruffleHog to steal developer credentials and propagate across repositories.
## 10.5.4 (16/09/25)
### Dynamo Analyzer
* Enhanced identification of various hacker tool names commonly found in forensic evidence by adding detection of hacker tool names in browser history analysis.
* Improved the hacker tool names database with additional entries including support for Rclone, a command-line program for managing and synchronizing files across cloud storage and local file systems.
## 10.5.3 (16/09/25)
### MITRE ATT\&CK Analyzer / YARA
* Added detection for GodRAT malware, a Gh0st RAT-based Remote Access Trojan targeting financial institutions.
* Enhanced detection for macOS Atomic (AMOS) infostealer variants, covering both x64 and ARM64 architectures with specific decoding function signatures.
## 10.5.2 (14/09/25)
### MITRE ATT\&CK Analyzer / YARA
* Added updated detection for TinyShell, an open source UNIX backdoor, improving coverage with expanded MITRE ATT&CK mapping and enhanced pattern matching.
* Enhanced detection of execution of Windows commands via LNK shortcut files, commonly used for initial access, persistence, and execution by threat actors abusing living-off-the-land binaries (LOLBINs).
## 10.5.1 (12/09/25)
### MITRE ATT\&CK Analyzer / YARA
* Added detection for Betruger backdoor malware associated with RansomHub group.
* Added detection for files with CVE-pattern filenames that may indicate proof-of-concept exploits or malicious files mimicking CVE identifiers.
* Updated detection for SoftPerfect Network Scanner, a tool utilized for conducting network scans, now supporting Windows and Darwin platforms with improved inspection of file types.
## 10.5.0 (10/09/25)
### Dynamo Analyzer
* Enhanced identification of various hacker tool names commonly found in forensic evidence.
* Added detection for additional remote access management (RMM) tools expanding the scope of RMM tool identification.
### MITRE ATT\&CK Analyzer / YARA
* Improved detection for base64 encoded PowerShell variables commonly observed in obfuscated malicious scripts.
* Refined JavaScript obfuscation detection targeting the jsobfuscator tool, improving accuracy by adjusting pattern matching for obfuscated code structures.
* Applied minor updates and corrections to YARA rule filtering paths to optimize Linux path scanning for detections.
* Other smaller improvements including rule updates, quality of life and false positive fixes.
### Sigma
DRONE has been updated with the most recent Sigma rule updates from SigmaHQ and Hayabusa repositories.
## 10.4.3 (04/09/25)
### MITRE ATT\&CK Analyzer / YARA
* Fixed a false positive detection for API hashing techniques used in reflective code loading for defense evasion purposes.
## 10.4.2 (03/09/25)
### MITRE ATT\&CK Analyzer / YARA
* Added detection for PromptLock ransomware, the first known AI-powered ransomware using a local OpenAI GPT model via Ollama API to dynamically generate malicious Lua scripts for filesystem enumeration, file inspection, data exfiltration, and encryption.
* Enhanced detection of Mimikatz credential access tool commands, with improved context to reduce false positives related to antivirus signatures.
* Other smaller improvements include rule updates, quality-of-life enhancements, and fixes for false positives.
## 10.4.0 (28/08/25)
### Dynamo Analyzer
* Enhanced identification of various hacker tool names commonly found in forensic evidence.
### MITRE ATT\&CK Analyzer / YARA
* Added detection for APT36 (Transparent Tribe) Linux campaign targeting Indian BOSS systems using weaponized autostart files and spear-phishing to maintain covert access against Indian government entities.
* Added detection for CANONSTAGER, a side-loaded DLL launcher used to decrypt and execute payloads in memory.
* Added detection for SOGU.SEC backdoor (PlugX) involved in a PRC-nexus espionage campaign targeting diplomats in Southeast Asia, deployed by UNC6384.
* Enhanced detection of files with double extensions used for masquerading to hide true file types and trick users into execution, now covering Windows, Linux, and Darwin platforms.
### Sigma
* DRONE has been updated with the most recent Sigma rule updates from SigmaHQ and Hayabusa repositories.
## 10.3.3 (19/08/25)
### Dynamo Analyzer
* Enhanced identification of various hacker tool names commonly found in forensic evidence.
### MITRE ATT\&CK Analyzer / YARA
* Added detection for OptiTune remote access software, which adversaries may misuse for remote access.
* Added detection for SimpleHelp remote control software, sometimes abused by attackers for remote access.
* Enhanced detection for Splashtop Streamer service, identifying adversary use of legitimate remote access software for command and control channels.
* Added detection for Syncro remote control software, known to be occasionally misused by attackers.
* Added detection for Dark-kill rootkit, which terminates EDR processes via kernel callbacks and ZwTerminateProcess.
* Improved detection for Angry IP Scanner, a network scanning tool used for active IP discovery and port scanning.
* Broadened identification of process monitoring and sandbox evasion tools, including Process Explorer, Process Hacker, and multiple endpoint protection services.
* Other smaller improvements include rule updates, quality-of-life enhancements, and fixes for false positives.
### Sigma
* DRONE has been updated with the most recent Sigma rule updates from SigmaHQ and Hayabusa repositories.
## 10.3.2 (16/08/25)
### MITRE ATT\&CK Analyzer / YARA
* Added detection for the SoundBill shellcode loader used by the UAT-7237 APT group.
* Enhanced detection of XOR-encoded strings used in Cobalt Strike Beacon DLLs to better identify this popular adversary tool.
## 10.3.1 (15/08/25)
### MITRE ATT\&CK Analyzer / YARA
* Added detection for multiple malware variants attributed to the UAT-5647 (RomCom) threat actor, including MeltingClaw, SingleCamper, and ShadyHammock.
## 10.3.0 (14/08/25)
### MITRE ATT\&CK Analyzer / YARA
* Added detection for RustyClaw, a Rust-based malware downloader.
* Added detection for SnipBot (RomCom 5.0), a RomCom malware variant with unique obfuscation and post-infection capabilities that allow command execution and downloading additional modules on victim systems.
* Added detection for Mythic C2 dynamic HTTP shellcode loader used in attacks leveraging WinRAR vulnerabilities CVE-2025-8088 and CVE-2025-6218.
* Other smaller improvements include rule updates, quality-of-life enhancements, and fixes for false positives.
### Sigma
* DRONE has been updated with the most recent Sigma rule updates from SigmaHQ and Hayabusa repositories.
## 10.2.5 (12/08/25)
### MITRE ATT\&CK Analyzer / YARA
* Added detection for potential exploitation of WinRAR path traversal vulnerabilities CVE-2025-8088 and CVE-2025-6218 targeting initial access techniques.
## 10.2.4 (11/08/25)
### MITRE ATT\&CK Analyzer / YARA
* Added detection for padded LNK files designed to exploit the ZDI-CAN-25373 vulnerability targeting Windows systems.
## 10.2.3 (10/08/25)
### MITRE ATT\&CK Analyzer / YARA
* Added detection for HeartCrypt-packed files, identifying this packer-as-a-service used by Windows-based malware since early 2024.
* Other smaller improvements, including rule updates, quality of life, and false positive fixes
## 10.2.2 (08/08/25)
### MITRE ATT\&CK Analyzer / YARA
* Added detection for indicators of the AK47 toolset, including a custom command-line tool abusing a legitimate third-party signed driver to terminate processes used by APT Storm-2603, linked to ToolShell exploitations.
* Enhanced detection of VBScript code containing obfuscated content aimed at evading detection.
* Added detection for a malicious driver designed to disable Windows Defender and observed in Akira ransomware campaigns.
* Other smaller improvements, including rule updates, quality of life, and false positive fixes
### Dynamo Analyzer
* Enhanced identification of various hacker tool names commonly found in forensic evidence.
### Sigma
* Added new detection for PowerShell commands collecting sensitive file types across directories, a common data exfiltration technique used by threat actors.
* DRONE has been updated with the most recent Sigma rule updates from SigmaHQ and Hayabusa repositories.
## 10.2.1 (06/08/25)
### Dynamo Analyzer
* Added detection of scheduled tasks executing at high frequency, indicating potentially suspicious activity on Windows systems.
* Enhanced identification of various hacker tool names commonly found in forensic evidence.
### MITRE ATT\&CK Analyzer / YARA
* Enhanced IOC detection for exploitation attempts related to SharePoint CVE-2025-53770, including web log and URI artifacts, as well as ASPX webshell and compiled ASPX webshell usage and associated MachineKey extraction binaries.
* Added detection for the AutoColor backdoor malware, characterized by advanced evasion techniques, custom encryption, and persistence mechanisms for stealthy remote access on Linux platforms.
* Added detection for BlackSuit ransomware.
* Added detection for Chaos ransomware.
* Added detection for Storm-2603 Web shell that utilizes sockets and DNS to receive and execute commands from its command and control infrastructure.
### Sigma
* DRONE has been updated with the most recent Sigma rule updates from SigmaHQ and Hayabusa repositories.
## 10.2.0 (29/07/25)
### Dynamo Analyzer
* Enhanced identification of various hacker tool names commonly found in forensic evidence.
### MITRE ATT\&CK Analyzer / YARA
* Improved detection of SharePoint server exploitation via CVE-2025-53770, including updated patterns for web logs, URI artifacts, and webshells.
* Added detection for Donut shellcode loader and shellcode, enabling identification of position-independent shellcode used for stealthy in-memory execution of .NET assemblies and other payloads.
* Expanded detection capabilities for Amadey malware version 5.34 through intrinsic pattern recognition and decryption algorithm identification.
* Added rules to identify indicators common across multiple ESXi ransomware variants.
* Introduced detection for Warlock ransomware across Windows and Linux platforms based on unique file and string patterns.
* New detection for ToolShell, a . NET-based webshell used for system information gathering and cryptographic key extraction on Windows systems.
* Added SharpAdidnsdump detection, a tool for dumping Active Directory credentials.
* Introduced detection of dynamic resolving of function addresses from msvcrt.dll, used as a technique for evading detection.
* Added detection for SharpHost, a tool that collects host system and network environment information.
* Introduced detection for Python DLL sideloading attempts, highlighting suspicious Python libraries that may facilitate hijacking of execution flow.
* Other smaller improvements include rule updates, quality of life enhancements, and fixes for false positives.
### Sigma
* DRONE has been updated with the most recent Sigma rule updates from SigmaHQ and Hayabusa repositories.
## 10.1.0 (26/07/25)
### Dynamo Analyzer
* Improved detection of suspicious Windows scheduled tasks by expanding monitored command line path patterns.
* Enhanced identification of various hacker tool names commonly found in forensic evidence.
### MITRE ATT\&CK Analyzer / YARA
* Added new detections for APT Patchwork, including its shellcode loader, remote access trojan, and shellcode runner, to identify related malicious activity.
* Extended Lazarus APT coverage with detections for RootTroy backdoor, malicious implant, trojan, and CryptoBot infostealer, alongside existing detections for RustBucket and other Lazarus malware variants.
* Introduced detection of Nim-based binaries, covering Windows, Linux, and macOS platforms, to flag potentially suspicious executables that require further analysis.
* Added detection for the RouterScan hack tool used for network service discovery and router enumeration.
* Detected LNK files executing PowerShell commands with suspicious paths and those with embedded URLs, highlighting potential initial access techniques.
* Added detection for payloads created by the commercial evasion framework SHELLTER, commonly used to deploy post-exploitation payloads and evade antivirus and EDR solutions.
* Other smaller improvements include rule updates, quality of life enhancements, and fixes for false positives.
### Sigma
* DRONE has been updated with the most recent Sigma rule updates from SigmaHQ and Hayabusa repositories.
## 10.0.5 (22/07/25)
### Sigma
* DRONE has been updated with the latest Sigma rule enhancements from the SigmaHQ and Hayabusa repositories, including detection for exploitation attempts of CVE-2025-53770.
## 10.0.4 (21/07/25)
### MITRE ATT\&CK Analyzer / YARA
* Added detections for artifacts related to SharePoint server exploitation via CVE-2025-53770, including web log entries, URIs, and ASPX webshells (both source and compiled forms).
## 10.0.3 (18/07/25)
### Dynamo Analyzer
* Added detection for anomalous activity volume in HubSpot users by comparing recent activity to historical baselines.
* Implemented identification of suspicious first-time user activities in HubSpot within the first day of account creation, focusing on potentially destructive or high-privilege actions.
* Introduced detection for rapid successive actions in HubSpot audit logs, flagging potential automated or compromised account behavior based on action frequency and speed.
* Created a comprehensive detector for suspicious activities in HubSpot audit logs, covering user management, API key management, data export, off-hours activity, authentication failures, and configuration changes.
* Enhanced identification of various hacker tool names commonly found in forensic evidence.
* Improved Windows Osquery detection by enriching WinSCP Host Key extraction with associated user information through joined registry and user datasets.
### MITRE ATT\&CK Analyzer / YARA
* Added detection for RansomHub ransomware, a cross-platform threat known for aggressive encryption and ransom note deployment.
* Added detection for the Veeamp credential dumping tool, targeting SQL databases used by Veeam backup management software.
* Other smaller improvements include detection updates, quality-of-life enhancements, and fixes for false positives.
## 10.0.2 (15/07/25)
### MITRE ATT\&CK Analyzer / YARA
* Improved detection of multiple native IIS malware families, including IIS-Raid variants, RGDoor, IIStealer, ISN, IISpy, IISerpent, and other groups targeting IIS servers.
* Added identification of a malicious IIS module used in SEO poisoning attacks.
* Refined detection logic to focus on filesystem context for better accuracy and reduced false positives.
* Other smaller improvements include rule updates, quality-of-life enhancements, and fixes for false positives.
## 10.0.1 (15/07/25)
### Dynamo Analyzer
* Added detection for cached WinSCP host keys in the Windows registry, which may indicate unauthorized use of WinSCP for remote file transfers.
## 10.0.0 (14/07/25)
### Dynamo Analyzer
* Improved detection of scheduled tasks with suspicious extensions by adding exclusions for specific system paths.
* Updated detection logic for services to better identify unusual paths used by adversaries.
* Enhanced identification of various hacker tool names commonly found in forensic evidence.
### MITRE ATT\&CK Analyzer / YARA
* Added detection for a tool demonstrating multiple methods for bypassing application whitelisting on Windows systems.
* Included rules for identifying Office template injection exploits commonly used for defense evasion.
* Enhanced detection capabilities for process injection indicators using common patterns.
* Implemented identification measures for suspicious Cmdl32 usage, often leveraged as a LOLBin for stealthy command execution.
* Developed a rule to detect the use of the SOAPHound tool, which is associated with Active Directory enumeration.
* Updated CobaltStrike beacon detection to include specific DLL characteristics signs.
* Other smaller improvements include rule updates, quality-of-life enhancements, and fixes for false positives.
## 9.6.1 (30/06/25)
### Dynamo Analyzer
* Improved detection of suspicious service paths by including all fields in query results.
## 9.6.0 (30/06/25)
### Dynamo Analyzer
* Added comprehensive detection for Model Context Protocol (MCP) server activities on Windows endpoints, which includes configuration files, environment variables, network activity, processes, and installed programs. These detections aim to identify unauthorized access to AI assistants and potential data exfiltration capabilities.
### MITRE ATT\&CK Analyzer / Yara
* Implemented detection for various native IIS malware families, including IIS-Raid derivatives, RGDoor, IIStealer, ISN, IISpy, IISerpent, and others. Each detection targets specific characteristics of the respective malware family.
* Updated detection rule for samples protected by the ConfuserEx protector, enhancing identification accuracy.
* Other, more minor improvements include rule updates, quality-of-life enhancements, and fixes for false positives.
## 9.5.0 (04/07/25)
### YARAS
* Added detection for KoiLoader/KoiStealer malware.
* Added detection for various documented hacker tools used by the threat actors in recent operations.
* Quality of life and false positive fixes.
* Many other smaller rules are in place for detecting various Initial Access IOCs.
### Dynamo
* Updated the list of various hacker tools commonly found in forensic evidence.
## 9.2.2 (07/05/25)
### YARA
* Added detection for Python-based Anubis backdoor used by FIN7, a financially motivated threat group.
* Added detection for QDoor backdoor.
* Added detection for SectopRAT, aka ArechClient2.
* Added detection for Lazarus APT BeaverTail malware and its infostealer component.
* Added detection for a new variant of Stealcstealer.
* Added detection for EarthKurma APT Dunloader backdoor.
### Dynamo
* Added identification of risky Windows Registry settings such as enabled RDP, enabled vulnerable SMB, usage of unencrypted WDigest protocol, and more.
## 9.0.1 (02/04/25)
### YARA
* Updated detection of SystemBC multiplatform proxy malware.
* Updated detection of Play ransomware variant and the tools used by this threat actor.
* other small fixes and improvements.
## 9.0.0 (02/04/25)
### YARA
* Added detection for HUI Loader that has been used since at least 2015 by China-based threat groups, including Cinnamon Tempest and menuPass, to deploy malware on compromised hosts. (S1097)
* Added detection for ShadowPad backdoor. ShadowPad is a well-known and privately sold modular backdoor, known to only be supplied to China-aligned APT groups. (S0596)
* Added detection for SodaMaster that has been used by Chinese threat actors to download and execute payloads since at least 2020. (S0627)
* Added detection for SparowDoor backdoor linked to the Chinese FamousSparrow threat actor.
* Added detection for ABYSSWORKER rootkit driver, deployed to target and silence different EDR vendors.
* Enhanced detection of samples using compromised/revoked digital signatures.
* Added detection for various tools used for credentials stealing, brute force, network discovery, and reverse proxy techniques.
* Many other smaller fixes and improvements.
### Dynamo
* Enhanced identification of the latest hacker tool names found in forensic evidence that are commonly used in attacks.
## 8.7.0 - 8.7.1 (05/03/25)
### YARA
* Added detection for Winos command and control framework, targeting users in Taiwan in latest campaign.
* Improved detection of ransomware variants targeting the ESXi platform.
* Added detection for Sosano backdoor, targeting organizations with a distinct interest in aviation and satellite communications, along with critical transportation infrastructure.
## 8.6.3 (03/03/25)
### YARA
* Added detection for Sagerunex backdoor attributed to Lotus Blossom APT. (G0030)
## 8.6.2 (03/03/25)
### YARA
* Added detection for Lazarus APT attributed InvisibleFerret and BeaverTail malware variants. (G0032)
* Enchanced detection of malicious samples targetting crypto related browser extensions.
## 8.6.1 (03/03/25)
### YARA
* Improved detection of LightSpy windows variant, developed by Chinese attributed APT41. (G0096)
* Added detection for macOS variant of malware dubbed Rustdoor, possibly linked with notorious Windows ransomware groups.
## 8.6.0 (26/02/25)
### YARA
* Added detection for Gh0stRAT, a remote access trojan that has been used to hack into some of the most sensitive computer networks on Earth. (S0032)
* Added detection for macOS capable ransomware with exfiltration capabilities, masquerading itself as LockBit. (T1486)
* Enhanced detection of vulnerable drivers used for privilege escalation and defense evasion purposes. (T1068)
### Dynamo
* Enhanced identification of forensic evidence where PowerShell executed encoded content. (T1027.010)
## 8.5.1 (12/02/25)
### YARA
* Minor fixes.
## 8.5.0 (11/02/25)
### YARA
* Added detection for custom backdoor attributed to Lazarus APT group dubbed Deceptive Development spreading via fake job offers. (G0032)
* Added detection for hack tools used for dumping Veeam credentials stored in MSSQL databases. (T1555)
* Added detection for ValleyRAT backdoor attributed to Silver Fox cybercrime group.
* Other small fixes and improvements.
### Dynamo
* Enhanced identification of hack tools found in forensic evidence.
## 8.4.0 (26/01/25)
### YARA
* Minor fixes.
## 8.3.0 (26/01/25)
### YARA
* Minor fixes.
## 8.2.4 (30/12/24)
### YARA
* Added detection for malicious extensions involved in the Cyberhaven compromise and a broader campaign targeting Chrome extensions for credential-stealing purposes.
## 8.2.0 (26/12/24)
### YARA
* FP fixes and verdict improvements.
## 8.1.0 (26/12/24)
### YARA
* Access logs detection improvement. We now tend to show the entire line instead of matching string of interest only.
* Added detection for BrazenBamboo APT.
* FP fixes
### Dynamo
* HTML smuggling improvement and FP fixes.
* Improved description of rules.
## 8.0.2 (04/12/24)
### YARA
* Added detection for GHOSTSPIDER backdoor, attributed to the Chinese Earth Estries APT group, primarily targeting critical industries such as telecommunications and government entities
* Added detection for Pygmy Goat, which was discovered on Sophos XG firewall devices, providing backdoor access to the device.
## 8.0.1 (28/11/24)
### YARA
* Added detection for STEALHOOK, an exfiltration tool used by OilRig (APT34) group. (G0049)
* Added detection for tools designed to exploit CVE-2024-30088, a Windows Kernel elevation of privilege vulnerability. (T1068)
## 8.0.0 (28/11/24)
### YARA
* Enhanced identification of Vulnerable and Malicious drivers that are weaponized by threat actors for defense evasion purposes. (T1068)
* Added detection for EDRSandblast, a hack tool designed to bypass EDR detection. (T1562)
* Enhanced detection of various tools used by threat actors for Credentials Access, Discovery, Lateral Movement, and other TTPs.
## 7.3.0 (28/11/24)
### YARA
* Added detection for Medusa ransomware.
* Added detection for Ymir ransomware.
* Yara rules that scan Access Logs for signs of exploitation attempts are now updated to show the entire line where suspicious activity was detected.
## 7.3.0 (28/11/24)
### YARA
* Added detection for RDP configuration files that include unusual sets of permissions such as access to audio, disks, and the clipboard. (T1219)
* Added detection for various hack tools designed to extract passwords from password stores. (T1555)
## 7.2.0 (28/10/24)
### YARA
* Added detection for BianLian ransomware. (T1486)
* Enhanced identification of credential stealers that collect browser data. (T1005)
* Enhanced detection of Cobalt Strike. (S0154)
* Enhanced detection of memory dumpers and scripts designed to extract and decrypt Kerberos tickets. (T1558)
## 7.1.0 (18/10/24)
### YARA
* Added detection for DragonForce ransomware binaries. (T1486)
* Added detection for Angry IP Scanner. (T1018)
## 7.0.0 (18/10/24)
### YARA
* Added detection for Clop and MedusaLocker ransomware binaries observed in September 2024. (TA0040)
* Enhanced detection of the Defender Control hack tool often used to disable Microsoft Defender. (T1562.001)
* Added detection for HRSword, which threat actors use for defense evasion. (T1562)
* Multiple minor FP fixes and performance improvements.
## 6.3.1 (08/08/24)
### YARA
* Added detection for Bugsleep backdoor attributed to the Iranian MuddyWater threat actor.
## 6.3.0 (07/08/24)
### YARA
* Added detection for Java-based STRRAT and related IOCs.
* Added detection for APT group dubbed StormBamboo/Evasive Panda that compromised an internet service provider (ISP) in order to poison DNS responses for target organizations.
## 6.2.0 (07/08/24)
### YARA
* Andariel/Lazarus IOCs update. (G0138, G0032)
* Added detection for Maui ransomware.
### YARA
* Andariel/Lazarus IOCs update. (G0138, G0032)
* Added detection for Maui ransomware.
## 6.1.1 (07/08/24)
### YARA
* Andariel IOCs update. (G0138)
* Improved detection of Metasploit implants for Linux.
## 6.1.0 (07/08/24)
### YARA
* Added detection for IOCs attributed to North Korean Lazarus/Andrariel groups outlined in CISA report. (G0032, G0138)
* Added detection for open-source Lilith RAT. (T1219)
## 6.0.0 (07/08/24)
### YARA
* Improved detection of Shellcode loaders.
* Added detection for the SharpSploit post-exploitation tool.
* Other minor fixes and improvements.
## 5.7.0 (17/07/24)
### YARA
* Added detection for Pirpi backdoor attributed to the Chinese APT3 group. (G0022)
* Added detection for IOCs used in the latest attacks by the APT41 group. (G0096)
* Added detection for URL Shortcuts, taking advantage of CVE-2024-38112 vulnerability.
## 5.6.2 (17/07/24)
### Sigma
* Improved detection of PowerShell processes using base64 obfuscation.
## 5.6.1 (17/07/24)
### Dynamo
* Improved detection of CobaltStrike service installation.
## 5.6.0 (17/07/24)
### YARA
* Added detection for known malicious VSCode extensions.
* Improved detection of successful ProxyShell exploitation found in server logs.
* Various quality of life and FP fixes.
## 5.5.2 (17/07/24)
### YARA
* Improved detection of ASPX compiled DLL webshells.
## 5.5.1 (17/07/24)
### YARA
* Added lsass exclusion for memory scanning. (internal only changelog)
## 5.5.0 (17/07/24)
### YARA
* Added detection for malware known as DISGOMOJI, taking advantage of emojis for C2 communication.
* Added detection for the Durian backdoor attributed to Kimsyky ATP group. (G0094)
* Added detection for BadSpace backdoor.
* Various quality of life and FP fixes.
### Dynamo
* Improved detection of Registry Run entries and Scheduled Tasks with base64 encoded PowerShell keyword.
## 5.4.0 (10/06/24)
### YARA
* Added detection for exploitation attempt indicators of a critical argument injection vulnerability in PHP (CVE-2024-4577).
* Added detection for BitRAT backdoor.
* Added detection for OrcusRAT backdoor.
* Added detection for LightSpy malware targeting macOS.
* Improved identification of path traversal indicators in server logs that suggest exploitation attempts.
* Improved detection of .NET obfuscated/protected binaries.
## 5.3.1 (31/05/24)
### YARA
* Updated list of path traversal attacks.
## 5.3.0 (31/05/24)
### YARA
* Added detection for CrimsonRAT. (S0115)
* Improved detection of the IcedID Trojan. (S0483)
* Improved detection of ISO archives with hidden scripts and signs of DLL Side-loading technique. (T1574.002)
* Added detection for the Mythic C2 framework agent.
### Dynamo/osquery
* Added identification of possible ARP poisoning/spoofing.
## 5.2.0 (22/05/24)
### YARA
* Added detection for DiceLoader trojan attributed to FIN7. (G0046)
* Added detection for Ebury botnet. (S0377)
* Added detection for Latrodectus trojan. (T1218.011, T1055, T1053.005, T1070.004, T1059.003)
* Added detection for macOS Cuckoo and Atomic stealer. (T1059.002, T1555)
* Enhanced detection for Relective Code Loading technique. (T1620)
* Enhanced detection of Powershell based loaders. (T1059.001)
* Added detection for Kinsing miner. (S0599)
* Improved identification of vulnerable and malicious drivers used for privilege escalation. (T1068)
* Various other fixes and improvements.
### Dynamo
* Enhanced detection of network discovery and PowerShell commands in forensic evidence.
## 5.1.2 (17/05/24)
### YARA
* Improved detection of the Metasploit framework.
* Added detection of masqueraded LUA based samples. (T1036.008)
* Added detection for the GooseEgg hack tool, which is used for privilege escalation and credential access, attributed to APT28. (G0007)
## 5.1.1 (17/05/24)
### YARA
* Added detection for Rawdoor, a backdoor attributed to Chinese APT31 group. (G0128)
* Added detection for CR4T backdoor discovered in campaign targeting government entities in the Middle East.
* Improved detection of Pupy opensource, cross-platform C2 and post-exploitation framework constantly being used by various threat actors.
* Improved detection of Linux-based webshells. (T1505.003)
* Improved detection or ZIP archives with indicators of DLL sideloading technique. (T1574.002, T1566)
## 5.1.0 (18/04/24)
### YARA
* Added detection for Kapeka backdoor attributed to Sandworm APT44 group. (G0034)
* Improved/added detection of various malware such as DarkGate, Nitrogen, FatalRAT, WikiLoader.
* Added detection for IOCs related to GlobalProtect CVE-2024-3400.
* Improved detection of Python-based loaders. (T1059.006)
* Improved detection of various shellcode implants e.g. Metasploit-based. (T1620)
* Added detection for IOCs masqueraded as certificates. (T1036.008, T1027)
* Improved detection of obfuscated Javascript-based droppers, suspicious base64 encoded IOCs, and PowerShell-based loaders. (T1620, T1059.001, T1059.007, T1027)
* And many other smaller improvements.
## 5.0.2 (18/04/24)
### Sigma
* Powershell detection update
## 5.0.1 (11/04/24)
### YARA
* Vidar stealer FP fix.
## 5.0.0 (09/04/24)
### YARA
* Added detection for Linux local privilege escalation exploit for CVE-2024-1086.
* Added detection for various APT groups related IOCs, including APT28, APT29, APT33, and APT42. (G1006, G0007, G0016, G0064, G0059)
* Added detection for Dark Crystal a.k.a DCRat.
* Added detection for Sharpire post-exploitation agent. (S0363)
* Enhanced detection of obfuscated Golang-based binaries. (T1027)
* Enhanced detection of Nim-based binaries.
* Enhanced detection of RMM tools and software. (T1219)
* Enhanced identification of misplaced binaries is often used for DLL Side-loading. (T1574.002)
* Enhanced identification of potentially misplaced script-based samples is often used for masquerading purposes. (T1036.005)
* Enhanced identification of samples abusing double extension to trick users into executing malicious files. (T1036.007)
### Dynamo
* Enhanced detection of various hacker commands found in areas such as PowerShell commands, console, and console history.
* Vastly improved detection of RMM software commonly abused by malicious actors. (T1219)
## 4.3.1. (01/04/24)
### YARA
* Added detection for backdoored binaries and indicators of compromise found in XZ Utils 5.6.0 and 5.6.1. (CVE-2024-3094)
## 4.3.0 (22/03/24)
### YARA
* Added detection for Xdealer malware attributed to the China-nexus threat actor tracked as Earth Lusca. (G1006)
* Added detection for custom malware dubbed DinodasRAT targeting government organizations. (G1006)
* Added detection for binaries signed by a D2innovation certificate attributed to the Kimsuky APT group. (G0094)
* Added detection for Lumma information stealer (aka LummaC2 Stealer). (T1082, T1622, T1140, T1562, T1119, T1005, T1071, T1020)
* Added detection for Meduza info stealer. (T1614, T1082, T1113, T1552, T1571)
* Added detection for indicators found in compiled ASPX Web Shell DLLs. (T1505.003)
* Enhanced detection of samples having a suspicious keyword in their PDB path (e.g. Trojan, Shellcode). (TA0005)
* Enhanced detection of Remote Access Software Tools commonly used in ransomware attacks. (T1219)
* Enhanced detection of misplaced files masquerading as legitimate Windows binaries. (T1036.005)
* Enhanced detection of malicious samples and scripts obfuscated with XOR, AES and custom encoding. (T1027)
* Enhanced detection of samples abusing double extension in order to hide true file type. (T1036.007)
* Enhanced detection of LNK files executing suspicious PowerShell commands. (T1059.001, T1204.002)
* Enhanced detection of older exploits such as Zerologon, BlueKeep and more. ( T1021, T1068)
* Various other rules, fixes and performance improvements.
### Dynamo
* Updated Hacker Tool list with new keywords for hunting in forensic artifacts such as Applications, Cronjobs, Downloads, MFT, Prefetch, Processes, Registry, Scheduled Tasks, Services, ShellBags, Shell History, and Shimcache. (T1588.002)
* Updated detections of Remote Management Software Website domains in DNS Cache, indicating potentially unwanted usage of remote access software. (T1219)
## 4.2.3 (05/03/24)
### YARA
* Added detection for indicators of compromise indicating exploitation attempts of two recent vulnerabilities in JetBrains TeamCity Multiple Authentication Bypass Vulnerabilities (CVE-2024-27198 and CVE-2024-27199)
* Added detection for the Linux variant of Bifrost (aka Bifrose). Bifrost is a remote access Trojan (RAT) that allows an attacker to gather sensitive information, like hostname and IP address. (T1219)
* Added detection for Xeno RAT; an intricately designed malware, crafted with advanced functionalities, conveniently accessible at no cost on GitHub. (T1059.003, T1053.005, T1622, T1497, T1055, T1071.00)
* Added detection for suspicious unsigned executables protected with Obsidium protector. (T1027.002)
* Added detection for FudModule rootkit exploiting CVE-2024-21338 kernel elevation of privilege vulnerability. (T1068)
* Enhanced detection of files found outside of their default location which is a very popular way of hiding malicious files under a known name of a legitimate Windows component. (T1036.005)
* Enhanced detection of CobaltStrike beacons. (S0154)
## 4.2.2 (27/02/24)
### YARA
* Added detection for indicators of compromise, indicating exploitation attempts of two recent vulnerabilities in ConnectWise ScreenConnect. (CVE-2024-1709 & CVE-2024-1708)
## 4.2.1 (24/02/24)
### YARA
* Restored %WINDIR%\Temp to depth 2 recursion for now.
## 4.2.0 (23/02/24)
### YARA
* Restored memory scan \[INTERNAL USAGE detail]
* Added detection for the latest TinyTurla IOCs (G0010)
* Improved detection of Linux Shell scripts commonly used in malicious attacks. Examples include log removal, public DNS insertion, manipulation of root SSH keys, and other post-exploitation commands.
* Enhanced detection of various hack tools mentioned in the latest malware campaigns.
## 4.1.0 (20/02/24)
### YARA
* Added detection for emails exploiting the Microsoft Outlook CVE-2024-21413 vulnerability.
* Enhanced detection of the Silver red team framework implant. (S0633)
* Added detection for IOCs abusing the Mockbin service for malicious purposes. (T1090.004, T1102)
* Added detection for IOCs designed to capture NTLMv2 hashes. (T1187)
* Enhanced detection of binaries named after legitimate Windows executables for masquerading and defense evasion purposes. (T1036.005)
* Enhanced detection of IOCs with base64 encoded keywords such as Powershell, WScript, and many more. (T1027)
* Enhanced detection of ESXi ransomware variants. (TA0040)
* Enhanced detection for many other IOCs with references to suspicious locations and suspicious commands, such as disabling UAC, enabling RDP, and more. (T1562.001, T1059.001, T1021.001, T1112)
* Various other fixes and performance improvements.
### Dynamo
* Added detection for Crypto Mining Pool Address in DNS Cache and Browser History. (T1496)
* Added detection for registry run entries executing PowerShell command to read data stored in Registry. (T1547.001, T1059.001)
* Added detection for registry run entries executing suspicious PowerShell commands. (T1547.001, T1059.001)
* Updated list of Widely Abused Top-Level Domains found in DNS Cache. (T1583.001)
* Updated Hacker Tool list with over 100 new keywords for hunting in forensic artifacts such as Applications, Cronjobs, Downloads, MFT, Prefetch, Processes, Registry, Scheduled Tasks, Services, ShellBags, Shell History, and Shimcache. (T1588.002)
* Updated detections for hunting Large File Transfer Websites in DNS Cache, which can be used for uploading sensitive/confidential data. (T1567.002)
## 4.0.1 (05/02/24)
### YARA
* Added detection for C# and dictionary-based webshells.
* Enhanced detection of JSP webshells.
* Enhanced detection of directory traversal and XSS injection indicators found in server logs.
* Enhanced detection of ProxyShell and ProxyNotShell vulnerabilities.
* Added detection of various Linux exploits.
* An updated list of vulnerable and malicious drivers from LOL Drivers project.
* Added detection for binaries using potentially compromised AnyDesk certificate.
* Other minor fixes.
### Dynamo
* Minor FP fixes.
## 3.5.2 (22/01/24)
### YARA
* Added more detection rules for IOCs observed in the exploitation of Ivanti VPN. (CVE-2023-46805 and CVE-2024-21887)
* Added detection for IOCs related to Russian threat group COLDRIVER (also known as UNC4057, Star Blizzard, and Callisto)\
Reference: https://blog.google/threat-analysis-group/google-tag-coldriver-russian-phishing-malware/
## 3.5.1 (22/01/24)
### YARA
* Added detection for IOCs linked to Iranian and Russian APT groups such as BlueBravo and Siamesekitten. (APT29, G1001)
* Added detection for IOCs linked to Iranian OilRig APT. (G0049)
* Improved detection of Lazarus APT-related IOCs. (G0032)
* Added detection of Outlook CVE-2023-23397 vulnerability exploitation.
* Improved identification of remote access software. (T1219)
* Improved detection of PowerShell scripts loading obfuscated content directly into memory. (T1059.001, T1620)
* Added detection for archives exploiting Baracuda ESG vulnerability CVE-2023-2868.
* Added detection for implants related to Alchimist attack framework.
* Added detection of pkexec CVE-2021-4034 vulnerability exploitation.
* Improved detection of various hacktools used for port scanning, brute force, and privilege escalation.
* Improved detection of mixed casing keywords often used as a way of obfuscation. (T1027)
* Improved detection of double file extension masquerading in archives such as ZIP or RAR. (T1036.007)
* Enhanced detection of indicators of various exploitation attempts, including Log4j, SQL Injection, XSS attacks, path traversal attacks, and more. (T1190)
* Added detection for IOCs found in the exploitation of Ivanti Connect Secure VPN. (CVE-2023-46805, CVE-2024-21887)\
and more
### Dynamo
* Added detection for scheduled tasks executing Certutil. (T1053.005, S0160)
### Other
* Various FP fixes and performance improvements.
---
# Event Subscription
> Source: https://kb.binalyze.ai/air/features/event-subscription.html
### Overview
The Event Subscription feature enables users to register a URL that the system will call with event details. This allows users to integrate with external systems by sending JSON payloads to the specified URL whenever subscribed events occur.
### Key Features
1. **URL Registration**: Users can provide a URL that will be called with a `POST` request containing event information in a JSON payload.
2. **Secure Headers**: Every request to the registered URL includes an `Authorization: Bearer ` header for authentication.
3. **Event Selection**: Users can select one or multiple events they want the system to notify their URL about.
4. **Subscription Status**: Users can activate or deactivate subscriptions at any time.
5. **Audit Logs**: The system logs errors or issues when the registered URL cannot be accessed, providing insights into potential failures.
### Example HTTP request
`POST HTTP/1.1 Host: Authorization: Bearer Content-Type: application/json } "eventName": "TaskProcessingCompletedEvent", "organizationId": 1, "data" : { "taskId": "12345", "taskDetailsUrl": "/#/task-details/12345", "taskType": "Export", "assetId": "67890" } }`
### Audit Logs
The system maintains logs for monitoring calls:
* Failed attempts to access the URL (e.g., `404 Not Found`, `500 Internal Server Error`) are recorded.
* Logs are accessible in the "Audit Logs" section, providing timestamps and error details for troubleshooting.
### Event List
#### DeploymentTokenRegeneratedEvent
This event is triggered when a deployment token is regenerated for an organization. The old token will be invalidated, and a new token will be used for deployments.
**Parameters**
* **organizationId**: (string) The ID of the organization.
* **organizationName**: (string) The name of the organization.
* **oldToken**: (string) The old deployment token.
* **newToken**: (string) The new deployment token.
**HTTP request example**
`POST HTTP/1.1 Host: Authorization: Bearer Content-Type: application/json { "eventName": "DeploymentTokenRegeneratedEvent", "organizationId": 1, "data": { "organizationId": "1", "organizationName": "example", "oldToken": "oldToken", "newToken": "newToken" } }`
### Supported Events:
[DeploymentTokenRegeneratedEvent](event-subscription.md#deploymenttokenregeneratedevent)\
[CaseFileSavedEvent](event-subscription.md#casefilesavedevent)\
[TaskProcessingCompletedEvent](event-subscription.md#taskprocessingcompletedevent)\
[TaskProcessingFailedEvent](event-subscription.md#taskprocessingfailedevent)\
[AirVersionAvailableEvent](event-subscription.md#airversionavailableevent)\
[AssetCreatedEvent](event-subscription.md#assetcreatedevent)\
[CaseArchivedEvent](event-subscription.md#casearchivedevent)\
[CaseClosedEvent](event-subscription.md#caseclosedevent)\
[CaseCreatedEvent](event-subscription.md#casecreatedevent)\
[EndpointDeletedEvent](event-subscription.md#endpointdeletedevent)\
[EndpointOfflineEvent](event-subscription.md#endpointofflineevent)\
[EndpointOnlineEvent](event-subscription.md#endpointonlineevent)\
[EndpointIsolationStatusUpdatedEvent](event-subscription.md#endpointisolationstatusupdatedevent)\
[EndpointRegisteredEvent](event-subscription.md#endpointregisteredevent)\
[EndpointUninstalledEvent](event-subscription.md#endpointuninstalledevent)\
[TasksHaveBeenTakenByEndpointEvent](event-subscription.md#taskshavebeentakenbyendpointevent)\
[DroneFileSavedEvent](event-subscription.md#dronefilesavedevent)\
[OrganizationCreatedEvent](event-subscription.md#organizationcreatedevent)\
[OrganizationDeletedEvent](event-subscription.md#organizationdeletedevent)\
[OrganizationUpdatedEvent](event-subscription.md#organizationupdatedevent)\
[RelayServerRegisteredEvent](event-subscription.md#relayserverregisteredevent)\
[RelayServerRemovedEvent](event-subscription.md#relayserverremovedevent)\
[TaskAssignedToEndpointEvent](event-subscription.md#taskassignedtoendpointevent)\
[TaskAssignmentCancelledEvent](event-subscription.md#taskassignmentcancelledevent)\
[TaskAssignmentDeletedEvent](event-subscription.md#taskassignmentdeletedevent)\
[TaskCancelledEvent](event-subscription.md#taskcancelledevent)\
[TaskCompletedEvent](event-subscription.md#taskcompletedevent)\
[TaskFailedEvent](event-subscription.md#taskfailedevent)\
[TaskDeletedEvent](event-subscription.md#taskdeletedevent)\
[TaskScheduledForEndpointEvent](event-subscription.md#taskscheduledforendpointevent)\
[TriageRuleMatchedEvent](event-subscription.md#triagerulematchedevent)\
[TriageTaskCompletedEvent](event-subscription.md#triagetaskcompletedevent)\
[AcquisitionTaskCompletedEvent](event-subscription.md#acquisitiontaskcompletedevent)\
[InterACTShellStartedEvent](event-subscription.md#interactshellstartedevent)
#### CaseFileSavedEvent
This event is triggered when a case file is saved to the AIR by Off-Network or Assets.
**Parameters**
* **assetId**: (string) The ID of the asset
* **taskId**: (string) The ID of the task.
* **reportURL**: (string) Report URL.
**HTTP request example**
```
POST HTTP/1.1
Host:
Authorization: Bearer
Content-Type: application/json
}
"eventName": "TaskProcessingCompletedEvent",
"organizationId": 1,
"data" : {
"taskId": "12345",
"taskDetailsUrl": "/#/task-details/12345",
"taskType": "Export",
"assetId": "67890"
}
}
```
#### TaskProcessingCompletedEvent
This event is triggered when a Task’s processes are completed. These processes may include actions such as data collection, analysis, reporting, or other workflow steps associated with the task. Completion indicates that all required steps have been successfully executed.
**Parameters**
* **taskId**: (string) The ID of the task.
* **taskDetailsUrl:** (string) The URL of the task details
* **taskType**: (string) The task type of the task (Acquire evidence, Hunt/Triage vs.)
* **assetId**: (string) The assetId which is assigned to the task.
**HTTP request example**
`POST HTTP/1.1 Host: Authorization: Bearer Content-Type: application/json { "eventName": "TaskProcessingCompletedEvent", "organizationId": 1, "data": { "taskId": "taskId", "taskDetailsUrl": "url", "taskType": "taskType", "assetId": "assetId", } }`
#### TaskProcessingFailedEvent
This event is triggered when a Task’s processes fail. This could occur due to various reasons such as resource unavailability, misconfiguration, or unexpected errors during execution. Users should review the task details and the associated error reason to identify the root cause and take corrective actions, such as retrying the task or fixing the underlying issues.
**Parameters**
* **taskId**: (string) The ID of the task.
* **taskDetailsUrl:** (string) The URL of the task details
* **taskType**: (string) The task type (Acquire evidence, Hunt/Triage vs.)
* **assetId**: (string) The assetId which is assigned to the task.
**HTTP request example**
`POST HTTP/1.1 Host: Authorization: Bearer Content-Type: application/json { "eventName": "TaskProcessingFailedEvent", "organizationId": 1, "data": { "taskId": "taskId", "taskDetailsUrl": "url", "taskType": "taskType", "assetId": "assetId", } }`
#### AirVersionAvailableEvent
This event is triggered when a new version of the AIR product is available. It informs the system or users about the newly available version and compares it with the current version in use.
**Parameters**
* **newVersion**: (string) The new version of the AIR that is now available.
* **currentVersion**: (string) The current version of the AIR in use.
* **releaseNotes:** (string) The notes of the release
**HTTP request example**
`POST HTTP/1.1 Host: Authorization: Bearer Content-Type: application/json { "eventName": "AirVersionAvailableEvent", "organizationId": 1, "data": { "newVersion": "2.0.0", "currentVersion": "1.0.0", "releaseNotes": "Hi new changes applied" } }`
#### AssetCreatedEvent
This event is triggered when a new asset is created in the system. It provides details about the asset, including its ID, name, type, and creation timestamp.
**Parameters**
* **id**: (string) The unique identifier of the asset.
* **name**: (string) The name of the asset.
* **type**: (string) The type of the asset
* **createdAt**: (string) The date when the asset was created.
**HTTP request example**
`POST HTTP/1.1 Host: Authorization: Bearer Content-Type: application/json { "eventName": "AssetCreatedEvent", "organizationId": 1, "data": { "id": "asset-id", "name": "Asset Name", "type": "Asset Type", "createdAt": "2025-01-28T12:00:00Z" } }`
#### CaseArchivedEvent
This event is triggered when a case is archived in the system. It provides details about the archived case, including its ID and name.
**Parameters**
* **id**: (string) The unique identifier of the archived case.
* **name**: (string) The name of the archived case.
**HTTP request example**
`POST HTTP/1.1 Host: Authorization: Bearer Content-Type: application/json { "eventName": "CaseArchivedEvent", "organizationId": 1, "data": { "id": "case-id", "name": "Case Name" } }`
#### CaseClosedEvent
This event is triggered when a case is closed in the system. It provides details about the closed case, including its ID, name, and the timestamp when it was closed.
**Parameters**
* **id**: (string) The unique identifier of the closed case.
* **name**: (string) The name of the closed case.
* **closedOn**: (string) The date when the case was closed.
**HTTP request example**
`POST HTTP/1.1 Host: Authorization: Bearer Content-Type: application/json { "eventName": "CaseClosedEvent", "organizationId": 1, "data": { "id": "case-id", "name": "Case Name", "closedOn": "2025-01-28T12:00:00Z" } }`
#### CaseCreatedEvent
This event is triggered when a new case is created in the system. It provides details about the created case, including its ID, name, and the owner user of the case.
**Parameters**
* **id**: (string) The unique identifier of the created case.
* **name**: (string) The name of the created case.
* **ownerUser**: (string) The user who owns the created case.
**HTTP request example**
`POST HTTP/1.1 Host: Authorization: Bearer Content-Type: application/json { "eventName": "CaseCreatedEvent", "organizationId": 1, "data": { "id": "case-id", "name": "Case Name", "ownerUser": "user-name" } }`
#### EndpointDeletedEvent
This event is triggered when an endpoint is deleted from the system. It provides details about the deleted endpoint, including its ID, name, label, version, and platform.
**Parameters**
* **id**: (string) The unique identifier of the deleted endpoint.
* **name**: (string) The name of the deleted endpoint.
* **label**: (string) The label associated with the deleted endpoint.
* **version**: (string) The version of the deleted endpoint.
* **platform**: (string) The platform of the deleted endpoint.
**HTTP request example**
`POST HTTP/1.1 Host: Authorization: Bearer Content-Type: application/json { "eventName": "EndpointDeletedEvent", "organizationId": 1, "data": { "id": "endpoint-id", "name": "Endpoint Name", "label": "Endpoint Label", "version": "1.0.0", "platform": "Platform Name" } }`
#### EndpointOfflineEvent
Triggered when an endpoint goes offline.
**Parameters**
* **id**: (string) The unique identifier of the deleted endpoint.
* **name**: (string) The name of the deleted endpoint.
**HTTP request example**
`POST HTTP/1.1 Host: Authorization: Bearer Content-Type: application/json { "eventName": "EndpointOfflineEvent", "organizationId": 1, "data": { "id": "endpoint-id", "name": "Endpoint Name" } }`
#### EndpointOnlineEvent
Triggered when an endpoint comes online.
**Parameters**
* **id**: (string) The unique identifier of the deleted endpoint.
* **name**: (string) The name of the deleted endpoint.
**HTTP request example**
`POST HTTP/1.1 Host: Authorization: Bearer Content-Type: application/json { "eventName": "EndpointOnlineEvent", "organizationId": 1, "data": { "id": "endpoint-id", "name": "Endpoint Name" } }`
#### EndpointIsolationStatusUpdatedEvent
This event is triggered when the isolation status of an endpoint is updated. It provides details about the endpoint and the changes in its isolation status.
**Parameters**
* **endpointId**: (string) The unique identifier of the endpoint whose isolation status has been updated.
* **oldStatus**: (string) The previous isolation status of the endpoint.
* **newStatus**: (string) The new isolation status of the endpoint.
**HTTP request example**
`POST HTTP/1.1 Host: Authorization: Bearer Content-Type: application/json { "eventName": "EndpointIsolationStatusUpdatedEvent", "organizationId": 1, "data": { "endpointId": "endpoint-id", "oldStatus": "isolation-enabled", "newStatus": "isolation-disabled" } }`
#### EndpointRegisteredEvent
This event is triggered when a new endpoint is registered in the system. It provides details about the registered endpoint, including its ID, organization ID, name, platform, and version.
**Parameters**
* **id**: (string) The unique identifier of the registered endpoint.
* **organizationId**: (string) The ID of the organization that the endpoint belongs to.
* **name**: (string) The name of the registered endpoint.
* **platform**: (string) The platform associated with the registered endpoint.
* **version**: (string) The version of the registered endpoint.
**HTTP request example**
`POST HTTP/1.1 Host: Authorization: Bearer Content-Type: application/json { "eventName": "EndpointRegisteredEvent", "organizationId": 1, "data": { "id": "endpoint-id", "organizationId": "org-id", "name": "Endpoint Name", "platform": "Platform Name", "version": "1.0.0" } }`
#### EndpointUninstalledEvent
This event is triggered when an endpoint is uninstalled from the system. It provides details about the uninstalled endpoint, including its ID, name, platform, version, and the source of the uninstallation.
**Parameters**
* **id**: (string) The unique identifier of the uninstalled endpoint.
* **name**: (string) The name of the uninstalled endpoint.
* **platform**: (string) The platform associated with the uninstalled endpoint.
* **version**: (string) The version of the uninstalled endpoint.
* **uninstallSource**: (string) The source of the uninstallation, such as whether it was uninstalled via task, user, or due to migration
**HTTP request example**
`POST HTTP/1.1 Host: Authorization: Bearer Content-Type: application/json { "eventName": "EndpointUninstalledEvent", "organizationId": 1, "data": { "id": "endpoint-id", "name": "Endpoint Name", "platform": "Platform Name", "version": "1.0.0", "uninstallSource": "user" } }`
#### TasksHaveBeenTakenByEndpointEvent
This event is triggered when an endpoint has taken a set of tasks. It provides details about the endpoint and the tasks that have been assigned to it.
**Parameters**
* **endpointId**: (string) The unique identifier of the endpoint that has taken the tasks.
* **taskCount**: (number) The number of tasks that have been assigned to the endpoint.
* **taskNames**: (array of strings) The names of the tasks that have been assigned to the endpoint.
**HTTP request example**
`POST HTTP/1.1 Host: Authorization: Bearer Content-Type: application/json { "eventName": "TasksHaveBeenTakenByEndpointEvent", "organizationId": 1, "data": { "endpointId": "endpoint-id", "taskCount": 3, "taskNames": ["Task 1", "Task 2", "Task 3"] } }`
#### DroneFileSavedEvent
This event is triggered when a file related to a drone task is saved in the system. It provides details about the saved file, including the file path, the associated task ID, and the endpoint ID.
**Parameters**
* **droneZipPath**: (string) The path to the saved drone file (ZIP file).
* **taskId**: (string) The ID of the task associated with the saved drone file.
* **endpointId**: (string) The ID of the endpoint associated with the saved drone file.
**HTTP request example**
`POST HTTP/1.1 Host: Authorization: Bearer Content-Type: application/json { "eventName": "DroneFileSavedEvent", "organizationId": 1, "data": { "droneZipPath": "/path/to/drone/file.zip", "taskId": "task-id", "endpointId": "endpoint-id" } }`
#### OrganizationCreatedEvent
This event is triggered when a new organization is created in the system. It provides details about the newly created organization, including its ID and name.
**Parameters**
* **id**: (string) The unique identifier of the created organization.
* **name**: (string) The name of the created organization.
**HTTP request example**
`POST HTTP/1.1 Host: Authorization: Bearer Content-Type: application/json { "eventName": "OrganizationCreatedEvent", "organizationId": 1, "data": { "id": "organization-id", "name": "Organization Name" } }`
#### OrganizationDeletedEvent
This event is triggered when an organization is deleted from the system. It provides details about the deleted organization, including its ID and name.
**Parameters**
* **id**: (string) The unique identifier of the deleted organization.
* **name**: (string) The name of the deleted organization.
**HTTP request example**
`POST HTTP/1.1 Host: Authorization: Bearer Content-Type: application/json { "eventName": "OrganizationDeletedEvent", "organizationId": 1, "data": { "id": "organization-id", "name": "Organization Name" } }`
#### OrganizationUpdatedEvent
This event is triggered when an organization is updated in the system. It provides details about the updated organization, including its name and the fields that were updated.
**Parameters**
* **name**: (string) The name of the updated organization.
* **updatedFields**: (string) A comma-separated list of the fields that were updated in the organization.
**HTTP request example**
`POST HTTP/1.1 Host: Authorization: Bearer Content-Type: application/json { "eventName": "OrganizationUpdatedEvent", "organizationId": 1, "data": { "name": "Updated Organization Name", "updatedFields": "field1, field2, field3" } }`
#### RelayServerRegisteredEvent
This event is triggered when a new relay server is registered in the system. It provides details about the registered relay server, including its ID, name, endpoint ID, version, and endpoint name.
**Parameters**
* **id**: (string) The unique identifier of the registered relay server.
* **name**: (string) The name of the registered relay server.
* **endpointId**: (string) The ID of the endpoint associated with the relay server.
* **version**: (string) The version of the relay server.
* **endpointName**: (string) The name of the endpoint associated with the relay server.
**HTTP request example**
`POST HTTP/1.1 Host: Authorization: Bearer Content-Type: application/json { "eventName": "RelayServerRegisteredEvent", "organizationId": 1, "data": { "id": "relay-server-id", "name": "Relay Server Name", "endpointId": "endpoint-id", "version": "1.0.0", "endpointName": "Endpoint Name" } }`
#### RelayServerRemovedEvent
This event is triggered when a relay server is removed from the system. It provides details about the removed relay server, including its ID, name, and the associated endpoint ID.
**Parameters**
* **id**: (string) The unique identifier of the removed relay server.
* **name**: (string) The name of the removed relay server.
* **endpointId**: (string) The ID of the endpoint associated with the removed relay server.
**HTTP request example**
`POST HTTP/1.1 Host: Authorization: Bearer Content-Type: application/json { "eventName": "RelayServerRemovedEvent", "organizationId": 1, "data": { "id": "relay-server-id", "name": "Relay Server Name", "endpointId": "endpoint-id" } }`
#### TaskAssignedToEndpointEvent
This event is triggered when a task is assigned to an endpoint. It provides details about the task assignment, including the task name, endpoint name, case name, and the associated IDs.
**Parameters**
* **taskName**: (string) The name of the assigned task.
* **endpointName**: (string) The name of the endpoint the task is assigned to.
* **endpointId**: (string) The unique identifier of the endpoint.
* **caseName**: (string) The name of the case associated with the task.
* **assignmentId**: (string) The unique identifier of the task assignment.
* **caseId**: (string) The unique identifier of the case.
**HTTP request example**
`POST HTTP/1.1 Host: Authorization: Bearer Content-Type: application/json { "eventName": "TaskAssignedToEndpointEvent", "organizationId": 1, "data": { "taskName": "Task Name", "endpointName": "Endpoint Name", "endpointId": "endpoint-id", "caseName": "Case Name", "assignmentId": "assignment-id", "caseId": "case-id" } }`
#### TaskAssignmentCancelledEvent
This event is triggered when a task assignment to an endpoint is cancelled. It provides details about the cancelled task assignment, including the task's ID, name, type, and the endpoint it was assigned to.
**Parameters**
* **taskId**: (string) The unique identifier of the cancelled task.
* **taskName**: (string) The name of the cancelled task.
* **taskType**: (string) The type of the cancelled task.
* **endpointName**: (string) The name of the endpoint the task was assigned to.
* **endpointId**: (string) The unique identifier of the endpoint.
* **taskAssignmentId**: (string) The unique identifier of the cancelled task assignment.
**HTTP request example**
`POST HTTP/1.1 Host: Authorization: Bearer Content-Type: application/json { "eventName": "TaskAssignmentCancelledEvent", "organizationId": 1, "data": { "taskId": "task-id", "taskName": "Task Name", "taskType": "Task Type", "endpointName": "Endpoint Name", "endpointId": "endpoint-id", "taskAssignmentId": "task-assignment-id" } }`
#### TaskAssignmentDeletedEvent
This event is triggered when a task assignment is deleted. It provides details about the deleted task assignment, including the task’s name, type, and the endpoint to which it was assigned.
**Parameters**
* **taskName**: (string) The name of the deleted task.
* **taskType**: (string) The type of the deleted task.
* **endpointName**: (string) The name of the endpoint the task was assigned to.
* **endpointId**: (string) The unique identifier of the endpoint.
* **taskId**: (string) The unique identifier of the deleted task.
* **taskAssignmentId**: (string) The unique identifier of the deleted task assignment.
**HTTP request example**
`POST HTTP/1.1 Host: Authorization: Bearer Content-Type: application/json { "eventName": "TaskAssignmentDeletedEvent", "organizationId": 1, "data": { "taskName": "Task Name", "taskType": "Task Type", "endpointName": "Endpoint Name", "endpointId": "endpoint-id", "taskId": "task-id", "taskAssignmentId": "task-assignment-id" } }`
#### TaskCancelledEvent
This event is triggered when a task is cancelled. It provides details about the cancelled task, including its ID, name, and type.
**Parameters**
* **taskId**: (string) The unique identifier of the cancelled task.
* **taskName**: (string) The name of the cancelled task.
* **taskType**: (string) The type of the cancelled task.
**HTTP request example**
`POST HTTP/1.1 Host: Authorization: Bearer Content-Type: application/json { "eventName": "TaskCancelledEvent", "organizationId": 1, "data": { "taskId": "task-id", "taskName": "Task Name", "taskType": "Task Type" } }`
#### TaskCompletedEvent
This event is triggered when a task is completed. It provides details about the completed task, including its ID, name, type, the organization it belongs to, and statistics about the assigned and completed endpoints.
**Parameters**
* **id**: (string) The unique identifier of the completed task.
* **name**: (string) The name of the completed task.
* **type**: (string) The type of the completed task.
* **organizationId**: (string) The ID of the organization to which the task belongs.
* **totalAssignedEndpoints**: (number) The total number of endpoints assigned to the task.
* **totalCompletedEndpoints**: (number) The total number of endpoints that have completed the task.
* **caseIds:** (array of strings) Ids of the case’s
* **createdBy**: (string) The name of the owner
**HTTP request example**
`POST HTTP/1.1 Host: Authorization: Bearer Content-Type: application/json { "eventName": "TaskCompletedEvent", "organizationId": 1, "data": { "id": "task-id", "name": "Task Name", "type": "Task Type", "organizationId": "org-id", "totalAssignedEndpoints": 5, "totalCompletedEndpoints": 4, "caseIds": [C-2025-03] "createdBy":"John doe" } }`
#### TaskFailedEvent
Triggered when a task fails (distinct from `TaskProcessingFailedEvent`, which refers to execution process failures).
**Parameters**:
* **taskId**: (string) The ID of the task.
* **taskName**: (string) The name of the task.
* **taskType**: (string) The type of the task.
* **caseIds**: (array of strings) The IDs of the cases associated with the task.
* **createdBy**: (string) The user who created the task.
**HTTP request example**
`POST HTTP/1.1 Host: Authorization: Bearer Content-Type: application/json { "eventName": "TaskFailedEvent", "organizationId": 1, "data": { "taskId": "task-id", "taskName": "Task Name", "taskType": "Task Type", "caseIds": ["case-id-1", "case-id-2"], "createdBy": "John Doe" } }`
#### TaskDeletedEvent
This event is triggered when a task is deleted. It provides details about the deleted task, including its ID, name, and type.
**Parameters**
* **taskId**: (string) The unique identifier of the deleted task.
* **taskName**: (string) The name of the deleted task.
* **taskType**: (string) The type of the deleted task.
**HTTP request example**
`POST HTTP/1.1 Host: Authorization: Bearer Content-Type: application/json { "eventName": "TaskDeletedEvent", "organizationId": 1, "data": { "taskId": "task-id", "taskName": "Task Name", "taskType": "Task Type" } }`
#### TaskScheduledForEndpointEvent
This event is triggered when a task is scheduled for an endpoint. It provides details about the task and the endpoint it is scheduled for, along with the associated case information.
**Parameters**
* **endpointName**: (string) The name of the endpoint the task is scheduled for.
* **taskName**: (string) The name of the scheduled task.
* **taskType**: (string) The type of the scheduled task.
* **endpointId**: (string) The unique identifier of the endpoint.
* **caseId**: (string) The unique identifier of the associated case.
* **caseName**: (string) The name of the associated case.
**HTTP request example**
`POST HTTP/1.1 Host: Authorization: Bearer Content-Type: application/json { "eventName": "TaskScheduledForEndpointEvent", "organizationId": 1, "data": { "endpointName": "Endpoint Name", "taskName": "Task Name", "taskType": "Task Type", "endpointId": "endpoint-id", "caseId": "case-id", "caseName": "Case Name" } }`
#### TriageRuleMatchedEvent
This event is triggered when a hunt/triage rule is matched for a task on an endpoint. It provides details about the matched rule, the associated task, and the endpoint involved.
**Parameters**
* **endpointId**: (string) The unique identifier of the endpoint where the rule was matched.
* **endpointName**: (string) The name of the endpoint where the rule was matched.
* **taskId**: (string) The unique identifier of the associated task.
* **taskName**: (string) The name of the associated task.
* **ruleName**: (string) The name of the hunt/triage rule that was matched.
* **ruleType**: (string) The type of the hunt/triage rule that was matched.
* **details**: (object) Additional details or context about the matched rule.
**HTTP request example**
`POST HTTP/1.1 Host: Authorization: Bearer Content-Type: application/json { "eventName": "TriageRuleMatchedEvent", "organizationId": 1, "data": { "endpointId": "endpoint-id", "endpointName": "Endpoint Name", "taskId": "task-id", "taskName": "Task Name", "ruleName": "Rule Name", "ruleType": "Rule Type", "details": { "key": "value" } } }`
#### TriageTaskCompletedEvent
Triggered when a hunt/triage task is completed.
**Parameters**
* **id**: (string) The task ID.
* **name**: (string) The task name.
* **organizationId**: (string) The organization ID.
* **totalAssignedEndpoints**: (number) Number of endpoints assigned.
* **totalCompletedEndpoints**: (number) Number of endpoints completed.
* **totalMatched**: (number) Number of matched items.
* **totalMatchedEndpoints**: (number) Number of endpoints that had matches.
* **mitreAttackEnabled**: (boolean) Whether MITRE ATT\&CK detection was enabled.
* **triageRules**: (array) List of rules used.
**HTTP request example**
`POST HTTP/1.1 Host: Authorization: Bearer Content-Type: application/json { "eventName": "TriageTaskCompletedEvent", "organizationId": 1, "data": { "id": "task-id", "name": "Task Name", "organizationId": "org-id", "totalAssignedEndpoints": 5, "totalCompletedEndpoints": 4, "totalMatched": 3, "totalMatchedEndpoints": 2, "mitreAttackEnabled": true, "triageRules": [ { "id": "triage-id", "name": "Rule Name", "engine": "yara", "searchIn": "system" } ] } }`
#### AcquisitionTaskCompletedEvent
Triggered when an acquisition task is completed.
**Parameters**
* **id**: (string) Task ID.
* **name**: (string) Task name.
* **organizationId**: (string) Organization ID.
* **totalAssignedEndpoints**: (number) Assigned assets.
* **totalCompletedEndpoints**: (number) Completed assets.
* **profileId**: (string) Profile ID.
* **profileName**: (string) Profile name.
* **droneEnabled**: (boolean) Drone used.
* **cpuLimit**: (number) CPU limit for the task.
* **compressionEnabled**: (boolean) Compression enabled.
**HTTP request example**
`POST HTTP/1.1 Host: Authorization: Bearer Content-Type: application/json { "eventName": "AcquisitionTaskCompletedEvent", "organizationId": 1, "data": { "id": "task-id", "name": "Task Name", "organizationId": "org-id", "totalAssignedEndpoints": 5, "totalCompletedEndpoints": 4, "profileId": "profile-id", "profileName": "Profile Name", "droneEnabled": true, "cpuLimit": 100, "compressionEnabled": true } }`
#### InterACTShellStartedEvent
Triggered when an InterACT shell session starts.
**Parameters**
* **taskName**: (string) The name of the task.
* **sessionId**: (string) The session ID.
* **caseId**: (string) The ID of the related case.
* **endpointId**: (string) The ID of the endpoint.
* **endpointName**: (string) The name of the endpoint.
**HTTP request example**
`POST HTTP/1.1 Host: Authorization: Bearer Content-Type: application/json { "eventName": "InterACTShellStartedEvent", "organizationId": 1, "data": { "taskName": "Task Name", "sessionId": "session-id", "caseId": "case-id", "endpointId": "endpoint-id", "endpointName": "Endpoint Name" } }`\
---
# Evidence Repositories
> Source: https://kb.binalyze.ai/air/features/evidence-repositories/index.html
By default, AIR supports saving collected evidence locally on the asset with paths set as `Binalyze\AIR` for Windows, `/opt/binalyze/air` for Linux, and `/opt/binalyze/air` for macOS. Alternatively, users can opt to send their collections to Evidence Repositories, such as network shares, SMB, FTPS, SFTP, or to cloud storage, including AWS S3 buckets, S3-compatible object storage (e.g. MinIO, Wasabi, Backblaze B2), Azure Blob Storage, and Google Cloud Storage (GCS).
:::note
Defining exact system resource requirements for the Evidence Repository is challenging due to variations in environments, asset counts, and the types of acquisition tasks performed. Disk space, CPU, and memory requirements can vary significantly, influenced by factors such as the size of disk images, log files generated during acquisitions, and the volume of evidence collected from each asset. As a result, **it’s impractical to offer a one-size-fits-all recommendation for resource allocation**.
:::
The term Evidence Repository describes a remote location, separate from the actual asset subject to the tasking assignment, whether it is one of the seven currently supported storage options.
You can create **Evidence Repositories** in three different ways:
* From the “Evidence Repositories” page
* During Policy creation
* During the Acquisition task creation
A common query from our customers concerns the configuration of the Evidence Repository and its interaction with the AIR Console, particularly regarding evidence uploads and the required network permissions. Here's what you need to know:
#### Evidence Upload Process
When configuring the Evidence Repository, it's essential to understand the pathway through which evidence files are uploaded. Specifically, there might be confusion about whether these uploads occur directly from the assets to the Evidence Repository or if they go through the AIR console.
To clarify: Evidence files are uploaded directly from the assets to the Evidence Repository. This process necessitates configuring your firewall to permit traffic from the asset to the Evidence Repository on the relevant ports. For example, if using SMB for evidence transfer, you must allow access through port 445.
#### AIR Console Access
For the File Explorer feature within the AIR console to function correctly, the AIR console requires access to the Evidence Repository. This setup ensures that users can seamlessly browse and interact with the stored evidence directly through the AIR console interface.
#### Configuring Your Firewall
Given these operational details, it's necessary to adjust your firewall settings accordingly:
* Allow traffic from your assets to the Evidence Repository, particularly if you are using specific protocols, such as SMB on port 445.
* Ensure the AIR Console has access to the Evidence Repository to enable full functionality of the File Explorer feature.
### **Creating an evidence repository from “Evidence Repositories”**
1\. Navigate to the Evidence Repositories section by clicking the Settings button in the Main Menu and then select “Evidence Repositories” from the Secondary Menu.
2\. Click the “+Add New” button at the top of the page.
3\. From the New Evidence Repository window, provide a name to the repository and then select the relevant repository.
4\. Depending on the type of evidence repository you choose, the required fields are adjusted accordingly:
#### **SMB**
* Path**:** The location that is polled for evidence. If the IP address of the repository is "172.16.1.1", and the folder name is "Share", the path will be “\\\172.16. 1.1\Share” without quotes.
* Username (if required)
* Password (if required)
#### **SFTP**
* Host: Hostname or IP address of the SFTP server.
* Port: The port on which the SFTP server is listening to. The default port for SFTP is 22.
* Path: The location directory that is polled for evidence.
* Username (if required)
* Password (if required)
#### FTPS
* Host: Hostname or IP address of the FTPS server.
* Port: The port on which the FTPS server is listening. The default port for FTPS is 21.
* Path: The location directory that is polled for evidence.
* Username (if required)
* Password (if required)
:::note
**NB: Implicit SSL/TLS is not supported**
:::
#### **Amazon S3**
* Region: Region name for the bucket that was created in.
* Bucket: Name of the bucket
* Access Key ID
* Secret Access Key
Note: IAM users must have proper rights and permissions to access the S3 bucket.
#### **S3 Compatible** (AIR 5.20+)
Use this repository type for any S3 API–compatible object storage that is **not** native AWS S3 — for example self-hosted or third-party providers such as MinIO, Wasabi, Backblaze B2, Cloudflare R2, DigitalOcean Spaces, IBM/Oracle/Scaleway Object Storage, Dell ECS, NetApp StorageGRID, and Hetzner Object Storage. It uses the same access key credential model as Amazon S3, but additionally requires a custom service **Endpoint** and a **Provider Name**.
**Configuration Fields:**
| Field | Required | Description | Example |
|-------|----------|-------------|---------|
| Provider Name | Yes | The S3-compatible provider. Pick one from the built-in list or type your own. Used as the repository's displayed type and for filtering. | MinIO |
| Endpoint | Yes | Custom S3-compatible endpoint URL. Both `http` and `https` are supported. Path-style addressing is forced automatically for compatibility. | `https://s3-compatible.example.com` |
| Region | Yes | Free-text region value. Many providers accept `auto` or a specific value such as `us-east-1`; forward whatever value your provider expects. | auto |
| Bucket | Yes | Name of the bucket where evidence is stored. | evidence-storage-prod |
| Access Key ID | Yes | Access key for the provider. | — |
| Secret Access Key | Yes | Secret key for the provider (stored encrypted). | — |
:::note
The credentials/account used must have permission to write objects to (and, for Repository Explorer browsing/downloading, read/list objects in) the target bucket.
:::
The Console validates the configuration by performing a write test to the bucket before saving the repository.
**Differences vs. Amazon S3:**
* **Amazon S3** is for native AWS only — its Region is selected from a fixed AWS region list and no endpoint is required.
* **S3 Compatible** requires a custom **Endpoint** and a **Provider Name**, and its **Region** is a free-text field.
**Supported Tasks:**
AIR Responders can use an S3-compatible repository for:
* Acquisition tasks (including direct collection)
* Acquire image tasks
* interACT get command (send-to)
* Repository Explorer (browse, download, and upload)
#### **Azure Blob**
* Shared Access Signature (SAS) URL \&#xNAN; See [https://docs.microsoft.com/en-us/azure/storage/common/storage-sas-overview](https://docs.microsoft.com/en-us/azure/storage/common/storage-sas-overview) for details.
* To generate a SAS URL, please refer to this link: [Generating a SAS URL](generating-a-sas-url)
#### **Google Cloud Storage (GCS)** (AIR 5.11+)
**Prerequisites:**
| Requirement | Description |
|-------------|-------------|
| GCP Account | Active Google Cloud Platform project |
| GCS Bucket | Bucket for evidence storage |
| Service Account | Service account with JSON key credentials |
| IAM Role | **Storage Object Creator:** Sufficient for Evidence Repository when used for acquisition, interACT get, and image tasks (upload only). **Storage Object Admin (Recommended):** Required for both Evidence Repository and Repository Explorer operations. |
**Configuration Fields:**
| Field | Description | Example |
|-------|-------------|---------|
| Bucket Name | Target GCS bucket | `evidence-storage-prod` |
| Project ID | GCP project ID | `my-project-123` |
| Service Account Email | Service account email | `air@project.iam.gserviceaccount.com` |
| Private Key | RSA private key (PEM format) | Must include BEGIN/END markers |
The Console validates the configuration by testing the GCS connection before saving.
**Supported Tasks:**
AIR Responders can perform the following actions with GCS:
- Acquisition tasks (including direct collection)
- Acquire image tasks
- interACT get command
- interACT image command
:::caution
**Troubleshooting: Invalid JWT Token – System Clock Out of Sync**
If you receive the error `oauth2: cannot fetch token: 400 Bad Request` with message about "Invalid JWT", the system clock on the asset is not synchronized with Google's servers.
**Solution:**
- **Linux:** `sudo ntpdate -u time.google.com` or `sudo timedatectl set-ntp true`
- **Windows:** `w32tm /resync /force`
- **macOS:** Enable "Set time and date automatically" in System Preferences
:::
:::note
**Permission Denied (403 Forbidden)**
If you receive a 403 error, verify the service account has the appropriate IAM role:
- **Storage Object Creator** for upload operations
- **Storage Object Admin** for Repository Explorer access
Also check that bucket-level IAM policies include the service account.
:::
### **Creating an evidence repository during Policy creation**
1\. Select the Settings button in the Main Menu and then select “Policies” from the Secondary Menu.
Click the “+Add New” button at the top of the page
2\. Provide a name to the repository and then select the relevant repository type:
3\. Select the relevant repository type by clicking on it.
4\. Click the “Save” button.
5\. The newly created repository will appear in the drop-down list. Select the relevant repository and finalize the process.
### **Creating an evidence repository during the acquisition task creation**
1\. From the “Acquire Evidence” pane, click on the **Evidence Repository** radio button under the "Save Collected Evidence To" section.
2\. Click in the "Repository" box and then select “+ Add new repository”:
3\. From the window 'New Repository', complete the mandatory fields and select the type of repository you wish to add. There are seven options:
* SMB
* SFTP
* FTPS
* Amazon S3
* S3 Compatible (AIR 5.20+)
* Azure Blob
* Google Cloud Storage (GCS) (AIR 5.11+)
Evidence Repositories: New Repository Wizard
4\. The newly created repository will appear in the drop-down list. Select the repository you want for this particular acquisition and finalize your Acquisition Task via the wizard.
:::note
To improve task reliability and prevent failed uploads, a **connection check** for evidence repositories will take place when starting acquisition tasks (both scheduled and immediate). Here's how it works:
* When creating tasks like Acquisition or Acquire Image, AIR automatically checks the connection to the selected repository (SFTP, FTPS, Azure, AWS, or S3 Compatible).
* If the connection check takes longer than 10 seconds, it will be canceled, and a warning message will appear. However, task creation is not blocked—you can choose to proceed or cancel the task if the repository is inaccessible.
**UI Warning Message: If the repository is inaccessible, you'll see this warning:** \&#xNAN; _"The following evidence repositories are currently inaccessible. If responders cannot access these repositories, they will not be able to send the collected evidence. Please note that access to these repositories is managed through the AIR server. If the responders have access, evidence transmission will proceed without issues. Do you still want to continue?"_
This feature ensures you're aware of potential access issues before initiating a task, helping you avoid wasted time on failed uploads. It’s important to note that this connection check occurs between the AIR console and the repository, not between the responders and the repository. While it's impractical to check every responder in large-scale tasks, a successful console check significantly reduces the likelihood of connection issues for responders.
:::
---
# Generating a SAS URL
> Source: https://kb.binalyze.ai/air/features/evidence-repositories/generating-a-sas-url.html
**Step-by-Step: Generating a SAS URL**\
------
### **Access Azure Blob Container**
* Log in to the **Azure Portal**.
* Navigate to your storage account and follow this path:\
`Storage Browser` → `Blob Containers`
Generating a SAS URL: Access Azure Blob Container
### **Generate the SAS URL**
* Locate your container in the list.
* Click the **three dots (…)** next to the container name.
* Select **“Generate SAS”** from the menu.
Generating a SAS URL: Generate the SAS URL:
### **Configure SAS Settings**
* A panel will appear on the right.
* Here you can define:
* **Permissions** (Recommended: `Create`, `Write`, and optionally `List`)
* **Token validation period** (start and expiry date/time)
Generating a SAS URL: Configure SAS settings
### **Copy the SAS URL**
* After setting the permissions and time frame, click **“Generate SAS token and URL”**.
* Copy the resulting **SAS URL** and paste it into the **Evidence Repository configuration** in Binalyze AIR.
Generating a SAS URL: Copy the SAS URL
### **If You Don't Have a Container**
* You can create one by clicking on **“+ Add Container”** in the Blob Containers view.
Generating a SAS URL: If you dont have a Container
:::caution
**Important Note**\
\
Each time you change a setting in the container (such as permissions or token expiry), **you must generate a new SAS URL**.\
\
This ensures the connection between Binalyze AIR and Azure remains valid.\
\
**Example:** If you update the token expiration time or adjust permissions, please regenerate and update the SAS URL in AIR accordingly.
:::
---
# File Explorer
> Source: https://kb.binalyze.ai/air/features/file-explorer/index.html
AIR can be used to explore the file systems of Windows, macOS, and Linux systems where full disk or volume images have been acquired in either the **RAW (dd), EWF (E01/Ex01), VHD/X, or VMDK formats**.
The forensic image can be added from your SMB, SFTP, Amazon S3 bucket, Azure Blob storage, or Google Cloud Storage to AIR as a new asset in a simple three-step process:
* 1\. From the Main Menu, select **Assets**, then select **Disk Images** from the Secondary Menu. Click the **'+ Add New'** button:
File Explorer: Add a Disk Image
* 2\. Select your connected repository and then select the first segment of the RAW, EWF or VMDK file you wish to mount and explore:
File Explorer: Select the first segment of an image file from the evidence list
* 3\. Select ‘Create Asset’:
File Explorer: Create Asset
:::caution
The image must be supplied to AIR from your **SMB, SFTP, Amazon S3 bucket, Azure Blob storage, or Google Cloud Storage** evidence repositories; segmented files are supported.
:::
File Explorer: Compatibility chart
:::note
**Tool Tip for File Explorer** **users:**
* **Ex01 and E01 Images**: These are accessible immediately in File Explorer. Using AIR to generate Ex01 files avoids the need to unzip files in the Evidence Repository.
* **DD Images**: Generated in a zip file by AIR. To access, connect to the Evidence Repository, unzip the zip file, and then mount or explore the image in File Explorer.
:::
Next, select your new asset from the Assets table to launch the AIR File Explorer. The asset’s directory structure will appear in the secondary menu (highlighted below), allowing you to browse and select individual files for inspection in Hex, Text, or Metadata views.
File Explorer: Directory Tree in Secondary Menu
A file can be selected with a right-click to download it locally or calculate its hash values.
Advanced filters can be applied to filter the files displayed.
### File Explorer - Calculate Hash for disk images
Navigating to the root of the Device Name in the breadcrumb path opens the Asset Info page for the mounted disk image:
File Explorer: Asset Info
* When a disk image is added as an asset to AIR, users can now calculate the hash value of that image file either through the Asset Actions button or from the Disk Image Details window.
* MD5, SHA1, and SHA256 are all calculated simultaneously.
* This hash function can be carried out at any time.
File Explorer: Hash Calculation
### File Explorer - Recursive Search
* Recursive searching is now possible in the AIR File Explorer via the Global Search box, where the File Explorer tab will display any hits found in the File Explorer.
File Explorer: Recursive Search
This is just the beginning of our File Explorer project - many more features are planned, and your feedback is most welcome.
---
# File Explorer - FAQs
> Source: https://kb.binalyze.ai/air/features/file-explorer/file-explorer-faqs.html
**Q1. What is the AIR File Explorer?**
The AIR File Explorer is a built-in, cross-platform GUI browser tool within AIR, designed for seamless navigation of full disk or volume image files. It allows users to explore directory structures and efficiently inspect individual file contents in Hex, Text, or Meta Data views.
**Q2. What value does File Explorer provide?**
A full disk or volume image can provide crucial evidence for digital forensic investigations. Offering investigators easy access to disk image files allows them to navigate investigations swiftly in a unified view, minimizing the need for mastering multiple tools.
**Q3. What are the plans for File Explorer?**
The initial release of **File Explorer (v4.7)** introduced the ability to explore raw disk or volume images. Since then, we’ve added support for more image file types, whether they are segmented or single files. Subsequent versions have expanded functionality, adding support for additional disk types for ingestion into **AIR** and increasing the range of supported remote storage locations from which these image files can be pulled, presented, and mounted within the **AIR File Explorer**.
Please see this page, [AIR File Explorer](index), for the list of supported disk types and evidence repositories from which they can be mounted.
Our plans include introducing a live version of File Explorer, enabling users to explore files directly on remote assets, and DRONE support.
**Q4. Are there any requirements to use AIR’s File Explorer?**
Existing customers (installed AIR 4.7 and below) who have yet to do so will need to add the new **'air-tornado'** Docker container to support the **File Explorer** feature - please contact the support team to help do so. Customers who installed AIR v4.7 or later will already have the additional Docker container.
**Q5. Why is a new Docker container necessary to support the feature?**
Refer to Q15.
**Q6. What does RAW, EWF, VMDK, or VHD/X mean when discussing an image file?**
Whether acquired by AIR or captured by a third-party tool, a disk image can only be explored in the AIR File Explorer if it's in the RAW(dd), EWF (E01/Ex01), VMDK, VHD/X formats:
1. **RAW** format is a bit-by-bit copy of a disk or volume, preserving all data without interpretation or modification. AIR supports the generation of single or segmented RAW image files.
2. **EWF2** is also commonly used in digital forensics to store and compress digital evidence but this format supports additional metadata. AIR supports the generation of single EWF2/Ex01 files but **NOT** segmented EWF2/Ex01 image files.
3. **VMDK** (Virtual Machine Disk) is a file format used to store virtual disk images for VMware virtual machines. It enables the encapsulation of an entire hard drive, including its filesystem and data, into a single file or set of files, facilitating easy management, migration, and backup of virtual environments.
4. **VHD (Virtual Hard Disk):** VHD is an older virtual disk format used by Microsoft solutions like Hyper-V. It supports up to 2TB and is ideal for compatibility with legacy systems.
**VHDX (Virtual Hard Disk Extended):** VHDX is the newer format, supporting disk sizes up to 64TB with improved performance and data protection. Use it for modern systems or larger disks.
:::note
**NB re VMDK:** We support reading RAW (Flat), COWD, and VMDK extent file formats.
For VMDK, we support the following disk types:
* monolithicSparse
* twoGbMaxExtentSparse
* monolithicFlat
* twoGbMaxExtentFlat
* streamOptimized
However, the "vmfs" and "thin" disk types are not supported.
We can also open and read snapshots, but the actual VMDK files are required as well.
:::
**Q7. How does it work?**
Clicking the "+ New" Action Button on the Asset page now offers the option to add "Disk Image". Users can navigate to an **SMB, SFTP, Amazon S3, Azure Blob storage, or Google Cloud Storage** shared location, select the disk image, and add it as a new asset. Once created, users can browse the directory structure in the asset detail screen.
**Q8. Where can the image file be saved so AIR can access it?**
Currently, the image must be supplied to AIR from an **SMB, SFTP, S3, Azure Blob storage, or Google Cloud Storage** shared location, saved as:
* a single or segmented RAW file, **OR**
* a single or segmented E01/Ex01 file **OR**
* a single or segmented VMDK file **OR**
* a single or segmented VHD/VHDX file.
**Q9. What are some important details about the displayed information?**
The hash of the image file isn't calculated automatically to save time during asset creation. You can calculate the image hash on the Asset Info page as soon as it is created.
Various views for selected files include hex view, text view, and metadata view.
**Q10. How long does it take to create an asset from an image file?**
Testing has shown that a 107GB full disk image is available for exploration in AIR's File Explorer within 20 to 30 seconds after hitting the “Create Asset” button.
**Q11. Can I bookmark items/files in File Explorer?**
Not yet, but it's in the pipeline.
**Q12. What actions are users able to take from within File Explorer?**
Users can calculate the hash of individual or multiple files using the bulk action bar, and download individual files.
**Q13. What other enhancements are planned?**
In the future, users may have the ability to right-click a file for an option to 'hunt' for that item or other assets attached to the AIR console. Plans also include allowing users to run triage and acquisition tasks on the disk image and add the collections/results to the Investigation Hub.
**Q14. Can deleted files be carved from File Explorer?**
We present the logical file system, so we can only access existing files and folders; carving unallocated space is not an option currently.
**Q15. Are we pulling raw data into the console or just parsed data?**
In the AIR console, the latest Docker container, named 'air.tornado', acts as a proxy for commands from the front end. When an action is requested, such as opening a folder, AIR sends the command to the container, which reads the folder data from the disk and provides it to the front end on demand. Recent updates include indexing the entire image for search capabilities without downloading the entire image to the AIR server. The image remains in the evidence repository, so a revoked token from the evidence repository will result in a lost connection.
---
# AI Assistant
> Source: https://kb.binalyze.ai/air/features/ai-assistant.html
#### Overview
AI Assistant is a chat-based AI helper integrated into the AIR Console. It uses an OpenAI model customized for Digital Forensics and Incident Response (DFIR) workflows. AI Assistant is available from every page of the Console via the AI Assistant icon or the keyboard shortcut revealed by hovering over the icon.
AI Assistant is enabled by default for SaaS customers. Self-hosted (on-prem) deployments require an OpenAI API key to be configured before the feature becomes available (see [Configuration](#configuration) below).
:::caution
AI Assistant does **not** have access to your case data, asset inventory, evidence files, or active rule results. Conversations are scoped strictly to what the user types into the chat.
:::
#### Architecture and Design
AI Assistant is a simple chatbot powered by an OpenAI model, accessed securely through the OpenAI API. It does not include a multi-agent system, orchestrator, or Model Context Protocol (MCP) integration. It cannot read or act on any data inside AIR — all responses are based solely on the user's prompt and the model's training data.
For SaaS environments, all requests are routed via AIR proxy services using JWT-authenticated and scoped API calls. No customer data is stored or shared externally.
Self-hosted (on-prem) customers must provide their own OpenAI API key (see [Configuration](#configuration) below).
#### Capabilities
AI Assistant is a conversational helper that can assist analysts with the following topics:
* **DFIR Q&A**: Answer DFIR-related questions and explain concepts.
* **Rule Drafting**: Help draft YARA, Sigma, and osquery rules from a natural-language description. Generated rules must be copied and saved manually — there is no direct integration with the Hunt/Triage Rule wizard.
* **MITRE ATT&CK Guidance**: Explain MITRE ATT&CK techniques and suggest relevant detection strategies.
* **Investigation Advice**: Suggest investigation steps based on what the user describes in the chat. These suggestions are based on the model's general knowledge, not on real case context.
**Example Use Cases**
| Use Case | Description |
| --- | --- |
| Detection Rule Drafting | Ask AI Assistant to draft YARA, Sigma, or osquery rules from IoCs, behaviors, or MITRE TTPs |
| DFIR Q&A | Get clarifications on DFIR concepts and best practices |
| MITRE ATT&CK Exploration | Understand specific techniques and their relevance to an investigation |
| Hunt/Triage Strategy Discussion | Discuss recommendations based on MITRE coverage, OS specifics, or asset profiles |
#### Security Considerations
AI Assistant is designed with a security-first architecture:
* **Proxy-based AI routing**: All AI communication passes through AIR-managed proxies.
* **Data handling**: User input is sent to OpenAI as-is. AIR does not filter, redact, or persist chat content. Avoid pasting sensitive case data, credentials, or PII into the chat.
* **Scoped access**: Uses scoped, JWT-authenticated API calls.
* **Policy control**: AI can be disabled via the system policy manager.
#### Configuration
**SaaS customers**: No additional configuration is required. AI requests are proxied through AIR services automatically.
**Self-hosted (on-prem) customers**: You must provide your own OpenAI API key. Navigate to **Settings > Features > AI Assistant** and enter your **OpenAI API Key** to enable AI Assistant functionality.
:::tip
Self-hosted customers retain full control over their AI integration. Requests are securely routed to OpenAI using your own API key. Your key and prompts are not stored by Binalyze.
:::
The OpenAI API key is encrypted at rest in the Console database. It is never returned to the browser after configuration.
Once configured, the Settings page no longer displays the input field. Instead, it shows **API key is configured** along with **Replace** and **Remove** actions:
* **Replace**: Opens an input field to enter a new key.
* **Remove**: Clears the stored key and disables AI Assistant.
#### Chat Session Behavior
Chat conversations are ephemeral. AI Assistant does not store any chat history — closing the chat panel discards the active conversation, and there is no way to restore a previous one. Users can also manually clear the current conversation at any time by clicking the trash icon at the top-left of the chat panel.
#### Example Prompts
Below are example queries AI Assistant can respond to:
* Create a YARA rule to detect the execution of Mimikatz in memory.
* Create an osquery rule that lists all USB devices connected in the last 24 hours.
* What does finding T1059.001 mean in the MITRE ATT\&CK framework?
* Suggest next steps based on multiple "RDP brute force" findings.
#### Requirements
| Requirement | Details |
| --- | --- |
| Internet Connectivity | Required for AI proxying |
| Licensing | Included in AIR subscription |
| Configuration | None for SaaS (enabled by default) |
For self-hosted (on-prem) deployments, internet connectivity to the OpenAI API is required, and an OpenAI API key must be configured before AI Assistant becomes available.
#### Known Limitations
* AI Assistant has no access to AIR case data, asset information, evidence files, or rule execution results.
* AI Assistant cannot trigger any actions in AIR (no acquisitions, hunts, or task creation).
* Generated rules must be copied and saved manually — there is no direct integration with the Hunt/Triage Rule wizard.
---
# Full Text Search
> Source: https://kb.binalyze.ai/air/features/full-text-search.html
import Embed from '@/components/Embed.astro';
Full Text Search enables investigators to scan the contents and metadata of files on remote assets for specific keywords or regex patterns. Unlike traditional evidence collection that gathers predefined artifacts, Full Text Search allows targeted searches across document contents, configuration files, logs, and other text-based data—helping investigators quickly locate evidence of data exfiltration, policy violations, or indicators of compromise.
:::note
Full Text Search is currently in **Beta**. This feature is available to customers with the appropriate feature flag enabled.
:::
## Key Capabilities
* **Keyword Searching** — Search for exact terms such as filenames, usernames, IP addresses, or sensitive data identifiers
* **Pattern Matching** — Use regex patterns to find complex matches like credit card numbers, email addresses, or custom formats
* **Reusable Profiles** — Save search configurations as profiles for consistent, repeatable investigations
* **File Type Filtering** — Target specific file categories (documents, plain text, databases) to reduce noise
* **Cross-Platform Support** — Search across Windows, macOS, and Linux assets simultaneously
## Accessing Full Text Search
Full Text Search can be initiated in two ways:
### Option 1: Quick Start Menu
From anywhere in the Console, select **Quick Start** from the top navigation bar, then select **Full Text Search**.
Full Text Search: Accessing via Quick Start menu
### Option 2: Bulk Action from Assets
Navigate to **Assets**, select one or more target assets, and choose **Full Text Search** from the bulk action bar.
Full Text Search: Initiating from the Assets bulk action bar
## Creating a Full Text Search Task
The Full Text Search wizard guides you through three steps: Asset Selection, Setup, and Customization.
### Step 1: Asset Selection
Select the assets you want to search. Use filters or saved filters to narrow down your selection. Assets can be Windows, macOS, or Linux endpoints.
Full Text Search: Selecting target assets
### Step 2: Setup
Configure your search parameters:
| Field | Description |
|-------|-------------|
| **Task Name** | A descriptive name for this search task (auto-generated if left empty) |
| **Case** | Associate the search with an existing case for centralized evidence management |
| **Task Start Time** | Run immediately or schedule for later |
| **Full Text Search Profile** | Select an existing profile or create a new one |
Full Text Search: Configuring task setup and selecting a profile
Each profile displays the number of keywords and file types it contains, helping you select the appropriate profile for your investigation.
### Creating a New Profile
Click **+ Add New Profile** to create a reusable search configuration:
1. Enter a **Name** for the profile
2. Select the **Organization**
3. Add **Search Keywords** — individual terms or regex patterns
4. Select **File Types** to search within
Full Text Search: Creating a new profile with keywords and file types
#### Adding Keywords and Patterns
Click **+ Add New** to add search terms:
* **Add New Keyword** — Enter an exact term to search for
* **Add New Pattern** — Enter a regex pattern for complex matching
Full Text Search: Adding a keyword to the profile
#### Using Built-in Pattern Examples
AIR includes a library of pre-built regex patterns for common investigation scenarios. Click the **Examples** dropdown to select from ready-to-use patterns:
| Example Pattern | Description |
|-----------------|-------------|
| **API Key/Token Pattern** | Detects common API key and token formats |
| **Generic Credentials Pattern** | Finds username and password combinations in files |
| **WordPress Credentials Pattern** | Locates WordPress-specific credential patterns |
| **Credit Card Number Pattern (MasterCard)** | Identifies MasterCard number formats |
| **AWS Access Key Pattern** | Detects AWS access key identifiers (AKIA...) |
| **AWS Secret Key Pattern** | Finds AWS secret access keys |
| **GitHub Personal Access Token Pattern** | Identifies GitHub PAT formats |
| **Stripe API Key Pattern** | Detects Stripe API key formats |
:::tip
Using built-in examples ensures consistent, tested patterns across your investigations. These patterns are maintained by the AIR team and updated as new formats emerge.
:::
#### Importing Keywords from CSV
For bulk keyword management, click **Import Keywords (.csv)** to upload a CSV file containing your search terms. This is useful when:
* Migrating keyword lists from other tools
* Maintaining centralized keyword repositories
* Sharing standardized search terms across investigation teams
The CSV file should contain one keyword or pattern per row.
### Advanced Settings
Expand **Advanced Settings** to configure additional parameters:
Full Text Search: Advanced settings with path exclusions
| Setting | Description |
|---------|-------------|
| **Search In** | Default search paths per operating system (Windows: `%SYSTEMDRIVE%\Users\**`, macOS: `/Users/**`, Linux: `/home/**`) |
| **Excluded Path Patterns** | Directories to skip during the search. Use the **Examples** dropdown for common exclusions |
| **Max Result Limit** | Maximum number of results to return per asset (default: 1000) |
Common exclusion patterns include:
* `C:\Program Files\**` — Windows Program Files directory
* `C:\Program Files (x86)\**` — Windows Program Files (x86) directory
* Windows system directory
* Entire C drive (for targeted user-folder searches)
## Using Regex Patterns
Full Text Search supports regex patterns for advanced matching. Patterns must be added using the **Add New Pattern** option.
### Basic Regex Examples
| Pattern | Matches | Use Case |
|---------|---------|----------|
| `invoice` | Exact word "invoice" | Find documents mentioning invoices |
| `invoice\|receipt` | "invoice" OR "receipt" | Find financial documents |
| `\d{3}-\d{2}-\d{4}` | 123-45-6789 | US Social Security Numbers |
| `\d{4}[- ]?\d{4}[- ]?\d{4}[- ]?\d{4}` | Credit card formats | Payment card numbers |
| `[a-zA-Z0-9._%+-]+@[a-zA-Z0-9.-]+\.[a-zA-Z]{2,}` | email@domain.com | Email addresses |
| `(?:25[0-5]\|2[0-4]\d\|[01]?\d\d?)(?:\.(?:25[0-5]\|2[0-4]\d\|[01]?\d\d?)){3}` | 192.168.1.1 | IPv4 addresses |
| `password\s*[:=]\s*\S+` | password: secret123 | Hardcoded credentials |
| `BEGIN\s+(RSA\|DSA\|EC)?\s*PRIVATE\s+KEY` | Private key headers | Exposed private keys |
| `AKIA[0-9A-Z]{16}` | AWS Access Key format | AWS credentials |
| `(?i)confidential\|secret\|restricted` | Case-insensitive classification markers | Sensitive document labels |
:::caution
Complex regex patterns may impact search performance. Test patterns on a small asset selection before running large-scale searches.
:::
## Viewing Results in Investigation Hub
Once a Full Text Search task completes, results are available in the **Investigation Hub**:
1. Navigate to **Investigation Hub** from the main menu
2. Select the **Case** associated with your search task
3. Locate the Full Text Search results in the case timeline
Results display:
* **File path** — Location of the file containing the match
* **Match context** — Surrounding text showing where the keyword or pattern was found
* **Asset information** — Which endpoint contained the match
:::note
Associating Full Text Search tasks with a Case centralizes all findings alongside evidence collections, DRONE analysis, and other investigation activities in a single unified view.
:::
## Best Practices
### Start Narrow, Then Expand
Begin with specific keywords or patterns targeting known indicators. If initial results are limited, gradually broaden your search criteria.
### Use File Type Filtering
Limit searches to relevant file categories. Searching all 60 file types increases scan time—focus on document types most likely to contain your target data.
### Leverage Profiles for Consistency
Create standardized profiles for common investigation scenarios:
* **PII Search** — Social security numbers, credit cards, email addresses
* **Credential Hunting** — Passwords, API keys, private keys
* **Data Exfiltration** — Company-specific keywords, project names, client identifiers
### Exclude System Directories
Use excluded path patterns to skip operating system and application directories that rarely contain investigative value, improving search speed and reducing false positives.
## Supported File Types
Full Text Search can examine contents within 60 file type categories, organized into groups:
| Category | Examples |
|----------|----------|
| **Text/Word Processing** | DOC, DOCX, TXT, RTF, ODT, PDF |
| **Plain Text** | LOG, CFG, INI, XML, JSON, YAML |
| **Database, Spreadsheet, Finance** | XLS, XLSX, CSV, MDB, ACCDB |
Expand the **File Types** section when creating a profile to view and select specific categories.
---
# Hunt/Triage
> Source: https://kb.binalyze.ai/air/features/triage/index.html
Almost every case starts with one or more leads. If there are too many leads, the investigator may need to validate each one individually, which is a time-consuming process. Alternatively, if there are too few leads, investigators lack sufficient information to continue their case. Neither situation is good for the investigation and can impact the speed of resolution.
Hunt and Triage is the process of identifying and prioritizing the evidence that will be analyzed and evaluated. However, prioritizing this evidence is not a straightforward or easy job. An Investigator needs lots of data, leads, or experience to do it well. So, they generally use known attack indicators, referred to as the IOC (Indicator of Compromise). An indicator of compromise (IoC) in computer forensics is an artifact observed on a network or in an operating system that, with high confidence, indicates a computer intrusion.
An investigator or analyst will generally scan all system data or a portion of it to identify these IOCs. When they see a match, it typically means that those systems are related to a specific attack type and need to be investigated first. Investigators use YARA, osquery, and Sigma rules for these scans. Investigators can define and scan IOCs by using AIR's built-in YARA, osquery, and Sigma template rules or editors.
The AIR DFIR Suite provides investigators with three different tools for hunt and triage, which, as stated, are YARA, osquery, and Sigma. These tools generally scan assets to find specific data using IOC (Indicator of Compromise).
:::note
_**YARA** (_Yet Another Recursive Acronym) _is a tool aimed at (but not limited to) helping malware researchers identify and classify malware samples. With YARA you can create descriptions of malware families (or whatever you want to describe) based on textual or binary patterns. Each description, a.k.a. rule, consists of a set of strings and a boolean expression that determines its logic._
:::
:::note
_**Sigma** is a generic and open signature format that allows you to describe relevant log events in a straightforward manner. The rule format is very flexible, easy to write, and applicable to any type of log file. The primary purpose of this project is to provide a structured form in which researchers or analysts can describe their developed detection methods and make them shareable with others. Sigma is to log files what Snort is to network traffic, and YARA is to files._
:::
:::note
_**osquery**_, an open-source tool, employs SQL-like queries to extract intricate system data. It offers cross-platform compatibility, making it ideal for real-time system monitoring, security analysis, and compliance assessments. Security professionals often utilize it to detect vulnerabilities, monitor system changes, and ensure compliance with security standards.
:::
AIR features a library for YARA, osquery, and Sigma rules, allowing investigators to develop, validate, and manage their rules directly within the platform using the built-in editors. These rules can be saved to **Libraries > Hunt/Triage Rules** in AIR.
Investigators can efficiently conduct threat hunting and scan their assets by selecting the necessary rules from the library. The Hunt/Triage process flow, depicted below, illustrates how organizational policies allow administrators to control AIR's functionality and define role-based permissions for specific activities.
Creating a case in AIR also enables users to centralize all collections, hunt and triage results, and activities related to a specific incident or investigation. This integration allows the Investigation Hub to dynamically present all information, from raw evidence to automated DRONE findings, in a unified view.
Hunt/Triage: Hunt/Triage creation and execution flows
:::caution
**NB: Character limitation for a single hunt and triage rule**
* **To prevent the browser from becoming unresponsive, we have limited the maximum character count to 350K in a single Hunt/Triage Rule.**
:::
## Tagging Hunt/Triage Rules
Hunt and Triage rules in the AIR console can be assigned tags, which help organize the rules and filter them when required. This feature for hunt and triage rules enables more efficient management and allows for streamlined searches and improved organization within the console.
When creating or using a Hunt/Triage Rule, the UI allows the user to filter existing rules by their associated Tags.
Hunt/Triage: Tagging Hunt/Triage Rules
The Hunt/Triage Rule Library includes Preset Filters in the secondary menu, allowing users to organize rules hierarchically, also known as '**Nested Tagging**'. By incorporating a colon in their tags, users can structure and categorize rules more efficiently. For example, the tag "APT26:Tim:hashset" helps organize related rules under a structured hierarchy, enhancing navigation and accessibility in the library.
## **Scan Local Drives Only for Hunt/Triage Tasks**
With the **Scan Local Drives Only** feature, users can improve Yara hunt and triage efficiency by focusing threat hunting and hunt and triage scans solely on local drives, excluding remote external or network drives that often introduce unnecessary data into the investigation. The attached mounted USB drives should be included as 'local drives'.
**Key Details:**
* Available for all AIR-supported operating systems.
* Disabled by default, but can be toggled on or off via Settings > Policies > New Policies > Scan Local Drives Only. This setting can also be modified later.
* It can also be configured during the customization step when creating hunt and triage tasks via 'Use Custom Options'.
Hunt/Triage: Custom option to scan local drives only
This feature ensures that only relevant data from local drives is collected, reducing noise and improving the speed and accuracy of investigations.
## **Path Inclusion and Exclusion for Hunt/Triage Tasks**
Hunt and Triage operations support **path inclusion and exclusion rules**, allowing investigators to define precisely which directories should be scanned and which should be skipped. This enables faster, more targeted investigations by focusing on high-value areas while eliminating noise from irrelevant locations.
### Configuration Options
**Included Path Patterns** – Specify directories that must be scanned
**Excluded Path Patterns** – Specify directories that must not be scanned
* Separate path lists can be configured for **Windows**, **macOS**, and **Linux**
* Settings are applied via **Hunt/Triage task custom options** or **Hunt/Triage policies**
* If both lists are empty, the responder scans default locations as before
* If the same path appears in both lists, the rules cancel out and the path is treated as if no rule was set
Hunt/Triage: Path inclusion and exclusion custom settings
### Use Cases
**Focus on high-value areas:**
* User profiles: `C:\Users\*\AppData\Local`
* Temp folders and temporary files
* System and application log directories
**Exclude noise-heavy locations:**
* OS installation folders
* Large software repositories
* Backup or archive volumes not relevant to the investigation
**Benefits:**
* Faster hunt and triage execution
* Reduced false positives
* More targeted evidence coverage
### Configuring Path Rules in a Task
1. Create or edit a **Hunt** or **Triage** task
2. Select **Use custom options** (or advanced options section)
3. Configure:
* **Included path patterns** – paths/directories to restrict the scan to
* **Excluded path patterns** – paths/directories to omit from the scan
4. Use the provided **Examples** dropdown as a template or enter your own patterns
5. Save and run the task
### Configuring via Policy
Path patterns can be predefined in **Hunt/Triage policies** to ensure:
* All tasks created from the policy use consistent inclusion/exclusion logic
* Investigators follow an approved, standardized path-scoping strategy across cases
To configure via policy, navigate to **Settings → Policies** and define the path patterns in the Hunt/Triage policy settings.
---
# Schedule Hunt/Triage Tasks
> Source: https://kb.binalyze.ai/air/features/triage/schedule-triage-tasks.html
#### AIR Hunt/Triage Scheduled Task via API Script by using crontab
* Download the script and grant permission to run.
`wget https://cdn.binalyze.com/air-deploy/scripts/air-triage-task-via-api.sh chmod +x air-triage-task-via-api.sh`
* Download the script and grant permission to run (URL is an example).
`wget https://.cisco-.binalyze.io /air-deploy/scripts/air-triage-task-via-api.sh chmod +x air-triage-task-via-api.sh`
* Move the script file to a directory, such as the **/opt** directory, as shown below.
`mv air-triage-task-via-api.sh /opt/air-triage-task-via-api.sh`
* Update the console address and API Token value in the script. You must add the desired hunt/triage rule id values to the "triageRuleIds" field.
For example, there are two default rules below; you can change them.
"fireeye-red-team-tools-countermeasures", "fireeye-sunburst-countermeasures"
* Add it as a cronjob by running the command below.
`crontab -e`
* After running the above command, add the following lines in the editor.
`# At 00:00 on Sunday 0 0 * * 0 /opt/air-triage-task.sh`
---
# Hunt/Triage Rule Templates
> Source: https://kb.binalyze.ai/air/features/triage/triage-rule-templates/index.html
[YARA Templates](yara-templates)
[Sigma Templates](sigma-templates)
[osquery Templates](osquery-templates)
---
# Sigma Templates
> Source: https://kb.binalyze.ai/air/features/triage/triage-rule-templates/sigma-templates.html
* **Detection of Sysinternals Usage**
```json
description: Detects the usage of Sysinternals Tools
tags:
- attack.t1588.002
logsource:
category: process_creation
product: windows
detection:
selection:
CommandLine|contains: ' -accepteula'
condition: selection
falsepositives:
- Legitimate use of SysInternals tools
```
* **LSASS Dump Detection**
```json
description: LSASS memory dump creation using operating systems utilities.
tags:
- attack.credential_access
logsource:
category: file_event
product: windows
detection:
selection:
TargetFilename|contains: 'lsass'
TargetFilename|endswith: 'dmp'
condition: selection
fields:
- ComputerName
- TargetFilename
falsepositives:
- Admin activity
level: high
```
* **Suspicious Add Scheduled Task From User AppData Temp**
```json
description: schtasks.exe create suspicious task from user AppData\Local\Temp
tags:
- attack.execution
- attack.t1053.005
logsource:
product: windows
category: process_creation
detection:
schtasks:
Image|endswith: '\schtasks.exe'
suspcommand:
CommandLine|contains|all:
- '/Create '
- '\AppData\Local\Temp'
condition: schtasks and suspcommand
falsepositives:
- Unknown
level: high
```
* **Disable UAC Using Registry**
```json
description: Detects Disable User Account Control (UAC) Using Registry by changing its registry key HKLM\SOFTWARE\Microsoft\Windows\CurrentVersion\Policies\System\EnableLUA from 1 to 0
tags:
- attack.privilege_escalation
- attack.defense_evasion
- attack.t1548.002
logsource:
category: registry_set
product: windows
detection:
selection:
EventType: SetValue
TargetObject|contains: SOFTWARE\Microsoft\Windows\CurrentVersion\Policies\System\EnableLUA
Details: DWORD (0x00000000)
condition: selection
falsepositives:
- Unknown
level: medium
```
* **Windows Defender Service Disabled**
```json
description: Detects disables the Windows Defender service (WinDefend) via the registry
tags:
- attack.defense_evasion
- attack.t1562.001
logsource:
product: windows
category: registry_set
detection:
selection:
EventType: SetValue
TargetObject: 'HKLM\SYSTEM\CurrentControlSet\Services\WinDefend\Start'
Details: 'DWORD (0x00000004)'
condition: selection
falsepositives:
- Administrator actions
level: high
```
* **PowerShell Get-Clipboard Cmdlet Via CLI**
```json
description: Detects usage of the 'Get-Clipboard' cmdlet via CLI. Adversaries may collect data stored in the clipboard from users copying information within or between applications.
tags:
- attack.collection
- attack.t1115
logsource:
category: process_creation
product: windows
detection:
selection:
CommandLine|contains: 'Get-Clipboard'
condition: selection
falsepositives:
- Unknown
level: medium
```
* **User Account Hidden By Registry**
```json
description: Detect modifications for a specific user in order to prevent that user from appearing on the logon screen.
tags:
- attack.defense_evasion
- attack.t1564.002
logsource:
product: windows
category: registry_set
detection:
selection:
EventType: SetValue
TargetObject|contains: '\SOFTWARE\Microsoft\Windows NT\CurrentVersion\Winlogon\SpecialAccounts\Userlist\'
TargetObject|endswith: '$'
Details: DWORD (0x00000000)
condition: selection
falsepositives:
- Unknown
level: high
```
---
# YARA Templates
> Source: https://kb.binalyze.ai/air/features/triage/triage-rule-templates/yara-templates.html
## **File system only examples:**
**Find by Name**
```json
// Auto-Complete Support:
// Type modulename. followed by a CTRL + SPACE
// Yara documentation: https://yara.readthedocs.io/en/stable/writingrules.html
rule find_by_name
{
meta:
description = "Find files by name."
condition:
file_name == "some-name.exe"
}
```
**Find by Extension**
```json
// Auto-Complete Support:
// Type modulename. followed by a CTRL + SPACE
// Yara documentation: https://yara.readthedocs.io/en/stable/writingrules.html
rule find_by_extension
{
meta:
description = "Find files by extension."
condition:
file_extension == "xyz"
}
```
**Find by Content**
```json
// Auto-Complete Support:
// Type modulename. followed by a CTRL + SPACE
// Yara documentation: https://yara.readthedocs.io/en/stable/writingrules.html
rule find_by_content
{
meta:
description = "Find files containing specific strings."
strings:
$a = "password" wide ascii nocase
condition:
$a
}
```
**Find by Hash**
```json
// Auto-Complete Support:
// Type modulename. followed by a CTRL + SPACE
// Yara documentation: https://yara.readthedocs.io/en/stable/writingrules.html
import "hash"
rule find_by_hash
{
meta:
description = "Find files by hash."
condition:
hash.sha256(0, filesize) == "b6800c2ca4bfec26c8b8553beee774f4ebab741b1a48adcccce79f07062977be"
}
```
**Find by Size**
```json
// Auto-Complete Support:
// Type modulename. followed by a CTRL + SPACE
// Yara documentation: https://yara.readthedocs.io/en/stable/writingrules.html
rule find_by_size
{
meta:
description = "Find files by size."
condition:
filesize < 1MB
}
```
**Find by Size range**
```json
// Auto-Complete Support:
// Type modulename. followed by a CTRL + SPACE
// Yara documentation: https://yara.readthedocs.io/en/stable/writingrules.html
rule find_by_size_range
{
meta:
description = "Find files in size range."
condition:
filesize > 100KB and filesize < 500KB
}
```
**Find by Location**
```json
// Auto-Complete Support:
// Type modulename. followed by a CTRL + SPACE
// Yara documentation: https://yara.readthedocs.io/en/stable/writingrules.html
rule find_by_location
{
meta:
description = "Find files in specific location."
condition:
file_path contains "Downloads" // when file path contains a certain string
or
file_path == "C:\\Windows\\Temp\\svchost.exe" // for exact file location
}
```
**Find PE (portable executable) files only**
```json
// Auto-Complete Support:
// Type modulename. followed by a CTRL + SPACE
// Yara documentation: https://yara.readthedocs.io/en/stable/writingrules.html
rule IsPE
{
meta:
description = "Identifies PE files only based on the header."
condition:
// MZ signature at offset 0 and ...
uint16(0) == 0x5A4D and
// ... PE signature at offset stored in MZ header at 0x3C
uint32(uint32(0x3C)) == 0x00004550
}
```
**Find PKZIP files only**
```json
// Auto-Complete Support:
// Type modulename. followed by a CTRL + SPACE
// Yara documentation: https://yara.readthedocs.io/en/stable/writingrules.html
rule IsZIP
{
meta:
description = "Identifies ZIP files only based on the header."
condition:
uint32(0) == 0x04034B50
}
```
**Find by Hash with Size filter**
```json
// Auto-Complete Support:
// Type modulename. followed by a CTRL + SPACE
// Yara documentation: https://yara.readthedocs.io/en/stable/writingrules.html
// In order to make yara scan faster, it is always a good practice to use filters.
// In this case let's say we know that sample is smaller than 1MB and we want to search the hash.
import "hash"
rule find_by_hash
{
meta:
description = "Find files by hash."
condition:
filesize < 1MB and
hash.sha256(0, filesize) == "b6800c2ca4bfec26c8b8553beee774f4ebab741b1a48adcccce79f07062977be"
}
```
##
## Memory/process scan examples:
**Find Process by Name**
```json
// Auto-Complete Support:
// Type modulename. followed by a CTRL + SPACE
// Yara documentation: https://yara.readthedocs.io/en/stable/writingrules.html
rule find_process_by_name
{
meta:
description = "Find process by name."
condition:
process_name == "audiodg.exe"
}
```
**Find String in Memory**
```json
// Auto-Complete Support:
// Type modulename. followed by a CTRL + SPACE
// Yara documentation: https://yara.readthedocs.io/en/stable/writingrules.html
rule find_string_in_memory
{
meta:
description = "Find process executables containing string."
strings :
$a = "keylogger started" wide ascii nocase
condition :
$a
}
```
**Find Process by Command line**
```json
// Auto-Complete Support:
// Type modulename. followed by a CTRL + SPACE
// Yara documentation: https://yara.readthedocs.io/en/stable/writingrules.html
rule find_process_by_cmdline
{
meta:
description = "Find string in process command lines."
condition :
process_command_line icontains "powershell.exe" // icontains is for case insensitive
}
```
**Find Malware domain**
```json
// Auto-Complete Support:
// Type modulename. followed by a CTRL + SPACE
// Yara documentation: https://yara.readthedocs.io/en/stable/writingrules.html
rule find_malware_domain
{
meta:
description = "Search malware domain in process memory."
strings:
$a = "http://malware-domain.com" wide ascii
condition:
$a
}
```
**Find Byte pattern**
```json
// Auto-Complete Support:
// Type modulename. followed by a CTRL + SPACE
// Yara documentation: https://yara.readthedocs.io/en/stable/writingrules.html
rule find_byte_pattern
{
meta:
description = "Search byte pattern process memory."
strings:
$a = { AA BB CC DD EE FF }
condition:
$a
}
```
## Filesystem and memory scan:
**Find String**
```json
// Auto-Complete Support:
// Type modulename. followed by a CTRL + SPACE
// Yara documentation: https://yara.readthedocs.io/en/stable/writingrules.html
rule find_string
{
meta:
description = "Find containing string."
strings :
$a = "keylogger started" wide ascii nocase
condition :
$a
}
```
**Find Malware domain**
```json
// Auto-Complete Support:
// Type modulename. followed by a CTRL + SPACE
// Yara documentation: https://yara.readthedocs.io/en/stable/writingrules.html
rule find_malware_domain
{
meta:
description = "Search malware domain."
strings:
$a = "http://malware-domain.com" wide ascii
condition:
$a
}
```
**Find Byte pattern**
```json
// Auto-Complete Support:
// Type modulename. followed by a CTRL + SPACE
// Yara documentation: https://yara.readthedocs.io/en/stable/writingrules.html
rule find_byte_pattern
{
meta:
description = "Search byte pattern process memory."
strings:
$a = { AA BB CC DD EE FF }
condition:
$a
}
```
**Find XOR pattern**
```json
// Auto-Complete Support:
// Type modulename. followed by a CTRL + SPACE
// Yara documentation: https://yara.readthedocs.io/en/stable/writingrules.html
rule find_xor_string
{
meta:
description = "Search xor string pattern."
strings:
$xor_string = "This program cannot" xor
condition:
$xor_string
}
```
**Find Base64 pattern**
```json
// Auto-Complete Support:
// Type modulename. followed by a CTRL + SPACE
// Yara documentation: https://yara.readthedocs.io/en/stable/writingrules.html
rule find_base64_string
{
meta:
description = "Search Base64 encoded string pattern."
strings:
$mimi = "Mimikatz" ascii wide base64 base64wide
condition:
$mimi
}
```
---
# osquery Templates
> Source: https://kb.binalyze.ai/air/features/triage/triage-rule-templates/osquery-templates.html
**UAC\_disabled**
```json
-- platform: windows
-- description: Controls UAC. A setting of 0 indicates that UAC is disabled.
SELECT *
FROM registry
WHERE path='HKEY_LOCAL_MACHINE\Software\Microsoft\Windows\CurrentVersion\Policies\System\EnableLUA' AND data=0;
```
**Windows Update history**
```json
-- platform: windows
-- description: List Windows Update history.
select title, datetime(date, 'unixepoch', 'localtime')
from windows_update_history;
```
**Registry Run entries**
```json
-- platform: windows
-- description: List startup entries under Run keys.
select *
from registry
where key like
'HKEY_USERS\%\SOFTWARE\Microsoft\Windows\CurrentVersion\Run'
or key like 'HKEY_USERS\%\SOFTWARE\Microsoft\Windows\CurrentVersion\RunOnce'
or key like 'HKEY_LOCAL_MACHINE\SOFTWARE\Microsoft\Windows\CurrentVersion\Run%\%';
```
**Services that start automatically**
```json
-- platform: windows
-- description: List installed services that start automatically
SELECT name,display_name,user_account,path
FROM services
WHERE start_type = 'AUTO_START'
AND path NOT LIKE 'C:\Windows\system32\svchost.exe -k %';
```
**Unusual Cron entries**
```json
-- Unexpected crontab entries
--
-- references:
-- * https://attack.mitre.org/techniques/T1053/003/ (Scheduled Task/Job: Cron)
-- * https://github.com/chainguard-dev/osquery-defense-kit/blob/main/detection/persistence/unexpected-cron-entries.sql
--
-- false positives:
-- * crontab entries added by the user
--
-- tags: persistent filesystem state
-- platform: posix
SELECT
*
FROM
crontab
WHERE
command NOT LIKE 'root%run-parts%'
AND command NOT LIKE '%freshclam%'
AND command NOT LIKE '%clamscan%'
AND command NOT LIKE '%e2scrub%'
AND command NOT LIKE '%zfs-linux%'
AND command NOT LIKE '%anacron start%'
AND command NOT LIKE '%/usr/lib/php/sessionclean%'
AND command NOT LIKE 'root command -v debian-sa1%'
```
**Launched items not signed by Apple**
```json
-- description: Find launchd entries which purport to be by Apple, but point to binaries that are not signed by Apple.
--
-- references:
-- * https://attack.mitre.org/techniques/T1543/004/ (Create or Modify System Process: Launch Daemon)
-- * https://posts.specterops.io/hunting-for-bad-apples-part-1-22ef2b44c0aa
-- * https://github.com/chainguard-dev/osquery-defense-kit/blob/main/detection/persistence/fake-apple-launchd.sql
--
-- false positives:
-- * none have been observed
--
-- platform: darwin
-- tags: persistent launchd state
SELECT
*
FROM
launchd
LEFT JOIN file ON launchd.path = file.path
LEFT JOIN signature ON launchd.program_arguments = signature.path
WHERE
launchd.name LIKE 'com.apple.%'
-- Optimization, assumes SIP
AND file.directory NOT IN (
'/System/Library/LaunchAgents',
'/System/Library/LaunchDaemons',
'/Library/Apple/System/Library/LaunchDaemons',
'/Library/Apple/System/Library/LaunchAgents'
)
AND launchd.run_at_load = 1
AND signature.authority != 'Software Signing'
```
**Processes running no binary on the disk**
```json
-- description: Find processes that are running whose binary has been deleted from the disk.
SELECT name, path, pid FROM processes WHERE on_disk = 0;
```
**Scheduled Task with Temp path reference**
```json
-- description: List scheduled tasks where Temp directory is contained in Action path.
SELECT name, action FROM scheduled_tasks WHERE action LIKE '%\Temp\%';
```
**List all local Users**
```json
-- description: List all local Users on the system.
select * from users where type = 'local';
```
**List logged users**
```json
-- description: List logged users.
select * from logged_in_users;
```
**List users with Administrative privileges**
```json
-- description: List all the users with Administrative privileges.
select users.uid,users.gid,users.username,users.directory from users JOIN user_groups ON users.uid=user_groups.uid where user_groups.gid=544;
```
**Check the security status of the system**
```json
-- description: Check the security status of the system.
select * from windows_security_center;
select * from windows_security_products;
```
**List processes running from CMD (with hash value)**
```json
-- description: List processes running from cmd (with a hash value)
select p.name,p.path,p.pid,p.parent,h.md5,pp.path as parentpath from processes p JOIN hash h on p.path=h.path JOIN processes pp ON p.parent=pp.pid where pp.path like '%cmd%';
```
---
# Integrations
> Source: https://kb.binalyze.ai/air/features/integrations/index.html
[SSO Integrations](sso-integrations/)
[Microsoft Azure Cloud Platform Integration](microsoft-azure-cloud-platform-integration)
[Git Repositories](git-repositories)
[Cyber Threat Intelligence (STIX/TAXII Feed Integration)](cyber-threat-intelligence-stix-taxii-feed-integration)
[Splunk Integration](webhooks/splunk)
[IBM QRadar Integration](webhooks/ibm-qradar-integration)
[Wazuh Integration](webhooks/wazuh-integration)
[Cortex XSOAR Integration](webhooks/cortex-xsoar-integration)
[Elasticsearch Logstash Kibana Integration](webhooks/elasticsearch-logstash-kibana-integration)
[Mattermost Integration](webhooks/mattermost-integration)
[ServiceNow Integration](webhooks/servicenow-integration)
[Sumo Logic Integration](webhooks/sumo-logic-integration)
[Crowdstrike Integration](webhooks/crowdstrike-integration)
[Microsoft Sentinel Integration](webhooks/microsoft-sentinel-integration)
[Slack Integration](webhooks/slack-integration)
[Carbon Black Cloud Integration](webhooks/carbon-black-cloud-integration)
[Rapid7 InsightIDR Integration](webhooks/rapid7-insightidr-integration)
[LogicHub SOAR (DEVO) Integration](webhooks/logichub-soar-devo-integration)
[Fortigate SIEM Integration](webhooks/fortigate-siem-integration)
[Dynatrace Integration](webhooks/dynatrace-integration)
[Stellar XDR Integration](webhooks/stellar-xdr-integration)
[SentinelOne Integration](webhooks/sentinelone-integration)
[Microsoft 365 Defender Integration](webhooks/microsoft-365-defender-integration)
[Cisco XDR Integration](webhooks/cisco-xdr-integration)
---
# Microsoft Azure Cloud Platform Integration
> Source: https://kb.binalyze.ai/air/features/integrations/microsoft-azure-cloud-platform-integration.html
### 1. App Registration
The application registration process creates an identity for your instance in Azure AD, enabling it to authenticate and access resources securely.
1. Go to **Microsoft Entra ID Directory** and select **Overview**. Keep the "Tenant ID" information for the field required in the Azure Integration configuration page.
2. Navigate to **Manage** > **App Registrations** and click **New Registration**.
Microsoft Azure integration: App registration – New Registration
3. Name the application, select the account type, and click the **Register** button.
4. In the **Overview** section, note the "Application (client) ID" for the field required in the Azure Integration configuration page.
5. Navigate to **Certificates & Secrets** and click **New client secret**.
Microsoft Azure integration: Certificates & Secrets – New client secret
6. Provide a description, select the expiration period click Add.
Microsoft Azure integration: Add client secret
7. Note the value for the "Key (Client Secret)" information for the field required in the Azure Integration configuration page.
### 2. Role Assignment for the Subscription
Assigning roles to the registered application ensures it has the necessary permissions to access and manage the resources within the selected Azure subscription.
1. Go to **Subscriptions** and select the subscription from the list.
2. In the **Overview** section, note the "Subscription ID" information for the field required in the Azure Integration configuration page.
3. Navigate to **Access control (IAM)**, click **Add**, and select **Add role assignment**.
4. To add **Reader** roles to the registered application:
* Select **Reader** from the job function roles list and click **Next**.
* Select **Assign access to** > **User, group, or service principal**.
Microsoft Azure integration: Add role assignment – Reader
* Click **Select members**, search for the registered application's name, and select it.
Microsoft Azure integration: Select members – Reader
* Click **Review + Assign**.
5. To add **Contributor** roles to the registered application:
* Select **Contributor** from the privileged administrator roles list and click **Next**.
* Select **Assign access to** > **User, group, or service principal**.
* Click **Select members**, search for the registered application's name, and select it.
Microsoft Azure integration: Select members – Contributor
* Click **Review + Assign**.
Microsoft Azure integration: Role assignments list
6. Now make sure that the roles **Reader** and **Contributors** are assigned to the application in the **Role Assignment** list.
### 3. Final Steps
This final step involves entering the collected information into the AIR Console UI, which will integrate the application with Azure, allowing it to operate within your Azure environment.
1. Go to the **AIR Console UI** and enter all the required information on the Azure Integration configuration page.
Microsoft Azure integration: Console – Azure Integration configuration page
2. Click the **Save** button.
Microsoft Azure integration: Microsoft Azure cloud integrations list
3. As a final task, make sure that the Account is listed in the **Microsoft Azure** cloud integrations list.
---
# SSO Integrations
> Source: https://kb.binalyze.ai/air/features/integrations/sso-integrations/index.html
[ADFS SAML 2.0 SSO Integration with AIR](adfs-saml-2.0-sso-integration)
[Microsoft Azure Cloud Platform Integration](../microsoft-azure-cloud-platform-integration)
[Okta SAML 2.0 SSO Integration](okta-saml-2.0-sso-integration)
[FortiAuthenticator SAML 2.0 SSO Integration with AIR](fortiauthenticator-saml-2.0-sso-integration)
---
# Microsoft Azure SSO Integration
> Source: https://kb.binalyze.ai/air/features/integrations/sso-integrations/microsoft-azure-sso-integration.html
### 1. App Registration
To begin integrating Azure SSO with AIR, you'll first need to register a new application in Azure Active Directory (AD). This process will create a unique identity for your application, enabling secure communication with Azure services.
1. Access the [Azure Portal](https://portal.azure.com/), sign in using your credentials, and navigate to the **Microsoft Entra ID Directory** under the Azure Services section.
2. Go to **Manage > App registrations**, click on **New registration**, and provide a name for your application
3. Select **Web**, and enter the `https://[AIR_CONSOLE_ADDRESS]/api/auth/sso/microsoft-entra-id-oidc/callback` value for the Redirect URI field. Please remember to change `[AIR_CONSOLE_ADDRESS]` part for your instance.
4. Click **Register** to complete the registration process.
Microsoft Azure SSO Integration: Fig1
5. After registering the application, navigate to the **Overview** section, and copy the **Application (client) ID** and **Directory (tenant) ID**.
Open the Endpoints page and copy the **"OpenID Connect metadata document"** value. You will need to input these values into the AIR Console.
Microsoft Azure SSO Integration: Fig2
### 2. App Configurations & Permissions
Once your application is registered, you need to configure essential settings and permissions in Azure AD. This includes creating secrets and setting up API permissions to allow your application to interact securely with Azure resources.
1. In the left-hand panel, go to **Certificates & Secrets**.
2. Click **New client secret**, provide a description, set the expiration period, and click **Add**.
Microsoft Azure SSO Integration: Fig3
3. Copy the value of the client secret and store it securely as it will be required later. You will need to input this value into the AIR Console in the **Client Secret** field.
Microsoft Azure SSO Integration: Fig4
Microsoft Azure SSO Integration: Fig5
4. Navigate to **API permissions** and ensure that the **profile** permission is selected.
Microsoft Azure SSO Integration: Fig6
If it's not present, click **+ Add permission**, select **Microsoft Graph**, choose **Delegated permissions**, toggle **profile**, and click **Add permissions**.
#### \[Optional step] Using UPN as an email address
If you have users with an empty ‘email’ field, AIR can use UPN to identify users. You can follow the steps below to use UPN as an identifier for users without the ‘email’ field:
Navigate to ‘**Token configuration**.’ If ‘upn’ is not in the list, click on the ‘Add optional claim’ button. After selecting the ‘ID’ token type, tick ‘upn’ and click on the ‘Add’ button.
Microsoft Azure SSO Integration: Fig7
6. Go to **App roles** within the Azure AD application settings, click **+ Create app role**, provide a name for the role, select **Users/Groups** for allowed member types, and give the role a description.
Microsoft Azure SSO Integration: Fig8
7. Enter the corresponding "Tag" of the role to be mapped within the AIR Console under the **Value** field (e.g., use the tag "global_admin" for the Global Admin role).
Microsoft Azure SSO Integration: Fig9
8. You can make the roles on Azure SSO more than one, according to your needs. While doing this, make sure that the “tag” value in **AIR** and the “value” value in **Azure App** are the same.
Microsoft Azure SSO Integration: Fig10
### 3. Managing Users and Groups
With your application configured, the next step is to manage the users and groups that will have access to it. Assign roles and permissions to the appropriate users and groups as follows:
1. Return to the **Microsoft Entra ID Directory**, select **Enterprise applications**, filter by the application name, and click on it.
2. In the left-hand panel, select **Users and groups**, click **+ Add user/group**.
3. Choose the users/groups and click **Select**.
Microsoft Azure SSO Integration: Fig11
4. Choose the roles to assign and click **Select**.
Microsoft Azure SSO Integration: Fig12
5. Assign selected user(s) to the selected role by clicking **Assign**.
Microsoft Azure SSO Integration: Fig13
### 4. Configure SSO in AIR Console
After configuring your application in Azure, you must enable and configure SSO in the AIR Console to allow users to authenticate using Azure AD credentials.
1. Sign in to the AIR Console.
2. Navigate to **Settings**, go to **Security**, and find the **SSO** section.
3. Add Azure ID by clicking Add Provider, fill in the required fields with the **OpenID Connect metadata document**, **Client ID**, and **Client Secret** from the Azure application registration, and click **Save**.
Microsoft Azure SSO Integration: Fig14
### 5. Verification
The final step involves verifying that the SSO integration is working correctly. This ensures that users can log in to the AIR Console using their Azure AD credentials without any issues.
1. After saving, check that a **Sign in with Azure AD** button appears on the AIR Console login page.
2. Click the **Sign in with Azure AD** button to be redirected to the Microsoft login page for authentication.
Microsoft Azure SSO Integration: Fig15
3. Upon successful authentication, you will be redirected back to the AIR Console.
:::note
After configuring Single Sign-On (SSO), it is mandatory to retain at least one local user account. This is essential because if the SSO URL expires or any configuration changes occur on the SSO provider's side, you will need access to a local account to log into the AIR Console and update the SSO settings.
Maintaining a local user account acts as a safety net, ensuring continued access to critical administrative functions within AIR, even in scenarios where the SSO functionality is temporarily unavailable.
:::
---
# ADFS SAML 2.0 SSO Integration with AIR
> Source: https://kb.binalyze.ai/air/features/integrations/sso-integrations/adfs-saml-2.0-sso-integration.html
This article explains how to configure Active Directory Federation Services (ADFS) as a SAML 2.0 identity provider for AIR.
---
## Prerequisites
- Windows Server with the **AD FS** role installed and configured
- Access to the AD FS Management console with admin privileges
- Access to AIR as an administrator
- Users to be authenticated must have their **email field populated** in Active Directory
- Ensure network connectivity between AIR and the ADFS server (via the Federation Service URL)
---
## Create a relying party trust in ADFS
1. Open **Server Manager** on the ADFS server.
2. Go to **Tools** -> **AD FS Management**.
3. In the right-side **Actions** pane, select **Add Relying Party Trust**.
4. In the wizard, use the following selections:
- **Welcome**: `Claims Aware`
- **Select Data Source**: `Enter data about the relying party manually`
- **Specify Display Name**: enter a display name
- **Configure URL**: enable `SAML 2.0 WebSSO protocol`, then enter the ACS URL from AIR SSO settings
- **Configure Identifiers**: add the same ACS URL as relying party trust identifier
- **Choose Access Control Policy**: select a policy that matches your security requirements (default can be `Permit Everyone`)
5. Review the configuration and finish the wizard.
## Adjust advanced trust settings (optional)
After the trust is created, you can tune additional settings from the trust properties:
- **Hash algorithm**: change the secure hash algorithm in the **Advanced** tab if required.
- **Endpoint binding**: change SAML endpoint binding in the **Endpoints** tab (default is typically POST).
## Edit claim issuance rules
1. In **AD FS Management**, open **Relying Party Trusts**.
2. Select the trust you created for AIR.
3. Click **Edit Claim Issuance Policy**.
4. Add claim rules to pass required user attributes (including Name ID) to Console.
5. Start with the **Send LDAP Attributes as Claims** template and continue with the additional required rules for your deployment.
## Configure SSO settings in AIR
You can upload IdP metadata to configure SSO quickly.
1. Open the metadata URL from your ADFS server:
```
https:///FederationMetadata/2007-06/FederationMetadata.xml
```
2. Download the XML metadata file.
3. In AIR SSO settings, upload the metadata XML file.
## Configure users in Active Directory
1. Open **Active Directory Users and Computers**.
2. Create a new user account for SSO testing.
3. Edit the user profile and ensure the email address is populated.
:::caution
The email address is required for SAML login. Users without email values cannot authenticate to AIR via ADFS SSO.
:::
## Configure role mapping
1. In AIR, open the roles page and copy the required role `Tag` values.
2. Add groups and map them to users.
3. Use the required role tags with the `air_role.` prefix when configuring role-related group values.
4. Open target user settings and assign required role entries.
## Validate the login flow
After configuration is complete:
1. Open the AIR login page.
2. Confirm the **Sign in with ADFS** button is visible.
3. Click the button and authenticate on the ADFS login page.
4. Verify that you are redirected back to the AIR Console after successful authentication.
---
# FortiAuthenticator SAML 2.0 SSO Integration with AIR
> Source: https://kb.binalyze.ai/air/features/integrations/sso-integrations/fortiauthenticator-saml-2.0-sso-integration.html
This guide explains how to integrate **FortiAuthenticator** as a SAML 2.0 Identity Provider (IdP) for **AIR**.
> ✅ This method supports **IdP-initiated SAML SSO**. Role mapping is handled via FortiAuthenticator Groups and AIR `roleTags`.
---
## Prerequisites
- Access to FortiAuthenticator with admin privileges
- Access to AIR as an administrator
- Users to be authenticated must have their **email field populated**
- Ensure network connectivity between AIR and FortiAuthenticator (via server address used in configuration)
---
## Step 1: Prepare FortiAuthenticator
1. Log in to FortiAuthenticator with an admin account.
2. Go to **Authentication → User Management → User Groups**.
3. Create user groups that will act as AIR role mappings:
- Use the prefix `air_role.` followed by the role tag used in AIR.
Example: `air_role.global_admin`
- Only roles that will be actively used for login need to be created.
4. Assign users to their corresponding AIR role groups.
---
## Step 2: Configure FortiAuthenticator as SAML IdP
1. Navigate to **Authentication → SAML IdP → General**.
2. Enable "Enable SAML Identity Provider portal" setting.
3. In the **Server Address** field, enter the address AIR will use to reach FortiAuthenticator.
Make sure AIR can access this URL over the network.
4. (Optional) Select a **default IdP certificate**.
This is recommended for metadata download compatibility.
5. Click **Save** to store your settings.
---
## Step 3: Create Service Provider in FortiAuthenticator
1. Go to **Authentication → SAML IdP → Service Providers**.
2. Click **Create New** to register the AIR as a new SP (Service Provider).
3. Fill in:
- **SP Name**: Choose a meaningful name (e.g., `AIR-Instance-X`)
- **IdP Prefix**: Auto-generate or enter manually
- **Server Certificate**: Select one, or **Use default setting in SAML IdP General page** if using the default certificate
4. Click **Save** to create the SP.
---
## Step 4: Configure SSO in AIR
1. In a new tab, log in to **AIR** with an admin user.
2. Go to **Settings → Security**, scroll to the **SSO** section.
3. Enable **FortiAuthenticator** and copy the **ACS URL** at the bottom.
---
## Step 5: Complete SP Configuration in FortiAuthenticator
1. Go back to your created SP in FortiAuthenticator.
2. Under **SP Metadata**, fill in:
- **SP Entity ID** → Paste the ACS URL from AIR
- **SP ACS (Login) URL** → Paste the ACS URL again
3. Under **Assertion Attributes**, configure:
- **Subject Name ID** → Set to `email`
- **Format** → `urn:oasis:names:tc:SAML:1.1:nameid-format:emailAddress`
4. Add the following SAML assertions:
| SAML Attribute | User Attribute | Required |
| -------------- | -------------- | -------- |
| `groups` | Group | ✅ |
| `firstName` | First Name | ❌ |
| `lastName` | Last Name | ❌ |
5. Click **Save**.
---
## Step 6: Export IdP Metadata
1. Open the newly created SP entry.
2. Click **Download IdP Metadata**.
---
## Step 7: Upload Metadata to AIR
1. Return to **AIR → Settings → Security → SSO** section.
2. Use the **Upload IdP Metadata** option to upload the file.
> 🔄 Alternatively, you can copy values from Forti and paste them into AIR manually.
3. Click **Save**.
---
## Step 8: Test the Integration
1. Log out of AIR.
2. Click **Login with FortiAuthenticator** on the login screen.
3. You’ll be redirected to FortiAuthenticator. After successful authentication, you’ll be redirected back to AIR.
---
## Troubleshooting
If login fails, check the following:
- 🔌 **Network Issues**: Make sure AIR can reach FortiAuthenticator’s Server Address.
- 👥 **Role Mapping**: Ensure the user is assigned to at least one Forti group named `air_role.X` where `X` matches a role tag in AIR.
- View AIR role tags via **Settings → User Management → User Roles**.
- 📧 **Email Field**: Users without an email field in Forti cannot log in.
- 📄 **Logs**: If the issue persists, collect SAML logs from both AIR and Forti and contact support.
---
## Example Group Mapping for Predefined Roles
| AIR Role Name | AIR Role Tag | Forti Group Name |
| -------------------- | ---------------------- | ------------------------------- |
| Global Admin | `global_admin` | `air_role.global_admin` |
| Organization Admin | `organization_admin` | `air_role.organization_admin` |
| L1 & L2 Analyst | `l1_l2_analyst` | `air_role.l1_l2_analyst` |
| Maintenance Engineer | `maintenance_engineer` | `air_role.maintenance_engineer` |
| L3 & L4 Analyst | `l3_l4_analyst` | `air_role.l3_l4_analyst` |
| Responder | `responder` | `air_role.responder` |
---
# Okta SAML 2.0 SSO Integration
> Source: https://kb.binalyze.ai/air/features/integrations/sso-integrations/okta-saml-2.0-sso-integration.html
1. Sign in to the Okta Admin Dashboard.
2. Click the “Applications” button in the left menu.
3. Click Create App Integration.
6. Enter your domain name followed by this callback at the end of the path: `/api/auth/sso/okta-saml/callback`.
For example: `>/api/auth/sso/okta-saml/callback`
:::caution
**All fields are case-sensitive. Make sure all of them are filled correctly.**
:::
8. On the next page, click the first option, and then click the “Finish” button.
11. Select “string array“ as the data type.
12. Enter a name and description for the attribute.
13. Enter “roleTags“ as the variable name.
14. Click the “Define enumerated list of values“ checkbox.
15. Click the “Attribute required“ checkbox.
16. Give a display name of your new role and enter the corresponding “Tag” of the role that you want to map within the AIR Console into the “Value” field. For example, the “global\_admin”, which is the tag of the Global Admin role in AIR Console, is used for the “Value” section.
Then click save.
\
17. Navigate back to the “Applications“ page. Click the name of the app. Then go to the “Assignments” tab.
18. Click the “Assign to People” button under the “Assign“ dropdown.
25. Fill in the required fields according to the Sign on tab in the Okta
:::caution
**Entry Point: Okta Sign on Url**
**Issuer: Okta Issuer**
**Cert: Okta Signing Certificate**
:::
26. Click Save settings
27. The “Sign in with OKTA” button should appear on the AIR Console login page. Once you click this button, you will navigate to the Okta login page to authenticate your access. Once you are authenticated, you will be redirected back to the AIR console.
:::note
After configuring Single Sign-On (SSO), it is mandatory to retain at least one local user account. This is essential because if the SSO URL expires or any configuration changes occur on the SSO provider's side, you will need access to a local account to log into the AIR Console and update the SSO settings.
Maintaining a local user account acts as a safety net, ensuring continued access to critical administrative functions within AIR, even in scenarios where the SSO functionality is temporarily unavailable.
:::
---
# Git Repositories
> Source: https://kb.binalyze.ai/air/features/integrations/git-repositories.html
AIR allows you to connect your organization's Git repositories directly to the platform to manage Hunt/Triage rules as a single source of truth. By importing YARA, Sigma, and osquery rule files from a Git repository, your team can maintain version-controlled, auditable rulesets that stay synchronized with your detection engineering workflow.
Below is a short introductory demo of the Git Repositories integration.
[**See It in Action**](https://app.storylane.io/share/mm88jj0hicpz)
## Supported Providers
| Provider | Repository URL Format |
|----------|----------------------|
| **GitHub** | `https://github.com//` |
| **GitLab** (cloud and self-hosted) | `https://gitlab.com//` |
| **Azure DevOps** | `https://dev.azure.com///_git/` |
| **Bitbucket** | `https://bitbucket.org//` |
## Organization Scope
Repository connections are created per organization. If you manage multiple organizations in AIR, you must switch to each organization individually before adding a repository connection.
:::note
A repository connection can only be created for the currently active organization. To create one under a different organization, switch to that organization first using the organization selector.
:::
## Adding a Repository Connection
Navigate to **Integrations > Git Repositories** and click **Add New** to open the repository connection wizard.
### Step 1: Repository Details
Configure the connection to your Git provider:
- **Name** — A descriptive name to identify this repository connection (e.g., "YARA Rules - Windows" or "Sigma Detection Rules")
- **Organization** — The organization that will own this connection (must match the organization you are working in; switch organizations first if needed)
- **Provider** — Select your Git provider (GitHub, GitLab, Azure DevOps, or Bitbucket)
- **Repository URL** — The full URL of your Git repository. The URL must match the selected provider
- **Branch** — The branch to synchronize from (e.g., `main` or `master`). This field is required even if the placeholder text suggests a default
- **Access Token** — A personal access token with read permissions to the repository
- **Webhook** — For automatic, webhook-based synchronization, the console shows where to point the webhook **after** the connection is created. Until then, the wizard may display a placeholder such as *Will be generated after creation*.
Click **Test Connection** to verify that AIR can authenticate and access the repository before proceeding.
Git Repositories: Repository Connection
:::tip
For public repositories, an access token is technically not required. However, API rate limits for unauthenticated requests are very low. Always provide a token to avoid exceeding these limits and ensure reliable synchronization.
:::
### Step 2: Sync Configuration
Define which files to synchronize and how often:
- **Include Paths** — Browse the repository contents and select specific directories or files to import. You can select individual subdirectories to scope the import to relevant rule files only
- **Exclude Paths** — Specify directories to skip during synchronization (e.g., documentation or test folders)
- **File Patterns** — Define file extension filters to refine which files are imported (e.g., `*.yar`, `*.yara`, `*.yml`)
- **Sync Interval** — Choose how frequently AIR checks the repository for changes:
- **Manual** — Sync only when triggered manually
- **Automatic** — Sync on every detected commit or push (webhook-based)
- **Scheduled** — Sync at a fixed interval (15 minutes, 30 minutes, 1 hour, or 2 hours)
The wizard also summarizes sync limits: individual files over **10 MB** and repositories over **10,000** files are skipped automatically (see [Limits](#limits)).
Git Repositories: Sync Configuration
### Step 3: Content Settings
This step is labeled **Content Settings** in the wizard. Configure how imported rules are managed within AIR:
Git Repositories: Content Settings
#### Ownership Mode
This is the most important configuration choice. Two modes are available:
| Mode | Behavior |
|------|----------|
| **Mirror** | Rules stay synchronized with the repository. When files are added, updated, or removed in the repository, rules are automatically kept in sync. Rules are managed by the repository and **cannot be edited locally** in AIR. |
| **Fork** | Rules are imported from the repository and become yours to manage. You can freely edit or delete them within AIR, but changes in the repository **will not affect existing rules**. You can manually trigger a sync to import new files. |
:::caution
Choose your ownership mode carefully — **you cannot change it after the connection is created**. In **Mirror** mode, local edits are not possible — the repository is the single source of truth. In **Fork** mode, repository updates will not overwrite your local changes, which means your rules may drift from the repository over time.
:::
#### Content Type
Currently, the only supported option in the **Content Type** dropdown is **Hunt/Triage Rules**. Additional content types may be added in future releases.
#### Rule Engine
Select the rule engine that matches the files in your repository:
- **YARA** — For YARA rule files. When YARA is selected, you must also choose **Search In** (scan **Memory**, **Disk**, or **Both**). The console labels this control **Search In**; it defines the same hunt scope as **Memory** / **Disk** / **Both** described elsewhere in AIR.
- **Sigma** — For Sigma detection rule files
- **osquery** — For osquery pack files
:::note
Each repository connection supports a single rule engine. If your repository contains multiple rule types (e.g., both YARA and Sigma rules), create separate connections — one for each rule engine — and use **Include Paths** to scope each connection to the appropriate directory.
:::
#### Tags
Add tags to organize and filter the imported rules within AIR. Tags are applied to all rules imported from this connection and appear in the **Libraries > Hunt/Triage Rules** view. Automatic **git-sync** tags are always applied in addition to any tags you add. You can use nested tagging with colons (e.g., `APT28:Windows:persistence`) for hierarchical organization.
Click **Create** to finalize the connection.
## Synchronization
After creating a repository connection, AIR performs the initial synchronization based on your configuration. You can monitor and manage synchronization from the **Integrations > Git Repositories** page.
### Sync Status
The repository list displays key information for each connection:
- **Repository Name** and **Provider**
- **Repository URL**
- **Sync Status** — Success, In Progress, or Failed
- **Last Sync** timestamp
- **Created By**
### Sync Logs
Click on a repository connection to view detailed synchronization logs. Each sync event records:
- Files added, updated, or removed
- Any errors or skipped files
- Timestamp and duration
### Manual Sync
Click **Sync Now** on any repository connection to trigger an immediate synchronization, regardless of the configured sync interval.
## Viewing Synced Rules
Imported rules appear in **Libraries > Hunt/Triage Rules** alongside manually created rules. Rules imported from a Git repository are identified by a **Git Repository** source label, making it easy to distinguish them from locally created rules.
From the rule details view, you can see all metadata including the tags, rule engine, ownership mode, and source repository associated with each rule.
## Webhooks for Automatic Sync
When using the **Automatic** sync interval, AIR uses webhooks to receive push notifications from your Git provider. This ensures rules are updated immediately when changes are committed to the repository. Refer to your Git provider's documentation for webhook configuration:
- **GitHub** — Configure a webhook in your repository's **Settings > Webhooks** section
- **GitLab** — Configure a webhook in your project's **Settings > Webhooks** section
- **Azure DevOps** — Configure a service hook in **Project Settings > Service hooks**
- **Bitbucket** — Configure a webhook in your repository's **Settings > Webhooks** section
Links to the relevant provider documentation are provided within the AIR connection wizard during setup.
## Limits
AIR enforces file size and repository limits to maintain performance:
- Individual rule files larger than **10 MB** are skipped during synchronization
- Repositories containing more than **10,000** files are skipped; an informational notice is shown in the wizard and sync experience
These limits are designed to prevent performance degradation and are displayed in the AIR interface when applicable.
## Network Requirements
The AIR Console connects directly to your Git provider to fetch repository contents. If your organization restricts outbound network access from the Console, ensure the following domains are allowed:
| Provider | Domain(s) to Allow |
|----------|-------------------|
| **GitHub** | `github.com`, `api.github.com` |
| **GitLab** (cloud) | `gitlab.com` |
| **GitLab** (self-hosted) | Your GitLab instance domain |
| **Azure DevOps** | `dev.azure.com` |
| **Bitbucket** | `bitbucket.org`, `api.bitbucket.org` |
:::caution
If these domains are not accessible from the Console, synchronization will fail. Ensure your network policies and firewall rules permit outbound HTTPS (port 443) access to the relevant provider domains.
:::
---
# Cyber Threat Intelligence (STIX/TAXII Feed Integration)
> Source: https://kb.binalyze.ai/air/features/integrations/cyber-threat-intelligence-stix-taxii-feed-integration.html
Cyber Threat Intelligence integration in AIR enables you to ingest structured threat intelligence from STIX/TAXII-compatible feeds and operationalize it in investigation workflows.
The integration connects AIR to external **TAXII 2.x** servers, pulls **STIX** objects, parses indicators, and converts them into investigation-ready **YARA, Sigma, and osquery hunt/triage rules**.
## Key capabilities
With Cyber Threat Intelligence integration, you can:
- Connect to TAXII 2.x compliant feeds (public or private)
- Discover available TAXII collections automatically
- Run scheduled or manual sync jobs
- Apply confidence filtering before rule generation
- Convert indicators into YARA, Sigma, and osquery hunt/triage rules
- Browse imported indicators and sync history in AIR
## Supported authentication methods
You can configure feed access with:
- No authentication (for public feeds)
- Bearer token
- Basic authentication
- API key via custom header
## Prerequisites
Before configuring a feed, verify the following:
- You have administrative access in AIR
- Your feed provider supports TAXII 2.x and STIX data
- You have the required feed credentials/tokens
- The Console can reach the feed endpoint over the network
- The Cyber Threat Intelligence integration feature is enabled in your environment
## Recommended setup workflow
1. Add the TAXII feed URL and authentication details.
2. Test connection and load available collections.
3. Select collections to subscribe.
4. Configure conversion options per category.
5. Set sync strategy (manual or scheduled).
6. Run initial sync and review generated hunt/triage rules.
## Supported indicator categories
The current parser supports these indicator categories:
- File hash
- File path
- Network address (IPv4/IPv6)
- Domain
- URL
- Email
- Registry key
- Mutex
- Process
- Direct YARA pattern
- Direct Sigma pattern
## Rule generation and ownership modes
When content type is hunt/triage rules, imported indicators are converted into YARA, Sigma, or osquery content.
| Mode | Behavior |
| -------- | -------------------------------------------------------------------------------------------- |
| Managed | Rules are maintained by the system and updated on sync cycles. |
| Snapshot | Rules are created as a point-in-time snapshot and are not overwritten by later sync updates. |
## Sync behavior
- Scheduled sync intervals support: `15`, `30`, `60`, `120`, `360`, `720`, `1440` minutes
- Manual sync is supported
- Sync logs are retained for recent runs and can be reviewed in the UI
- Incremental sync is used to reduce repeated data transfer
## Current limitations
- TAXII 1.x is not supported
- Compound STIX patterns (for example `AND` / `OR` mixed observables) are not supported
- Feed ingestion is pull-based (no webhook/push mode)
## Best practices
- Start with trusted collections and expand gradually
- Set a sensible confidence threshold to reduce noisy indicators
- Define clear ownership for feed maintenance and review
- For Snapshot mode, periodically remove low-value or stale feed sources and keep curated feeds only.
## How conversion works in practice
During each sync, AIR processes incoming STIX objects and applies your collection-level configuration:
1. Pull indicators from selected TAXII collections.
2. Parse supported indicator patterns into internal categories.
3. Filter indicators by confidence threshold and supported pattern rules.
4. Group indicators by engine/category mapping.
5. Generate or update hunt/triage rules (YARA, Sigma, osquery).
In Managed mode, generated rules are maintained by sync cycles. In Snapshot mode, generated rules are preserved as point-in-time outputs.
## FAQ
### Why do I see fewer indicators than expected after sync?
This usually means one or more indicators were excluded by configuration or parser rules, for example:
- Confidence is below your minimum threshold
- Pattern type is unsupported for the current phase
- Indicator category is disabled in conversion settings
- Indicator has expired or is no longer available in the source collection
### Why did some indicators not become rules?
Not every STIX object becomes a hunt/triage rule directly. Rule creation depends on:
- Supported indicator category
- Engine mapping in your collection configuration
- Search scope compatibility for the selected engine
- Rule size and batching limits in the current implementation
### What is the difference between Managed and Snapshot modes?
- **Managed**: best for continuously updated feeds. Rules are updated by recurring sync jobs.
- **Snapshot**: best for one-time or controlled imports. Existing generated rules are not overwritten by later sync updates.
### How often should I run sync jobs?
Use shorter intervals for high-priority operational feeds and longer intervals for low-volatility feeds. Supported scheduled intervals are `15`, `30`, `60`, `120`, `360`, `720`, and `1440` minutes.
### Which authentication type should I choose?
- Use **None** for public feeds
- Use **Bearer** for token-based providers
- Use **Basic** when username/password is required
- Use **API Key** when provider expects a custom header
Always confirm the exact auth method and header format with your feed provider.
### Is TAXII 1.x supported?
No. The current integration supports TAXII 2.x only.
### Can I use webhook/push instead of polling?
Not in the current phase. Feed ingestion is pull-based through scheduled or manual sync.
### Can I ingest every STIX pattern type?
No. Compound patterns (for example mixed `AND` / `OR` object conditions) are currently out of scope and can be skipped.
---
# Webhooks
> Source: https://kb.binalyze.ai/air/features/integrations/webhooks/index.html
In AIR, webhooks act as triggers that enable integration with other security tools, such as SIEM, SOAR, or EDR systems. They allow AIR to automatically initiate evidence collection, analysis, and presentation of findings in response to alerts received from these tools.
:::note
APIs and webhooks both enable system integration and communication between applications but serve different use cases. **APIs are often preferred over webhooks** due to greater control, flexibility, and broader operational capabilities.
:::
A trigger is the combination of a parser, an acquisition profile, and a destination for saving the collected evidence (either local or remote options are available).
Users access webhooks by clicking the Integrations button in the Main Menu and then selecting Webhooks from the Secondary Menu. To create a new Webhook, select **+Add New**:
Webhooks: Add New
## Before you start
* Triggers are basic REST endpoints that can be called via HTTP GET or POST methods
* Each trigger
* Starts with the AIR Console address (AIR-ADDRESS)
* Has a name that makes it easy to remember (TRIGGER-NAME)
* Has a security token (TRIGGER-TOKEN) attached to it that can be regenerated when needed
* Optionally, an Endpoint Identifier that could either be the hostname or the IP address of the endpoint trigger is being called for
* GET Triggers expect this information in the URL
* POST Triggers extracts this information from the Webhook Payload
```txt title="Parts of a Trigger URL"
http:///api/trigger//{endpoint}?token=
```
## Parsers
To make it easier to integrate with any trigger source, AIR provides two alternative methods of receiving endpoint information (name or IP address):
* URL Parser (HTTP GET)
* Webhook Parser (HTTP POST)
### 1. URL Parser
This method requires the trigger source to provide an endpoint name or IP address directly in the URL.
Below is an example GET request and response for collecting "Browsing History" from an endpoint with the name "JohnPC".
Request: [http://192.168.1.100/api/trigger/browsing-trigger/**JohnPC**?token=...](http://192.168.1.100/api/trigger/browsing-trigger/JohnPC?token=...)
```javascript
Response (application/json)
HTTP 200
{
"success": true,
"data":
{
"parser": "URL",
"acquisitionProfile": "Browsing History",
"endpoints": ["JohnPC"]
}
}
```
Even without using a SIEM/SOAR, the above URL can be used for starting an acquisition task simply by:
* Visiting it with a web browser,
* Adding it to the click action of an HTML button in your case management alert reports,
* Creating a simple script for making a GET request to this address.
## 2. Webhook Parser
Webhook parsers require the trigger source to provide the endpoint information inside a JSON payload, which is POSTed to the trigger.
Splunk Parser, which is provided out of the box, is a very basic example of this. After adding a trigger URL as a POST workflow action, whenever Splunk generates an alert for an endpoint, it posts JSON alert data containing the endpoint information as a nested property, which is parsed by the trigger parser. The parser then uses this information to start an acquisition on the endpoint automatically. You can read [Splunk POST Workflow Actions](https://docs.splunk.com/Documentation/Splunk/8.0.5/Knowledge/SetupaPOSTworkflowaction) documentation for more information.
For additional webhook trigger parsers, contact [support@binalyze.com](mailto:support@binalyze.com).
## Security
Each created trigger contains a dedicated security token that can be revoked at any time.
Once you regenerate a security token, all previous integrations using the old security token will begin receiving HTTP 401/Unauthorized responses.
---
# Carbon Black Cloud Integration
> Source: https://kb.binalyze.ai/air/features/integrations/webhooks/carbon-black-cloud-integration.html
### Prerequisites
* Carbon Black Defense API key with access level type.
* Creating a credentials.psc file with the help of `cbapi-defense configure`
* AIR instance URL and webhook name and token.
* Docker
* A machine with Network Connection to AIR and Carbon Black Cloud instances.
### Configuration
#### Navigate to Carbon Black Cloud Console
* Create API key
* Navigate to Settings > API Keys > Add API Key
* Create an API Key with _Access Level_ SIEM and Copy both keys
* API ID _Connector ID_
* API Secret Key _API Key_
* Create an Alert Notification
* Navigate to \*\*Settings > Notification > Add Notification
* Fill in the necessary details
* Select the Created API Key on the first step
* Save
#### Navigate to AIR Console
* Create a webhook
* Click Webhook on the left-hand pane
* Click **+ New Webhook**
* Select **Carbon Black Parser** from **Parser**
* Fill in all the necessary information and save
* Copy the **Webhook URL,** and paste it to the value of AIR\_WEBHOOK\_URL in .env:1.
#### Navigate the environment you want to run the script
* Create credentials.defense file
* Install [cbapi](https://cbapi.readthedocs.io/en/latest/installation.html)
* Run cbapi-defense configure and follow the instructions. Please refer to [Carbon Black Documentation](https://developer.carbonblack.com/reference/enterprise-response/guide/getting-started-with-the-cbapi/) for more information.
* A credentials.defense file will be created and copy it to the current working directory.
### Usage
* Clone the repo
* Follow the Configuration part and make the proper changes.
* Run `docker build -t carbonblack-air-integration .` and finally `docker run --env-file=.env carbonblack-air-integration`
* The script will start running and will listen to new Carbon Black alerts. Once a new alert is detected, it will send an acquisition request to the specified AIR instance.
* A message appears when an acquisition request has been sent to the device.
* If an error occurs, the script will print the error message and log it in the integration.log file.
For more information and script, please visit: [https://github.com/binalyze/carbonblack-air](https://github.com/binalyze/carbonblack-air)
---
# Cisco XDR Integration
> Source: https://kb.binalyze.ai/air/features/integrations/webhooks/cisco-xdr-integration.html
**Step 1 - Create Webhook for Cisco XDR**
* Visit the **Webhooks** page in AIR,
* Click the "**+ New Webhook**" button in the upper right corner,
* Provide a self-explanatory name (examples: RDP Brute Force Trigger, Phishing Detected Trigger, etc.),
* Select "**Cisco XDR: Cisco XDR Webhook Parser**" as the parser for this webhook,
* Select an **Acquisition Profile** when Cisco XDR activates this webhook,
* Select the **Ignore** option or leave with its default value (defaults to 24 hours for recurrent alerts for a single endpoint),
* Provide other settings such as **Evidence Repository**, **CPU Limit**, **Compression & Encryption** to use or let AIR configure them automatically based on the matching policy
* Click the "**Save**" button.
* Copy the Webhook URL for Step 2.
**Step 2 - Setting up Cisco XDR**
* Go to **Automate** - **Targets**
* Click **New Target**.
* Select **HTTP Endpoint** in **Target Type**
* Enter a unique display name for the target in the **Display Name** field and a brief description in the **Description** field
* In the **HTTP** area, paste the Webhook URL you created in Step 1.
* **Protocol** - Choose the appropriate protocol (HTTP or HTTPS)
* **Host/IP Address** - Enter the hostname or IP address for the HTTP Endpoint.
* **Port** - Enter the HTTP port number
* **Path** - Enter the HTTP path
* Click **Submit** to add and save the target
* For more information, please refer to Product's [Documentation](https://docs.xdr.security.cisco.com/Content/Automate/about-automation.htm).
---
# Cortex XSOAR Integration
> Source: https://kb.binalyze.ai/air/features/integrations/webhooks/cortex-xsoar-integration.html
### Steps to Integrate
**Step 1: Preparing API Token**
1. Create a new API Token by clicking the Settings → API Tokens.
2. Give a Token Name.
3. Choose an expiration date.
4. Click **Save** and copy the token.
#### **Step 2: Adding Integration to Cortex XSOAR**
1. Sign in to Cortex XSOAR server.
2. Click “**Marketplace**” on the left bottom corner.
3. Search and install the AIR Integration to your instance.
#### **Step 3: Setting up the Integration**
1. Click “**Settings**” on the left bottom corner.
2. Find installed integration, and click “**Add instance**”
3. Fill in the AIR Server URL and API Key. Click “**Test**”, and you will see “**Success**”, which means Cortex XSOAR established the test connection with the AIR Server.
4. **Save** and **Exit.**
### Usage
**Isolation**
* You can use the integration in Automations, Playbooks, or War Room.
* To execute an isolation task, write the following command at the bottom of the page:
```
!air-isolate hostname= organization_id= isolation=
```
* **Acquisition**
* To execute an acquisition task, write the following command at the bottom of the page:
```
!binalyze-air-acquire case_id= hostname= organization_id=0 profile="PROFILE"
```
---
# Crowdstrike Integration
> Source: https://kb.binalyze.ai/air/features/integrations/webhooks/crowdstrike-integration.html
## Steps to Integrate
#### **Step 1: Create a Webhook**
* Visit the **Webhooks** page in AIR,
* Click the "**+ New Webhook**" button in the upper right corner,
* Provide a self-explanatory name (examples: RDP Brute Force Trigger, Phishing Detected Trigger, etc.),
* Select "**Crowd Strike Webhook Parser**" as the parser for this webhook,
* Select an **Acquisition Profile**,
* Provide other settings such as **Evidence Repository**, **CPU Limit**, **Compression & Encryption** to use or let AIR configure them automatically based on the matching policy.
* Click the "**Save**" button,
* Hover your mouse over the link below the Webhook name and double-click to copy
#### **Step 2: Configure Crowdstrike**
#### Navigate to the CrowdStrike
* Go to Crowdstrike Store, find the Webhook Plugin, and open it.
* Click Configure, and fill in the blanks
* Name: Give an explanatory name
* Webhook URL: Paste the webhook you created earlier,
* Click Notify On Configuration Failure and save the configuration.
* Go to Fusion workflow,
* Create a workflow or use an existing one,
* Create a trigger, **Add action**
* Choose action type: **Notification**
* Choose the webhook name you created in the second step
* Add **Sensor Hostname** to **Data to Include**
Save and exit.
---
# Dynatrace Integration
> Source: https://kb.binalyze.ai/air/features/integrations/webhooks/dynatrace-integration.html
#### Step 1 - Creating A webhook for Dynatrace
* Visit the **Webhooks** page in AIR,
* Click the "**+ New Webhook**" button in the upper right corner,
* Provide a self-explanatory name,
* Select "**Dynatrace Webhook Parser**" as the parser for this webhook,
* Select an **Acquisition Profile** when the trigger activates this webhook,
* Select the **Ignore** option or leave with its default value (defaults to 24 hours for recurrent alerts for a single endpoint),
* Provide other settings such as **Evidence Repository**, **CPU Limit**, **Compression & Encryption** to use or let AIR configure them automatically based on the matching policy
* Click the "**Save**" button
#### Step 2 - **Creating the Integration Settings in Dynatrace**
* In the Dynatrace menu, go to **Settings** > **Integration** > **Problem notifications,**
* Select **Add notification,** and a drop-down sub-menu appears,
* **Display name** This is the freeform name of this integration that will be displayed in Dynatrace on **Settings** > **Integration** > **Problem notifications** after finishing this configuration.
* **Webhook URL** The WebHook URL that you created in **Step 1,**
* **Custom payload** Once a problem is detected or resolved, this customizable payload is pushed through an **HTTP POST** to AIR,
* _Optional_ Turn on **Accept any SSL certificate,**
* _Optional_ Turn on **Call webhook if new events merge into existing problems,**
* Assign an **Alerting profile,**
* Select **Send test notification** to make sure your webhook integration is working,
* **Save** changes.
---
# Elasticsearch Logstash Kibana Integration
> Source: https://kb.binalyze.ai/air/features/integrations/webhooks/elasticsearch-logstash-kibana-integration.html
#### Step 1 - Creating A webhook for ELK
* Visit the **Webhooks** page in AIR,
* Click the "**+ New Webhook**" button in the upper right corner,
* Provide a self-explanatory name (examples: RDP Brute Force Trigger, Phishing Detected Trigger, etc.),
* Select "Elasticsearch Logstash Kibana**: Generic** Elasticsearch Logstash Kibana" as the parser for this webhook,
* Select an **Acquisition Profile** when ELK activates this webhook,
* Select the **Ignore** option or leave with its default value (defaults to 24 hours for recurrent alerts for a single endpoint),
* Provide other settings such as **Evidence Repository**, **CPU Limit**, **Compression & Encryption** to use or let AIR configure them automatically based on the matching policy
* Click the "**Save**" button
#### Step 2: Preparing ELK Watcher
* Visit the \/app/management/insightsAndAlerting/watcher/watches . On the right, click **"Create"** then **"Create advanced watch"**.
* Add an action part to your watcher.
* Change the following JSON:
1. Host: AIR Server address,
2. Port: AIR Server port,
3. Path: The webhook full path,
4. Token: The token that you created in AIR Server.
5. Body: The body part must include either the endpoint hostname or endpoint IP. Mapping must be customized with the watcher payload itself.
`{ "trigger": { "schedule": { "interval": "30m" } }, "input": { "search": { "request": { "search_type": "query_then_fetch", "indices": [ "*" ], "rest_total_hits_as_int": true, "body": { "size": 0, "query": { "match_all": {} } } } } }, "condition": { "compare": { "ctx.payload.hits.total": { "gte": 10 } } }, "actions": { "binalyzeAIR_webhook": { "webhook": { "scheme": "http", "host": "`**`air-server-url`**` ", "port":`` `` `**`80`**`, "method": "post", "path": "`**`/api/webhook/NAME`**`", "params": { "token": "`**`9236a8a1-ffb9-4521-9947-3f46548916c0`**`" }, "headers": { "Content-Type": "application/json" }, "body": """["{{`**`ctx.payload.endpoint`**`}}"]""" } } } }`
* You can simulate the post request to learn if it's working.
Please refer to the vendor's [documentation](https://www.elastic.co/guide/en/elasticsearch/reference/current/how-watcher-works.html) for more information.
---
# Fortigate SIEM Integration
> Source: https://kb.binalyze.ai/air/features/integrations/webhooks/fortigate-siem-integration.html
**Step 1 - Creating A webhook for Fortigate SIEM**
* Visit the **Webhooks** page in AIR,
* Click the "**+ New Webhook**" button in the upper right corner,
* Provide a self-explanatory name,
* Select "**Fortigate SIEM** **Webhook Parser**" as the parser for this webhook,
* Select an **Acquisition Profile** when the trigger activates this webhook,
* Select the **Ignore** option or leave with its default value (defaults to 24 hours for recurrent alerts for a single endpoint),
* Provide other settings such as **Evidence Repository**, **CPU Limit**, **Compression & Encryption** to use or let AIR configure them automatically based on the matching policy
* Click the "**Save**" button.
**Step 2 - Creating the Integration Settings in Fortinet,**
In this integration, a specific log message (failed administrator login attempt) triggers the FortiGate to send the contents of the log to **AIR Console.**
**To configure the webhook automation stitch in the GUI:**
1. Go to _Security Fabric > Automation_ and click _Create New_.
2. Enter the stitch name.
3. Configure the trigger:
* Click _Add Trigger_.
* Click _Create_ and select _FortiOS Event Log_.
* Enter the following:
* Name: _\_
* Event: _\_
* Click OK.
* Select the trigger in the list and click Apply.
4. Configure the automation stitch action:
* Click _Add Action_.
* Click _Create_ and select _Webhook_.
* Enter the following:
* Name: Trigger an Acquisition in AIR
* Protocol: HTTP
* URL: Paste the Webhook URL
* Method: POST
* HTTP body: _%%log%% **or** %%results.source%%_
* Add HTTP Header `Content-Type: application/json`
* Click _OK_.
* Select the action in the list and click _Apply_.
5. Click _OK_.
**Step 3 - To test the automation stitch in Fortinet**
1. Trigger the related event,
2. On the server, check the log to see that FortiGate sent its contents.
3. The body content is replaced with the log from the trigger.
4. On the FortiGate, go to _Log & Report > Events_ and select _System Events_ to confirm that the stitch was activated.
5. Go to _Security Fabric > Automation_ to see when the stitch was triggered.
---
# IBM QRadar Integration
> Source: https://kb.binalyze.ai/air/features/integrations/webhooks/ibm-qradar-integration.html
Integration of AIR with IBM QRadar is possible via a feature called "[Custom Actions](https://www.ibm.com/docs/en/qsip/7.4?topic=tasks-adding-custom-actions)".
* When QRadar generates an alert for an incident, it runs a script provided in Custom Actions,
* The properties of the alert alongside some fixed properties are then sent to the trigger URL provided in the bash script,
* Upon receiving the URL request, AIR extracts the IP address or Hostname from the URL and automatically assigns an acquisition task to the endpoint in question. The acquisition profile that will be used for this task is provided when you create a trigger.
### Steps to Integrate
#### Step 1: Create a Script File
Create a script file with the contents below and save it as "_**air-trigger.sh**_"
```
#!/bin/bash
# Define external variables
air_address=$1
trigger_name=$2
trigger_token=$3
endpoint=$4
# Make a GET request to AIR console API
output=$(curl -k http://$air_address/api/webhook/$trigger_name/$endpoint?token=$trigger_token)
# Print out the output
echo $output
```
#### Step 2: Create a Trigger for QRadar
* Visit the Triggers page in AIR
* Click the "+ New Trigger" button on the upper right corner
* Provide a self-explanatory name (examples: RDP Brute Force Trigger, Phishing Detected Trigger, and etc.)
* Select "QRadar Read Endpoint Name or IP Address from URL Path" as the parser for this trigger
* Select an Acquisition Profile that will be used when this trigger is activated by QRadar
* Select the Ignore option or leave it with its default value (defaults to 24 hours for recurrent alerts for a single endpoint)
* Provide other settings such as Compression, Encryption, Evidence Repository to use or let AIR configure them automatically based on the matching policy
* Click the "Save" button
* Hover your mouse over the link below the Trigger name and click to copy
#### Step 3: Create a Custom Action in QRadar
* Go to QRadar Admin > Define Action > Add > Custom Action Define
* In the "Edit Custom Action" dialog, upload the script file created in the step above
* Select "Bash" as the Interpreter value
* In the "Script Parameters" section
* Leave "Parameter Name" empty
* Select the "Fixed Property" radio button and leave the "Value" field empty
* Do \*not\* check the "Encrypt Value" option
* Click the "Add" button and add the parameters listed in the below table
* Click Save
| Name | Type | Value |
| -------------- | ---------------------- | ---------------------- |
| air\_address | Fixed Property | **TYPE-AIR-ADDRESS** |
| trigger\_name | Fixed Property | **TYPE-TRIGGER-NAME** |
| trigger\_token | Fixed Property | **TYPE-TRIGGER-TOKEN** |
| endpoint | Network Event Property | sourceip |
:::caution
Please provide the values in the order they are listed above.
:::
:::note
Fixed Property values can be retrieved from the Trigger URL.
Network Event Property values are provided by QRadar for each alert.
:::
---
# LogicHub SOAR (DEVO) Integration
> Source: https://kb.binalyze.ai/air/features/integrations/webhooks/logichub-soar-devo-integration.html
**Step 1 - Creating A webhook for LogicHub SOAR (DEVO)**
* Visit the **Webhooks** page in AIR,
* Click the "**+ New Webhook**" button in the upper right corner,
* Provide a self-explanatory name,
* Select "**LogicHub SOAR (DEVO) Webhook Parser**" as the parser for this webhook,
* Select an **Acquisition Profile** when the trigger activates this webhook,
* Select the **Ignore** option or leave with its default value (defaults to 24 hours for recurrent alerts for a single endpoint),
* Provide other settings such as **Evidence Repository**, **CPU Limit**, **Compression & Encryption** to use or let AIR configure them automatically based on the matching policy
* Click the "**Save**" button.
**Step 2 - Navigate to DEVO Console**
* To define new alerts, you need to have a role with management permissions on **Alert configuration** and also in **My Alerts** or any of the subcategories (**Administration** → **Roles** → **Permissions**/**Alerts** tabs).
* Alerts are tasks that continually monitor active queries to look for and report on specific events or conditions. Therefore, alerts are created from within the **Data Search** area where queries are made.
* Open the required data table and perform the operations and filters necessary to identify the alert condition. Then, select **New Alert Definition** on the toolbar and fill in the required information as instructed in the section [below](https://docs.devo.com/space/latest/95126538/Creating+new+alerts#New-Alert-Definition-window). Click **Create** to save the alert.
* The new alert is automatically associated with the default sending policy. If you want to choose a different one, go to **Administration → Alert Configuration**. Check the [Manage defined alerts](https://docs.devo.com/space/latest/95127087) article to know how to do it.
* You can also click on the **Configure Alerts** button on the message that appears right after creating the alert. Follow the [instructions](https://docs.devo.com/space/latest/95126538/Creating+new+alerts) to create an alert in the alert window.
**Step 3 - Create** [**HTTP-JSON Delivery Method**](https://docs.devo.com/space/latest/95127355/HTTP-JSON+delivery+methods)
* HTTP-JSON type delivery methods send alerts to any server configured to receive JSON objects.
* Alerts are encapsulated as a JSON object and sent using the POST request method over HTTP or HTTPS. If the destination server uses [Digest access authentication](http://en.wikipedia.org/wiki/Digest_access_authentication), you can identify the user and password required for authentication.
* Fill in the information required on the **New Delivery Method** window for this delivery method (for the creation process, visit [Manage delivery methods](https://docs.devo.com/space/latest/95127270).
**Step 4 - Activate the delivery method**
* The new delivery method is saved in **Pending** status.
* To activate it, you must introduce in Devo the HTTP validation code you will receive through the URL specified. This activation code must be validated on the server before the delivery method can be used.
* Copy the code and then return to Devo's newly created delivery method. Click **pending activation** under the **status** column, paste the validation code into the **Activation Code** window, and click **Apply**.
* Now associate this new delivery method with [sending policies](https://docs.devo.com/space/latest/95127214) to start receiving alerts through this method.
---
# Mattermost Integration
> Source: https://kb.binalyze.ai/air/features/integrations/webhooks/mattermost-integration.html
#### Step 1 - Creating A webhook for Mattermost
* Visit the **Webhooks** page in AIR,
* Click the "**+ New Webhook**" button in the upper right corner,
* Provide a self-explanatory name (examples: RDP Brute Force Trigger, Phishing Detected Trigger, etc.),
* Select "**Mattermost: Generic Mattermost Webhook Parser**" as the parser for this webhook,
* Select an **Acquisition Profile** when **Mattermost** activates this webhook,
* Select the **Ignore** option or leave with its default value (defaults to 24 hours for recurrent alerts for a single endpoint),
* Provide other settings such as **Evidence Repository**, **CPU Limit**, **Compression & Encryption** to use or let AIR configure them automatically based on the matching policy
* Click the "**Save**" button
#### Step 2 - Setting Up Mattermost Server
* Open the dropdown menu on the left pane and click on Integrations.
* Select "Slash Commands" and click on "Add Slash Command" button.
* Fill in the text box accordingly:
* **Title:** AIR Acquisition
* **Description:** You can start an acquisition task in the specified endpoint by using this command.
* **Command Trigger Word:** Type a trigger word that can easily relate to the specified acquisition profile. **For example:** /air-acquisition-full
* **Request URL:** Webhook URL that you obtained from AIR Server.
* **Request Method: POST**
* **Response Username:** AIR
* **Response Icon:** Leave Blank.
* **Autocomplete: Selected**
* **Autocomplete Hint:** \[Endpoint Hostname]
* **Autocomplete Description:** Provide the hostname of the endpoint.
* Click save.
Mattermost will provide a Token to authenticate the slash command in AIR Server. Click done.
#### Step 3- Using integration
Go to a channel and press "/" for available commands.
Type `/air-acquisition-full [ENDPOINT HOSTNAME]`.
For example:
`/air-acquisition-full SampleDummyHostForTest`
---
# Microsoft 365 Defender Integration
> Source: https://kb.binalyze.ai/air/features/integrations/webhooks/microsoft-365-defender-integration.html
**Step 1: Create Webhook for Microsoft 365 Defender**
* Visit the **Webhooks** page in AIR,
* Click the "**+ New Webhook**" button on the upper right corner,
* Provide a self-explanatory name (examples: RDP Brute Force Trigger, Phishing Detected Trigger, etc.),
* Select " **Microsoft 365 Defender** **Webhook Parser**" as the parser for this webhook,
* Select an **Acquisition Profile** when Microsoft 365 activates this webhook,
* Select the **Ignore** option or leave with its default value (defaults to 24 hours for recurrent alerts for a single endpoint),
* Provide other settings such as **Evidence Repository**, **CPU Limit**, **Compression & Encryption** to use or let AIR configure them automatically based on the matching policy
* Click the "**Save**" button.
* Copy the Webhook URL for Step 2.
**Step 2: Setting up Power Automate**
* Log in to [Power Automate](https://make.powerautomate.com/).
* Go to My Flows on the left-hand pane.
* Click New Flow and Automated Cloud Flow
* Give an explanatory **Flow Name,** select Microsoft Defender ATP as the flow’s trigger and create it.
* Set up your alert conditions according to [Microsoft Documentation](https://learn.microsoft.com/en-us/microsoft-365/security/defender-endpoint/api-microsoft-flow?view=o365-worldwide).
* Go to Actions and find HTTP Webhook.
* Use the copied Webhook URL created in the first step as an HTTP Post URL,
* Add `Content-Type: application/json` header,
* Click Add dynamic content, and use the dynamic content from your trigger in your response’s post body “MachineName”.
`{"result":{"host": "MachineName"}}`
---
# Microsoft Sentinel Integration
> Source: https://kb.binalyze.ai/air/features/integrations/webhooks/microsoft-sentinel-integration.html
#### Step 1 - Creating A webhook for Microsoft Sentinel
* Visit the **Webhooks** page in AIR,
* Click the "**+ New Webhook**" button in the upper right corner,
* Provide a self-explanatory name,
* Select "**Microsoft Sentinel: Generic Sentinel Webhook Parser**" as the parser for this webhook,
* Select an **Acquisition Profile** when the trigger activates this webhook,
* Select the **Ignore** option or leave with its default value (defaults to 24 hours for recurrent alerts for a single endpoint),
* Provide other settings such as **Evidence Repository**, **CPU Limit**, **Compression & Encryption** to use or let AIR configure them automatically based on the matching policy
* Click the "**Save**" button
**Step 2:**
* Sign in to the [Azure portal](https://portal.azure.com/). Open your related logic app in Logic App Designer.
* Under the designer's search box, select **Built-in**. In the search box, enter `http web hook` as a filter. From the **Triggers** list, select the **HTTP** W**ebhook**.
* Fill in the box accordingly:
* Subscribe Method: **POST**
* Subscribe URI: **Webhook URL**
* Subscribe body: **Extended properties.**
For more information, please refer to [**Microsoft Documentation**](https://learn.microsoft.com/en-us/azure/connectors/connectors-native-http)**.**
---
# Rapid7 InsightIDR Integration
> Source: https://kb.binalyze.ai/air/features/integrations/webhooks/rapid7-insightidr-integration.html
**Step 1 - Creating A webhook for Rapid7 InsightIDR**
* Visit the **Webhooks** page in AIR,
* Click the "**+ New Webhook**" button in the upper right corner,
* Provide a self-explanatory name,
* Select "**Rapid7 InsightIDR** **Webhook Parser**" as the parser for this webhook,
* Select an **Acquisition Profile** when the trigger activates this webhook,
* Select the **Ignore** option or leave with its default value (defaults to 24 hours for recurrent alerts for a single endpoint),
* Provide other settings such as **Evidence Repository**, **CPU Limit**, **Compression & Encryption** to use or let AIR configure them automatically based on the matching policy
* Click the "**Save**" button.
**Step 2: Create Triggers for InsightIDR**
* From the left menu, go to **Data Collection** and click **Data Exporters**.
* Click **Add Data Exporter**.
* Select Universal Webhook as the **Data Exporter Type**.
* Choose your collector. You can also name your data exporter if you want. Provide the URL that you previously configured.
* Add `Content-Type: application/json` for your webhook HTTP POST request.
* Select the **Alerts** checkbox to export asset-specific alerts from InsightIDR.
* Optionally, trust all certificates or self-signed certificates by selecting the **Certificate Settings** checkboxes.
* Click **Save**
Please refer to [Rapid7 documentation](https://docs.rapid7.com/insightidr/webhook/) for more information.
---
# SentinelOne Integration
> Source: https://kb.binalyze.ai/air/features/integrations/webhooks/sentinelone-integration.html
**Step 1 - Create Webhook for SentinelOne**
* Visit the **Webhooks** page in AIR,
* Click the "**+ New Webhook**" button in the upper right corner,
* Provide a self-explanatory name (examples: RDP Brute Force Trigger, Phishing Detected Trigger, etc.),
* Select "**Sentinel One Webhook Parser**" as the parser for this webhook,
* Select an **Acquisition Profile** when SentinelOne activates this webhook,
* Select the **Ignore** option or leave with its default value (defaults to 24 hours for recurrent alerts for a single endpoint),
* Provide other settings such as **Evidence Repository**, **CPU Limit**, **Compression & Encryption** to use or let AIR configure them automatically based on the matching policy
* Click the "**Save**" button.
* Copy the Webhook URL for Step 2.
**Step 2 - Setting up SentinelOne**
* Find **Singularity XDR Webhook** in the marketplace and click **Configure**
* Click and expand the dropdown menu:
* Select the box under **Response Actions**: **Make "Hooks" available as "Manual Response Actions" from Threats**
* Give an explanatory **Threat Response Action Name**
* Select a relevant **"Options for triggering"**
* Paste the webhook created in Step 1 to the **URL field**
* Select POST in **Action**
* Choose **Full Threat Details** in **Webhook Request Body**
* Insert the following header into the **Headers**
```
{"Content-Type": "application/json"}
```
* Select **Always send body**
* Click **Next**
* Select your organization and site in the **Access Level**
* Click **Install**.
---
# ServiceNow Integration
> Source: https://kb.binalyze.ai/air/features/integrations/webhooks/servicenow-integration.html
### Steps to Integrate
#### **Step 1: Create a Trigger for ServiceNow**
* Visit the **Webhooks** page in AIR,
* Click the "**+ New Webhook**" button in the upper right corner,
* Provide a self-explanatory name (examples: RDP Brute Force Trigger, Phishing Detected Trigger, etc.),
* Select "**ServiceNow: Generic ServiceNOW Webhook Parser**" as the parser for this webhook,
* Select an **Acquisition Profile** when ServiceNow activates this webhook,
* Select the **Ignore** option or leave with its default value (defaults to 24 hours for recurrent alerts for a single endpoint),
* Provide other settings such as **Evidence Repository**, **CPU Limit**, **Compression & Encryption** to use or let AIR configure them automatically based on the matching policy,
* Click the "**Save**" button,
* Hover your mouse over the link below the Webhook name and double-click to copy.
#### **Step 2: Creating the Integration Settings in ServiceNow**
* Open the Business Rules under the System Definitions and click **New**,
* Give your new Business Rule a descriptive name, choose the table you want it to trigger on, and check the **Advanced** box.
* Under the option: **When**, choose **after.** You can use various conditions and filtering functions accordingly.
* Click the **Advanced** Tab and paste the following script. **Change the 5th line** \ with the webhook link you copied in **Step 1**.
* ```javascript
(function executeRule(current, previous /*null when async*/) {
try {
var r = new sn_ws.RESTMessageV2();
// paste related webhook url below
var airwebhookurl = "";
//defining the hostname of endpoint or ip
var endpointIP = current.getValue("hostname");
r.setRequestHeader("Content-Type","application/json");
r.setHttpMethod("post");
r.setStringParameter("baseUrl",airwebhookurl);
var obj = {
"endpoint": endpointIP
};
var body = JSON.stringify(obj);
r.setRequestBody(body);
var response = r.execute();
var httpStatus = response.getStatusCode();
if(httpStatus==200) {
gs.info("Webhook target HTTP status response: " + httpStatus);
return httpStatus;
} else {
gs.log(response.getErrorCode()+"---"+response.getErrorMessage());
return httpStatus;
}
} catch (ex) {
var message = ex.message;
gs.error("Error message: " + message);
}
gs.info("Webhook target HTTP status response: " + httpStatus);
})(current, previous);
```
* Click **Submit** on the top right.
#### **Step 3: Testing the business rule.**
Once you have set up the webhook, you can test the business rule based on the triggering conditions. Check the response body for the data being sent from ServiceNow.
---
# Slack Integration
> Source: https://kb.binalyze.ai/air/features/integrations/webhooks/slack-integration.html
### **Step 1 - Create Triggers for Slack**
* Visit the **Webhooks** page in AIR,
* Click the "**+ New Webhook**" button on the upper right corner,
* Provide a self-explanatory name (examples: RDP Brute Force Trigger, Phishing Detected Trigger, etc.),
* Select "**Slack: Generic Slack Webhook Parser**" as the parser for this webhook,
* Select an **Acquisition Profile** when **Slack** activates this webhook,
* Select the **Ignore** option or leave with its default value (defaults to 24 hours for recurrent alerts for a single endpoint),
* Provide other settings such as **Evidence Repository**, **CPU Limit**, **Compression & Encryption** to use or let AIR configure them automatically based on the matching policy
* Click the "**Save**" button,
* Hover your mouse over the link below the Webhook name and double-click to copy.
### Step 2 - Create A Slack app
You need to [create a new Slack app](https://api.slack.com/apps?new_app=1\&ref=bolt_start_hub).
Click **From scratch**, type App Name: **AIR,** pick a workspace to develop your app in and click **Create App** (no matter what workspace you select, you'll still be able to [distribute your app](https://api.slack.com/start/distributing/public) to the other workspaces if you choose).
#### Scopes
Scopes give your app permission to do things (for example, post messages) in your development workspace. Make sure that AIR is chosen on the top of the sidebar and then you can select the scopes to add to your app by navigating over to the **OAuth & Permissions** sidebar.
Scroll down to the **Bot Token Scopes** section and click **Add an OAuth Scope**. You should add:
`chat:write` and `commands` .
#### Installing your app
Install your own app by selecting the **Install to Workspace** button on the OAuth & Permissions page.
After **allowing the AIR,** you'll be sent through the Slack OAuth UI.
### Step 3 - Create A Slash Command
* In **app's management dashboard,** click the **Slash Commands** feature in the menu.
* Click on the **Create New Command**.
* Fill in the blanks as shown below.
* **Command:** /air-acquisition-ACQUISITION-PROFILE
* **Request URL:** The webhook URL that you create in the AIR Server.
* **Short Description:** Trigger full acquisition
* **Usage Hint:** endpoint
* Save and exit.
### Step 4 - Using A Slash Command
* Add the application to the relevant channel.
* Invoke a command with:
`/air-acquisition-compromise-assessment WINXXXX`
---
# Splunk Integration
> Source: https://kb.binalyze.ai/air/features/integrations/webhooks/splunk.html
Integration of AIR with Splunk is possible via a feature called "[Post Actions](https://docs.splunk.com/Documentation/Splunk/8.1.3/Knowledge/SetupaPOSTworkflowaction)".
* When Splunk generates an alert for an incident, it sends a JSON payload to the URL provided in Workflow Actions.
* The payload that is POSTed contains essential information about the alert, such as the Host Name, IP Address, and other alert-specific details.
* Upon receiving this JSON data, AIR parses the payload and extracts the IP address or Hostname from it, and automatically assigns an acquisition task to the endpoint in question. The acquisition profile that will be used for this task is provided when you create a trigger.
## Steps to Integrate
* Visit the Triggers page in AIR
* Click the "+ New Trigger" button in the upper right corner
* Provide a self-explanatory name (examples: RDP Brute Force Trigger, Phishing Detected Trigger, etc)
* Select "Splunk: Generic Splunk Webhook Parser" as the parser for this trigger.
* Select an Acquisition Profile that will be used when Splunk activates this trigger
* Select the Ignore option or leave with its default value (defaults to 24 hours for recurrent alerts for a single endpoint)
* Provide additional settings, such as Compression, Encryption, and Evidence Repository, to use or let the AIR configure them automatically based on the matching policy.
* Click the "Save" button.
* Hover your mouse over the link below the Trigger name and click to copy (see below)
* Head over to Splunk and create a [POST Workflow Action](https://docs.splunk.com/Documentation/Splunk/8.1.3/Knowledge/SetupaPOSTworkflowaction) for your workflow
* Provide the Trigger URL you have copied above as the **`URI`** to the newly created Workflow Action,
* Make sure you have provided the Host Name or IP Address in **`Post Arguments`**
* At this point, whenever Splunk generates an alert for an endpoint, the information will be sent to AIR for it to assign an acquisition task to the endpoint in question automatically.
---
# Stellar XDR Integration
> Source: https://kb.binalyze.ai/air/features/integrations/webhooks/stellar-xdr-integration.html
**Step 1 - Create Webhook for Stellar XDR**
* Visit the **Webhooks** page in AIR,
* Click the "**+ New Webhook**" button on the upper right corner,
* Provide a self-explanatory name (examples: RDP Brute Force Trigger, Phishing Detected Trigger, etc.),
* Select "**Stellar XDR: Stellar XDR Webhook Parser**" as the parser for this webhook,
* Select an **Acquisition Profile** when InsightIDR activates this webhook,
* Select the **Ignore** option or leave with its default value (defaults to 24 hours for recurrent alerts for a single endpoint),
* Provide other settings such as **Evidence Repository**, **CPU Limit**, **Compression & Encryption** to use or let AIR configure them automatically based on the matching policy
* Click the "**Save**" button.
* Copy the Webhook URL for Step 2.
**Step 2 - Setting up Stellar XDR**
Log in to Stellar Cyber.
* Click **System | Administration** | **Saved Scripts**. The **Script Template** page appears.
* Click **Create** to add a new script. The **Add Script Template** screen appears.
* Enter the **Name**. Each script must have a unique name. This field does not support multibyte characters. You cannot edit the name after you submit it.
* Choose a **Tenant Name**.
* In the **Script Body**, call the script you created earlier. Change the AIR-WEBHOOK-URL with the one that you create in Step 1.
`curl AIR-WEBHOOK-URL --header 'Content-Type: application/json' --data-raw {"result":{"host":{{_source.srcip}}"}}`
---
# Sumo Logic Integration
> Source: https://kb.binalyze.ai/air/features/integrations/webhooks/sumo-logic-integration.html
### Steps to Integrate
#### **Step 1: Create a Webhook**
* Visit the **Webhooks** page in AIR,
* Click the "**+ New Webhook**" button on the upper right corner,
* Provide a self-explanatory name (examples: RDP Brute Force Trigger, Phishing Detected Trigger, etc.),
* Select "**Sumo Logic: Generic Sumo Logic Webhook Parser**" as the parser for this webhook,
* Select an **Acquisition Profile**,
* Provide other settings such as **Evidence Repository**, **CPU Limit**, **Compression & Encryption** to use or let AIR configure them automatically based on the matching policy
* Click the "**Save**" button,
* Hover your mouse over the link below the Webhook name and double-click to copy
#### **Step 2: Configure Sumo Logic SIEM**
On the left pane, click "**Manage Data**" then "**Monitoring**", and alter "**Connections**".
* Give a name to webhook,
* Write a description (optional),
* Paste Webhook URL, you copied in Step 1,
* Type your payload\*: \["\{{ResultsJson.client\_ip\}}"]
* Save and exit.
For more information, please visit [here](https://help.sumologic.com/docs/alerts/webhook-connections/set-up-webhook-connections/#Webhook_payload_variables).
---
# Wazuh Integration
> Source: https://kb.binalyze.ai/air/features/integrations/webhooks/wazuh-integration.html
Integration of AIR with Wazuh is possible through the "Integrations" feature.
When Wazuh's configuration file contains the integration setting with the specified Rule ID, it executes a defined script. The defined Python script sends the relevant information with a POST request to the AIR.
### Steps to Integrate
#### **Step 1: Create a Trigger for Wazuh**
- Visit the **Webhooks** page in AIR.
- Click the "**+ New Webhook**" button in the upper right corner,
- Provide a self-explanatory name (examples: RDP Brute Force Trigger, Phishing Detected Trigger, etc.),
- Select "**Wazuh: Wazuh AIR Integration**" as the parser for this webhook.
- Select an **Acquisition Profile** when Wazuh activates this webhook.
- Select the **Ignore** option or leave with its default value (defaults to 24 hours for recurrent alerts for a single asset).
- Provide other settings, such as Evidence Repository, CPU Limit, Compression, and Encryption, to use or let AIR configure them automatically based on the matching policy.
- Click the "**Save**" button,
- Hover your mouse over the link below the Webhook name and double-click to copy (see below),
#### **Step 2: Add the Integration Settings in Wazuh**
Open the ossec.conf file with a preferred text editor and add the following line to the end of the file before closing the ossec_config. The name must be precisely custom-air. For detailed information, please see the [Wazuh Documentation](https://documentation.wazuh.com/current/user-manual/reference/ossec-conf/integration.html).
```
///redacted///
…
custom-airThe Webhook URL copied in Step 1The Rule ID you want to trigger AIRjson
```
#### **Step 3: Creating the scripts in Wazuh**
- Every time the relevant rule_id is triggered, a bash script named custom-air is executed. Create a file named **custom-air** in **/var/ossec/integrations/** paste the following script. For detailed information, please refer to the [Wazuh Documentation](https://wazuh.com/blog/how-to-integrate-external-software-using-integrator/).
```
#!/bin/sh
WPYTHON_BIN="framework/python/bin/python3"
SCRIPT_PATH_NAME="$0"
DIR_NAME="$(cd $(dirname ${SCRIPT_PATH_NAME}); pwd -P)"
SCRIPT_NAME="$(basename ${SCRIPT_PATH_NAME})"
case ${DIR_NAME} in
*/active-response/bin | */wodles*)
if [ -z "${WAZUH_PATH}" ]; then
WAZUH_PATH="$(cd ${DIR_NAME}/../..; pwd)"
fi
PYTHON_SCRIPT="${DIR_NAME}/${SCRIPT_NAME}.py"
;;
*/bin)
if [ -z "${WAZUH_PATH}" ]; then
WAZUH_PATH="$(cd ${DIR_NAME}/..; pwd)"
fi
PYTHON_SCRIPT="${WAZUH_PATH}/framework/scripts/${SCRIPT_NAME}.py"
;;
*/integrations)
if [ -z "${WAZUH_PATH}" ]; then
WAZUH_PATH="$(cd ${DIR_NAME}/..; pwd)"
fi
PYTHON_SCRIPT="${DIR_NAME}/${SCRIPT_NAME}.py"
;;
esac
${WAZUH_PATH}/${WPYTHON_BIN} ${PYTHON_SCRIPT} "$@"
```
- Create a python script named **custom-air.py /var/ossec/integrations/** and paste the following script. The script runs another python script and makes a request to the air server.
```
#!/usr/bin/env python
import json
import sys
import time
import os
try:
import requests
from requests.auth import HTTPBasicAuth
except Exception as e:
print("No module 'requests' found. Install: pip3 install requests")
sys.exit(1)
# ossec.conf configuration:
#
# custom-air
# Wazuh WebHook URL
# XXXXXX
# json
#
debug_enabled = False
pwd = os.path.dirname(os.path.dirname(os.path.realpath(__file__)))
json_alert = {}
now = time.strftime("%a %b %d %H:%M:%S %Z %Y")
# Set paths
log_file = '{0}/logs/integrations.log'.format(pwd)
def main(args):
debug("# Starting")
# Read args
alert_file_location = args[1]
webhook = args[3]
debug("# Webhook")
debug(webhook)
debug("# File location")
debug(alert_file_location)
# Load alert. Parse JSON object.
with open(alert_file_location) as alert_file:
json_alert = json.load(alert_file)
debug("# Processing alert")
debug(json_alert)
debug("# Generating message")
msg = generate_msg(json_alert)
debug(msg)
debug("# Sending message")
send_msg(msg, webhook)
def debug(msg):
if debug_enabled:
msg = "{0}: {1}\n".format(now, msg)
print(msg)
f = open(log_file, "a")
f.write(msg)
f.close()
def generate_msg(alert):
level = alert['rule']['level']
msg = {}
msg['pretext'] = "WAZUH AIR integration"
msg['Name'] = alert['agent']['name']
msg['IP'] = alert['agent']['ip']
msg['Title'] = alert['rule']['description'] if 'description' in alert['rule'] else "N/A"
msg['Rule ID'] = alert['rule']['id']
msg['ts'] = alert['id']
attach = {'attachments': [msg]}
return json.dumps(attach)
def send_msg(msg, url):
headers = {'User-Agent': 'AIR Script', 'Content-type': 'application/json', 'Accept-Charset': 'UTF-8'}
res = requests.post(url, data=msg, headers=headers)
debug(res)
if __name__ == "__main__":
try:
# Read arguments
bad_arguments = False
if len(sys.argv) >= 4:
msg = '{0} {1} {2} {3} {4}'.format(
now,
sys.argv[1],
sys.argv[2],
sys.argv[3],
sys.argv[4] if len(sys.argv) > 4 else '',
)
debug_enabled = (len(sys.argv) > 4 and sys.argv[4] == 'debug')
else:
msg = '{0} Wrong arguments'.format(now)
bad_arguments = True
# Logging the call
f = open(log_file, 'a')
f.write(msg + '\n')
f.close()
if bad_arguments:
debug("# Exiting: Bad arguments.")
sys.exit(1)
# Main function
main(sys.argv)
except Exception as e:
debug(str(e))
raise
```
- The scripts must be placed in **/var/ossec/integrations**, have the same name as indicated in the configuration block, contain execution permissions, and belong to the root user of the ossec group. **Execute** the following two commands:
```
#chmod 750 /var/ossec/integrations/custom-air
#chown root:ossec /var/ossec/integrations/custom-air
#chmod 750 /var/ossec/integrations/custom-air.py
#chown root:ossec /var/ossec/integrations/custom-air.py
```
---
# interACT
> Source: https://kb.binalyze.ai/air/features/interact/index.html
---
# interACT Commands
> Source: https://kb.binalyze.ai/air/features/interact/interact-commands.html
**interACT** has been built specifically for DFIR capability in $ Product. The full list of current commands can be listed by typing ‘help’ at the command prompt, and is below the following important 'hint':
:::note
The interACT command-line parser utilizes Unix-like command-line parsing methods due to the libraries used and the absence of Windows-specific libraries. Because of that, **a Windows user will have to write a del command like this**:
* del C:/xyz/abc.txt # use forward slashes
* del 'C:\xyz\abc.txt' # within single quotes
The following is currently invalid and likely to remain so in the future due to Windows' non-standard approach to command-line parsing and character escaping.
* del C:\xyz\abc.txt # Invalid
* del "C:\xyz\abc.txt" # Invalid
:::
**cat**: To display the content of a file.
**cd**: To change the current working directory.
**curl**: To make HTTP requests.
**del**, delete, or **rm**: For deleting a file or folder.
**dir or ls**: Will list the files and folders in a chosen directory.
**exec** or **execute**: The exec or execute action allows you to execute a process on the asset without a shell and capture its output via stdout and stderr.
**find**: Will search for a file or directory.
**get**: To pull a file from the asset down to the console
**hash**: Will display the hash value of a file.
**head**: To get the first 10 lines of a file displayed.
**help**: Will display any help messages and switches that you can apply to commands available to you at your current position.
**hex**: Will display the hex-encoded output of the first 100 bytes of a file.
**image**: To read a disk or volume and write its contents out as a .dd file. This can also be done from the UI, but remains here in interACT for those who prefer to image from the command line.
**kill**: Is the command to terminate a process.
**mkdir**: Will make or create a directory
**osquery**: Gives the user access to osquery queries within the interACT session
**pslist**: Will display the running process list.
**put**: Allows the user to push a file from the library to the asset.
:::tip
**File Upload Size Limit**
When using the **put** command to upload files to an asset via interACT, please note that the maximum file size supported is **500 MB** per file.
:::
**pwd**: Displays the present working directory.
**volumes**: Will list the mounted volumes.
**yara**: Scan files or processes with YARA rules.
**zip**: This command compresses or decompresses a file or folder.
## Flags
From AIR v4.5, users can speed up workflows by using the following flags for files they want to download using the ‘get’ command in interACT:
* Compression: ‘-zip’
* Password protection: ‘-zip-password’
* File name change: ‘-name’
:::danger
**BEWARE!**
Using `zip -p` on machines monitored by EDR can trigger alerts due to its association with suspicious activities like encryption or data exfiltration.
EDRs often flag or **block such commands**, log passwords exposed in plaintext, and create compliance challenges.
AIR’s InterACT offers a secure alternative for file handling and remote actions, eliminating the need for these risky commands. To ensure smooth operations, AIR users should work with their security teams to get AIR executables whitelisted in their EDR. This prevents unnecessary alerts and guarantees uninterrupted, secure workflows during investigations.
:::
---
# interACT Command Snippets
> Source: https://kb.binalyze.ai/air/features/interact/interact-command-snippets.html
### Overview
The **Command Snippets Library** in interACT introduces a major
usability boost for remote command execution in AIR. It allows analysts
to **standardize, share, and quickly execute common commands** without
retyping or hunting through notes.
Snippets can be acessed directly in the interACT terminal window from where they can be copied, pasted or run directly in the current session.
This reduces repetitive typing, accelerates response times, and ensures
consistency across teams.
------------------------------------------------------------------------
### How It Works
- **Predefined Snippets**: A library of common investigation and
response commands is provided out-of-the-box. These can be run
directly or copy/pasted into a session.
- **Custom Snippets**: Analysts can create their own commands, define
supported platforms (Windows, Linux, macOS), and save them to the Library for reuse and sharing. These snippets can be global or organization-specific. (With the release of AIR v5.7 the character limit increases from 2000 to 5000.)
- **Library Management**:
- Edit, delete (for custom snippets), or import/export via
text files.
- Categorization by description, advanced filtering and ownership tracking are supported.
- Predefined snippets cannot currently be deleted.
- Users can apply Tags to Command Snippets to streamline management and filtering. You can view and modify all Tags using the Manage Tags button in the Command Snippets library.
------------------------------------------------------------------------
### Benefits
- **Speed**: Eliminate repetitive typing and have long, complex, frequently used commands instantly available.
- **Consistency**: Standardize investigative workflows across your
team.
- **Scalability**: Quickly search, and filter hundreds of
snippets during critical investigations.
- **Flexibility**: Maintain an evolving library of commands tailored
to your environment.
------------------------------------------------------------------------
### System-Generated Command Snippets
To get users started we have supplied some predefined **System-generated snippets** that are available by default in every environment. These are designed to cover common investigative and forensic tasks without requiring manual setup.
**List of System Snippets:**
- List mounted volumes with `volumes`
- Preview file beginning with `head`
- Verify file integrity with `hash`
- Inspect running processes with `pslist`
- Compress or extract archives with `zip`
- Query system state with `osquery`
- Pull evidence to console with `get`
- Display directory contents ``
---
# PowerShell commands in interACT
> Source: https://kb.binalyze.ai/air/features/interact/powershell-commands-in-interact.html
**Introduction**
In Digital Forensics and Incident Response (DFIR), **PowerShell** has become a powerful tool for investigators and analysts. Sometimes overlooked is its compatibility with AIR's interACT, which provides a true cross-platform remote shell for Windows, Linux, and macOS. This KB article aims to shed light on how users can leverage PowerShell within interACT to execute cmdlets and perform a variety of operations.
**Why is this Important?**
Many DFIR investigators rely on PowerShell (and Python) as their primary scripting and remediation tools. However, newcomers to AIR may assume that interACT is exclusively tailored for Linux, which is not the case. interACT is a versatile platform, and specific commands are available to users of both Windows and UNIX-like operating systems.
**Executing PowerShell in interACT**
PowerShell can be executed in interACT through several methods. Here, we'll explore three basic ways to run PowerShell commands:
**Using the 'exec' Command**
The 'exec' or 'execute' command in interACT serves as a gateway to run PowerShell commands. This versatile command enables DFIR practitioners to integrate PowerShell into their workflows seamlessly. Below are examples of how to use 'exec' with PowerShell:
```bash
exec powershell.exe whoami
```
This command executes a simple PowerShell 'whoami' cmdlet, displaying the currently logged-in user.
```bash
exec powershell.exe Get-ScheduledTask
```
In this instance, 'exec' invokes the 'Get-ScheduledTask' cmdlet, providing insights into scheduled tasks on the system.
```bash
exec powershell.exe Remove-Item -path C:\\Temp\\example.txt
```
The 'exec' command facilitates the removal of a file ('example.txt') using the 'Remove-Item' cmdlet from a specified path.
:::danger
When running exec commands in InterACT, please note that commands requiring additional user input (e.g., Get-CimInstance prompting for a ClassName) may not display the prompt dynamically during execution. Instead, InterACT will continue running and appear to "hang" until the process times out or completes.
To avoid this, we recommend:
1. **Modify the Command:** Specify all required parameters directly in the command to prevent prompts. For example:\
\&#xNAN;**`exec powershell.exe Get-CimInstance -Namespace 'root\SecurityCenter2' -ClassName "YourClassName"`**
2. **Test Commands Locally First:** Run the command in a native PowerShell console to ensure all required inputs are included before executing it in InterACT.
We are aware of this behavior and are continuously working to improve user experience.
:::
## Understanding the `-NonInteractive` PowerShell Flag in interACT
When using **PowerShell** commands in scripts or automated workflows, you may encounter scenarios where PowerShell expects user input. This can disrupt execution, especially in non-interactive environments such as **AIR's interACT** automation. To address this, PowerShell offers the `-NonInteractive` flag.
**What is `-NonInteractive`?**
The `-NonInteractive` flag is a command-line option for `powershell.exe` that instructs PowerShell to operate in non-interactive mode. When this mode is enabled, PowerShell does **not** prompt for user input and will terminate the script or command if user input is required.
This feature is particularly useful when running commands in environments where no user interaction is possible or desirable, such as during forensic investigations or automation tasks initiated via interACT.
**Example Use Case in interACT**
Here’s an example of how the `-NonInteractive` flag can be applied within **interACT**:
`powershell.exe -NonInteractive Get-CimInstance -Namespace 'root\SecurityCenter2'`
**Explanation:**
* `powershell.exe`: The executable for running PowerShell commands.
* `-NonInteractive`: Ensures the command runs without expecting user interaction.
* `Get-CimInstance -Namespace 'root\SecurityCenter2'`: Retrieves information from the specified namespace.
This command is designed to collect system security information without risking a prompt for user input that could interrupt execution.
**Using the** `-NonInteractive` **flag in AIR's interACT provides the following advantages:**
* **Seamless Automation**: Prevents disruptions in workflows caused by unexpected prompts.
* **Increased Reliability**: Ensures consistent execution of PowerShell commands, even in headless or remote environments.
* **Enhanced Efficiency**: Minimizes delays during investigative or forensic operations.
**Troubleshooting Tips**
If a command using `-NonInteractive` fails:
1. Check the command syntax for errors.
2. Ensure the command does not inherently require user input.
3. Review interACT logs for additional context on the failure.
For more details, refer to the official PowerShell documentation on `about_PowerShell_exe`.
## **Additional Useful PowerShell Commands and Syntax**
**1).** Here are some additional PowerShell commands that can be invaluable in cyber investigations:
```bash
exec powershell.exe Get-Process
```
This command retrieves information about running processes, which is crucial for understanding system activity.
**2)**. You can query specific log entries within a shorter time frame. Here's an example to retrieve Security log events from the last 24 hours:
```bash
exec powershell.exe Get-WinEvent -LogName Security -MaxEvents 100 -Oldest
```
In this command:
* `-MaxEvents 100` limits the query to the most recent 100 events, which should make the query faster.
* `-Oldest` ensures that the query starts with the oldest event, which is from the last 24 hours in this case.
You can adjust the `-MaxEvents` value to retrieve a specific number of events or omit it to get all events from the last 24 hours. This command should provide a quicker response with a smaller dataset.
**3).** Here's an example of a simple PowerShell command that retrieves information about the local computer's operating system:
```bash
exec powershell.exe Get-CimInstance -ClassName Win32_OperatingSystem
```
This command uses the "Get-CimInstance" cmdlet to retrieve information about the local computer's operating system. It should execute quickly and provide details about the operating system on the machine where it's run along with other information such as Build Number, Registered User, Serial Number, and Version.
## **Conclusion**
By following these simple examples, users can harness the capabilities of PowerShell within interACT for DFIR investigations and operations. interACT's compatibility across different platforms ensures that investigators can seamlessly incorporate PowerShell into their toolkit, expanding their capabilities and efficiency in digital forensics and incident response.
---
# Investigation Hub
> Source: https://kb.binalyze.ai/air/features/investigation-hub/index.html
* [What is the AIR Investigation Hub?](./#what-is-the-consolidated-report)
* [The benefits of ](./#the-benefits-of-the-consolidated-report)[AIR Investigation Hub](./#what-is-the-consolidated-report)
* [Do I have to install or update my existing infrastructure?](./#do-i-have-to-install-and-update-the-existing-infrastructure)
* [Where to find the Investigation Hub](./#where-to-find-the-investigation-hub)
* [Managing Case Access](./#managing-case-access)
Investigation Hub: The Dashboard
## What is the AIR Investigation Hub?
AIR automates the rapid generation and presentation of a clear **DFIR intelligence report** directly within the Investigation Hub. This report instantly highlights DRONE's findings and consolidates all Acquisition and Hunt/Triage data from multiple assets into a single view known as the **Investigation Hub**.
This central dashboard immediately **elevates your investigation**, providing analysts with a seamless experience that allows them to sort, exclude findings, filter, flag, bookmark, and easily investigate the data. The user-friendly interface streamlines the analysis process, empowering analysts to efficiently navigate and interpret the information to uncover **insights and actionable intelligence.**
The **Investigation Hub** offers a unified and well-organized view of assets, evidence, artifacts, and triage results within a case. This allows you to efficiently review and concentrate your investigation on pertinent details using filters and a powerful global search function, eliminating the need to switch between screens to piece data together manually.
The Intelligence Hub delivers Findings derived from AIR's automated **DRONE analyzers**, giving you a head start in any investigations.
With DRONE's proprietary analyzers, combined with YARA, Sigma, and osquery scanning, you can analyze assets and evidence at speed, identifying compromised machines to streamline the process of sifting through often massive datasets.
The integrated **MITRE ATT\&CK** mapping provides context to discern the nature of threats, stay ahead of the attack's progression, and pinpoint areas needing further investigation.
## The benefits of the Investigation Hub
1. **All in one place** - all AIR data acquisitions, results of DRONE analysis, and Hunt/Triage scans of the assets related to a chosen case - are now available in one place, making the analysts and investigators work much faster and simpler.
2. **Efficiency and Speed** - analysts can **easily navigate to a specific asset in the Case while simultaneously leveraging information from all** their assets in **a high-level overview of the entire Case**. Therefore, much faster decisions can be made, such as where to start and focus investigations, but also where to divert resources when the Investigation Hub highlights new information.
3. All **multi-asset investigations** become far more efficient within the **Investigation Hub,** especially as we now allow users to **'Bring Your Own Evidence' (BYOE):**
* Seamlessly import .csv files into the Investigation Hub using our data mapping service, accommodating all forms of structured .csv data.
* Efficiently import and analyze .pst files, enabling the display of email data within the Investigation Hub for a more comprehensive examination.
4. The DRONE findings table can be exported from the Investigation Hub into a .csv file, enabling the integration of DRONE's analysis results into reports, SIEM, or other security tools for the development of custom alerts.
## Do I have to install or update my existing Infrastructure?
The Investigation Hub is included as part of the standard AIR installation.
All of our hardware and software requirements are described here in the [Setup section of the KB](../../setup/), no additional infrastructure updates are required.
## Where to find the Investigation Hub
The **Investigation Hub** operates at the case level and is generated from the data collected for individual cases. To access it, navigate to 'Cases' in the Main menu. Once you've selected the case of interest, you can access the Investigation Hub via the action button located in the main viewing area:
Investigation Hub: Access is via Cases
## Managing Case Access
When creating a new case, users can set the visibility to either **Public to Organization** (all users have access) or **Private** (restricted to specific users). This initial setting determines who can view and work on the case.
To manage case access after creation:
1. Navigate to **Cases** from the Main Menu.
2. Select a case to open the **Case Details** panel.
3. In the **Overview** tab, scroll to the **Users** section.
4. Click **"+ Add Members"** (or the assigned user count) to open the Assign Users modal.
Case Details: Assign Users modal with search functionality
The modal reflects the case's current visibility settings:
* **Private cases** display only the users who have been specifically assigned access.
* **Public cases** show all users within the organization as having access.
From this modal, you can:
* **Search for users** using the search bar to quickly find team members in large organizations.
* **Assign users** by clicking **"+ Assign"** next to their name to grant access.
* **Unassign users** by clicking to remove their access from the case.
This allows investigation managers to adjust case visibility at any time, adding or removing team members as the investigation evolves.
## Collaboration
AIR is a highly collaborative platform that allows multiple users to access the system simultaneously. Each user's privileges can be finely adjusted based on roles assigned by the system's owner or administrator. As the fastest and most comprehensive DFIR platform globally, AIR's efficiency is further enhanced through team collaboration.
### Real Time User Presence
Analysts can see real-time user presence, comment updates, and evidence flag changes as they occur. These live updates let multiple investigators work on the same evidence simultaneously, with all actions—notes, findings, and flag changes—appearing instantly for every connected user.
Investigation Hub: Real time user presence in the Investigation Hub
In the Investigation Hub screenshot above, three users are active in this case. Their profile icons show not only who is present but also where each person is working in real time. One user is viewing the Findings page, another is in System Info, and a third is examining the Amcache File evidence. This gives immediate visibility into team activity and helps prevent duplicated effort during collaborative investigations.
### The Activity Feed
* The Activity Feed enhances team collaboration and transparency by logging actions taken by investigators. This includes creating exclusions, findings, flags, comments, and notes. Each entry includes user identification and timestamp information to ensure a comprehensive audit trail.
Investigation Hub: Activities Action Button
* All activities are labeled and linked to their corresponding individual activity by simply clicking on them. In the example below, we can see how Comment Added, Note Added, Flag Added, and Exclusion Rule Created have all been tracked as activities.
Investigation Hub: Activities
### Adding Comments to the Evidence
Comments enhance communication by allowing analysts to directly comment on findings and tag relevant colleagues. This ensures that all discussions are captured and documented within the activity feed, promoting effective collaboration and activity tracking.
Right-click on an item and select ‘Comment’ to attach your comment to that item:
Investigation Hub: Comments
You can tag users in a comment, and they can view the item by clicking on the comment in their Activity Feeds:
Investigation Hub: Tag users
Each table will show all of the Activities, Comments, and Flags that are relevant just to that table
Investigation Hub: Activities Comments and Flags
---
# Investigation Hub – Data Usage Statistics Dashboard
> Source: https://kb.binalyze.ai/air/features/investigation-hub/investigation-hub-data-usage-statistics-dashboard.html
The **Investigation Hub Disk Usage Statistics Dashboard** empowers users to manage **Investigation Hub data storage** effectively by providing detailed and user-friendly insights into disk usage. This feature simplifies data analysis through visual elements like pie charts and summaries and enables users to focus on relevant data using customizable filters. Additionally, the ability to generate PDF reports makes sharing and documenting disk usage information seamless, enhancing operational efficiency and decision-making.
***
### Why This Feature Matters
**Challenges:**
* **Lack of Visibility**: Users struggle to understand how disk space is utilized across cases, organizations, and evidence categories.
* **Complex Data Presentation**: Existing tools make it difficult to analyze or visualize disk usage.
* **No Reporting Tools**: There is no simple way to generate and share reports, limiting collaboration and record-keeping.
**How This Dashboard Solves These Problems:**
* **Clear Visualization**: Pie charts and summaries make it easy to understand disk usage at a glance.
* **Customizable Filters**: Users can filter data by organization, investigation type, platform, evidence type, and category.
* **Report Generation**: Generate PDF reports or export data as CSV files directly from the dashboard.
***
### Key Features
**Access Control**
* This feature is accessible **exclusively to Global Admins** via the AIR console:
* Navigate to **Settings > Investigation Hub Disk Usage**.
**What’s Included**
* The first nine disk usage categories are displayed in charts. The remaining categories are grouped together and can be viewed by using the scrolling arrow, as shown in the screenshots of the Disk Usage Per Organization pie chart below:
Investigation Hub – Data Usage Statistics Dashboard
* The usage summary window at the top of the page provides an overview of total disk usage, categorized by Organizations, Cases, and Task Assignments, all at a glance.
* Detailed breakdowns are shown by:
* **Organization**
* **Case**
* **Platform**
* **Evidence Type**
* **Evidence Category**
### **Data Views**
* **Actual Disk Usage View**:
* Real-time insights into current disk usage.
* **Historical Insights View**:
* Track trends and changes in disk usage over time.
* Configure widgets to display tailored insights.
* **Filters in the secondary menu:**
* Organization
* Investigation Type
* Platform
* Evidence Type
* Evidence Category
Investigation Hub – Data Usage Statistics Dashboard: Filters
### **Advanced Table View**
* Sortable and exportable tables for deeper analysis.
* Filters and advanced sorting for granular insights.
### **Exporting Reports**
* Users can generate PDF reports for record-keeping and sharing.
* CSV exports are available for custom data analysis.
***
## **Data Usage Dashboard – Hierarchical Sunburst View**
Understanding data usage in complex environments can be challenging, especially with large datasets. The **Hierarchical Sunburst View** in the Data Usage Dashboard offers an intuitive and interactive visualization that helps identify key usage patterns, trends, and anomalies at a glance.
Please see this short overview of the [**Hierarchical Sunburst View**](https://app.storylane.io/share/aqlyczyamkxf)**.**
Investigation Hub – Data Usage Statistics Dashboard: Hierarchical Sunburst View
### **Key Benefits**
* **Visual Hierarchy** – Easily navigate and understand data relationships compared to traditional tables or charts.
* **Interactive Exploration** – Click on segments to drill down into deeper data layers for more detailed insights.
* **Seamless Filtering** – The Sunburst View integrates with global filters, ensuring a consistent analysis experience.
* **Custom Dashboards** – Save customized Sunburst views for quick access and continuous monitoring.
### **Where to Find It?**
The **Sunburst View** is available under:\
**Settings > Actual Disk Usage > Hierarchical View tab** on the **Actual Usage** page.
### Historical Insights Feature
Investigation Hub – Data Usage Statistics Dashboard: Historical Disk Usage
### **Overview**
The historical view allows administrators and investigators to analyze disk usage trends efficiently. The dashboard includes customizable widgets and granular time-based analytics to help identify patterns and optimize storage usage.
### **Key Functionalities:**
1. **Customizable Widgets**:
* **Group by**: None, Organization, Investigation Type, Platform, Evidence Type, Evidence Category.
* **Function**: Metrics such as average or maximum values.
* **Granularity**: Hourly, daily, monthly, or yearly intervals.
* **Filters**: Date/time, investigation type, and more.
2. **Saved Dashboards**:
* Save and manage customized dashboards.
* Dashboards are listed with details like name, user, save date, last update, and applied filters.
* Prevent duplicate or empty dashboard names.
3. **Data Management**:
* Disable unavailable dates in the date and time picker.
* Reload or export data directly from table views.
4. **Default Settings**:
* Reset widgets to default configurations.
***
#### Restrictions and Considerations
* **Access**: This feature is only available to Global Admins.
* **Non-Clickable Charts**: The line charts in the dashboard are for display purposes only.
* **Limited Categories**: Only the top nine disk usage categories are displayed; all others are grouped under the label “Others.”
***
#### User Guidance
1. **Accessing the Dashboard**:
* Go to **Settings > Investigation Hub Disk Usage**.
* Choose between **Actual Disk Usage** or **Historical Disk Usage** views.
2. **Filtering Options**:
* Organization
* Investigation Type
* Platform
* Evidence Type
* Evidence Category
3. **Visual Representation**:
* Pie charts for quick overviews.
* Detailed tables for in-depth analysis.
4. **Exporting and Reporting**:
* Generate **PDF reports** for sharing and record-keeping.
* Export **CSV files** for custom data handling.
***
This feature provides administrators and investigators with powerful tools to monitor and optimize disk usage, ensuring a streamlined and efficient investigation process.
---
# Using the Investigation Hub
> Source: https://kb.binalyze.ai/air/features/investigation-hub/using-the-investigation-hub.html
The **Investigation Hub** offers a centralized and well-organized interface to manage all case-related elements, including assets, evidence, artifacts, and triage results. It simplifies the investigative process by providing efficient filtering options and a robust global search feature, eliminating the need to switch between tools or manually piece together information from various sources.
This hub is designed to enhance the investigative process by seamlessly integrating additional data sources and context through data import capabilities. This means you can augment your analysis by importing relevant data and context, ensuring that you have access to a comprehensive and updated information set for your investigation.
The Investigation Hub is not static; it is a living and breathing space that will ingest and consolidate every report allocated to a case as the investigation progresses.
The remainder of this page delves into the various sections that comprise the displayed information. It's beneficial to become familiar with this layout to locate the specific data you're interested in easily. Given the diverse nature of investigative needs, users may employ various methods to explore this data.
**Read more;** you may find the article titled **'**[**Investigating a malware attack using the AIR Investigation Hub**](https://www.binalyze.com/blog/dfir-lab/investigating-a-malware-attack-using-binalyze-airs-investigation-hub)**'** to be a valuable example of one such approach.
## Navigating the Investigation Hub
Using the Investigation Hub: The Dashboard
In this article, we will explore the various perspectives presented by the Investigation Hub and offer suggestions on how users can effectively utilize its features.
The Investigation Hub can be broken down into six sections:
1. Header
2. Secondary Menu
3. Dashboard & Widgets
4. Evidence
5. Findings & Results Table
6. MITRE ATT\&CK
7. Details View
8. Automated Report Generation
### 1. Header
Using the Investigation Hub: Header
The Header is a persistent element across all views within the Investigation Hub.
To the right of the AIR icon and Organization Name is a **Global Search** input box. This search capability is highly versatile, enabling users to perform searches across all data within the Investigation Hub for the current case. This encompasses acquisition and triage data, as well as any imported data and findings identified by DRONE, ensuring a comprehensive and integrated approach to investigations. The Global Search also supports wildcard prefix searching using the asterisk (`*`) symbol - see the Wildcard Prefix Search section below for examples and details.
The **Activity Feed** enhances team collaboration and transparency by logging actions taken by investigators. This includes creating **exclusions, findings, flags, comments, and notes**. Each entry includes user identification and timestamp information to ensure a comprehensive audit trail.
All activities are labeled and linked to their corresponding individual activity by simply clicking on them. In the example below, we can see how the user has filtered to 'Only me', showing all activity with the newest first:
Using the Investigation Hub: Activity Filters
**Notifications** are accessed via the bell notifications icon, which displays a count (up to 99) of the unread messages.
To the right of the Notifications icon is the name of the **Organizational environment** in which the user is working. From this link, users can access the Organization Settings, change their organization, or add a new one.
Towards the right side of Activities, users have the option to modify **time zone settings** for all timestamps within the hub, should the need arise.
### 2. Secondary Menu
Using the Investigation Hub: Secondary Menu
At the top of the Secondary Menu, the name of the current case (e.g., 'DayOne' in this example) is prominently displayed. From here, users can choose the view to display in the main viewing window of the Investigation Hub, selecting from:
* Dashboard
* Reports
* Findings
* Exclusions
* Evidence
:::note
**Live Import Progress**
As seen below, the Secondary Menu shows 'live import progress' directly next to the case title. This provides immediate visibility into active tasks without requiring a refresh or switching views.
When hovering over the data import icon, users will now see a clear visual status:
* A green tick indicates that the import has successfully completed.
* A spinning circle of dots signifies that the import is still in progress.
:::
Using the Investigation Hub: Data import still in progress
Using the Investigation Hub: Data imports are up-to-date
The bottom half of the Secondary Menu is dedicated to applying Global Filters to the current case, enhancing the ability to narrow down the displayed information. Users can filter by:
* Asset
* Finding Type
* Flag
* Dates and Times
* Creator
These filtering options, combined with the logical AND switch, enable users to customize and refine the display to show only the most relevant items based on multiple selected criteria. This structured approach helps streamline navigation and improve the efficiency of the investigative process in the Investigation Hub.
Using the Investigation Hub: Global Filters
**Global Filters in Investigation Hub**
Global Filters are positioned at the top of the Investigation Hub, directly below the section title. This placement ensures they remain visible and readily accessible across all views.
These filters allow users to refine data in the tables below by criteria such as Assets, Evidence Category, Finding Type, MITRE mapping, Flags, and Date & Time. The _Evidence Category_ filter enables more targeted investigation by isolating specific types of evidence. Filter selections persist across Investigation Hub views for seamless navigation and analysis.
For **Sigma-based DRONE findings**, you can also use **rule Author** and **Status** when filtering and grouping results—helping analysts prioritize detections from trusted, confirmed rules and separate experimental or lower-confidence Sigma matches during evidence review.
### 3. The Dashboard and Widgets
The Dashboard provides investigators with a high-level overview of their case, highlighting key issues and investigative opportunities. It features dynamic widgets that automatically update as new evidence and artifacts are added, ensuring that investigators have the most current information at their disposal.
Using the Investigation Hub: Overview
The action buttons on the Dashboard page enable three key activities:
1. **Import .csv or .pst Files**: Add these files directly to your case.
2. **Generate Reports**: Access the report generation wizard.
3. **Export Flags to .csv**: Export all flagged items, including bookmarks.
Additionally, the **Overview widget** allows for filtering by operating system, giving you a quick overview of key statistics for the case.
Using the Investigation Hub: Finding Type
The **Finding Type widget** on the dashboard categorizes and filters findings as either DRONE automated, user-generated, or both. This widget simplifies the review process by presenting findings according to their severity levels:
* **Red**: Indicates High severity
* **Orange**: Denotes Medium severity
* **Blue**: Represents Low severity
* **Dark Orange**: Signifies Matched (keyword/Hunt/Triage hit)
Each item within the widget is clickable, and the filtered results are displayed on the Findings page.
### DRONE Finding Types
* **High:** Flags threats that pose immediate and significant risks, demanding urgent action to prevent or mitigate severe impacts. Example: An IIS process executing `cmd.exe` or `powershell.exe`, which could indicate a web shell.
* **Medium:** Targets activities that deviate from expected norms and could be indicative of potential threats, suggesting a need for deeper scrutiny. Example: A running unsigned process located in a temporary folder, or the use of known hacking tools, such as "mimikatz."
* **Low:** Identifies less critical but still unusual activities that could benefit from further investigation to clarify their nature and intent. Example: System-level processes initiated by non-privileged users, or processes operating from non-existent directories.
* **Matched:** Involves confirmed matches to predefined security rules, keywords, hashes, or patterns within the analyzed data, signaling recognized threat indicators. Example: A detected scheduled task named "MalwareTask\*" that aligns with a user-defined keyword "MalwareTask\*".
The **MITRE ATT\&CK widget** provides an invaluable overview by displaying how many findings within a case have been mapped to various Tactic and Techniques from the MITRE ATT\&CK framework. This framework is a globally recognized knowledge base of adversary tactics and techniques based on real-world observations. It is used extensively for threat modeling and cybersecurity defense.
By incorporating the MITRE ATT\&CK widget into the dashboard, investigators can quickly identify patterns and methods used in cyber attacks, facilitating a deeper understanding of the threat landscape. This visibility enables users to align their defense strategies more accurately with the tactics and techniques that adversaries are most likely to use, improving the effectiveness of their security measures. The widget's ability to display the distribution of findings across different categories not only helps pinpoint vulnerabilities but also aids in prioritizing responses to the most critical threats based on observed patterns of attack.
Using the Investigation Hub: Top Assets Breakdown
The **Top Asset Breakdown widget** highlights the most significant assets within the current case, emphasizing those with the most severe issues. This feature provides a clear and concise view of critical vulnerabilities, helping investigators prioritize their response efforts based on the urgency and impact of the identified problems.
Using the Investigation Hub: Flags
**The "Flags" widget** provides a comprehensive overview of all flagged items, each accompanied by its respective count. This widget enables users to customize flags, allowing them to modify both the name and color of each flag to suit their specific needs.
The default "Bookmark" flag is pre-established and cannot be edited. Additional custom flags, once created, are stored and listed within the library for easy access.
:::caution
**\*Note: Flags are configured at the Organization level, so they are not just case-specific. Therefore, any edits or deletions to flags will have a global effect for the Organization and are only permitted for users with Case Management privileges. This ensures consistent flagging practices across all cases, preserving the integrity of the flagging system.**
:::
### 4. Evidence
Under the heading "Evidence," all evidence items collected as part of a tasking, even those with a null return, will be displayed.
A count will be displayed next to each evidence item to indicate the number of associated Findings. For example, in the screenshot below, there are 14 high-priority Findings for Persistence>Scheduled Tasks, 3 medium-priority Findings for Persistence>Registry, and other items are shown with counts but have no Findings associated. This feature helps to identify and prioritize areas of interest within the evidence quickly.
Hunt/Triage results and Imported evidence items are also displayed in this Evidence section.
Within the Secondary Menu, users have the flexibility to dynamically include or exclude case assets, including imported evidence like .pst or .csv files. Assets are categorized either by the operating system or by the name of the imported evidence for ease of management. In the example above, the Windows asset called RichardBurton has been deselected so none of the evidence from this asset will be displayed in any of the Findings views.
Using the Investigation Hub: Scheduled Tasks has 14 Findings
* **Other Evidence** is a category for items that are Findings without a dedicated entry in the Investigation Hub.
* All findings without a specific category will be grouped under '**Other Evidence**'. This ensures that every finding is allocated an evidence record within a category, allowing the total count of findings on the Investigation dashboard to accurately match the number shown in the evidence list.
Using the Investigation Hub: Other Evidence
### 5. The Findings and Evidence Results Tables
Within the Secondary Menu, Findings are categorized and displayed alongside a count for each evidence type where applicable. The severity of each Finding is color-coded for quick identification:
* **Red**: Indicates High severity
* **Orange**: Denotes Medium severity
* **Blue**: Represents Low severity
* **Pink**: Signifies Matched (keyword hit)
This system allows for an immediate visual assessment of the evidence's priority level.
Under the Evidence subheading section, the secondary menu will display all evidence items collected as part of a task, even if a null return has occurred. In the example below, we can see that the **Hide Empty Pages** filter has been activated.
Using the Investigation Hub: Viewing App Compat Cache
In the screenshot shown above, the acquired evidence from the App Compat Cache has been highlighted for focused viewing. As a result, the main viewing area is exclusively dedicated to displaying all the evidence gathered from the App Compat Cache. In this particular example, one 'Matched' item has been singled out, and its comprehensive details are presented in the section below in the 'Details' tab.
It's essential to note that in this scenario, the table has been sorted by the findings column to order the view by the severity of the findings. Additionally, users have the flexibility to rearrange and resize columns according to their preferences. Furthermore, users can customize which columns are visible in the table using the **Column Chooser** feature, which is available on all pages with tables within the Investigation Hub.
Using the Investigation Hub: Navigation
The Evidence section displays both triage results and imported evidence items, offering comprehensive insight into gathered data.
Highlighted in the above screenshot, additional table functionality enhances user interaction and data management:
* **Flag Column**: This column displays flagged items and allows filtering and sorting by flag status.
* **Magnifying Glass Icon**: Offers extensive filtering and searching capabilities with options such as Contains, Does Not Contain, Starts With, Ends With, Equals, and more, allowing precise control over the displayed data.
:::tip
**Wildcard Prefix Search:** The Investigation Hub now supports wildcard prefix searching using the asterisk (`*`) symbol. By adding `*` after your search term (e.g., `cmd*`), you can quickly find all evidence names or keywords that start with that text. This is particularly useful for locating related items across large investigations, such as:
* `chrome*` - finds all items starting with "chrome" (chrome.exe, chromium, chrome_data, etc.)
* `system32*` - finds all System32-related files
* `powershell*` - locates all PowerShell processes and artifacts
This feature works in both the Global Search bar and individual column filters, making it faster to identify patterns in partial filenames, process names, registry keys, and user activities.
:::
* **Dockable Details Pane**: Users can choose to dock this pane on the right side or at the bottom of the window. Clicking the icon toggles the Details pane's orientation from vertical to horizontal and vice versa, adapting to user preference and screen layout.
* **Filtered Items Reminder**: A helpful reminder of the currently applied filters, ensuring users are aware of the viewing context.
* **Date & Time Picker**: Allows users to narrow down evidence to specific time periods, facilitating focused analysis.
* **Relative time filtering:** In addition to absolute date and time selection, the Investigation Hub supports relative time filtering. Analysts can quickly apply dynamic ranges, such as “Last 5 minutes,” “Last 7 days,” or “Next 30 minutes,” by clicking on (blue) timestamps within tables. This flexible, context-aware filtering is especially useful for timeline analysis and reviewing live evidence.
Using the Investigation Hub: Relative time filtering
* **Created By Column:** In the Findings table, the Created By column indicates whether DRONE or a user generated the finding.
* **Sigma rule metadata:** Sigma-based DRONE findings include **Author** and **Status** fields drawn from rule metadata. Use the Findings table filters, grouping, and **Column Chooser** to work with these columns alongside severity and other attributes—so review workflows can emphasize operationally relevant, reliable detections and still account for experimental rules where appropriate.
* **Highlight to search: This allows users to highlight text in the Investigation Hub tables, as shown below, right-click on the selection, select the magnifying glass that appears, and then choose to "Search in Findings table, Search in the Investigation Hub, Search in Google, or Search in Virus Total.**
Using the Investigation Hub: Right-click on selected data in the table to be presented with search options
**Fullscreen Evidence Tables:** Users can view evidence tables in full-screen mode, ideal for large datasets with multiple columns and rows. This feature maximizes screen space, allowing easier navigation and analysis of complex data without the need for scrolling or resizing. To exit full-screen mode, simply click the Exit Fullscreen icon.
**Sticky Column Headings:** The selection and position of columns will remain saved in your browser across all AIR sessions unless you clear your browser cookies. This ensures that your preferred layout and data organization remain consistent, enhancing both efficiency and the user experience.
Using the Investigation Hub: Sticky Column Headings & Column Chooser
### Flags
The Investigation Hub flagging feature allows users to create custom flags to mark evidence and findings they deem significant during an investigation. This flagging functionality can be used to filter by flags and facilitates collaboration with other investigators, helping to mark items for re-examination or highlighting important details for potential inclusion in reports.
Users create custom flags by right-clicking on a finding or evidence item, selecting ‘Add/Remove Flag’, and then making a name, description, and color for the flag from the 11 default options, or clicking the '+' to select your own colour from a palette:
Using the Investigation Hub: Adding a flag to a Finding with a color from the palette
Multiple items can be flagged simultaneously using the Bulk Actions bar:
Using the Investigation Hub: Flagging via the Bulk Action bar
* Hovering over the flag of a flagged item in the table view will reveal:
* The name of the flag
* Who created the flag
* The date & time it was created
Using the Investigation Hub: Hovering over a flag to reveal details
* Flags are saved at the Organization level in Libraries; therefore, they will be available to all cases created in the same Organization.
* Creating new flags or editing existing flags can be done in Libraries if the user has Case Management privileges.
* The **Bookmark Flag** is the only fixed/permanent flag.
* Users can use the advanced filter to include or exclude flagged items in the Investigation Hub table views, enhancing the ability to focus on prioritized or highlighted evidence.
### Exclusions
AIR's DRONE capability enhances decision support by leveraging built-in YARA, Sigma, and osquery rules to quickly identify compromised assets. By analyzing evidence, DRONE generates Findings that highlight key investigative opportunities, helping prioritize and streamline investigations efficiently.
During an investigation, users may encounter Findings that are not relevant to their case. The Investigation Hub allows them to exclude these Findings, helping investigators stay focused on pertinent information.
### **Exclusion Methods:**
AIR offers **two exclusion methods**:
1. **Exclusion Rules** – Allows exclusion of a Finding **either** by its location/path, **OR,** regardless of its location, based on the finding itself.
2. **Individual Exclusions** – This method allows users to manually exclude any Findings **within a case**, based on their specific needs or investigation requirements, **without the need to create a rule**.
Using the Investigation Hub: Right-click on a Finding to reveal Exclusions
### **1. Exclude by Rule**
Using the Investigation Hub: The Exclude by Rule option
* Right-click on a Finding and choose "Exclude by Rule" from the context menu.
Using the Investigation Hub: Exclusion Rule
* **Exclude by:** Customize the exclusion based on the path in two ways: **On the specific path**, which excludes an item only if found in that particular location, or based **on the finding**, which excludes the item regardless of where it is found on the asset.
* **Scope: Decide whether to exclude just this case or all cases within the organization.**
* **Target:** Apply the rule to the selected asset, or all assets if applicable.
* (Exclusion by hash value is coming soon)
### 2. **Individual Exclusions**
This method allows users to manually exclude any Findings **within individual cases**, based on their specific needs or investigation requirements, without the need to create a rule.
Using the Investigation Hub: The Exclude option
Right-click on a Finding and choose "Exclude" from the context menu.
Using the Investigation Hub: Exclusion reason
Users can either select an existing **reason for exclusion** or create a new one. Any newly added reason will be saved and included in the list of available exclusion reasons for future use.
### **Management and Audibility:**
* All excluded Findings are removed from the Findings table and added to the **Exclusions table** (directly below Findings in the Secondary Menu) as shown below. This feature enables teams to cross-validate and resolve discrepancies as needed.
Using the Investigation Hub: Manage Rules
* At the top of the page, users can click **"Manage Rules"** to modify or delete **Exclusion Rules**. However, individual exclusions **cannot be edited**—they can only be deleted. This allows users to refine exclusion settings while maintaining control over how findings are managed.
Using the Investigation Hub: Finding Exclusion Rules
* In the **Organization Library** under "**Finding Exclusions Rules**," users can change the scope from Case to Organization, apply exclusions from one asset to all assets in the organization, or completely delete rules if they have "Case Management" privileges.
* In the **Organization Library,** users can also select Exclusion Rules to delete via the Bulk Action Bar as shown below.
Using the Investigation Hub: Bulk Exclusions
Tooltips are provided throughout to guide users in utilizing these customizable options effectively. After an exclusion is applied, users have a brief opportunity to undo the operation or close the notification, ensuring that actions are deliberate and retrievable.
This Exclusions Capability significantly streamlines the investigative process, allowing investigators to maintain focus on essential evidence while managing irrelevant data efficiently.
### Notes
Using the Investigation Hub: Notes
The **Notes** feature enhances collaboration by allowing users to attach notes to any evidence item or Finding, without requiring the item to be bookmarked. These notes are accessible to the entire team working on the case and are displayed in the Notes column of the table view.
This feature is handy for enhancing communication within the team, as it allows for the sharing of insights and observations directly alongside the relevant evidence. Furthermore, notes can be seamlessly integrated into reports through AIR’s “Generate Report” feature, which supports the creation of customizable reports. Additionally, notes can be exported for external use.
Overall, the Notes feature in AIR 4.13 streamlines case documentation and enhances the reporting process, making it an essential tool for collaborative investigations.
### User-generated Findings
In previous versions of AIR, the decision-support system, including the automated evidence analyzers known as DRONE, helped users prioritize their investigative steps. With the release of AIR 4.13, users now have the capability to generate their own Findings, enhancing the depth of investigations by incorporating personal insights, organizational context, or specific investigative details.
Using the Investigation Hub: Mark as Finding
For instance, from the Evidence page, users can right-click on an item and select "Mark as Finding" to manually allocate a Finding to it. This process involves several steps:
* **Selecting a Finding Type**: Users choose from pre-defined types such as High, Medium, Low, or Matched.
* **Adding a Description/Label**: This provides a clear and concise description or label for the Finding, facilitating clarity and reference.
* **Detailing the Path and Associating with MITRE ATT\&CK TTP**: Users can specify the file path and link the Finding to a specific tactic or technique from the MITRE ATT\&CK framework.
* **Setting a Date**: Users can also include the date when the Finding was identified or marked.
Using the Investigation Hub: Created By
Upon confirming with "OK", the Finding type is displayed in the "Finding Type" column within the Evidence page, along with a column indicating who created the Finding. These user-generated Findings are then added to the "Findings" window, where they are distinguishable by a "created by" column, which shows whether a Finding is from DRONE or user-generated, and identifies the creator. This allows for efficient tracking and searching using the column search functionality.
Additionally, these Findings are reflected in the Dashboard widget, where users can filter to view "All" findings or specifically search across DRONE or user-generated Findings using the provided tabs. This new feature in AIR 4.13 significantly empowers users to tailor their investigative processes with enriched data and personalized analysis.
### 6. MITRE ATT\&CK
Using the Investigation Hub: MITRE ATT&CK mapping
MITRE ATT\&CK serves as a global resource for adversary tactics and techniques, guiding threat models and methodologies across industries. Integrated with AIR, it continuously maps findings to ATT\&CK, enhancing detection with up-to-date YARA rules for IoCs and TTPs. DRONE's implementation scans assets and processes using crafted rules, with automated rule updates in AIR. You can read more about DRONE in this blog, '[**Automated Compromise Assessment with DRONE'**](https://www.binalyze.com/blog/dfir-lab/automated-compromise-assessment-with-drone).
#### MITRE Heatmap
Using the Investigation Hub: Link to the MITRE Heatmap
The MITRE ATT\&CK heatmap is an integrated visual tool within the Findings section of the Investigation Hub that maps DRONE-generated findings to MITRE ATT\&CK techniques and sub-techniques. It visually indicates which techniques are involved in the current case, based on the volume of findings, enabling analysts to quickly assess the breadth and focus of an attack.
Each technique in the heatmap corresponds to a cell, and its color intensity represents the number of findings mapped to that technique. This allows analysts to see at a glance which areas of the ATT\&CK framework are most heavily implicated in the investigation.
Using the Investigation Hub: The MITRE ATT&CK heatmap
#### **Analytical Value of Heatmaps**
* **Immediate Threat Context**:\
The heatmap adds actionable context by connecting raw findings with attacker behaviors defined in the MITRE ATT\&CK framework. This helps analysts:
* Understand the “how” of the attack (techniques)
* Spot patterns across multiple assets
* Recognize potential blind spots in detection coverage
* **Gap Identification**:\
By visualizing unused or sparsely populated techniques, SOC teams can identify **gaps in evidence collection, detection logic, or attacker behaviors that have not yet been fully uncovered**.
* **Investigation Prioritization**:\
Supports strategic triage by letting analysts focus first on high-volume techniques associated with high-severity findings.
#### **Configurable Visualization Options**
Using the Investigation Hub: Configure the Heatmap via this button
To enhance usability and relevance, the heatmap offers several customization controls:
* **Sort Techniques by Volume**:
* Techniques can be sorted in either ascending or descending order by associated findings.
* Helps in prioritizing analysis — either by focusing on the most prevalent threats first or identifying less common, potentially stealthier techniques.
* **Toggle Empty Techniques**:
* Analysts can **hide or display techniques with zero associated findings**, reducing visual noise and emphasizing active threat vectors.
* **Toggle Sub-techniques**:
* Enables a granular view by revealing or hiding sub-techniques under each parent tactic.
* Supports more precise mapping of attack behavior and facilitates deeper root cause analysis.
These options are beneficial when navigating investigations that involve high asset counts or extensive data volumes, allowing teams to zero in on critical patterns efficiently
### 7. Details View
To match your viewing preferences and monitor setup, the Details view for selected evidence items is both **dockable and detachable**. You can either open a separate, independent window to display the evidence details or use the icon shown below to toggle the position of the Details window.
**Dockable Evidence Details Window:** This feature allows you to toggle the Details window between a vertical display on the right side of the browser window and a horizontal display at the bottom. Simply click the icon to switch between these views.
Using the Investigation Hub: Hide Empty Fields and the Dockable icon
In the Details window, there may be occasions when some fields are empty. To minimize clutter from these empty fields, you can use the '**Hide Empty Fields**' feature. This option allows you to clean up the interface by displaying only those fields that contain information.
**Detachable Evidence Details Window:** This feature allows users to open evidence details in a standalone window that can be resized and repositioned anywhere on the screen(s) for improved clarity. The window maintains its form even when displaying new evidence items. Clicking on a new row in the table updates the detached details view to match the newly selected item. This flexibility allows investigators to compare multiple pieces of evidence side by side, improving the overall analysis process.
**Details View Example:**
Using the Investigation Hub: Details View
The screenshot above displays an example of a typical details view of a file selected in the table view. This particular file is a Scheduled Task entry which has a DRONE Finding Type 'High'.
The term "Digital Sign Status As Text" refers to the description of the status of a digital signature in text form. When you encounter "Bad Digest" as the status, it indicates an issue with the digital signature of a file or document.
Specifically, "Bad Digest" means that the hash value calculated from the downloaded or retrieved file does not match the hash value used initially when signing the document or file. This discrepancy suggests that the file may have been altered or corrupted after it was signed. Consequently, the integrity of the file is in question, and it can no longer be trusted as authentic or unmodified from its signed state. This status is a critical indicator in digital security practices, especially when verifying the legitimacy and integrity of software downloads and updates.
Searching the hash value revealed in the details window across the Investigation Hub immediately reveals other Findings associated with this file:
Using the Investigation Hub: Mapped Findings
Now we can see that there are two High Findings that are mapped to MITRE ATT\&CK Tactics and Techniques, as shown.
### 8. Advanced Filters
The advanced filter save feature boosts efficiency by enabling users to save and share custom filters within a AIR organization. This functionality streamlines data analysis, promotes consistency, and enhances collaboration throughout the investigative process.
Using the Investigation Hub: Using the Advanced Filters
The Advanced Filter window remains visible as you build the filter, and you can reposition it.
Each Advanced Filter is specific to the table in which it is built; for example, an Advanced Filter you build in Findings will not be available to you in the Browser Artifact table.
Filters can be saved and then later selected from the drop-down list.
Using the Investigation Hub: Accessing saved filters
Add items to Advanced Filters directly from the Details window using the filter icon:
Using the Investigation Hub: Add items directly
### Regex Operator Support in Advanced Filters
The Investigation Hub includes support for regular expression (regex) operators within the Advanced Filters section. This enables more powerful and flexible data filtering across cases, triage results, and evidence views.
Using the Investigation Hub: Regex support in Advanced Filters
**How It Works:** Regex filtering is available via the existing Contains filter dropdown, with the following operator options:
* Doesn't match RegEx (case sensitive)
* Matches RegEx (case sensitive)
* Doesn't match RegEx (case insensitive)
* Matches RegEx (case insensitive)
These options enable you to create highly granular search conditions, which are ideal for forensic analysts working with variable or loosely structured data inputs.
### **Example Use Cases**
Locate executables matching a naming convention: `^cmd.*.exe$`
Identify registry keys containing GUIDs: `[A-Fa-f0-9]{8}-([A-Fa-f0-9]{4}-){3}[A-Fa-f0-9]{12}`
### **Example Use Cases and Syntax Explained:**
* **Locate executables matching a naming convention**\
**Regex:** `^cmd.*\.exe$`\
**Explanation:**
* `^` anchors the match to the **start of the string**
* `cmd` looks for the literal text `"cmd"`
* `.*` matches **any number of any characters** (except newline)
* `\.exe` matches the literal file extension `.exe` (Note the backslash escapes the dot)
* `$` anchors the match to the **end of the string**
* **Use case:** Filters for files like `cmd.exe`, `cmd123.exe`, or `cmd_tool.exe`
* **Identify registry keys containing GUIDs**\
**Regex:** `[A-Fa-f0-9]{8}-([A-Fa-f0-9]{4}-){3}[A-Fa-f0-9]{12}`\
**Explanation:**
* `[A-Fa-f0-9]{8}` matches **8 hexadecimal characters**
* `-` matches a literal hyphen
* `([A-Fa-f0-9]{4}-){3}` matches **three groups** of 4 hex characters followed by a hyphen
* `[A-Fa-f0-9]{12}` matches the final 12 hex characters
* **Use case:** Matches standard Windows GUIDs like `f81d4fae-7dec-11d0-a765-00a0c91e6bf6`
### **9. Automatic Report Generation - Wizard**
AIR's automated report generation feature, alongside the Compromise Assessment Report template, efficiently populates reports with relevant investigation information, offering pre-built, customizable sections tailored to different stakeholders and audiences.
**Generating a Report:** Users can initiate report generation from the Secondary Menu under "Reports" or directly from the Dashboard action button using AIR’s Compromise Assessment report template. The report generation process has been refined to allow for greater customization and flexibility:
1. **Initial Setup and Customization:**
Using the Investigation Hub: Report setup
* Include all findings from the Investigation Hub, encompassing DRONE findings and user-generated findings, excluding any that have been previously filtered out.
* Filter which assets and associated tasks to include based on relevance to the report.
* Apply additional filters by severity of findings and flags to further tailor the content.
1. **Inclusion of Evidence:**
Using the Investigation Hub: Select Evidence
* Users can choose to incorporate evidence linked to flagged items, enhancing the report with crucial items of note that may not be categorized as findings.
1. **Report Customization:**
* Add a company logo to the report, allowing service providers to brand their reports for clients.
* Name the report and set the date/time to ensure clarity and relevance.
* Select specific sections to include in the report based on the intended audience, ensuring the content is relevant and tailored to their needs.
Using the Investigation Hub: Reports view
**Final Steps and Editing:** Once the report is generated by clicking \, it remains fully editable within an HTML iframe editor. This flexibility allows analysts and responders to append additional analysis notes, recommendations, and other pertinent information as needed.
**Post-Creation Options:**
* **Save**: Saves the current HTML version of the report, allowing further modifications in the future.
* **Export PDF**: Converts the report into a PDF file for distribution or archiving.
Both HTML and PDF versions of the report can be managed, edited, generated, exported, and deleted from the "Reports" tab in the Secondary Menu of the Investigation Hub.
This wizard-driven approach not only simplifies the report generation process but also provides users with powerful tools to create detailed, customized reports that meet specific requirements, all within a few clicks.
---
# Off-Network Responder
> Source: https://kb.binalyze.ai/air/features/off-network-endpoint/index.html
For assets not connected to your network, AIR enables the creation of a portable Responder package for running triages and collecting data. This package also facilitates the use of our live MITRE ATT\&CK analyzer along with our post-acquisition analyzers, enhancing the depth and relevance of the gathered data.
You can transfer this package to the off-network asset using a shareable link, email, file-sharing services, or by physically taking it to the asset. Once executed on the asset, the collected data is returned to the AIR console that generated the package for comprehensive analysis and reporting via the Investigation Hub.
When the Responder is executed, it creates an evidence container file with a .zip extension on the offline asset.
:::note
**Up to, but not including AIR v 4.27.6, all collections were automatically encrypted. The password generated by the Off-Network Responder is not predefined or known in advance; it is created programmatically. As a result, this password is not accessible until the output of your off-network task is uploaded to the AIR Console.**
:::
:::caution
**Required User Privileges for Running the Off-Network Responder**
To successfully run the Off-Network Responder, the following user permissions are required based on the operating system:
* **Windows:** Local Administrator privileges
* **macOS:** Admin account with sufficient sudo privileges
* **Linux:** Root user or a user with sufficient sudo privileges
Ensure that the executing user meets these requirements to allow proper operation and avoid permission-related failures.
:::
With **AIR v 4.27.6+,** users can choose to encrypt the collection with a password during the off-network Responder setup process. When importing the collection zip file with the additional password back into the console, users will need to enter this password. [**Biunzip**](biunzip/), a small utility we created, is specifically helpful in this scenario, aiding in the management of multiple off-network acquisitions during console ingestion.
## 1. Task Creation
### Create an Off-Network Task
1. Navigate to the "Assets" tab in the AIR console and click on the "+Add New" button.
2. Select "Off-Network" to initiate the creation of a task for devices not connected to the network.
### Choose the Task Type
1. In the second stage, select the type of task you want to perform on the Off-Network asset. You can choose between "Acquisition" and "Hunt/Triage".
2. For this example, let's proceed with the "Acquire" feature.
Off-Network Responder: Create Task
### Select the Asset(s) Operating System
When creating an Off-Network binary, first choose the operating system on which you plan to execute the binary. If you anticipate needing to use the binary on multiple operating systems or are unsure which system will be used, consider generating a package with multiple binaries. This approach ensures that you will have a binary compatible with all the AIR-supported operating systems.
Off-Network Responder: Assets
### Define the Task
Specify the Task Name (optional) and Acquisition Profile (mandatory).
Off-Network Responder: Task Name
### Customize Collection Options
Here, you can choose to customize the task options if you need to deviate from your organizational policy settings.
Off-Network Responder: Setup
### Customization - Optional DRONE Analysis
By default, the DRONE feature is enabled for off-network tasks. However, in the subsequent step, you have the option to deactivate the MITRE ATT\&CK analyzer, as well as any or all of the post-acquisition analyzers, depending on your specific requirements.
Off-Network Responder: DRONE
## Download or Share the Responder Binary
You can now download or share the Responder binary you have just created.
You can access the Responder binary by either downloading it directly to your storage media or by copying the link to share the package.
Off-Network Responder: Download Link
## 2. Task Execution
### Execute on the Offline Asset
:::note
If you don't want the collection to be saved to the directory from which you launch the binary, please refer to this page to learn how to[ set a custom directory](setting-up-a-custom-case-directory) for your collection or triage results.
:::
Run the downloaded Responder binary on the relevant offline asset keeping the Task.dat file in the same directory. In the example below, we show the downloaded executable file named ‘offnetwork\_windows\_amd64.exe’ and the UAC window where the user will need to allow permissions for the AIR Responder to run.
Off-Network Responder: The downloaded binary
AIR will display its progress as seen below and notify the user when the activity is complete
Off-Network Responder: Progress displayed
### Evidence Collection in Windows Recovery Environment (WinRE)
Off-network Responders can operate in offline mode within Windows Recovery Environment (WinRE) to collect evidence when systems cannot boot normally. This capability enables the extraction of registry hives, event logs, and file artifacts directly from non-operational assets without rebuilding the system or imaging the entire disk.
This feature helps analysts recover evidence from critical hosts after ransomware or system-level compromise, preserving evidence integrity before remediation. Running the off-network Responder from a bootable USB drive ensures the collection process remains isolated and forensically sound.
:::note
For information on running Responder in other special Windows boot environments, see [Responder in Windows Safe Mode](../../setup/responder-deployment/responder-in-windows-safe-mode).
:::
#### WinRE Runbook (Step-by-step)
The steps below assume you already have a bootable WinRE or Windows installation USB.
**Step 1 - Prepare the WinRE USB**
1. On a clean workstation, open `SpearTip_Triage_Collector_WINRE.zip`.
2. Copy the Windows responder files to a dedicated folder on the USB, for example:
`E:\Binalyze\OFFNET-WINRE-Collector\`
3. Ensure these files are together in that folder:
- `offnetwork_windows_amd64.exe`
- `Task.dat`
- `Mitre.zip`
- `Collect.bat`
**Step 2 - Boot into WinRE and identify drives**
1. On the target endpoint, attach:
- WinRE/Windows installation USB
- Binalyze USB (if separate)
2. Boot from the WinRE/Windows media and select:
**Repair your computer** → **Troubleshoot** → **Advanced options** → **Command Prompt**.
3. In Command Prompt, run:
```
diskpart
list volume
```
Identify:
- The USB containing `offnetwork_windows_amd64.exe`
- The offline Windows system volume (for awareness only)
4. Note the drive letters (they can differ from the live OS), then exit:
```
exit
```
**Step 3 - Run Off-Network Responder from WinRE**
1. Change to the Binalyze folder on the USB, for example:
```
E:
cd \Binalyze\OFFNET-WINRE-Collector
```
2. Confirm the files are present:
```
dir
```
3. Run the responder:
```
Collect.bat
```
4. If prompted, confirm execution. In WinRE the responder runs with sufficient privileges by default.
5. Monitor progress (for example: “Collecting registry hives”, “Collecting event logs”).
6. Wait for a clear completion message before closing the window or powering down.
On completion, the responder creates a **Cases** folder containing an encrypted evidence container (`.zip` or `.ppc`).
**Step 4 - Secure and transfer the evidence**
1. In WinRE Command Prompt, confirm the evidence exists, for example:
```
cd E:\Binalyze\Cases
dir
```
You should see a file like `OFFNET-WINRE-[Hostname]-[Timestamp].zip`.
2. Exit Command Prompt and shut down the endpoint.
3. Remove the USBs and transport them to a host capable of uploading the evidence.
### Import the Collected Data
1. After the Responder completes its task, it creates a new folder named “Cases” in the directory where it was executed (or in the directory defined during Responder generation). Inside this folder, you’ll find the encrypted evidence container file (with a .zip extension).
2. The user needs to copy or transfer the zip file so that it can be seen by and imported into the AIR console that generated it.
3. Import the .zip or .ppc file into the AIR console that created the binary. You can tick **Run DRONE Analysis** during import to analyze the collection on the console—useful when the original acquisition was done without DRONE.
Off-Network Responder: Import Evidence
4. If the user encrypted the collection with a password during the off-network task creation, enter the password when prompted during the import process.
Off-Network Responder: Enter Password
In the example provided above, Task 001 is ready for import and will be automatically ingested by the console. However, for **Task 002**, the user must manually enter a password. This password is the one selected during the generation of the Responder binary as additional security to that automatically provided by AIR.
:::note
To import collections or triage results back into the AIR console, you must use the zip file created by the off-network Responder. This file, which contains compressed evidence, can only be accessed once it's imported into the AIR console that created the off-network Responder.
:::
After clicking the "Import" button, as shown in the example above, the user is presented with another window, as illustrated below. Here, the decrypted zip file name is revealed, allowing the user to export the passwords used to unzip the containers containing the acquired data.
Off-Network Responder: View Task Details
Clicking the "View Task Details" icon will open the Task Details window. Here, users can copy the zip password needed to decrypt the container locally.
Off-Network Responder: Password Copy
### Review Report on AIR Console
Once the imported data is decrypted into the console, users review and analyze the collected data in the AIR Investigation Hub.
:::note
It is possible to import multiple .zip or .ppc files into AIR at the same time via the window shown below, while making use of our bespoke unzipping tool "[**biunzip**](biunzip/)":
:::
[biunzip](biunzip/)
---
# biunzip
> Source: https://kb.binalyze.ai/air/features/off-network-endpoint/biunzip/index.html
* You can download the latest release of biunzip from the releases section on [GitHub](http://github.com/).
* Biunzip will either unzip a single zip file or unzip zip files in a directory using a CSV file.
* This capability will enable running off-network investigations at scale and speed with minimal effort.
**Below, we walk through the process**
1\) Download biunzip from [GitHub](https://github.com/binalyze/biunzip/releases).
biunzip: GitHub repository
2\) Import off-network zipped files to a machine with AIR console access and the biunzip utility:
biunzip: Imported off-network collected files
3\) Import off-network files into AIR (with acquisition password if the files are encrypted):
biunzip: Import Evidence
4\) Export the passwords:
biunzip: Export passwords
5\) View the exported passwords:
biunzip: View passwords
6\) Run biunzip with the following flags and necessary flag values to unzip off-network files:
```
biunzip.exe --dir zip_dir_path --csv cvs_file_path
```
In this example, zip\_dir\_path points “C:\Users\roadrunner\Desktop\offnetwork\_files” directory, csv\_file\_path points “C:\Users\roadrunner\Desktop\Off-Network-Zip-Passwords\_3107231801.csv“ file.
biunzip: CLI example
7\) Here we see the unlocked zip files alongside the original locked files:
biunzip: Unlocked zip files alongside the original locked files
---
# biunzip password file
> Source: https://kb.binalyze.ai/air/features/off-network-endpoint/biunzip/biunzip-password-file.html
* The biunzip tool offers enhanced access to the passwords file, streamlining the decryption of multiple Off-Network zip files.
* The Off-Network Assets passwords file will now always be available at: Asset (name) > Tasks > Details > Information Tab.
---
# Setting Up a Custom Case Directory
> Source: https://kb.binalyze.ai/air/features/off-network-endpoint/setting-up-a-custom-case-directory.html
**1. Run as Administrator/Root**\
To modify settings or even to display help options, it's necessary to run the off-network program with administrator (Windows) or root (Linux/Mac) privileges. This is essential for accessing certain system directories or modifying system files
**2. Using Command Line**\
Instead of launching the program by double-clicking, open a command terminal as an administrator and navigate to the directory where the program is located.
**3. Setting the Case Directory**
You can specify a custom directory for saving case files by using the \``--case-base-dir`\` flag followed by the path to the desired folder.
For example, if you want to store cases in "`D:/Another/Folder`", the command would look like this: `offnetwork_windows_amd64.exe --case-base-dir D:/Another/Folder`
**4. Viewing Available Commands**\
To view all available flags and commands, you can enter the following command: `offnetwork_windows_amd64.exe --help`
This will display all the configuration options available, including the \``--case-base-dir`\` option which allows you to override the default case file directory.
**Additional Information:**\
\&#xNAN;**-** The \``--case-base-dir`\` option is supported across all operating systems that our software supports, making it flexible for various IT environments.\
\&#xNAN;**-** There is no need to create a new task file when you want to save to a different location; simply specify the desired path each time you run the program. Please note that while the \`ESXi\` command is mentioned in the help output, it pertains to a new feature that might be announced later.
---
# Policies
> Source: https://kb.binalyze.ai/air/features/policies.html
Policies are used in AIR to standardize critical options at the organization level for the Console, Responders, and Evidence Repositories.
AIR includes a **Default Policy** that is **read-only** and covers all configuration areas. It **cannot be edited** and acts as a fallback when no other policies are assigned or when some settings are missing. This ensures every **acquisition task** has a complete configuration, preventing gaps.
Policies in AIR help **standardize critical settings** for the **Console, Responders, and Evidence Repositories** at the organization level. While the **Default Policy** is **preconfigured and uneditable**, users with the necessary permissions can **view, create, and modify** custom policies as needed.
Policies: In this case the user will have access to all Policy options
To create a new policy, click the "Settings" button in the Main Menu and then select “Policies” from the Secondary Menu.
When you select the "**+Add New**" Action Button, you can create the required policies by configuring the options shown below:
1. The Policy name.
2. The Organization(s) affected by the policy.
3. The destination for collected evidence by OS platform:
* **Local** - use the local asset.
* **Evidence Repository** - use a remote storage location set in [Evidence Repositories](evidence-repositories/).
* **Path** - By default, the path to save evidence locally is: `Binalyze\AIR\`
* **Direct Collection** - Enable this switch to collect data while minimizing local disk space usage. During the upload process, approximately 100MB of temporary data is stored in the Cases folder, which is automatically deleted upon completion.
* **Automatically Select Volume** - Toggle on this switch to allow AIR to select the local volume with the most available space.
4. The destination for files collected by interACT:
Policies: interACT repository settings for downloads
5. Asset Resource Limits utilized by AIR Task Assignments executed by Responders:
Policies: Resource Limitation Settings
Resource Limits cap the Responder's resource usage while it executes tasks on an asset, so collections cannot disrupt in-use systems. See [Resource Limits](policies/resource-limits.md) for every available limit, its default value, how the Responder enforces it on each operating system, and tuning guidance for sensitive environments.
6. **Compression and encryption settings**
Policies: Compression and encryption settings toggled ON
Compression is enabled by default, but users can disable it if preferred. Note that disabling compression may significantly increase the disk space required for your collections.
Encrypt Evidence toggled on will require the entry of a password, which will be needed later to access the collected data. The data will be encrypted with AES256-bit encryption and stored in a zip archive.
:::caution
We do not save the passwords you enter, and they cannot be recovered through the AIR console. Therefore, please ensure you securely store them yourself. We strongly recommend using a Password Manager application to manage and safeguard your passwords.
:::
7. **Hunt Location Settings (Hunt/Triage)**
Use these controls to define where YARA Hunt/Triage scans should run:
- **Scan Local Drives Only** limits scans to local volumes and prevents scanning mapped network or external drives. If disabled, mapped network drives are included.
- **Included Path Patterns** define the folders and volumes that will be scanned (per OS).
- **Excluded Path Patterns** define folders that should be skipped, reducing noise and scan time.
Together, these settings determine the exact scope of a Hunt/Triage scan so you can focus on high-value paths without over-scanning.
Policies: Hunt Location Settings (Hunt/Triage)
**Example Path Presets**
When you click **Examples** in the Included or Excluded Path Patterns picker, you can choose from these preset paths:
- All users downloads directory
- pdf files in all users documents directory
- Entire system drive
- Windows system root directory
These presets are available for both included and excluded patterns.
8. **Isolation IP/Port & Process Allow Lists**
The AIR console enables the isolation of[ **assets** ](asset-isolation)by terminating all existing connections to an asset and preventing any new connections. This isolation feature operates using a kernel-mode driver and does not rely on the Windows Firewall.
Policies: Isolation IP/Port & Process Allow Lists
In AIR Policies, the **Isolation IP/Port & Process Allow Lists** feature enables users to create custom allow lists that can be applied after an asset has been isolated by AIR. This provides more granular control over the network access and functionality of isolated assets.
Allow-list behavior is applied **bidirectionally** (inbound and outbound) for supported operating systems, helping maintain consistent containment behavior during isolation.
Users can also configure **DNS and DHCP behavior during isolation** through policy to fit operational requirements. This allows teams to keep or block these services in a controlled way while maintaining isolation.
---
# Resource Limits
> Source: https://kb.binalyze.ai/air/features/policies/resource-limits.html
AIR Responders run on production endpoints, so evidence collection must not disrupt the workloads running on them. **Resource Limits** cap how much of an asset's resources the Responder may consume while executing tasks such as evidence acquisitions, Hunt/Triage scans, disk imaging, and interACT sessions.
- **Limits apply while a task runs.** An idle Responder consumes negligible resources and does not need throttling. See [Responder Architecture Overview and Performance Analysis](../../home/architecture/responder-architecture-overview-and-performance-analysis.md) for measured footprints.
- **Limits are enforced on the asset itself.** The Responder applies each limit at the operating-system level while the task runs.
## Where to configure
Resource Limits are part of [Policies](../policies.md):
1. Go to **Settings > Policies**, create or edit a policy, and open the **Resource Limits** section.
2. Assign the policy to the organizations it should govern. When several policies match an asset, they merge in priority order, and the read-only **Default Policy** fills in any value left unset, so every task runs with a complete resource configuration.
Operators can also bypass policy values for a single task by choosing **Use Custom Options** under **Show Advanced Options** when creating the task. This requires the **Override Policy** privilege. Task types expose only the limits that are relevant to them; for example, disk imaging tasks expose bandwidth and disk I/O priority rather than CPU limits.
## Available limits
| Setting | Unit and range | Default | When the limit is reached |
| --- | --- | --- | --- |
| **CPU Limit** | Percent of the asset's total CPU capacity, 1-100 | 50% | The task is throttled and takes longer; it does not fail |
| **CPU Core Limit** | Logical core count, 0-64 (0 = unlimited) | Unlimited | Task work is confined to fewer cores; the task takes longer |
| **Memory Limit** | GiB or MiB, minimum 512 MiB (0 = unlimited) | 4 GiB | The operating system terminates the task's processes and the task is reported as failed, protecting the asset |
| **Bandwidth** | KiB/s, MiB/s, or GiB/s (0 = unlimited) | Unlimited | Evidence transfers wait for available bandwidth; nothing fails |
| **Disk Space** | Free space to preserve on the collection volume, in KiB, MiB, or GiB | Not set | Collection stops; evidence collected so far is still uploaded, and the task reports the disk-space condition |
| **Disk I/O Priority** | Lowest / Low / Medium / High | Medium | No threshold to reach; this setting adjusts I/O scheduling priority |
:::note
If **Disk I/O Priority** is not visible in your Console, it is not yet enabled for your environment.
:::
## How each limit works
### CPU Limit
The CPU limit is a percentage of the asset's **total** CPU capacity across all logical cores. On an 8-core asset, a 50% limit allows the task to use up to four cores' worth of CPU time, spread across all cores.
The Responder applies the limit to the entire task, including the collection engine and any analysis child processes. A lower limit also reduces how much work the task attempts in parallel.
When the limit is reached, the task runs slower. A CPU limit never causes a task to fail.
### CPU Core Limit
The CPU core limit restricts how many logical cores a task may use, independently of the CPU percentage. On Windows and Linux, the task is confined to the allowed number of cores. On macOS and AIX, the same limit is applied as the equivalent share of the asset's total CPU capacity.
A value of `0` means unlimited. Like the CPU limit, the core limit slows work down; it never aborts a task.
### Memory Limit
Some customers run Responders on assets where resource isolation is a security and safety requirement. The memory limit gives you a predictable ceiling on how much memory each task may use, so even rare memory spikes are bounded and cannot disrupt business-critical workloads. This is a proactive safety control rather than a fix for a common memory issue.
Resource Limits: Memory Limit setting
- The Responder enforces the limit at the operating-system level.
- The limit covers the task's entire process tree, including collection and analysis child processes.
- If a task exceeds its memory limit, the operating system **terminates the limited process tree**. The task is reported as failed with a memory-related cause, and the asset is protected from resource exhaustion.
- For interACT, the limit is applied when the session starts; a changed limit takes effect with the next session.
The default is 4 GiB. The minimum enforceable limit is 512 MiB, and `0` means unlimited.
:::note
Memory limitation is enforced on **Windows** and **Linux**. **macOS** support is planned for introduction during 2026.
:::
### Bandwidth
The bandwidth limit throttles evidence transfers. It applies to:
- Evidence uploads to every repository type (SMB, SFTP, FTPS, Amazon S3, Azure Storage, Google Cloud Storage, and others)
- Disk image streams
- interACT file transfers
- Large content downloads
Routine Responder-to-Console communication (polling, status updates) is lightweight and unaffected. In addition, a Responder uploads to a given evidence repository one file at a time, which prevents a single asset from opening many parallel streams against the same repository.
When the limit is reached, the transfer waits until bandwidth is available. A bandwidth limit never causes a task to fail; it only extends transfer time.
### Disk Space
The disk space setting reserves an amount of free space that must remain available on the volume hosting the collection directory. The Responder checks free space before collection starts and re-checks it continuously while evidence is being written.
If free space would drop below the reserve:
- Collection stops rather than filling the volume.
- Evidence collected up to that point is still packaged and uploaded.
- The task reports the disk-space condition, either as a failed collection or as partial evidence when only optional content was skipped.
Even when no reserve is configured, the collection engine keeps a built-in minimum safety margin of roughly 100 MB of free space.
:::note
The reserve protects the volume the Responder collects to on the asset. It does not verify free capacity on the destination evidence repository.
:::
### Disk I/O Priority
Disk I/O priority controls how the Responder's disk operations compete with other workloads, using each operating system's native I/O priority mechanism. It does not cap throughput.
**Medium keeps the Responder's default behavior.** The Responder already runs with a reduced I/O footprint, so Medium does not raise anything. The selected level remains in effect until another task applies a different one.
## Built-in protections
The following protections apply regardless of policy configuration:
- **Evidence-collection tasks run one at a time per asset.** Acquisitions, Hunt/Triage scans, full-text searches, and similar collection tasks queue and execute sequentially, so two heavy collections do not run at the same time. Operational task types (disk imaging, interACT sessions, isolation) have their own queues and can run alongside when requested.
- **Task processes run at reduced CPU and I/O priority**, so interactive and business workloads take precedence.
- **A minimum free-disk safety margin** of roughly 100 MB applies to every collection, even with no configured reserve.
## Tuning guidance for sensitive environments
The defaults are safe starting points for most fleets. Environments with stricter requirements, such as banking systems, critical infrastructure, and healthcare, can use the profiles below as starting points. Validate them on representative assets before rolling them out fleet-wide.
**Latency-sensitive, user-facing production systems** (branch workstations, terminal servers, trading systems, operator consoles):
- CPU Limit 25-40%, CPU Core Limit 1-2
- Disk I/O Priority Low or Lowest
- Bandwidth capped to a fraction of the site uplink (for example 10-20 MiB/s per asset on a 1 Gbps site)
- Disk Space reserve of at least 10% of the collection volume
- Schedule broad Hunt/Triage sweeps off-peak
Keep the 4 GiB memory default, or lower it toward 2 GiB only after observing typical task memory usage on that asset class.
**Shared infrastructure** (domain controllers, database servers, virtualization hosts): prioritize storage protection. Disk I/O Priority Lowest and a firm bandwidth cap matter more than the CPU value. Schedule collections off-peak where possible.
**Active incident response**: raise the CPU limit to 80-100%, leave cores unlimited, and remove the bandwidth cap. Use a dedicated response policy or per-task custom options so the change is easy to revert.
:::tip
Every limit trades speed for footprint: lower CPU, core, and bandwidth values extend task completion times.
:::
## Coexisting with EDR and antivirus
Resource Limits reduce contention with other security tooling, but they do not replace exclusions:
- Configure your EDR/AV exclusions for the Responder as described in [Responder Exception Rules](../../setup/responder-deployment/responder-exception-rules/index.md). Real-time scanning of evidence archives as they are written adds load that is outside the Responder's own accounting.
- Throttled tasks trade a short burst of activity for a longer window of low activity. If your EDR alerts on the Responder's collection behavior, tune the exclusions rather than removing limits.
## Monitoring
- **Console**: each asset's detail page shows periodic host CPU, RAM, and disk usage reported by the Responder. Task durations and statuses reveal the effect of limits; failure causes explicitly name memory and disk-space conditions.
- **Responder logs**: the Responder periodically logs its own resource snapshots while a task runs. See [Responder Architecture Overview and Performance Analysis](../../home/architecture/responder-architecture-overview-and-performance-analysis.md) for how to read them.
- **On the asset**: standard OS tools (Task Manager, `htop`, Activity Monitor) show the Responder and its task processes, which run under the configured limits and at reduced priority.
## FAQ
**Does a 50% CPU limit mean half of one core?**
No. The percentage refers to the asset's total CPU capacity across all logical cores. On an 8-core asset, 50% allows up to four cores' worth of processing, spread across all cores.
**Does the Responder consume resources when no task is running?**
No meaningful amount. Resource Limits govern task execution; the idle Responder's footprint is negligible.
**Does setting Bandwidth or Disk Space to 0 disable protection?**
`0` means unlimited for both settings. For disk space, the collection engine still preserves its built-in minimum free-space margin of roughly 100 MB.
**Can a resource limit make my task fail?**
CPU, core, and bandwidth limits never fail a task; they slow it down. The disk-space reserve stops a collection that would exhaust the volume, and the evidence collected up to that point is still uploaded.
The memory limit is the one deliberate exception: a task that exceeds it is terminated by the operating system and reported as failed. This protects the asset from memory exhaustion.
**Can several heavy tasks run at the same time on one asset?**
Evidence-collection tasks queue and run one at a time. Disk imaging, interACT, and isolation use separate queues, so an imaging task can run alongside an acquisition if you start both. Plan bandwidth and disk I/O priority accordingly.
**Are limits enforced identically on every operating system?**
Tasks stay within their limits on every supported platform. The Responder uses each platform's native controls; platform-specific notes are called out in the relevant sections above.
**Will a disk imaging task saturate my storage or network?**
Imaging tasks honor the Bandwidth limit on the image stream and the Disk I/O Priority setting. Set both when imaging assets attached to shared storage.
**Will a YARA Hunt/Triage scan spike CPU?**
The CPU limit applies to scans as well, so a limited scan runs shallower and longer instead of spiking. Narrow the scan scope with Hunt path patterns to reduce total work.
## Related pages
- [Policies](../policies.md)
- [Policies (Console Settings)](../../settings/console-settings/policies.md)
- [Responder Architecture Overview and Performance Analysis](../../home/architecture/responder-architecture-overview-and-performance-analysis.md)
- [Responder Exception Rules](../../setup/responder-deployment/responder-exception-rules/index.md)
---
# Proxy Configuration on the Console
> Source: https://kb.binalyze.ai/air/features/proxy-configuration-on-the-console.html
## Problem Statement
Web proxies like SSL/TLS Proxy, Secure Web Gateway, or similar security solutions are often deployed throughout enterprise networks. Proper proxy and SSL/TLS configuration must be implemented on all the devices behind those security solutions. SSL/TLS proxy configurations are generally configured at the operating system level. If those configurations are not in place, AIR instances behind the security device will not work properly, as they will be unable to access the required services.
## Minimum internet Connection Requirements for AIR
The AIR console instance needs internet connectivity to access certain services. If any of these connection requirements are not satisfied, the AIR console may not work properly. Minimum network connection requirements and associated definitions are listed below.
* [https://binalyze.com](https://binalyze.com/): This service is used only for update checking. The AIR instance checks this service connection availability every 12 hours. If there is an update the update notification will be shown on the user interface. If it can not access the service the updates won't be shown on the user interface.
* [https://api.binalyze.com](https://api.binalyze.com/): This service is used for the RFC3161 time-stamping feature.
* [https://license.binalyze.com](https://license.binalyze.com/): This service is used only for standard license control. AIR instance checks this service connection availability every 30 minutes. If it can not access this service 3 times in a row, the system will be locked until the next successful access.
* [https://one.binalyze.com](https://one.binalyze.com/): This service is used only for FIS license control. FIS license is charged according to the Case number. The AIR instance checks this service connection availability every 30 minutes. If it can not access this service 3 times in a row, the system will be locked until the next successful access.
* [https://cr.binalyze.com](http://cr.binalyze.com/): This service is used for downloading update files. Without this access, the update files can not be downloaded.
* [https://cdn.binalyze.com](https://cdn.binalyze.com/): This service is used for downloading installation files. With no access the installation files can not be downloaded and AIR can not be installed.
## Proxy Configuration
Web proxies, such as SSL/TLS Proxy, Secure Web Gateway, or similar security solutions, are often deployed throughout enterprise networks. In that case, appropriate proxy and SSL/TLS configuration will be required on the AIR console.
The Proxy server settings of the AIR console shown below are self-explanatory. An administrator can configure both SSL/TLS or non-SSL/TLS proxy settings on the same page. An administrator can enter the IP address, TCP port, username, and proxy server password. An administrator can also import an SSL/TLS certificate as well. PEM, DER, and PKCS formats are supported.
---
# Repository Explorer
> Source: https://kb.binalyze.ai/air/features/repository-explorer.html
The Repository Explorer centralizes access to and management of all data stored in connected external Evidence Repositories.
Once selected from the Main Menu, the Repository Explorer will reveal a secondary menu which lists the available repositories and their contents under Global or Organizational assignments.
Key benefits of this new feature include:
* A single interface to browse and manage repositories.
* Download individual files directly from Evidence Repositories to the user's machine.
* Directly upload files into existing repositories using the Upload File action button.
* Import any compatible file in the repository to mount as a ‘disk image asset’ using the new "Import Disk Image" action.
* Improved navigation between global and organization-specific repositories across Azure, AWS S3, Google Cloud Storage, SFTP, and SMB.
### Using Repository Explorer
New evidence repositories can be added by selecting the Add New action button.
Repository Explorer: Azure Blob view.
Individual evidence repositories are listed in the table view and can be explored by selecting the link embedded with the repository name.
In the example below, you can see that the Amazon S3 evidence repository has been selected, and within that blob, an area named 'CMG-Test' is displaying its contents.
Repository Explorer: Amazon S3 contents
Selecting the **Action** icon next to each item in the repository reveals two options:
* **Download**: Allows the user to download the selected item to the local machine on which they are working.
* **Import Disk Image**: Enables users to import a disk image file into the File Explorer, where it can be browsed and examined in a mounted state.
Repository Explorer: Actions
---
# Responder Proxy Support
> Source: https://kb.binalyze.ai/air/features/responder-proxy-support.html
## Problem Statement
The AIR responder needs to access certain network services to work properly. If any of these connection requirements are not satisfied, the AIR responder may not work properly. AIR responders use the network connection provided by the operating system. If some kind of proxy service is used in the enterprise network, the AIR responder probably can not detect the proxy configuration hence can not connect to the required services and does not work properly.
## AIR Responder Proxy Support
The updated version of AIR responders automatically detects the proxy server configuration on the asset and modifies the network connection methods to access required services. AIR responders read the proxy configuration settings where it is located according to the operating system, Windows, Linux and macOS are supported operating systems.
Minimum network connection requirements and associated definitions are listed below.
### AIR Responder to AIR Console connection requirements
* TCP/IP 80, 443 HTTP/HTTPS , 4222 NATS for Real-Time Task assignments, 443 WebSocket for interACT
The AIR responder communicates with the AIR console over 80 and 443 with HTTP/HTTPS. Therefore, TCP 80,443 HTTP/HTTPs ports and protocols must be open and accessible. In order for Real-Time task assignments to work, TCP/IP 4222 port must open and accessible. Similarly, in order for interACT to work, the WebSocket protocol must be configured over HTTPS.
### AIR Responder to Evidence Repository connection requirements
If the collected evidence needs to be uploaded to a remote domain, the responder must be able to access these remote domains via HTTP/HTTPs, SMB, SFTP, FTPS, and Amazon, Azure, and Google Cloud Storage domains, depending on the configuration previously defined in the evidence repository. If there is no support on the proxy server during the connection phase of protocols such as SMB, SFTP, FTPS, the Direct connection method is tried.\
In addition, HTTP/S Proxy connections are made by establishing a Tunnel with the HTTP Connect method. In addition to HTTP Proxies, SOCKS5 Proxy type is also supported.
---
# Timeline
> Source: https://kb.binalyze.ai/air/features/timeline.html
The Timeline in AIR 5.0+ has been completely redesigned and embedded directly into the Investigation Hub, providing investigators with a powerful, unified view of all timestamped evidence. This enhancement eliminates context switching, accelerates analysis, and enhances collaboration.
[**See It in Action**](https://app.storylane.io/share/xreui6ulo20y)
:::caution
The new Timeline is only available for cases created in AIR v5 and later. Timelines generated in earlier versions cannot be migrated or upgraded to this new format.
:::
### Key Timeline Features
* **Automatic Event Generation**\
Every piece of evidence with a timestamp automatically generates a timeline event. There are no longer restrictions based on asset type or data source.
* **Integrated in the Investigation Hub**\
The Timeline is now a core part of the Investigation Hub, rather than a separate feature. Global filters, case filters, and advanced filters work seamlessly across all views.
* **Advanced Filtering**\
Analysts can apply both global filters (date ranges, assets, evidence types) and evidence-specific filters (e.g., IP addresses, paths, user IDs). This allows precise targeting of relevant events without visual clutter.
* **Relative & Nearby Time Filtering**\
From any timestamp in evidence or findings, analysts can quickly pivot to surrounding events (e.g., “5 minutes before and after”), making causality and event sequencing clearer.
* **Interactive Timeline Bar**\
A zoomable timeline bar with density maps highlights periods of activity. Analysts can navigate quickly, change granularity (hour, day, month, year), and toggle findings/flags overlays.
* **Timeline Table Enhancements**\
A redesigned event table with infinite scrolling and expandable details lets analysts flag, annotate, or promote events to findings. All actions are synchronized across the platform.
* **Collaboration Features**\
Notes, flags, and findings applied in the Timeline are reflected across the entire Investigation Hub, supporting team-based workflows and ensuring consistent visibility.
* **Export Capability**\
Timeline tables can be exported to CSV with optional evidence metadata in JSON, enabling reporting, compliance, and cross-platform analysis.
## Using the Timeline
The Timeline is embedded directly within the Investigation Hub, providing analysts with a complete, interactive view of all timestamped evidence, unrestricted by asset type or data source. This walkthrough will guide you through using the new Timeline effectively in your investigations.
### Accessing the Timeline
1. Open any case in the **Investigation Hub**.
2. Select the **Timeline** tab from the secondary.
3. The Timeline view loads automatically with:
* **Timeline bar** (overview of events, zoomable).
* **Timeline table** (detailed events with metadata).
* No filters, Findings, or Flags will be applied in this initial view.
Timeline: Initial view
### Navigating the Timeline
* **Zooming**: The timeline supports several zoom options for flexible navigation:
* **Zoom buttons** – Switch between **Year, Month, Day, or Hour** views.
* **Drag-to-zoom** – When the zoom button (located to the right of the chart) is active, drag and drop across the chart to define the exact area to focus on.
* **Shift + scroll** – Hold **Shift** while scrolling to zoom in or out with finer control.
* **Mini-map** – Compress or expand the visible area in the mini-map to quickly adjust the level of detail. This provides immediate visibility into data density across the timeline, helping analysts effectively explore large time spans and reduce visual fatigue.
* **Cursor sync**: Clicking on the bar updates the table; the first row always matches your selected point.
### Timeline Enrichment Options
Below the timeline chart, three toggle switches allow you to customize and enrich the view:
* **Sync with Table** – Ensures the evidence table reflects only the focused time range when zooming, panning, or changing dates on the timeline bar.
* **Display Findings** – Adds a dedicated chart that highlights findings separately from other events (area 2 in screenshot below).
* **Display Flags** – Displays flag icons directly on the main timeline chart (area 1 below), indicating the location of flagged items.
These options help analysts quickly correlate evidence, findings, and flagged events within the same timeline context.
### Applying Filters
1. **Global filters** (e.g., Assets, Evidence Category, Finding Type) apply to the entire Investigation Hub, including the Timeline**.**
2. **Timeline bar filters** refine the visual display via zoom functions.
3. **Advanced filters** apply at the table level, including evidence-specific fields (e.g., IP addresses, file paths, user IDs). Constructing filters, whether basic or complex, is straightforward, as shown below:
Timeline: Constructing advanced filters
### Using Relative Time Filtering
Clicking on a timestamp opens the _Filter by Time_ dialog, which provides quick and precise options to refine the investigation window:
* **Quick Filters**: Instantly narrow results to events that occurred _before_, _after_, or _at_ the selected timestamp.
* **Nearby (+/-)**: Define a time window around the selected timestamp (e.g., ±1 second, ±5 minutes, ±7 days). This helps capture surrounding activity that may be contextually relevant to the investigation.
* **Custom Range Preview**: The dialog automatically displays the calculated “from” and “to” time boundaries based on your selection.
* **Result Options**:
* **Show results in evidence table** – keeps the filtered evidence within the current table view for immediate analysis.
* **Navigate to the Timeline** – pivots the same filtered view into the Timeline for a broader chronological context.
**Use Case Example:**\
If an analyst identifies a suspicious process execution at _15:43:36_, they can quickly pull in all related evidence from one second before to one second after. This makes it easy to uncover precursor events or immediate follow-on activity without manually building time-based filters.
This relative filtering approach complements absolute time filters, providing flexibility for both **precision pivoting** and **contextual timeline exploration**.
Timeline: Relative Time Filtering
### Timeline search box
The **search box in the Timeline evidence tables** allows analysts to quickly refine results using keywords, exact phrases, exclusions, and logical operators. You can combine multiple terms with '`OR'`, and exclude terms with a leading minus sign (e.g., `-anonymous`), or search for exact matches using quotation marks (e.g., `"logon failure"`). This advanced search capability enables more precise filtering of evidence, allowing investigators to surface only the most relevant events within large datasets.
### Timeline Preferences Panel
The timeline bar includes several layout and display options to help analysts tailor the view to their investigation. You can switch between **bar** and **line chart** modes, show or hide empty ranges to create a more compact timeline, and toggle the cursor for precise navigation. These preferences make it easier to adapt the visualization for complex investigations or when working with large volumes of evidence.
Timeline: Preferences Panel
### Show Timeline Events
* Within the Investigation Hub, selecting an evidence item in the evidence table opens the **Details** panel. Here, the **Show Timeline Events** option reveals all timestamps associated with that item. For example, if the artifact includes a Last Modified, Start Time, and End Time, each of these values will be displayed in this view, and these additional timestamps can themselves be subjected to further relative timestamp filtering.
Timeline: Show Timeline Events
### Flags, Findings, and Collaboration
* Use the **toggle controls** in the Timeline bar to show or hide flagged events and findings.
* Flag or annotate events directly in the table; all changes synchronize across the Investigation Hub.
* Findings promoted from Timeline events automatically appear in the Findings view for team visibility.
***
### Exporting Timeline Data
* Select **Export** from the Timeline table.
* Choose CSV export with UTC or local time.
* Optionally include detailed evidence metadata in JSON format.
* Use exports for compliance reporting or importing into external systems.
Timeline: Export options
## Timeline (pre version 5.0)
:::caution
The legacy Timeline (used in AIR versions prior to 5.0) will be removed from the platform with the release of **AIR 5.1**, scheduled for mid-September 2025. The information in the following section is provided temporarily to support customers during their transition to the new, fully integrated Timeline within the Investigation Hub. This new version offers a more advanced, comprehensive, and streamlined experience for timeline analysis.
:::
### One-Click Timeline Creation for Swift Collaboration
The traditional way of creating timelines is collecting evidence, parsing it, and combining the results using CSV files. Time is a critical factor in investigations, and with the 'One-click' Timeline creation feature, investigators can initiate and collaborate on timelines with just a click. This not only expedites the process but also facilitates remote and multi-user collaboration within a single timeline.
AIR comes to the rescue to solve this problem. You can easily create timelines for multiple assets in parallel and view the results on a collaborative, web-based user interface, where you can tag/flag each piece of evidence.
Timelines can be created from a single asset and can be easily enriched using additional evidence, such as:
* Additional Assets
* CSV Files
* Milestones
* Off-Network Acquisitions
All flagged/tagged evidence is listed in the "Flagged" section, making it easy to create reports before finalizing an investigation.
### Building 'Super-Timelines' on the Fly
Flexibility is at the core of effective investigations. With Timeline Analysis, investigators can add more assets at any time to an existing timeline, creating what we like to call 'super-timelines.' This dynamic approach enables the consolidation of diverse assets into a comprehensive timeline for a holistic view of the investigation.
Existing and new Timelines can be created by selecting "Timelines" from the Main Menu.
To create a new Timeline, select the "+Add New" button at the top of the page.
The New "Timeline" then gives you the option to 'Create with selected assets' or 'Create an empty timeline and add evidence later'
You can now search for and select the assets desired for the Timeline.
Having selected the assets to include in the Timeline, you now have to define the task by:
1. Giving the Timeline a name.
2. Allocating it to a Case.
3. Selecting a Timezone
4. Providing a description (Optional)
### Seamless Integration of Offline Assets and CSV Datasets
Timeline Analysis goes a step further by allowing the import of offline asset acquisitions or CSV datasets into the same timeline. This ensures that investigators can amalgamate a wide range of data sources, enriching the investigative process.
AIR now presents you with three options for adding data to your new Timeline:
1. Add an asset
2. Add an off-network asset
3. Import a CSV file
Timeline: Select data type to add (Legacy)
### Behind the Scenes: Trimmed-Down Evidence Acquisition
While Timeline Analysis presents a user-friendly interface, it is supported by a powerful evidence acquisition mechanism behind the scenes. This mechanism selectively includes 'timestamped evidence,' ensuring a concise and relevant timeline. By default, this includes:
* All evidence with a timestamp property
* Browsing history
* AMCache
* SRUM data
### Precision Flagging for Enhanced Evidence Management
Timeline Analysis introduces the concept of multiple flags for evidence items. Investigators can flag items to highlight their significance, and all flagged items are conveniently listed in the 'Flagged Evidence' section. This section can be filtered, providing a focused view of critical evidence.
### Enrich Timelines with Manually Inserted 'Milestones'
Significant events often mark investigations, and Timeline Analysis acknowledges this by allowing investigators to manually insert 'milestones'. These milestones serve as markers for noteworthy occurrences during the investigation.
In conclusion, Timeline Analysis is not just a feature; it's a comprehensive solution for investigators seeking precision, flexibility, and collaboration in their digital investigations. With 'One-click' Timeline creation, the ability to build 'super-timelines,' integration of diverse data sources, manual milestones, streamlined reporting, and precise flagging, investigators can confidently navigate the complexities of digital evidence.
---
# Tornado
> Source: https://kb.binalyze.ai/air/features/tornado-preview-version/index.html
## Welcome to Tornado
Tornado: Welcome
**Tornado** is a standalone desktop application designed to simplify and enhance evidence collection from cloud platforms, such as Google Workspace and Microsoft Office 365.
**Tornado** enables investigators to effortlessly collect critical artifacts, such as email records, user access logs, and administrative actions—key elements in Business Email Compromise (BEC) investigations. While it already supports two platforms, additional cloud platforms and services will be supported in the future.
:::caution
Tornado availability and access path can vary depending on your deployment model, licensing, and rollout stage.
For current access and enablement guidance, contact your Binalyze representative or use the [Tornado product page](https://www.binalyze.com/products/tornado).
:::
### **Key Features**
**1. Multi-Platform Support**
* **Microsoft Office 365**
* **Google Workspace**
* **Future platform expansions are planned**
**2. Collection Capabilities**
* **Google Workspace Data Types**
* **Microsoft 365 Data Types**
***
### **Core Platform Features**
**1. Evidence Collection Interface**
* User-friendly and intuitive design
* Precise and reliable digital evidence gathering
* Streamlined collection process for efficiency
**2. Investigation Benefits**
* Tailored for Business Email Compromise (BEC) investigations
* Rapid evidence collection
* Optimized investigation workflows
* Enhanced incident response capabilities
**3. Data Analysis Options**
* Export data to SQLite for detailed analysis
* Seamless integration with AIR
* Connectivity with the Investigation Hub for advanced use cases
***
### **Technical Architecture**
**1. Resource Monitoring**
* Built-in resource tracking to ensure efficient performance
* Real-time monitoring of disk usage and system statistics
* Logging for system and performance insights
**2. Security Features**
* Encrypted communication protocols for data protection
* Secure token handling for authentication
* Authorization controls to manage access rights
* Comprehensive access management for user accounts
***
### **Use Cases**
**1. Email Investigations**
* Analyze communication patterns
* Review email content and attachments
* Examine settings and configurations
**2. Access Analysis**
* Monitor login activities and unusual behaviors
* Conduct thorough security audits
* Track permission changes
**3. Administrative Reviews**
* Investigate system configuration changes
* Review policy modifications
* Track role assignments and device management
**4. Compliance Monitoring**
* Verify data retention policies
* Ensure the enforcement of organizational policies
* Validate access controls and perform audit log reviews
***
#### **Getting Started**
**1. Installation**
* Free standalone desktop application
* Quick and simple setup process
**2. Authentication**
* Platform-specific authentication methods
* Secure token management for enhanced security
* Support for multiple accounts
**3. Collection Process**
* Select data sources and configure collectors
* Define specific time ranges for targeted collection
* Monitor progress in real-time
**4. Data Export**
* Export collected data in SQLite format for analysis
* Integration-ready for seamless workflows
* Prepared for further investigation and reporting
***
#### **Summary**
Tornado is a comprehensive cloud forensics solution that combines user-friendly functionality with powerful evidence-collection capabilities. Designed to simplify investigations across major cloud platforms, it offers robust tools to enhance security, support compliance, and deliver actionable insights.
---
# Getting Started with Tornado
> Source: https://kb.binalyze.ai/air/features/tornado-preview-version/getting-started-with-tornado/index.html
#### 1. Initial Configuration
* Launch the Tornado application
* Accept the license agreement
* Configure initial settings:
* **Settings**
* **Parselets**
* **Dark Mode** (switch between light and dark modes)
* **Send Feedback** (provide Tornado feedback to Binalyze)
* **Documentation** (links to Tornado documentation)
If you are an existing AIR customer using Binalyze Tornado, you can direct your collected data to the Investigation Hub by providing the **AIR Console URL** and an **AIR API Token** in the Settings window during setup.
API Tokens are generated in the AIR console at: **Integrations > API Tokens -** [learn more about the AIR API here](../../api/).
Getting Started with Tornado: Generate API Tokens in the AIR console
If you are a non- AIR customer, you can skip this section. In this case, the collected data will be available for download as an SQLite database, which you can analyze using your preferred tools or viewer.
## HTTP Trace
HTTP TRACE is a diagnostic HTTP method that echoes the full request received by the server back to the client. It is used to help identify issues such as header manipulation. For more details, visit the Tornado Troubleshooting and Feedback page.
Getting Started with Tornado: HTTP Trace enabled
## Parselets
Clicking on **Parselets** opens the Tornado Parselet window, where you can browse and select the specific parselet you wish to execute. Currently, Tornado supports Google Workspace and Microsoft 365:
Getting Started with Tornado: Parselets
### Google Workspace Configuration
Getting Started with Tornado: Configuration
In the Google Workspace Configuration window, you can sign in using an individual user's account or Service Account credentials, depending on your preferred authentication method. For more details about these two login methods, please visit our "Accessing Google Workspace" **page**.
When choosing to sign in with Google as a regular user, you will be directed to the **Sign in with Google** window, where you can authenticate using your standard Google account credentials.
Getting Started with Tornado: Sign in with Google
**Setting Up Your Collection**
From this point, the Tornado wizard will guide you step by step through the process of configuring your collection:
### Login
Getting Started with Tornado: Google Workspace Configuration
### Date range picker
There is a Date range picker to allow users to narrow the focus of their investigations:
Getting Started with Tornado: Date rage selection in Tornado
### Collectors
The collectors available to you in Tornado depend on the type of account used to log in. Using a **Service Account** provides access to a wider range of collectors. For detailed information, please refer to the [Tornado Collectors page](./#collectors).
Getting Started with Tornado: Collectors
:::tip
**Gmail History & History IDs:** Learn more about this here: [**Gmail History Collection in Tornado**](./#collectors)
:::
To help investigators narrow their focus, certain collectors come equipped with built-in filters. These filters, as shown above, allow for more precise data collection, enabling targeted investigations and reducing unnecessary data collection.
### Process
Selecting 'Run' takes the user to the 'Process' stage in the Tornado wizard.
### Post Execution
If the collection is complete and the user does not have access to AIR with an API Token, a link to the file path of the collected data will still be displayed. This ensures that the collected data remains accessible for further analysis:
Getting Started with Tornado: Post Execution
In the specified location, the user will find the `Case.ppc` file, which is a ZIP archive. Once unzipped, it contains a SQLite database that can be opened and viewed using your preferred DB/SQLite browser:
Getting Started with Tornado: Case.ppc
For users with access to AIR, you will need to select a Case (e.g., in the screenshot, the case is named **TT-Demo-Script**) and then click the **'Send to Investigation Hub'** button. After a few moments, Tornado will provide a link to the Case in the Investigation Hub, where you can inspect the collected data:
Getting Started with Tornado: Send to Investigation Hub
In the screenshot below of the **Investigation Hub**, you can see how GWS collections are organized by collector type in the secondary menu. The table and details windows are displayed in the standard **Investigation Hub** layout, providing a consistent and intuitive user experience.
Getting Started with Tornado: Tornado data presented in the Investigation Hub
### Troubleshooting
#### Common Installation Issues
1. **WebView2 Installation**
* Automatic prompt if missing
* Follows standard Windows installation
* Restarts automatically after installation
* No manual intervention required
2. **macOS Security Blocks**
* Error: "App cannot be opened"
* Solution: Allow in Security & Privacy
* Check Gatekeeper settings
3. **Linux Permission Issues**
`# If permission denied chmod +x ./tornado # If binary not found export PATH=$PATH:/path/to/tornado`
### Next Steps
#### 1. First Launch
* Start the Tornado application
* Complete initial setup
* Familiarize with interface
#### 2. Authentication Setup
* Prepare cloud service credentials
* Configure authentication methods
* Test connectivity
#### 3. Begin Collection
* Select data sources
* Configure collectors
* Start your first collection
Remember: Tornado is distributed as a portable application that requires minimal setup. On Windows, any required components, such as WebView2 Runtime, are automatically installed during the first launch.
---
# Tornado Terminology
> Source: https://kb.binalyze.ai/air/features/tornado-preview-version/getting-started-with-tornado/tornado-terminology.html
## Core Terms
### **Collection**
The process of gathering digital evidence from cloud platforms. A collection refers to a single operation that retrieves specific data types from selected accounts.
### **Case**
A logical container that holds one or more collections and their associated evidence. Cases help organize investigations systematically.
### **Evidence**
Digital data collected from cloud platforms, stored in an **SQLite database** format for analysis and export.
***
## Platform Terms
### **Google Workspace (GWS)**
* **Mail Data**: Emails, attachments, and settings.
* **Drive Activities**: File sharing and access logs.
* **Reports**: Administrative and security logs.
* **Admin Data**: System configurations and policies.
### **Microsoft 365 (O365)**
* **Mail Data**: Exchange emails and metadata.
* **Entra Data**: Sign-in and audit logs (formerly Azure AD).
* **Admin Actions**: System changes and configurations.
***
## Interface Elements
### **Collectors**
Components designed to gather specific types of data:
* **Mail Collector**
* **Drive Activity Collector**
* **Reports Collector**
* **Admin Collector**
### **Collection Modes**
* **Normal User**: Collection using standard user credentials.
* **Admin/Service**: Collection using administrative or service account access.
### **Progress States**
* **Pending**: Collection is awaiting start.
* **Running**: Collection is in progress.
* **Completed**: Collection finished successfully.
* **Failed**: Collection encountered errors.
***
## Technical Terms
### **HTTP Trace**
Detailed logging of API communications, used for troubleshooting and debugging.
### **SQLite Database**
The storage format is used for organizing and exporting collected evidence.
### **OAuth 2.0**
A secure authentication protocol is used to access cloud platforms during collection.
:::caution
During the public review period for Tornado, the **GWS OAuth2 mode is temporarily disabled.** Once the application is approved, this feature will be re-enabled, and you will be able to use it seamlessly. We will announce publicly as soon as the review process is complete and the feature is available.
:::
***
## Common Actions
### **Authentication**
The process of logging into cloud platforms to enable data collection.
### **Export**
Saving collected evidence in an **SQLite database** format for use outside the system.
### **Collection Configuration**
Customizable settings and parameters that define the scope and type of data to be collected.
---
# Tornado Collectors
> Source: https://kb.binalyze.ai/air/features/tornado-preview-version/tornado-collectors/index.html
### **Microsoft Office 365 (O365)**
**Mail Data**
* **Mail Collection**: Collects users' emails, including sent, received, and stored messages, to analyze communication patterns and user preferences.
**Entra Data**
* **Entra Sign-In Logs**: Detailed logs of user sign-in activities, including timestamps, IP addresses, device information, and authentication status, for monitoring and analyzing access behavior.
* **Entra Audit Logs**: Records of administrative actions and configuration changes within the Microsoft Entra environment, providing insights into system modifications and security settings.
***
### **Google Workspace (GWS)**
#### **Mail Data**
* **Mail Collection: This feature collects users' emails, including sent, received, and stored messages, to analyze communication patterns and preferences.**
* **Email History Information**: Provides detailed records of sent and received emails.
* **Label Usage Information**: Tracks how users organize their emails using labels.
* **Email Settings Information**: Captures email account settings, including signatures, filters, and auto-responders.
:::caution
**Gmail History Collection in Tornado**
When selecting **'Gmail History'** as the data type for a collection in Tornado, you’ll be required to enter **History IDs**. These are unique markers provided by Gmail that indicate the starting point for collecting changes in a mailbox.
**What Are History IDs?**
* History IDs are part of Gmail’s change tracking system, used to fetch updates like email additions, deletions, or modifications.
* They specify the point in the mailbox history from which the collection will start.
**What If I Don’t Know the History ID?**
* If you’re unsure of the History ID, Tornado won’t be able to proceed with the Gmail History collection. This is because Gmail requires a valid History ID to determine where to start collecting data.
* For most users, History IDs are not something you’ll commonly know or have readily available.
**How to Find a History ID:**
* **From Previous Collections**: Tornado logs the last History ID from completed Gmail collections. You can find this in the case details or logs.
* **Using the Gmail API**: Advanced users can query the Gmail API (e.g., `users.history.list`) to fetch the latest History ID.
**Best Practices:**
* For initial collections or if you don’t need incremental updates, consider selecting other Gmail data types, such as **'Mail Data'**, which does not require a History ID.
:::
#### **Drive Activities**
* **Drive Usage Activities: This feature tracks activities on Google Drive, such as file sharing, editing, and viewing history.**
#### **Reports Data**
* **Access Transparency Reports**: Logs of access actions performed through Google's systems for transparency.
* **Admin Activity Reports**: Records of admin actions and activities.
* **Calendar Usage Reports**: Provides data on Google Calendar usage and event details.
* **Chat Messaging Data**: Analyzes user interactions and messaging habits in Google Chat.
* **Browser Usage Reports**: Tracks activity and usage data from the Chrome browser.
* **Context-Aware Access Reports**: Reports on conditional access settings, such as device or location-based access.
* **Data Studio Reports**: Visualizations and insights created using Google Data Studio.
* **Drive Storage Reports**: General reports on storage usage and file-sharing activities in Google Drive.
* **Google Cloud Platform Usage Reports**: Logs of usage and activity on Google Cloud Platform (GCP).
* **Google+ Usage History**: Historical data for the discontinued Google+ service.
* **Group Usage Information**: Data on usage and interactions in Google Groups.
* **Enterprise Group Usage Reports**: Advanced insights into enterprise-level group usage.
* **Jamboard Activity Information**: Tracks activities related to Jamboard devices and software.
* **Keep Notes Information**: Analyzes note-taking and list management habits in Google Keep.
* **User Login Reports**: Logs of user account login and logout activities.
* **Google Meet Meeting Reports**: Participation and usage details for Google Meet meetings.
* **Mobile Usage Reports**: Usage data for Google Workspace applications on mobile devices.
* **Policy and Rules Reports**: Tracks policies and rules applied in Google Workspace.
* **SAML Authentication Reports**: Logs of SAML-based authentication processes.
* **Token Usage Reports**: Insights into OAuth tokens and their activities.
* **User Account Reports**: General reports on user accounts.
* **Archive and Data Retention Reports**: Insights into Google Vault usage for archiving and data retention.
#### **Admin Data**
* **Chrome OS Device Information**: Management data for Chrome OS devices.
* **Mobile Device Management Information**: Tracks data from mobile device management (MDM) systems.
* **Role Definition Information**: Details roles and permissions within Google Workspace.
* **Role Assignment Information**: Tracks roles and responsibilities assigned to users.
* **User Information**: Provides detailed information about user accounts and profiles.
* **Domain Management Information**: Logs of domains defined under Google Workspace.
***
---
# Access Modes in O365
> Source: https://kb.binalyze.ai/air/features/tornado-preview-version/tornado-collectors/access-modes-in-o365/index.html
When conducting cloud forensics with Binalyze Tornado for Office 365, you have two authentication methods available. Each method provides different levels of access and capabilities for data collection.
#### 1. Normal User Login
**What is it?**
* Basic user authentication method
* Uses individual Office 365 account credentials
* Perfect for single-user investigations
* Limited to personal data access
**When to use?**
* Investigating a specific user's activities
* Collecting personal mailbox data
* Analyzing individual Teams' communications
* Personal OneDrive file investigations
#### 2. Admin Consent Login
**What is it?**
* Advanced authentication method
* Requires administrative privileges
* Organization-wide access
* Includes all normal user capabilities plus administrative features
**When to use?**
* Organization-wide investigations
* Security incident response
* Compliance audits
* Multi-user data collection
### Available Collectors by Access Mode
#### Normal User Login Collectors
**Email Related Collectors:**
* **Mail Collector**
* What it collects: Emails, attachments, and message metadata
* Use case: Investigating email communications
* Example: Collecting sent/received emails for analysis
* **Mail Folder Collector**
* What it collects: Email folder structure and organization
* Use case: Understanding email organization patterns
* Example: Analyzing custom folder setups
* **Mail Rule Collector**
* What it collects: Email rules and filters
* Use case: Identifying automated email handling
* Example: Discovering forwarding rules
**Teams Related Collectors:**
* **Teams Collector**
* What it collects: Teams channel data and files
* Use case: Team collaboration analysis
* Example: Investigating shared content
* **Teams Chat Collector**
* What it collects: Direct messages and chat history
* Use case: Communication pattern analysis
* Example: Reviewing private conversations
**Additional Service Collectors:**
* **OneDrive Collector**
* What it collects: Cloud storage files and metadata
* Use case: File activity investigation
* Example: Tracking file sharing history
* **Calendar Collector**
* What it collects: Calendar events and meetings
* Use case: Activity timeline analysis
* Example: Mapping user schedules
#### Admin Consent Login Collectors:
* **All Normal User Collectors**
* Access to all collectors listed above
* Can be applied to any user in the organization
* Broader scope of data collection
**Administrative Collectors:**
* **Entra Sign-In Collector**
* What it collects: User authentication logs
* Use case: Security monitoring
* Example: Detecting suspicious login attempts
* **Entra Directory Audit Collector**
* What it collects: Azure AD audit logs
* Use case: Administrative action tracking
* Example: Monitoring permission changes
***
#### **Key Differences Between Access Modes**
| **Feature** | **Normal User Login** | **Admin Consent Login** |
| -------------------- | -------------------------------------------------------------------- | ------------------------------------------------------------------------------- |
| **Access Scope** | Personal data only | Organization-wide data |
| **Data Collection** | Limited to authenticated user | All users and administrative data |
| **Best For** | Individual investigations | Enterprise-level investigations |
| **Advantages** | Simple, user-specific analysis | Complete visibility of organization data |
| **Limitations** | Cannot access other users' data | Requires admin credentials |
| **Use Case Example** | "I need to investigate my own email communications from last month." | "I need to investigate all email communications within the finance department." |
***
---
# O365 license types
> Source: https://kb.binalyze.ai/air/features/tornado-preview-version/tornado-collectors/access-modes-in-o365/o365-license-types.html
When investigating incidents in **Microsoft 365 (M365)**, the type of **license** a user has will impact the data that can be collected, searched, and analyzed. Here’s a high-level breakdown of **M365 license types** and their impact on forensic investigations:
***
#### **1. Microsoft 365 Business Licenses**
* **Common for:** Small-to-medium businesses (SMBs)
* **Plans:** Business Basic, Business Standard, Business Premium
* **Impact on Investigations:**
* **Limited access to security logs**: These licenses don’t provide **advanced** audit logs or long retention periods.
* **No access to advanced compliance features**: Features like **Advanced eDiscovery** and **Defender for Office 365** (which help track phishing, malware, etc.) are missing.
* **Basic mailbox and SharePoint logging**: You can access basic logs via Microsoft Purview (Audit Logs), but retention is limited.
***
#### **2. Microsoft 365 Enterprise Licenses**
* **Common for:** Large organizations with security & compliance needs
* **Plans:** E1, E3, E5
* **Impact on Investigations:**
* **E1:** Limited logs, no Advanced Audit or eDiscovery. Basic logging is available via Microsoft Purview.
* **E3:**\
**Audit Logs (Standard)** – 90-day retention\
**Basic eDiscovery** – Can search and export data\
**No Advanced eDiscovery or long-term audit log retention**
* **E5 (Best for Forensics):**\
**Advanced Audit Logs** – Retains logs up to 1 year (or 10 years with add-ons)\
**Advanced eDiscovery** – Can search, tag, and hold data for investigations\
**Microsoft Defender integration** – Helps track compromised accounts, malware, and other threats.
***
#### **3. Microsoft 365 Compliance & Security Add-ons**
* **Common for:** Organizations with strict security needs
* **Examples:**
* **Microsoft Purview Compliance (Add-on to E3)** → Enables **longer audit log retention, more search capabilities**
* **Microsoft Defender for Office 365 (P1/P2)** → Adds **email and threat protection logs**
* **Defender for Endpoint (E5)** → Provides **device forensics** beyond M365 (integrates with SIEM/XDR)
***
#### **Key Takeaways for Investigations**
**E5 is the best license** for digital forensics (Advanced Audit, eDiscovery, Defender tools)\
**E3 is decent**, but you’ll have shorter audit log retention (90 days) and no Advanced eDiscovery.\
**Business licenses are very limited**, making forensic investigations harder
If you're dealing with **an investigation**, check the license of the affected user—this will determine what **logs, emails, SharePoint data, and Defender alerts** you can retrieve.
---
# O365 Collector Prerequisites
> Source: https://kb.binalyze.ai/air/features/tornado-preview-version/tornado-collectors/access-modes-in-o365/o365-collector-prerequisites.html
Before using the Tornado O365 Collector, you need to configure the appropriate access permissions in your Microsoft 365 tenant. There are two access methods available, each with different requirements and capabilities.
## Organization-Wide Access (Recommended)
This is the best method for full automation. It allows Tornado to collect organization-wide data, including user directories, sign-ins, and audit logs—without requiring individual user login.
### Requirements
1. You must be a **Global Administrator** in your Microsoft 365 tenant.
:::note
Due to the use of Microsoft Graph, this access level is restricted by Microsoft and cannot use lesser privileges.
:::
## User-Based Consent (Limited Access)
Allows Tornado to access only the signed-in user's data.
### Requirements
1. A valid Microsoft 365 work account.
2. Your organization must allow users to consent to applications.
:::caution
If user consent is disabled in your organization, follow the steps below to enable it, or use the Admin Consent Workflow.
:::
## How to Enable User Consent
If user consent is disabled in your organization, a Privileged Role Administrator can enable it:
1. Sign in to the [Microsoft Entra Admin Center](https://entra.microsoft.com).
2. Navigate to: **Identity** → **Applications** → **Enterprise applications** → **Consent and permissions** → **User consent settings**
3. Under **User consent for applications**, select one of the following:
* "Allow user consent for apps from verified publishers..." *(recommended)*
* "Allow user consent for selected permissions" *(for more granular control)*
4. Click **Save**.
O365 Collector Prerequisites: User consent settings
:::note
For more details, see [Configure user consent (Microsoft Docs)](https://learn.microsoft.com/en-us/entra/identity/enterprise-apps/configure-user-consent).
:::
## Enable Admin Consent Workflow
This feature allows **non-admin users** to request access to Tornado when the app requires permissions they cannot approve themselves.
### Requirements
You must be a **Global Administrator** to configure this workflow.
### Steps to Enable Admin Consent Workflow
1. Go to the [Microsoft Entra Admin Center](https://entra.microsoft.com).
2. Navigate to: **Identity** → **Applications** → **Enterprise applications** → **Consent and permissions** → **Admin consent settings**
3. Configure the following options:
| Setting | Recommended Value |
|---------|-------------------|
| Users can request admin consent to apps they are unable to consent to | **Yes** |
| Who can review admin consent requests | Select admins, users, groups, or roles |
| Email notifications | **On** |
| Request expiration reminders | **On** |
| Consent request expires after (days) | e.g., **3 days** |
4. Click **Save**.
:::tip
After this setup, if a non-admin user tries to use Tornado, they will be prompted to send a request to the designated reviewers. Reviewers will receive an email and can approve or reject the request.
:::
## Workflow: User Consent Request Process
Once Admin Consent Workflow is enabled, non-admin users can request access to Tornado:
### 1. Sign in to Tornado
The user initiates sign-in to Tornado using their Microsoft 365 credentials.
O365 Collector Prerequisites: Sign in to Tornado
### 2. Request Access
If the user cannot consent to the required permissions, they are prompted to request access from an administrator.
### 4. Review and Approve Request
Designated reviewers receive an email notification and can approve or reject the consent request from the Microsoft Entra Admin Center.
## Security & Management
You can monitor or revoke Tornado's permissions at any time via:
**Microsoft Entra Admin Center** → **Enterprise applications** → **Binalyze Tornado**
:::note
All data access is controlled via OAuth2 and Microsoft Graph scopes.
:::
## Resources
* [Configure Admin Consent Workflow (Microsoft Docs)](https://learn.microsoft.com/en-us/entra/identity/enterprise-apps/configure-admin-consent-workflow)
* [Configure User Consent Settings (Microsoft Docs)](https://learn.microsoft.com/en-us/entra/identity/enterprise-apps/configure-user-consent)
* [Microsoft Entra Admin Center](https://entra.microsoft.com)
* [Overview of permissions and consent (Microsoft Docs)](https://learn.microsoft.com/en-us/entra/identity-platform/permissions-consent-overview)
* [Grant tenant-wide admin consent (Microsoft Docs)](https://learn.microsoft.com/en-us/entra/identity/enterprise-apps/grant-admin-consent)
---
# Accessing Google Workspace
> Source: https://kb.binalyze.ai/air/features/tornado-preview-version/tornado-collectors/accessing-google-workspace/index.html
Two authentication methods are available for conducting cloud forensics with Binalyze Tornado for Google Workspace. Each provides different levels of access and data collection capabilities.
***
### **1. Normal User Login**
**What is it?**
* Basic user authentication method
* Uses individual Google Workspace account credentials
* Ideal for single-user investigations
* Limited to personal data access
**When to use it?**
* Investigating a specific user's activities
* Collecting personal mailbox data
* Analyzing individual Drive activities
* Reviewing personal email settings
***
### **2. Service Account Login**
**What is it?**
* Advanced authentication method
* Uses service account credentials for organization-wide access
* Includes all normal user capabilities plus administrative features
**When to use it?**
* Organization-wide investigations
* Security incident response
* Compliance audits
* Multi-user data collection
***
### **Normal User Login Collectors**
**1. Mail Data Collectors**
* **Mail Collection**
* **What it collects:** Emails (sent, received, and stored messages)
* **Use case:** Communication analysis
* **Example:** Investigating email threads and attachments
* **Scope:** Personal mailbox only
* **Email History Information**
* **What it collects:** Detailed history of email activities
* **Use case:** Timeline analysis
* **Example:** Tracking email sending patterns
* **Scope:** Personal email history
* **Label Usage Information**
* **What it collects:** Email organization patterns
* **Use case:** Information management analysis
* **Example:** Understanding how emails are categorized
* **Scope:** Personal label usage
* **Email Settings Information**
* **What it collects:** Account configurations
* **Use case:** Email setup analysis
* **Example:** Reviewing auto-forwarding rules
* **Scope:** Personal email settings
**2. Drive Activities Collectors**
* **Drive Usage Activities**
* **What it collects:** File activities and sharing information
* **Use case:** Document access analysis
* **Example:** Tracking personal file-sharing history
* **Scope:** Personal Drive activities
***
## **Service Account Login Collectors**
:::tip
To use the Service Account Tornado users are required to set up some GWS Collector Prerequisites, and this is explained here: [**Service Account Creation**](service-account-creation/)
:::
When using the Service Account login method, you will need to provide Tornado with the **Google Workspace (GWS) private key** generated during the setup process (refer to the link above for detailed instructions). This key is typically provided in the form of a JSON file, as illustrated below.
Additionally, you must specify the **email address of an impersonated user**, which should belong to an administrator or a user with the required permissions, as outlined in the example below.
Accessing Google Workspace: GWS credentials for Service Account login
**The Service Account will provide you with access to all accounts, but Tornado will enable you to filter down to only the accounts of interest.**
Accessing Google Workspace: Users
**1. All Normal User Collectors (with Extended Scope)**
* **Access:** Includes all collectors listed above
* **Scope:** Organization-wide data collection, applicable to any user
* **Capabilities:** Broader data visibility and collection
**2. Reports Data Collectors (Service Account Only)**
* **Access Transparency Collector**
* **What it collects:** System access logs
* **Use case:** Security monitoring
* **Example:** Tracking admin access to user data
* **Key features:**
* Google staff access logs
* System-level access tracking
* Compliance monitoring
* **Admin Collector**
* **What it collects:** Administrative activities
* **Use case:** Admin behavior analysis
* **Example:** Tracking configuration changes
* **Key features:**
* Admin action logs
* System settings changes
* User management activities
***
### **Key Differences Between Access Modes**
| **Access Scope** | Personal data only | Organization-wide data |
| -------------------- | -------------------------------------------------------------------- | ------------------------------------------------------------------------------- |
| **Data Collection** | Limited to authenticated user | All users and administrative data |
| **Best For** | Individual investigations | Enterprise-level investigations |
| **Advantages** | Simple, user-specific analysis | Complete visibility of organization data |
| **Limitations** | Cannot access other users' data | Requires service account credentials |
| **Use Case Example** | "I need to investigate my own email communications from last month." | "I need to investigate all email communications within the finance department." |
---
# Service Account Creation
> Source: https://kb.binalyze.ai/air/features/tornado-preview-version/tornado-collectors/accessing-google-workspace/service-account-creation/index.html
## Create the access key
Log in to the admin account on your workspace management platform and navigate to the developer’s console:
[https://console.developers.google.com](https://console.developers.google.com/)
Service Account Creation: Fig1
Select the top left panel to access various administrative features.
Service Account Creation: Fig2
### Create Project
From the top left panel, go to "IAM & Admin" and select "Create Project."
Service Account Creation: Fig3
Fill out the project details, such as name, organization, and location, then click "CREATE."Create a service account
Service Account Creation: Fig4
### Create a service account.
Navigate to "IAM & Admin" and then to "Service Accounts."
Service Account Creation: Fig5
Click "CREATE SERVICE ACCOUNT" in the service accounts dashboard.
Service Account Creation: Fig6
Provide a name for the service account and proceed by clicking "CREATE AND CONTINUE."
Service Account Creation: Fig7
Assign a role (e.g., Basic -> Owner) to the service account and click "CONTINUE."
Service Account Creation: Fig8
Optionally, grant user access and finalize by clicking "DONE."
In the service account details, use the action button (three vertical dots) to manage keys.
Service Account Creation: Fig9
Select "ADD KEY" and then "Create new key," choosing the JSON format, which will be downloaded to your desktop.
Service Account Creation: Fig10
Service Account Creation: Fig11
> **Note:** If there is an issue generating a key, follow additional troubleshooting steps provided: [**GWS Enable Service Account Key Creation**](enable-service-account-key-creation)
Copy OAuth 2 Client ID - this will be required.
Service Account Creation: Fig12
## **Enabling API Services**
Navigate to the APIs & Services dashboard from the top left panel.
Service Account Creation: Fig13
Click "ENABLE APIS AND SERVICES" and search for the required APIs in the API library. Enable as needed.
Service Account Creation: Fig14
The table below gives the list of APIs required to be enabled for different data source
| Data source | API |
| ------------------------------------------------------------------------------------------------------------------------------------------------------------------------------------- | ------------------------- |
| | Google Drive API |
|
Full email messages and metadata
Email attachments
Custom labels and organization
Account settings and filters
Email history changes
| Gmail API |
|
User account activities
Security settings
Domain settings
Mobile device management
Chrome OS device information
Role assignments and definitions
| Admin SDK API |
|
File creation and deletion events
Document editing history
Sharing and permission changes
File access logs
Comments and collaborations
| Drive Activity API |
| Export logs and details | Google Vault API |
| Permissions and access reasons for resources | Policy Troubleshooter API |
## **Enable Domain-Wide Delegation**
Log in to the admin account and go to the security settings.
[https://admin.google.com](https://admin.google.com/)
Navigate to "API controls."
Service Account Creation: Fig15
Select MANAGE DOMAIN-WIDE DELEGATION
Service Account Creation: Fig16
Click "Add new" and input the Client ID copied earlier.
Provide OAuth scopes for the necessary APIs and authorize.
Service Account Creation: Fig17
Service Account Creation: Fig18
**Note**: All these scopes can be used together in a comma-delimited list to provide comprehensive access permissions for a cloud forensic investigation.
Full Scopes:
`https://www.googleapis.com/auth/gmail.readonly,https://www.googleapis.com/auth/admin.directory.user.readonly,https://www.googleapis.com/auth/admin.reports.audit.readonly,https://www.googleapis.com/auth/drive.readonly,https://www.googleapis.com/auth/drive.metadata.readonly,https://www.googleapis.com/auth/drive.activity.readonly,https://www.googleapis.com/auth/admin.directory.rolemanagement.readonly,https://www.googleapis.com/auth/admin.directory.domain.readonly,https://www.googleapis.com/auth/admin.directory.device.chromeos.readonly,https://www.googleapis.com/auth/admin.directory.device.mobile.readonly,https://www.googleapis.com/auth/gmail.settings.basic,https://www.googleapis.com/auth/gmail.settings.sharing`
| **Scope** | **Key Data Collected** |
| -------------------------------------------------------------------------- | -------------------------------------------------------------------- |
| `https://www.googleapis.com/auth/gmail.readonly` | Access to read all user email messages and metadata |
| `https://www.googleapis.com/auth/gmail.settings.basic` | Access to manage basic Gmail settings such as filters and forwarding |
| `https://www.googleapis.com/auth/gmail.settings.sharing` | Access to manage Gmail delegate settings |
| `https://www.googleapis.com/auth/admin.directory.user.readonly` | Access to read user information in your domain |
| `https://www.googleapis.com/auth/admin.directory.rolemanagement.readonly` | Access to read roles and permissions assigned to users |
| `https://www.googleapis.com/auth/admin.directory.domain.readonly` | Access to read domain settings and configurations |
| `https://www.googleapis.com/auth/admin.directory.device.chromeos.readonly` | Access to read Chrome OS device information in your domain |
| `https://www.googleapis.com/auth/admin.directory.device.mobile.readonly` | Access to read mobile device information in your domain |
| `https://www.googleapis.com/auth/admin.reports.audit.readonly` | Access to read audit logs of activities within your domain |
| `https://www.googleapis.com/auth/drive.readonly` | Access to read all files a user can access in Google Drive |
| `https://www.googleapis.com/auth/drive.metadata.readonly` | Access to read metadata of all files in Google Drive |
| `https://www.googleapis.com/auth/drive.activity.readonly` | Access to read historical file activities in Google Drive |
---
# Enable Service Account Key Creation
> Source: https://kb.binalyze.ai/air/features/tornado-preview-version/tornado-collectors/accessing-google-workspace/service-account-creation/enable-service-account-key-creation.html
## Enable Service Account Key Creation
If you encounter difficulties creating a service account key for integration with your data transfer tool, you might see an error similar to this:
'The organization policy constraint "iam.disableServiceAccountKeyCreation" is enforced on your organization.'
To enable the creation of service account keys, please follow these steps:
In the main interface of your cloud management platform, open the navigation menu from the top left corner.
Enable Service Account Key Creation: Fig1
Go to 'IAM & Admin' and select 'IAM'.
Enable Service Account Key Creation: Fig2
Access the list of projects, typically set up during the initial domain configuration.
Enable Service Account Key Creation: Fig3
Identify and select the organizational unit associated with your domain.
Enable Service Account Key Creation: Fig4
Verify that the account you are logged in with, preferably an organization administrator's account, has the following roles assigned:
* Organization Administrator
* Organization Policy Administrator
* Owner: If any roles are missing, proceed to grant access.
In the role management section, add any necessary roles and save the changes.
Enable Service Account Key Creation: Fig5
Enable Service Account Key Creation: Fig6
Return to the project context you selected earlier, and go to 'Organization Policies'.
Enable Service Account Key Creation: Fig7
View active policies and look for the policy that disables service account key creation. Select the policy to manage it.
Enable Service Account Key Creation: Fig8
Enable Service Account Key Creation: Fig9
Enable Service Account Key Creation: Fig10
Adjust the policy settings by choosing to override the parent policy and set enforcement to off.
Enable Service Account Key Creation: Fig11
These steps should guide you through resolving policy restrictions to enable the effective creation of service account keys.
---
# DRONE Integration in Tornado
> Source: https://kb.binalyze.ai/air/features/tornado-preview-version/tornado-drone-integration.html
## Introduction
**DRONE** is Binalyze's automated compromise assessment engine, originally part of [AIR DRONE](../drone/what-is-drone). It provides a decision support system that analyzes collected evidence using a library of up-to-date analyzers maintained by the Binalyze threat hunting team.
In [Tornado](./), DRONE is embedded as a standalone binary that runs locally on the investigator's machine. After cloud evidence is collected from platforms such as Microsoft 365, Google Workspace, Zoom, or HubSpot, DRONE analyzes the collected artifacts and produces findings classified by severity: **High**, **Medium**, **Low**, or **Matched**.
This tight integration enables investigators to go from raw cloud evidence to actionable compromise assessment findings without leaving the Tornado application.
---
## Architecture Overview
DRONE is shipped as a platform-specific binary embedded directly into the Tornado application at build time. At runtime, Tornado extracts the binary, invokes it as a subprocess against the collected evidence, and packages the analysis results back into the case archive.
```mermaid
flowchart TB
subgraph Tornado["Tornado Application"]
UI["Frontend UI"]
API["API Layer"]
DM["DRONE Manager"]
EB["Embedded DRONE Binary"]
end
subgraph Evidence["Evidence"]
CasePPC["Case.ppc (ZIP)"]
CaseDB["Case.db (SQLite)"]
DroneDB["Drone.db (SQLite)"]
end
subgraph External["External Services"]
AirPlatform["AIR Platform"]
IHub["Investigation Hub"]
end
UI -->|"Select analyzers & keywords"| API
API -->|"Start analysis task"| DM
DM -->|"Extract & execute"| EB
EB -->|"Read"| CasePPC
CasePPC --- CaseDB
EB -->|"Write"| DroneDB
DM -->|"Add Drone.db to"| CasePPC
AirPlatform -->|"Sync MITRE rules"| DM
CasePPC -->|"Upload"| IHub
```
---
## How It Works
The DRONE analysis workflow in Tornado follows these steps:
```mermaid
sequenceDiagram
participant User
participant TornadoUI as Tornado UI
participant TornadoAPI as Tornado API
participant DroneManager as DRONE Manager
participant DroneBin as DRONE Binary
User->>TornadoUI: Collect cloud evidence
TornadoUI->>TornadoAPI: Collection task
TornadoAPI-->>TornadoUI: Case.ppc created
User->>TornadoUI: Select analyzers, keywords, MITRE
TornadoUI->>TornadoAPI: POST /api/drone/task/assign
TornadoAPI->>DroneManager: Create analysis task
DroneManager->>DroneBin: Extract binary from embedded assets
DroneManager->>DroneBin: Execute with args (analyzers, keywords, Case.ppc path)
loop Progress Tracking
DroneBin-->>DroneManager: Write Drone.Progress.json
DroneManager-->>TornadoAPI: Report progress
TornadoAPI-->>TornadoUI: Update progress bar
end
DroneBin-->>DroneManager: Write Drone.db (results)
DroneManager->>DroneManager: Add Drone.db into Case.ppc
DroneManager-->>TornadoAPI: Analysis complete
TornadoAPI-->>TornadoUI: Show completion status
```
### Step-by-Step
1. **Evidence Collection** -- The investigator collects cloud evidence (emails, audit logs, drive files, etc.) from a supported platform. The collected data is stored in `Case.db` (SQLite) and packaged into `Case.ppc` (a ZIP archive).
2. **Analyzer Selection** -- The investigator selects which analyzers to run. Tornado queries the embedded DRONE binary (`drone --get-defaults`) to discover available analyzers for the target platform. The investigator can also enable the MITRE ATT&CK analyzer and specify keyword search terms.
3. **Analysis Execution** -- Tornado extracts the embedded DRONE binary to a temporary location, then invokes it as a subprocess with command-line arguments specifying the analyzers, keywords, MITRE rules path, CPU limit, and the path to `Case.ppc`.
4. **Progress Tracking** -- During analysis, DRONE writes progress updates to `Drone.Progress.json`. Tornado reads this file periodically and reports progress back to the UI in real time.
5. **Results Packaging** -- Upon completion, DRONE writes its findings to `Drone.db` (SQLite). Tornado then unzips the existing `Case.ppc`, adds `Drone.db` alongside `Case.db`, and re-creates the archive. The standalone `Drone.db` file is removed.
6. **Viewing Results** -- The enriched `Case.ppc` (now containing both `Case.db` and `Drone.db`) can be uploaded to the **Investigation Hub** for detailed analysis and reporting.
---
## Supported Platforms
DRONE analyzers in Tornado are organized by cloud platform. Each platform has its own set of specialized analyzers:
| Platform | Internal Identifier | Evidence Types |
|---|---|---|
| Microsoft 365 | `microsoft-365` | Exchange emails, Unified Audit Logs, OneDrive files, Teams messages |
| Google Workspace | `gws-parselet` | Gmail, Google Drive, Admin audit logs |
| Zoom | `zoom` | Meeting data, recordings, user activity |
| HubSpot | `hubspot` | CRM data, activity logs |
When the investigator opens the analyzer selection step, Tornado automatically queries the DRONE binary for analyzers that support the current platform and presents only the relevant options.
---
## Analyzers
DRONE includes two core analyzer components:
### DRONE Analyzers
Platform-specific analyzers that query artifact tables in the collected evidence database and run data through a series of check functions. These analyzers score or flag suspicious indicators and report findings with severity classifications.
Available analyzers are dynamically loaded from the embedded DRONE binary at runtime. The binary reports its full analyzer catalog, and Tornado filters by the target platform. The Dynamo analyzer (`dya`) is excluded from the general list because it is handled separately as part of the MITRE ATT&CK integration.
### MITRE ATT&CK Analyzer (Dynamo)
**Dynamo** is a rule-based analysis engine for DFIR investigations. In the context of Tornado's cloud forensics, Dynamo executes SQL-based rules against collected forensic databases -- primarily the `unified_audit_logs` table from Microsoft 365 Unified Audit Log data.
Each Dynamo rule:
- Targets a specific evidence section (e.g., `unified_audit_logs`)
- Executes complex SQL queries with JSON extraction against audit data
- Produces scored findings mapped to MITRE ATT&CK tactics and techniques
- Classifies results with severity-based detection reasons
#### Built-in Dynamo Rules for Microsoft 365
| Rule | Description | MITRE Mapping |
|---|---|---|
| Suspicious Mail Forwarding Rules Detector | Detects mail forwarding rules that may indicate mailbox compromise, including external forwarding and rules created via suspicious tools | TA0009 / T1114.003 |
| Privilege Escalation Activity Detector | Detects privilege escalation activities such as self-promotion to high-privilege roles and suspicious role assignments | TA0004 / T1078.004 |
| Unusual Authentication Detector | Identifies unusual authentication patterns including automation tools, legacy auth protocols, and anomalous IP activity | - |
| Suspicious Admin Actions Detector | Flags suspicious Exchange admin actions that may indicate unauthorized configuration changes | - |
| Suspicious HTTP Clients in O365 User Agent | Detects requests from uncommon or suspicious HTTP clients in Office 365 user agent strings | - |
#### MITRE Rules Sync
When connected to an AIR instance, Tornado can sync MITRE ATT&CK rules from the AIR platform. These rules are stored locally at `Tornado.Tools/utils/mitre.zip` and passed to the DRONE binary at analysis time. This ensures investigators always have access to the latest threat detection rules maintained by the Binalyze threat hunting team.
---
## Severity Classifications
DRONE classifies all findings into one of four severity levels:
| Severity | Description |
|---|---|
| **High** | Confirmed malicious behavior or artifacts indicating critical compromise |
| **Medium** | Indicators of suspicious or potentially unwanted behavior |
| **Low** | Anomalies or uncommon patterns that may warrant further investigation |
| **Matched** | Items flagged through keyword hits or custom rule matches |
The minimum score threshold for reporting is configurable (default: 50, range: 10--90). Findings below this threshold are not included in the results.
---
## Analysis Output
### Drone.db
The primary output of a DRONE analysis is `Drone.db`, a SQLite database containing all findings from the selected analyzers. This database is automatically added to the `Case.ppc` archive alongside the original `Case.db`.
### Case.ppc Structure (Post-Analysis)
```
Case.ppc (ZIP)
├── Case.db # Collected evidence (emails, audit logs, drive items, etc.)
└── Drone.db # DRONE analysis findings
```
### Progress Tracking
During analysis, DRONE writes real-time progress updates to `Drone.Progress.json` as JSON lines. Each entry includes:
- `MatchCount` -- The number of findings discovered so far
- `Progress` -- The completion percentage (0--100)
Tornado reads this file periodically and updates the UI with the current progress.
---
## Cross-Platform Support
The DRONE binary is embedded for all platforms that Tornado supports:
| Platform | Architecture | Embedded Binary |
|---|---|---|
| Windows | amd64 | `bin/drone_windows_amd64.zip` |
| macOS | amd64 | `bin/drone_darwin_amd64.zip` |
| macOS | arm64 (Apple Silicon) | `bin/drone_darwin_arm64.zip` |
| Linux | amd64 | `bin/drone_linux_amd64.zip` |
| Linux | arm64 | `bin/drone_linux_arm64.zip` |
The correct binary is selected at compile time using Go build tags. At runtime, Tornado extracts the binary to a temporary location (`Tornado.Tools/` directory), executes it, and removes it after the analysis completes.
---
## Configuration
| Parameter | Default | Description |
|---|---|---|
| CPU Limit | 60% | Maximum CPU usage allowed for the DRONE process |
| Minimum Score | 50 | Minimum score threshold for reporting findings (range: 10--90) |
| DRONE Version | Tracked in `dependency.json` | Use the bundled version in your installed Tornado build |
---
## API Reference
Tornado exposes the following REST API endpoints for DRONE integration:
| Method | Endpoint | Description |
|---|---|---|
| `GET` | `/api/drone/analyzers/:parseletName` | List available analyzers for a given platform |
| `POST` | `/api/drone/task/assign` | Start a DRONE analysis task |
| `POST` | `/api/drone/task/status` | Query the status of a running analysis task |
| `POST` | `/api/drone/task/cancel` | Cancel a running analysis task |
### Task Assignment Payload
```json
{
"Tasks": [{
"Type": "drone",
"Data": {
"collection_task_id": "",
"analyzers": ["o365-sue", "o365-sdeea"],
"mitre_analyzer_selected": true,
"keywords": ["phishing", "forwarding"]
}
}]
}
```
### Task Response
```json
{
"analysis_task_id": "",
"analysis_status": "completed"
}
```
---
## Further Reading
- [What is DRONE?](../drone/what-is-drone)
- [What is an Analysis Pipeline?](../drone/what-is-an-analysis-pipeline)
- [DRONE Analyzers](../drone/analyzers)
- [Tornado Overview](./)
---
# Tornado Demo
> Source: https://kb.binalyze.ai/air/features/tornado-preview-version/tornado-demo-video.html
import Embed from '@/components/Embed.astro';
## Below is a short introductory demo and a video showing the Tornado workflow:
---
# Tornado FAQs
> Source: https://kb.binalyze.ai/air/features/tornado-preview-version/tornado-faqs.html
### What is Binalyze Tornado?
**Answer:**\
Binalyze Tornado is a standalone desktop application designed to streamline and enhance evidence collection from cloud platforms like Google Workspace and Microsoft Office 365. It enables investigators to gather essential artifacts such as email records, user access logs, and administrative actions. This tool addresses the need for efficient and comprehensive digital forensics in cloud environments, providing benefits for security investigations and compliance audits.
### Is Tornado really free to use?
**Answer:**\
Tornado is available as a standalone application. Availability, licensing, and entitlement can vary by customer and program, so confirm your current access model with your Binalyze representative.
### What can you expect from the future iteration of Tornado?
Binalyze continues to expand Tornado capabilities based on customer feedback, including broader collection coverage and deeper analysis workflows.
When used with AIR, Tornado collections can be analyzed with DRONE and reviewed in the Investigation Hub, helping investigators move from cloud evidence collection to prioritized findings.
###
### Why is cloud forensics important, and how does Tornado contribute to this field?
**Answer:**\
Cloud forensics is a rapidly growing field due to the increasing reliance of organizations worldwide on cloud services. However, standardized methodologies and enterprise-ready tools are lacking. Tornado addresses these challenges by offering a structured approach to evidence collection.
### What can I collect with Tornado?
**Answer:**\
Currently, Tornado supports the collection of various data types from Microsoft 365 and Google Workspace. This includes email data, access logs, audit logs, drive activities, and administrative actions. The specific artifacts available depend on the platform and your organization's configuration. This capability is essential for organizations that require conducting detailed investigations and maintaining comprehensive records of digital activities.
###
### How does Tornado help with investigations?
**Answer:**\
Tornado is particularly valuable for Business Email Compromise (BEC) investigations. It allows investigators to quickly gather essential cloud-based evidence, including email records, access logs, and administrative actions. This streamlines the investigation process, enabling organizations to respond more effectively to security incidents.
###
### How can I analyze the collected data?
**Answer:**\
Once the evidence is collected, you can download it as an SQLite database for analysis. If you're a AIR user, you can also send the data directly to the Investigation Hub through API integration. This feature offers flexibility, allowing you to use AIR for further investigation or share the collection with other forensic tools or workflows. Learn more about AIR's Investigation Hub [**here**](../investigation-hub/).
###
### What platforms does Tornado support?
**Answer:**\
Currently, Tornado supports Microsoft Office 365 and Google Workspace platforms. Future updates may include additional cloud platforms and expanded collection capabilities, ensuring that Tornado remains relevant and useful as cloud technologies evolve.
### What inspired the creation of Binalyze Tornado?
**Answer:**\
Binalyze Tornado was born out of the need for a comprehensive and reliable tool in the emerging field of cloud forensics. While numerous open-source tools are available, many lack the support and structured methodology required for enterprise-level investigations. Tornado aims to fill this gap by providing a robust, enterprise-ready solution that adheres to established forensic principles and methodologies.
###
### How does Tornado differentiate itself from other forensic tools?
**Answer:**\
Unlike many open-source forensic tools, Tornado offers a structured and supported approach to cloud forensics. It is designed to be a comprehensive solution that integrates seamlessly with existing workflows, offering a user-friendly interface and extensive support for cloud platforms such as Microsoft 365 and Google Workspace.
### Does Binalyze Tornado hash or timestamp collections?
**Answer:**\
Collection integrity metadata and handling can vary by workflow and deployment path. For current behavior in your environment, follow the active product documentation and release notes.
### What are the key benefits of using Tornado for cloud-based investigations?
**Answer:**\
Tornado provides several key benefits, including comprehensive data collection capabilities, cross-platform support, and integration with existing forensic tools. It streamlines the investigation process, allowing organizations to quickly gather and investigate evidence, respond effectively to security incidents, and ensure compliance with regulatory requirements.
###
### What challenges does Binalyze Tornado address in cloud forensics?
**Answer:**\
Binalyze Tornado addresses several challenges in cloud forensics, including the lack of standardized tools for evidence collection, the complexity of integrating multiple cloud services, and the need for a user-friendly interface that both technical and non-technical users can use. By providing a comprehensive solution, Tornado streamlines the forensic process, enabling organizations to manage and analyze cloud-based data effectively.
### What kind of support does Binalyze provide for Tornado users?
**Answer:**\
Binalyze provides support for Tornado users, including detailed documentation, user guides, and technical assistance to address questions or issues that may arise during use. We also encourage feedback so we can continue refining and expanding Tornado capabilities.
###
### How does Tornado handle updates and new feature releases?
**Answer:**\
Tornado will be updated with new features and improvements based on user feedback and advancements in cloud forensics. Binalyze will provide detailed release notes and documentation for each update, ensuring that users are informed of new capabilities and can fully leverage the latest developments.
###
### How does Binalyze Tornado support the development of cloud forensics methodologies?
**Answer:**\
Tornado is designed to evolve with the field of cloud forensics, incorporating feedback from users and industry experts to refine its methodologies and features. By providing a reliable and structured tool, Tornado helps establish best practices and standards in cloud forensics, contributing to the development of this emerging field.
###
### How does Binalyze Tornado integrate with other Binalyze products?
**Answer:**\
Binalyze Tornado integrates seamlessly with AIR to deliver a comprehensive Automated Investigation and Response platform driven by digital forensics. Tornado enables rapid cloud and machine-based evidence collections, while AIR provides detailed analysis and reporting, creating a cohesive and efficient forensic workflow.
###
### What are the unique challenges of cloud forensics compared to traditional digital forensics?
**Answer:**\
Cloud forensics presents unique challenges, such as the dynamic nature of cloud environments, the shared responsibility model between cloud providers and customers, and the complexity of accessing and preserving data across distributed systems. AIR and Tornado address these challenges by providing [tools specifically designed for cloud environments](../../home/cloud-forensics), ensuring that evidence is collected and preserved in a forensically sound manner.
### How does Binalyze Tornado support incident response teams?
**Answer:**\
Binalyze Tornado provides incident response teams with the tools they need to quickly gather evidence and enable effective forensic investigation of cloud environments. Its intuitive interface and comprehensive data collection capabilities enable teams to assess the scope of an incident, identify affected systems, and develop effective remediation strategies.
###
### What future trends in cloud forensics is Binalyze Tornado preparing for?
**Answer:**\
Binalyze Tornado is preparing for future trends, such as increased adoption of multi-cloud environments, the rise of containerized applications, and the growing importance of real-time threat detection and response. By continuously evolving its features and capabilities and listening to user feedback, Tornado aims to accompany evolving organizational needs and provide users with cutting-edge forensic tools.
### What are the primary use cases for Binalyze Tornado?
**Answer:**\
Binalyze Tornado is primarily used for cloud-based digital forensics, focusing on evidence collection from platforms like Microsoft 365 and Google Workspace. It is particularly useful for investigations involving Business Email Compromise (BEC), compliance audits, and incident response. Integrating with AIR, it also expands cross-platform investigation capabilities, closing investigation blind spots.
### How does Tornado integrate with Microsoft 365 and Google Workspace?
**Answer:**\
Tornado uses specific collectors, known as parselets, to gather data from Microsoft 365 and Google Workspace. These parselets interact with the respective APIs to collect emails, logs, and other relevant data. The integration ensures comprehensive data collection for forensic analysis.
###
### What are parselets, and how do they function within Tornado?
**Answer:**\
Parselets are specialized components within Tornado designed to collect and analyze evidence from cloud platforms. They function by interfacing with platform-specific APIs to gather data, which is then processed and stored for forensic analysis.
### Example Scenarios Where Tornado Would Be Beneficial
1. **Incident Response for Unauthorized Access**\
\&#xNAN; _Scenario:_ An organization suspects unauthorized access to its Microsoft 365 accounts. Using Tornado, the incident response team can quickly collect sign-in logs and audit logs to identify suspicious activities, such as unusual login times or locations.
2. **Data Breach Investigation**\
\&#xNAN; _Scenario:_ After a data breach, an organization needs to determine the extent of the data accessed or exfiltrated. Tornado can be used to collect email data, drive activities, and administrative reports from Google Workspace to trace the breach's impact and identify compromised data.
3. **Compliance Audit Preparation**\
\&#xNAN; _Scenario:_ An organization is preparing for a compliance audit and needs to ensure that all user activities and administrative actions are documented. Tornado can collect comprehensive reports and logs from both Microsoft 365 and Google Workspace, providing a clear audit trail.
4. **Phishing Attack Investigation**\
Scenario: An organization suspects a phishing attack targeting its employees. Using Tornado, the security team can collect and analyze email data from Microsoft 365 and Google Workspace to identify phishing emails, track their distribution, and determine which users were affected. This helps mitigate the attack and prevent future incidents.
5. **Internal Policy Compliance Monitoring**\
Scenario: A company wants to ensure compliance with internal communication policies. Tornado can be used to collect and analyze email and chat data to verify adherence to communication guidelines, identify any policy violations, and provide insights for improving policy enforcement.
6. **Data Loss Prevention (DLP) Audit**\
Scenario: An organization needs to audit its data loss prevention measures. Tornado can collect data on file sharing and access activities from Google Drive and Microsoft OneDrive to identify potential data leaks and unauthorized access, ensuring that sensitive information is adequately protected.
7. **User Behavior Analysis**\
Scenario: A company wants to understand user behavior patterns to enhance productivity and security. Tornado can collect and analyze data on user activities, such as login times, application usage, and communication patterns, providing insights into user habits and identifying areas for improvement.
8. **Cross-Platform Security Assessment**\
Scenario: An organization uses both Microsoft 365 and Google Workspace and needs a comprehensive security assessment. Tornado can collect and analyze data from both platforms, providing a unified view of security posture, identifying vulnerabilities, and recommending improvements.
9. **Forensic Investigation Training**\
Scenario: A training institution wants to provide hands-on experience in cloud forensics. Tornado can be used as a training tool to simulate real-world scenarios, allowing students to practice evidence collection, analysis, and reporting in a controlled environment.
---
# Tornado Installation Guide
> Source: https://kb.binalyze.ai/air/features/tornado-preview-version/tornado-installation-guide/index.html
System Requirements
#### Hardware Requirements
* CPU: 2 cores or more
* RAM: 4 GB minimum (8 GB recommended)
* Storage: 1 GB free space minimum
* Internet Connection: Required
#### Software Requirements
* Operating Systems:
* Windows 8.1 or later
* macOS 10.15 or later
* Linux (Ubuntu 20.04 or later)
* WebView2 Runtime (Windows only - automatically prompted if needed)
* Administrator privileges (optional)
### Download Process
#### 1. How to get Tornado
* **Existing customers** can download it via the **Tornado Preview button** in the Main Menu of the AIR console.
Tornado Installation Guide: Download guide
* **Non-AIR customers** can download Tornado through this[ **landing page**](https://www.binalyze.com/products/tornado).
* Navigate to the Tornado download section
* Select your operating system version:
Tornado Installation Guide: Download binary
* Download the appropriate package:
* Windows: .exe (standalone executable)
* macOS: .dmg
* Linux: binary file
#### 2. Verify the Download
* Check file integrity
* Ensure complete download
* Store in a permanent location
### Installation Steps
#### Windows
1. **Tornado Setup**
* No installation required
* Place the .exe file in the desired location:
Tornado Installation Guide: Tornado run on a Windows Desktop
* Create a shortcut (optional)
* Run directly from any location
1. **First Launch**
* Double-click the .exe file
* If WebView2 Runtime is missing:
* An automatic prompt will appear
* Follow the WebView2 installation process
* Tornado will restart automatically
* The application starts after WebView2 checks
2. **WebView2 Note**
* Automatically detected and prompted
* No manual download is needed
* One-time setup process
* Required only for Windows 8.1 and 10
#### macOS
1. **Open the Package**
* Double-click the .dmg file
* Drag Tornado to the Applications folder:
Tornado Installation Guide: Drag Tornado to the Applications folder
* Verify app installation:
Tornado Installation Guide: Applications Folder
1. **Security Settings**
* Open System Preferences
* Navigate to Security & Privacy
* Allow Tornado to run (first launch)
2. **First Launch**
* Launch from the Applications folder or Launchpad
* Grant necessary permissions
Tornado Troubleshooting & Feedback: HTTP Trace toggled on
### **Enabling HTTP Trace (Optional)**
**What is HTTP Trace?**\
HTTP Trace is a diagnostic tool that logs detailed data about cloud communication. While not required for basic feedback, it helps diagnose complex technical issues.
**When to Enable HTTP Trace**\
Enable HTTP Trace if you’re experiencing:
* Authentication issues
* Problems with specific collectors
* Unexpected errors
* Performance-related concerns
**How to Enable HTTP Trace**
1. Open the Tornado application.
2. Go to **Settings** from the top menu.
3. Locate the **HTTP Trace** option.
4. Toggle the switch to enable it.
**Before Enabling HTTP Trace**
* Logs will include detailed data on API communication.
* Ensure you have enough disk space.
* Be aware that enabling HTTP Trace may slightly impact performance.
**What HTTP Trace Captures**
* API request and response details
* Authentication workflows
* Collection progress logs
* Error details and stack traces
* Network communication logs
***
### **Submitting Feedback**
Tornado Troubleshooting & Feedback: The Feedback form
#### **Automatic Log Collection** Tornado automatically gathers essential diagnostic data, including:
* Application logs
* Error messages
* Collection statuses
* System configurations
* Task execution details
* Authentication statuses
#### **Steps to Submit Feedback**
1. **Enable HTTP Trace (Optional):**
* Only if requested by the support team or for complex technical issues.
2. **Send Feedback:**
* Click the **Send Feedback** button in the application.
* Add comments if necessary (optional).
3. **Submit:**
* Tornado automatically attaches all necessary diagnostic data, so you don’t need to add anything extra.
#### **What’s Included in Logs**
* Collection progress and statuses
* Error messages and warnings
* Authentication details
* System configuration data
* Selected collector and setting details
* Task execution logs
***
#### **After Submission**
* Our team will review your logs and analyze reported issues.
* You’ll receive a response via email with solutions or further instructions if necessary.
***
### **Important Notes**
**Privacy & Security**
* Logs include only technical details—no personal data is captured.
* All logs and communications are encrypted.
* Logs are automatically cleaned up after use.
**Best Practices**
* Enable HTTP Trace before reproducing an issue.
* Keep it enabled during the entire troubleshooting session.
* Disable HTTP Trace once the issue is resolved.
* Submit feedback promptly after encountering issues.
For urgent concerns or critical investigations, contact our support team directly through official channels.
---
# Updating Tornado
> Source: https://kb.binalyze.ai/air/features/tornado-preview-version/updating-tornado.html
### **Automatic Update Check**
Tornado automatically checks for updates when the application starts:
* Connects to the update server
* Compares the current version with the latest release
* Runs silently in the background
***
### **Update Notifications**
**When an Update is Available**
* A notification appears in the bottom-right corner of the screen.
* Displays the new version number.
* Includes a "Download" button.
* The notification remains visible until acted upon.
**When No Update is Available**
* No notification is shown.
* The application continues to operate normally.
* This confirms that the current version is up-to-date.
**When the Update Check Fails**
* A brief notification appears in the bottom-right corner.
* Disappears automatically after a few seconds.
* No user action is required.
***
### **Download Process**
**1. Starting the Download**
* Click the "Download" button in the notification.
* The download begins automatically.
* Progress is displayed in the notification area.
**2. Installation Steps**
**For Windows:**
* Wait for the download to complete.
* Close Tornado.
* Run the newly downloaded executable file.
**For macOS:**
* Download the new `.dmg` file.
* Close Tornado.
* Open the downloaded `.dmg`.
* Drag the application to the Applications folder.
**For Linux:**
* Download the new binary file.
* Make it executable by running:
```bash
bashCopy codechmod +x ./tornado
```
* Restart Tornado.
***
### **Troubleshooting**
**Common Issues**
**Update Check Fails:**
* Ensure an active internet connection.
* Restart Tornado and let it check again on the next launch.
* The issue usually resolves automatically.
**Download Issues:**
* Verify internet connectivity.
* Restart Tornado and retry the download.
* Ensure sufficient storage space is available.
**Installation Problems:**
* Confirm that Tornado is fully closed.
* Verify write permissions in the target directory.
* Clear temporary files if necessary.
***
### **Best Practices for Smooth Updates**
1. Complete any running collections before updating.
2. Export important data to avoid interruptions.
3. Close the application when prompted during installation.
4. Follow the installation steps for your platform.
***
### **After Updating**
1. Verify that the application is running the new version.
2. Check that existing configurations are intact.
3. Test connections to cloud platforms to ensure everything works as expected.
***
### **Reminder**
Updates will bring essential features and improvements. Tornado’s automatic update check ensures you’re notified of new versions while staying unobtrusive.
---
# Integrations
> Source: https://kb.binalyze.ai/air/integrations/index.html
[SSO Integrations](sso-integrations/)
[Git Repositories](git-repositories)
[Cyber Threat Intelligence (STIX/TAXII Feed Integration)](cyber-threat-intelligence-stix-taxii-feed-integration)
[Microsoft Azure Cloud Platform Integration](microsoft-azure-cloud-platform-integration)
[Splunk Integration](webhooks/splunk)
[IBM QRadar Integration](webhooks/ibm-qradar-integration)
[Wazuh Integration](webhooks/wazuh-integration)
[Cortex XSOAR Integration](webhooks/cortex-xsoar-integration)
[Elasticsearch Logstash Kibana Integration](webhooks/elasticsearch-logstash-kibana-integration)
[Mattermost Integration](webhooks/mattermost-integration)
[ServiceNow Integration](webhooks/servicenow-integration)
[Sumo Logic Integration](webhooks/sumo-logic-integration)
[Crowdstrike Integration](webhooks/crowdstrike-integration)
[Microsoft Sentinel Integration](webhooks/microsoft-sentinel-integration)
[Slack Integration](webhooks/slack-integration)
[Carbon Black Cloud Integration](webhooks/carbon-black-cloud-integration)
[Rapid7 InsightIDR Integration](webhooks/rapid7-insightidr-integration)
[LogicHub SOAR (DEVO) Integration](webhooks/logichub-soar-devo-integration)
[Fortigate SIEM Integration](webhooks/fortigate-siem-integration)
[Dynatrace Integration](webhooks/dynatrace-integration)
[Stellar XDR Integration](webhooks/stellar-xdr-integration)
[SentinelOne Integration](webhooks/sentinelone-integration)
[Microsoft 365 Defender Integration](webhooks/microsoft-365-defender-integration)
[Cisco XDR Integration](webhooks/cisco-xdr-integration)
---
# Microsoft Azure Cloud Platform Integration
> Source: https://kb.binalyze.ai/air/integrations/microsoft-azure-cloud-platform-integration.html
### 1. App Registration
The application registration process creates an identity for your instance in Azure AD, enabling it to authenticate and access resources securely.
1. Go to **Microsoft Entra ID Directory** and select **Overview**. Keep the "Tenant ID" information for the field required in the Azure Integration configuration page.
2. Navigate to **Manage** > **App Registrations** and click **New Registration**.
Microsoft Azure integration: App registration – New Registration
3. Name the application, select the account type, and click the **Register** button.
4. In the **Overview** section, note the "Application (client) ID" for the field required in the Azure Integration configuration page.
5. Navigate to **Certificates & Secrets** and click **New client secret**.
Microsoft Azure integration: Certificates & Secrets – New client secret
6. Provide a description, select the expiration period click Add.
Microsoft Azure integration: Add client secret
7. Note the value for the "Key (Client Secret)" information for the field required in the Azure Integration configuration page.
### 2. Role Assignment for the Subscription
Assigning roles to the registered application ensures it has the necessary permissions to access and manage the resources within the selected Azure subscription.
1. Go to **Subscriptions** and select the subscription from the list.
2. In the **Overview** section, note the "Subscription ID" information for the field required in the Azure Integration configuration page.
3. Navigate to **Access control (IAM)**, click **Add**, and select **Add role assignment**.
4. To add **Reader** roles to the registered application:
* Select **Reader** from the job function roles list and click **Next**.
* Select **Assign access to** > **User, group, or service principal**.
Microsoft Azure integration: Add role assignment – Reader
* Click **Select members**, search for the registered application's name, and select it.
Microsoft Azure integration: Select members – Reader
* Click **Review + Assign**.
5. To add **Contributor** roles to the registered application:
* Select **Contributor** from the privileged administrator roles list and click **Next**.
* Select **Assign access to** > **User, group, or service principal**.
* Click **Select members**, search for the registered application's name, and select it.
Microsoft Azure integration: Select members – Contributor
* Click **Review + Assign**.
Microsoft Azure integration: Role assignments list
6. Now make sure that the roles **Reader** and **Contributors** are assigned to the application in the **Role Assignment** list.
### 3. Final Steps
This final step involves entering the collected information into the AIR Console UI, which will integrate the application with Azure, allowing it to operate within your Azure environment.
1. Go to the **AIR Console UI** and enter all the required information on the Azure Integration configuration page.
Microsoft Azure integration: Console – Azure Integration configuration page
2. Click the **Save** button.
Microsoft Azure integration: Microsoft Azure cloud integrations list
3. As a final task, make sure that the Account is listed in the **Microsoft Azure** cloud integrations list.
---
# SSO Integrations
> Source: https://kb.binalyze.ai/air/integrations/sso-integrations/index.html
[ADFS SAML 2.0 SSO Integration with AIR](adfs-saml-2.0-sso-integration)
[Microsoft Azure Cloud Platform Integration](../microsoft-azure-cloud-platform-integration)
[Okta SAML 2.0 SSO Integration](okta-saml-2.0-sso-integration)
[FortiAuthenticator SAML 2.0 SSO Integration with AIR](fortiauthenticator-saml-2.0-sso-integration)
---
# Microsoft Azure SSO Integration
> Source: https://kb.binalyze.ai/air/integrations/sso-integrations/microsoft-azure-sso-integration.html
### 1. App Registration
To begin integrating Azure SSO with AIR, you'll first need to register a new application in Azure Active Directory (AD). This process will create a unique identity for your application, enabling secure communication with Azure services.
1. Access the [Azure Portal](https://portal.azure.com/), sign in using your credentials, and navigate to the **Microsoft Entra ID Directory** under the Azure Services section.
2. Go to **Manage > App registrations**, click on **New registration**, and provide a name for your application
3. Select **Web**, and enter the `https://[AIR_CONSOLE_ADDRESS]/api/auth/sso/azure/callback` value for the Redirect URI field. Please remember to change `[AIR_CONSOLE_ADDRESS]` part for your instance.
4. Click **Register** to complete the registration process.
Microsoft Azure SSO Integration: Fig1
5. After registering the application, navigate to the **Overview** section, and copy the **Application (client) ID** and **Directory (tenant) ID**.
Open the Endpoints page and copy the **"OpenID Connect metadata document"** value. You will need to input these values into the AIR Console.
Microsoft Azure SSO Integration: Fig2
### 2. App Configurations & Permissions
Once your application is registered, you need to configure essential settings and permissions in Azure AD. This includes creating secrets and setting up API permissions to allow your application to interact securely with Azure resources.
1. In the left-hand panel, go to **Certificates & Secrets**.
2. Click **New client secret**, provide a description, set the expiration period, and click **Add**.
Microsoft Azure SSO Integration: Fig3
3. Copy the value of the client secret and store it securely as it will be required later. You will need to input this value into the AIR Console in the **Client Secret** field.
Microsoft Azure SSO Integration: Fig4
Microsoft Azure SSO Integration: Fig5
4. Navigate to **API permissions** and ensure that the **profile** permission is selected.
Microsoft Azure SSO Integration: Fig6
If it's not present, click **+ Add permission**, select **Microsoft Graph**, choose **Delegated permissions**, toggle **profile**, and click **Add permissions**.
#### \[Optional step] Using UPN as an email address
If you have users with an empty ‘email’ field, AIR can use UPN to identify users. You can follow the steps below to use UPN as an identifier for users without the ‘email’ field:
Navigate to ‘**Token configuration**.’ If ‘upn’ is not in the list, click on the ‘Add optional claim’ button. After selecting the ‘ID’ token type, tick ‘upn’ and click on the ‘Add’ button.
Microsoft Azure SSO Integration: Fig7
6. Go to **App roles** within the Azure AD application settings, click **+ Create app role**, provide a name for the role, select **Users/Groups** for allowed member types, and give the role a description.
Microsoft Azure SSO Integration: Fig8
7. Enter the corresponding "Tag" of the role to be mapped within the AIR Console under the **Value** field (e.g., use the tag "global_admin" for the Global Admin role).
Microsoft Azure SSO Integration: Fig9
8. You can make the roles on Azure SSO more than one, according to your needs. While doing this, make sure that the “tag” value in **AIR** and the “value” value in **Azure App** are the same.
Microsoft Azure SSO Integration: Fig10
### 3. Managing Users and Groups
With your application configured, the next step is to manage the users and groups that will have access to it. Assign roles and permissions to the appropriate users and groups as follows:
1. Return to the **Microsoft Entra ID Directory**, select **Enterprise applications**, filter by the application name, and click on it.
2. In the left-hand panel, select **Users and groups**, click **+ Add user/group**.
3. Choose the users/groups and click **Select**.
Microsoft Azure SSO Integration: Fig11
4. Choose the roles to assign and click **Select**.
Microsoft Azure SSO Integration: Fig12
5. Assign selected user(s) to the selected role by clicking **Assign**.
Microsoft Azure SSO Integration: Fig13
### 4. Configure SSO in AIR Console
After configuring your application in Azure, you must enable and configure SSO in the AIR Console to allow users to authenticate using Azure AD credentials.
1. Sign in to the AIR Console.
2. Navigate to **Settings**, go to **Security**, and find the **SSO** section.
3. Add Azure ID by clicking Add Provider, fill in the required fields with the **OpenID Connect metadata document**, **Client ID**, and **Client Secret** from the Azure application registration, and click **Save**.
Microsoft Azure SSO Integration: Fig14
### 5. Verification
The final step involves verifying that the SSO integration is working correctly. This ensures that users can log in to the AIR Console using their Azure AD credentials without any issues.
1. After saving, check that a **Sign in with Azure AD** button appears on the AIR Console login page.
2. Click the **Sign in with Azure AD** button to be redirected to the Microsoft login page for authentication.
Microsoft Azure SSO Integration: Fig15
3. Upon successful authentication, you will be redirected back to the AIR Console.
:::note
After configuring Single Sign-On (SSO), it is mandatory to retain at least one local user account. This is essential because if the SSO URL expires or any configuration changes occur on the SSO provider's side, you will need access to a local account to log into the AIR Console and update the SSO settings.
Maintaining a local user account acts as a safety net, ensuring continued access to critical administrative functions within AIR, even in scenarios where the SSO functionality is temporarily unavailable.
:::
---
# ADFS SAML 2.0 SSO Integration with AIR
> Source: https://kb.binalyze.ai/air/integrations/sso-integrations/adfs-saml-2.0-sso-integration.html
This article explains how to configure Active Directory Federation Services (ADFS) as a SAML 2.0 identity provider for AIR.
---
## Prerequisites
- Windows Server with the **AD FS** role installed and configured
- Access to the AD FS Management console with admin privileges
- Access to AIR as an administrator
- Users to be authenticated must have their **email field populated** in Active Directory
- Ensure network connectivity between AIR and the ADFS server (via the Federation Service URL)
---
## Create a relying party trust in ADFS
1. Open **Server Manager** on the ADFS server.
2. Go to **Tools** -> **AD FS Management**.
3. In the right-side **Actions** pane, select **Add Relying Party Trust**.
4. In the wizard, use the following selections:
- **Welcome**: `Claims Aware`
- **Select Data Source**: `Enter data about the relying party manually`
- **Specify Display Name**: enter a display name
- **Configure URL**: enable `SAML 2.0 WebSSO protocol`, then enter the ACS URL from AIR SSO settings
- **Configure Identifiers**: add the same ACS URL as relying party trust identifier
- **Choose Access Control Policy**: select a policy that matches your security requirements (default can be `Permit Everyone`)
5. Review the configuration and finish the wizard.
## Adjust advanced trust settings (optional)
After the trust is created, you can tune additional settings from the trust properties:
- **Hash algorithm**: change the secure hash algorithm in the **Advanced** tab if required.
- **Endpoint binding**: change SAML endpoint binding in the **Endpoints** tab (default is typically POST).
## Edit claim issuance rules
1. In **AD FS Management**, open **Relying Party Trusts**.
2. Select the trust you created for AIR.
3. Click **Edit Claim Issuance Policy**.
4. Add claim rules to pass required user attributes (including Name ID) to Console.
5. Start with the **Send LDAP Attributes as Claims** template and continue with the additional required rules for your deployment.
## Configure SSO settings in AIR
You can upload IdP metadata to configure SSO quickly.
1. Open the metadata URL from your ADFS server:
```
https:///FederationMetadata/2007-06/FederationMetadata.xml
```
2. Download the XML metadata file.
3. In AIR SSO settings, upload the metadata XML file.
## Configure users in Active Directory
1. Open **Active Directory Users and Computers**.
2. Create a new user account for SSO testing.
3. Edit the user profile and ensure the email address is populated.
:::caution
The email address is required for SAML login. Users without email values cannot authenticate to AIR via ADFS SSO.
:::
## Configure role mapping
1. In AIR, open the roles page and copy the required role `Tag` values.
2. Add groups and map them to users.
3. Use the required role tags with the `air_role.` prefix when configuring role-related group values.
4. Open target user settings and assign required role entries.
## Validate the login flow
After configuration is complete:
1. Open the AIR login page.
2. Confirm the **Sign in with ADFS** button is visible.
3. Click the button and authenticate on the ADFS login page.
4. Verify that you are redirected back to the AIR Console after successful authentication.
---
# Okta SAML 2.0 SSO Integration
> Source: https://kb.binalyze.ai/air/integrations/sso-integrations/okta-saml-2.0-sso-integration.html
1. Sign in to the Okta Admin Dashboard.
2. Click the “Applications” button in the left menu.
3. Click Create App Integration.
:::caution
**All fields are case-sensitive. Make sure all of them are filled correctly.**
:::
8. On the next page, click the first option, and then click the “Finish” button.
11. Select “string array“ as the data type.
12. Enter a name and description for the attribute.
13. Enter “roleTags“ as the variable name.
14. Click the “Define enumerated list of values“ checkbox.
15. Click the “Attribute required“ checkbox.
16. Give a display name of your new role and enter the corresponding “Tag” of the role that you want to map within the AIR Console into the “Value” field. For example, the “global\_admin”, which is the tag of the Global Admin role in AIR Console, is used for the “Value” section.
Then click save.
\
17. Navigate back to the “Applications“ page. Click the name of the app. Then go to the “Assignments” tab.
18. Click the “Assign to People” button under the “Assign“ dropdown.
25. Fill in the required fields according to the Sign on tab in the Okta
:::caution
**Entry Point: Okta Sign on Url**
**Issuer: Okta Issuer**
**Cert: Okta Signing Certificate**
:::
26. Click Save settings
27. The “Sign in with OKTA” button should appear on the AIR Console login page. Once you click this button, you will navigate to the Okta login page to authenticate your access. Once you are authenticated, you will be redirected back to the AIR console.
:::note
After configuring Single Sign-On (SSO), it is mandatory to retain at least one local user account. This is essential because if the SSO URL expires or any configuration changes occur on the SSO provider's side, you will need access to a local account to log into the AIR Console and update the SSO settings.
Maintaining a local user account acts as a safety net, ensuring continued access to critical administrative functions within AIR, even in scenarios where the SSO functionality is temporarily unavailable.
:::
---
# FortiAuthenticator SAML 2.0 SSO Integration with AIR
> Source: https://kb.binalyze.ai/air/integrations/sso-integrations/fortiauthenticator-saml-2.0-sso-integration.html
This guide explains how to integrate **FortiAuthenticator** as a SAML 2.0 Identity Provider (IdP) for **AIR**.
> ✅ This method supports **IdP-initiated SAML SSO**. Role mapping is handled via FortiAuthenticator Groups and AIR `roleTags`.
---
## Prerequisites
- Access to FortiAuthenticator with admin privileges
- Access to AIR as an administrator
- Users to be authenticated must have their **email field populated**
- Ensure network connectivity between AIR and FortiAuthenticator (via server address used in configuration)
---
## Step 1: Prepare FortiAuthenticator
1. Log in to FortiAuthenticator with an admin account.
2. Go to **Authentication → User Management → User Groups**.
3. Create user groups that will act as AIR role mappings:
- Use the prefix `air_role.` followed by the role tag used in AIR.
Example: `air_role.global_admin`
- Only roles that will be actively used for login need to be created.
4. Assign users to their corresponding AIR role groups.
---
## Step 2: Configure FortiAuthenticator as SAML IdP
1. Navigate to **Authentication → SAML IdP → General**.
2. Enable "Enable SAML Identity Provider portal" setting.
3. In the **Server Address** field, enter the address AIR will use to reach FortiAuthenticator.
Make sure AIR can access this URL over the network.
4. (Optional) Select a **default IdP certificate**.
This is recommended for metadata download compatibility.
5. Click **Save** to store your settings.
---
## Step 3: Create Service Provider in FortiAuthenticator
1. Go to **Authentication → SAML IdP → Service Providers**.
2. Click **Create New** to register the AIR as a new SP (Service Provider).
3. Fill in:
- **SP Name**: Choose a meaningful name (e.g., `AIR-Instance-X`)
- **IdP Prefix**: Auto-generate or enter manually
- **Server Certificate**: Select one, or **Use default setting in SAML IdP General page** if using the default certificate
4. Click **Save** to create the SP.
---
## Step 4: Configure SSO in AIR
1. In a new tab, log in to **AIR** with an admin user.
2. Go to **Settings → Security**, scroll to the **SSO** section.
3. Enable **FortiAuthenticator** and copy the **ACS URL** at the bottom.
---
## Step 5: Complete SP Configuration in FortiAuthenticator
1. Go back to your created SP in FortiAuthenticator.
2. Under **SP Metadata**, fill in:
- **SP Entity ID** → Paste the ACS URL from AIR
- **SP ACS (Login) URL** → Paste the ACS URL again
3. Under **Assertion Attributes**, configure:
- **Subject Name ID** → Set to `email`
- **Format** → `urn:oasis:names:tc:SAML:1.1:nameid-format:emailAddress`
4. Add the following SAML assertions:
| SAML Attribute | User Attribute | Required |
| -------------- | -------------- | -------- |
| `groups` | Group | ✅ |
| `firstName` | First Name | ❌ |
| `lastName` | Last Name | ❌ |
5. Click **Save**.
---
## Step 6: Export IdP Metadata
1. Open the newly created SP entry.
2. Click **Download IdP Metadata**.
---
## Step 7: Upload Metadata to AIR
1. Return to **AIR → Settings → Security → SSO** section.
2. Use the **Upload IdP Metadata** option to upload the file.
> 🔄 Alternatively, you can copy values from Forti and paste them into AIR manually.
3. Click **Save**.
---
## Step 8: Test the Integration
1. Log out of AIR.
2. Click **Login with FortiAuthenticator** on the login screen.
3. You’ll be redirected to FortiAuthenticator. After successful authentication, you’ll be redirected back to AIR.
---
## Troubleshooting
If login fails, check the following:
- 🔌 **Network Issues**: Make sure AIR can reach FortiAuthenticator’s Server Address.
- 👥 **Role Mapping**: Ensure the user is assigned to at least one Forti group named `air_role.X` where `X` matches a role tag in AIR.
- View AIR role tags via **Settings → User Management → User Roles**.
- 📧 **Email Field**: Users without an email field in Forti cannot log in.
- 📄 **Logs**: If the issue persists, collect SAML logs from both AIR and Forti and contact support.
---
## Example Group Mapping for Predefined Roles
| AIR Role Name | AIR Role Tag | Forti Group Name |
| -------------------- | ---------------------- | ------------------------------- |
| Global Admin | `global_admin` | `air_role.global_admin` |
| Organization Admin | `organization_admin` | `air_role.organization_admin` |
| L1 & L2 Analyst | `l1_l2_analyst` | `air_role.l1_l2_analyst` |
| Maintenance Engineer | `maintenance_engineer` | `air_role.maintenance_engineer` |
| L3 & L4 Analyst | `l3_l4_analyst` | `air_role.l3_l4_analyst` |
| Responder | `responder` | `air_role.responder` |
---
# Git Repositories
> Source: https://kb.binalyze.ai/air/integrations/git-repositories.html
AIR allows you to connect your organization's Git repositories directly to the platform to manage Hunt/Triage rules as a single source of truth. By importing YARA, Sigma, and osquery rule files from a Git repository, your team can maintain version-controlled, auditable rulesets that stay synchronized with your detection engineering workflow.
Below is a short introductory demo of the Git Repositories integration.
[**See It in Action**](https://app.storylane.io/share/mm88jj0hicpz)
## Supported Providers
| Provider | Repository URL Format |
|----------|----------------------|
| **GitHub** | `https://github.com//` |
| **GitLab** (cloud and self-hosted) | `https://gitlab.com//` |
| **Azure DevOps** | `https://dev.azure.com///_git/` |
| **Bitbucket** | `https://bitbucket.org//` |
## Organization Scope
Repository connections are created per organization. If you manage multiple organizations in AIR, you must switch to each organization individually before adding a repository connection.
:::note
A repository connection can only be created for the currently active organization. To create one under a different organization, switch to that organization first using the organization selector.
:::
## Adding a Repository Connection
Navigate to **Integrations > Git Repositories** and click **Add New** to open the repository connection wizard.
### Step 1: Repository Details
Configure the connection to your Git provider:
- **Name** — A descriptive name to identify this repository connection (e.g., "YARA Rules - Windows" or "Sigma Detection Rules")
- **Organization** — The organization that will own this connection (must match the organization you are working in; switch organizations first if needed)
- **Provider** — Select your Git provider (GitHub, GitLab, Azure DevOps, or Bitbucket)
- **Repository URL** — The full URL of your Git repository. The URL must match the selected provider
- **Branch** — The branch to synchronize from (e.g., `main` or `master`). This field is required even if the placeholder text suggests a default
- **Access Token** — A personal access token with read permissions to the repository
- **Webhook** — For automatic, webhook-based synchronization, the console shows where to point the webhook **after** the connection is created. Until then, the wizard may display a placeholder such as *Will be generated after creation*.
Click **Test Connection** to verify that AIR can authenticate and access the repository before proceeding.
Git Repositories: Repository Connection
:::tip
For public repositories, an access token is technically not required. However, API rate limits for unauthenticated requests are very low. Always provide a token to avoid exceeding these limits and ensure reliable synchronization.
:::
### Step 2: Sync Configuration
Define which files to synchronize and how often:
- **Include Paths** — Browse the repository contents and select specific directories or files to import. You can select individual subdirectories to scope the import to relevant rule files only
- **Exclude Paths** — Specify directories to skip during synchronization (e.g., documentation or test folders)
- **File Patterns** — Define file extension filters to refine which files are imported (e.g., `*.yar`, `*.yara`, `*.yml`)
- **Sync Interval** — Choose how frequently AIR checks the repository for changes:
- **Manual** — Sync only when triggered manually
- **Automatic** — Sync on every detected commit or push (webhook-based)
- **Scheduled** — Sync at a fixed interval (15 minutes, 30 minutes, 1 hour, or 2 hours)
The wizard also summarizes sync limits: individual files over **10 MB** and repositories over **10,000** files are skipped automatically (see [Limits](#limits)).
Git Repositories: Sync Configuration
### Step 3: Content Settings
This step is labeled **Content Settings** in the wizard. Configure how imported rules are managed within AIR:
Git Repositories: Content Settings
#### Ownership Mode
This is the most important configuration choice. Two modes are available:
| Mode | Behavior |
|------|----------|
| **Mirror** | Rules stay synchronized with the repository. When files are added, updated, or removed in the repository, rules are automatically kept in sync. Rules are managed by the repository and **cannot be edited locally** in AIR. |
| **Fork** | Rules are imported from the repository and become yours to manage. You can freely edit or delete them within AIR, but changes in the repository **will not affect existing rules**. You can manually trigger a sync to import new files. |
:::caution
Choose your ownership mode carefully — **you cannot change it after the connection is created**. In **Mirror** mode, local edits are not possible — the repository is the single source of truth. In **Fork** mode, repository updates will not overwrite your local changes, which means your rules may drift from the repository over time.
:::
#### Content Type
Currently, the only supported option in the **Content Type** dropdown is **Hunt/Triage Rules**. Additional content types may be added in future releases.
#### Rule Engine
Select the rule engine that matches the files in your repository:
- **YARA** — For YARA rule files. When YARA is selected, you must also choose **Search In** (scan **Memory**, **Disk**, or **Both**). The console labels this control **Search In**; it defines the same hunt scope as **Memory** / **Disk** / **Both** described elsewhere in AIR.
- **Sigma** — For Sigma detection rule files
- **osquery** — For osquery pack files
:::note
Each repository connection supports a single rule engine. If your repository contains multiple rule types (e.g., both YARA and Sigma rules), create separate connections — one for each rule engine — and use **Include Paths** to scope each connection to the appropriate directory.
:::
#### Tags
Add tags to organize and filter the imported rules within AIR. Tags are applied to all rules imported from this connection and appear in the **Libraries > Hunt/Triage Rules** view. Automatic **git-sync** tags are always applied in addition to any tags you add. You can use nested tagging with colons (e.g., `APT28:Windows:persistence`) for hierarchical organization.
Click **Create** to finalize the connection.
## Synchronization
After creating a repository connection, AIR performs the initial synchronization based on your configuration. You can monitor and manage synchronization from the **Integrations > Git Repositories** page.
### Sync Status
The repository list displays key information for each connection:
- **Repository Name** and **Provider**
- **Repository URL**
- **Sync Status** — Success, In Progress, or Failed
- **Last Sync** timestamp
- **Created By**
### Sync Logs
Click on a repository connection to view detailed synchronization logs. Each sync event records:
- Files added, updated, or removed
- Any errors or skipped files
- Timestamp and duration
### Manual Sync
Click **Sync Now** on any repository connection to trigger an immediate synchronization, regardless of the configured sync interval.
## Viewing Synced Rules
Imported rules appear in **Libraries > Hunt/Triage Rules** alongside manually created rules. Rules imported from a Git repository are identified by a **Git Repository** source label, making it easy to distinguish them from locally created rules.
From the rule details view, you can see all metadata including the tags, rule engine, ownership mode, and source repository associated with each rule.
## Webhooks for Automatic Sync
When using the **Automatic** sync interval, AIR uses webhooks to receive push notifications from your Git provider. This ensures rules are updated immediately when changes are committed to the repository. Refer to your Git provider's documentation for webhook configuration:
- **GitHub** — Configure a webhook in your repository's **Settings > Webhooks** section
- **GitLab** — Configure a webhook in your project's **Settings > Webhooks** section
- **Azure DevOps** — Configure a service hook in **Project Settings > Service hooks**
- **Bitbucket** — Configure a webhook in your repository's **Settings > Webhooks** section
Links to the relevant provider documentation are provided within the AIR connection wizard during setup.
## Limits
AIR enforces file size and repository limits to maintain performance:
- Individual rule files larger than **10 MB** are skipped during synchronization
- Repositories containing more than **10,000** files are skipped; an informational notice is shown in the wizard and sync experience
These limits are designed to prevent performance degradation and are displayed in the AIR interface when applicable.
## Network Requirements
The AIR Console connects directly to your Git provider to fetch repository contents. If your organization restricts outbound network access from the Console, ensure the following domains are allowed:
| Provider | Domain(s) to Allow |
|----------|-------------------|
| **GitHub** | `github.com`, `api.github.com` |
| **GitLab** (cloud) | `gitlab.com` |
| **GitLab** (self-hosted) | Your GitLab instance domain |
| **Azure DevOps** | `dev.azure.com` |
| **Bitbucket** | `bitbucket.org`, `api.bitbucket.org` |
:::caution
If these domains are not accessible from the Console, synchronization will fail. Ensure your network policies and firewall rules permit outbound HTTPS (port 443) access to the relevant provider domains.
:::
---
# Cyber Threat Intelligence (STIX/TAXII Feed Integration)
> Source: https://kb.binalyze.ai/air/integrations/cyber-threat-intelligence-stix-taxii-feed-integration.html
Cyber Threat Intelligence integration in AIR enables you to ingest structured threat intelligence from STIX/TAXII-compatible feeds and operationalize it in investigation workflows.
The integration connects AIR to external **TAXII 2.x** servers, pulls **STIX** objects, parses indicators, and converts them into investigation-ready **YARA, Sigma, and osquery hunt/triage rules**.
## Key capabilities
With Cyber Threat Intelligence integration, you can:
- Connect to TAXII 2.x compliant feeds (public or private)
- Discover available TAXII collections automatically
- Run scheduled or manual sync jobs
- Apply confidence filtering before rule generation
- Convert indicators into YARA, Sigma, and osquery hunt/triage rules
- Browse imported indicators and sync history in AIR
## Supported authentication methods
You can configure feed access with:
- No authentication (for public feeds)
- Bearer token
- Basic authentication
- API key via custom header
## Prerequisites
Before configuring a feed, verify the following:
- You have administrative access in AIR
- Your feed provider supports TAXII 2.x and STIX data
- You have the required feed credentials/tokens
- The Console can reach the feed endpoint over the network
- The Cyber Threat Intelligence integration feature is enabled in your environment
## Recommended setup workflow
1. Add the TAXII feed URL and authentication details.
2. Test connection and load available collections.
3. Select collections to subscribe.
4. Configure conversion options per category.
5. Set sync strategy (manual or scheduled).
6. Run initial sync and review generated hunt/triage rules.
## Supported indicator categories
The current parser supports these indicator categories:
- File hash
- File path
- Network address (IPv4/IPv6)
- Domain
- URL
- Email
- Registry key
- Mutex
- Process
- Direct YARA pattern
- Direct Sigma pattern
## Rule generation and ownership modes
When content type is hunt/triage rules, imported indicators are converted into YARA, Sigma, or osquery content.
| Mode | Behavior |
| -------- | -------------------------------------------------------------------------------------------- |
| Managed | Rules are maintained by the system and updated on sync cycles. |
| Snapshot | Rules are created as a point-in-time snapshot and are not overwritten by later sync updates. |
## Sync behavior
- Scheduled sync intervals support: `15`, `30`, `60`, `120`, `360`, `720`, `1440` minutes
- Manual sync is supported
- Sync logs are retained for recent runs and can be reviewed in the UI
- Incremental sync is used to reduce repeated data transfer
## Current limitations
- TAXII 1.x is not supported
- Compound STIX patterns (for example `AND` / `OR` mixed observables) are not supported
- Feed ingestion is pull-based (no webhook/push mode)
## Best practices
- Start with trusted collections and expand gradually
- Set a sensible confidence threshold to reduce noisy indicators
- Define clear ownership for feed maintenance and review
- For Snapshot mode, periodically remove low-value or stale feed sources and keep curated feeds only.
## How conversion works in practice
During each sync, AIR processes incoming STIX objects and applies your collection-level configuration:
1. Pull indicators from selected TAXII collections.
2. Parse supported indicator patterns into internal categories.
3. Filter indicators by confidence threshold and supported pattern rules.
4. Group indicators by engine/category mapping.
5. Generate or update hunt/triage rules (YARA, Sigma, osquery).
In Managed mode, generated rules are maintained by sync cycles. In Snapshot mode, generated rules are preserved as point-in-time outputs.
## FAQ
### Why do I see fewer indicators than expected after sync?
This usually means one or more indicators were excluded by configuration or parser rules, for example:
- Confidence is below your minimum threshold
- Pattern type is unsupported for the current phase
- Indicator category is disabled in conversion settings
- Indicator has expired or is no longer available in the source collection
### Why did some indicators not become rules?
Not every STIX object becomes a hunt/triage rule directly. Rule creation depends on:
- Supported indicator category
- Engine mapping in your collection configuration
- Search scope compatibility for the selected engine
- Rule size and batching limits in the current implementation
### What is the difference between Managed and Snapshot modes?
- **Managed**: best for continuously updated feeds. Rules are updated by recurring sync jobs.
- **Snapshot**: best for one-time or controlled imports. Existing generated rules are not overwritten by later sync updates.
### How often should I run sync jobs?
Use shorter intervals for high-priority operational feeds and longer intervals for low-volatility feeds. Supported scheduled intervals are `15`, `30`, `60`, `120`, `360`, `720`, and `1440` minutes.
### Which authentication type should I choose?
- Use **None** for public feeds
- Use **Bearer** for token-based providers
- Use **Basic** when username/password is required
- Use **API Key** when provider expects a custom header
Always confirm the exact auth method and header format with your feed provider.
### Is TAXII 1.x supported?
No. The current integration supports TAXII 2.x only.
### Can I use webhook/push instead of polling?
Not in the current phase. Feed ingestion is pull-based through scheduled or manual sync.
### Can I ingest every STIX pattern type?
No. Compound patterns (for example mixed `AND` / `OR` object conditions) are currently out of scope and can be skipped.
---
# Webhooks
> Source: https://kb.binalyze.ai/air/integrations/webhooks/index.html
In AIR, webhooks act as triggers that enable integration with other security tools, such as SIEM, SOAR, or EDR systems. They allow AIR to automatically initiate evidence collection, analysis, and presentation of findings in response to alerts received from these tools.
:::note
APIs and webhooks both enable system integration and communication between applications but serve different use cases. **APIs are often preferred over webhooks** due to greater control, flexibility, and broader operational capabilities.
:::
A trigger is the combination of a parser, an acquisition profile, and a destination for saving the collected evidence (either local or remote options are available).
Users access webhooks by clicking the Integrations button in the Main Menu and then selecting Webhooks from the Secondary Menu. To create a new Webhook, select **+Add New**:
Webhooks: Add New
## Before you start
* Triggers are basic REST endpoints that can be called via HTTP GET or POST methods
* Each trigger
* Starts with the AIR Console address (AIR-ADDRESS)
* Has a name that makes it easy to remember (TRIGGER-NAME)
* Has a security token (TRIGGER-TOKEN) attached to it that can be regenerated when needed
* Optionally, an Endpoint Identifier that could either be the hostname or the IP address of the endpoint trigger is being called for
* GET Triggers expect this information in the URL
* POST Triggers extracts this information from the Webhook Payload
```txt title="Parts of a Trigger URL"
http:///api/trigger//{endpoint}?token=
```
## Parsers
To make it easier to integrate with any trigger source, AIR provides two alternative methods of receiving endpoint information (name or IP address):
* URL Parser (HTTP GET)
* Webhook Parser (HTTP POST)
### 1. URL Parser
This method requires the trigger source to provide an endpoint name or IP address directly in the URL.
Below is an example GET request and response for collecting "Browsing History" from an endpoint with the name "JohnPC".
Request: [http://192.168.1.100/api/trigger/browsing-trigger/**JohnPC**?token=...](http://192.168.1.100/api/trigger/browsing-trigger/JohnPC?token=...)
```javascript
Response (application/json)
HTTP 200
{
"success": true,
"data":
{
"parser": "URL",
"acquisitionProfile": "Browsing History",
"endpoints": ["JohnPC"]
}
}
```
Even without using a SIEM/SOAR, the above URL can be used for starting an acquisition task simply by:
* Visiting it with a web browser,
* Adding it to the click action of an HTML button in your case management alert reports,
* Creating a simple script for making a GET request to this address.
## 2. Webhook Parser
Webhook parsers require the trigger source to provide the endpoint information inside a JSON payload, which is POSTed to the trigger.
Splunk Parser, which is provided out of the box, is a very basic example of this. After adding a trigger URL as a POST workflow action, whenever Splunk generates an alert for an endpoint, it posts JSON alert data containing the endpoint information as a nested property, which is parsed by the trigger parser. The parser then uses this information to start an acquisition on the endpoint automatically. You can read [Splunk POST Workflow Actions](https://docs.splunk.com/Documentation/Splunk/8.0.5/Knowledge/SetupaPOSTworkflowaction) documentation for more information.
For additional webhook trigger parsers, contact [support@binalyze.com](mailto:support@binalyze.com).
## Security
Each created trigger contains a dedicated security token that can be revoked at any time.
Once you regenerate a security token, all previous integrations using the old security token will begin receiving HTTP 401/Unauthorized responses.
---
# Mattermost Integration
> Source: https://kb.binalyze.ai/air/integrations/webhooks/mattermost-integration.html
#### Step 1 - Creating A webhook for Mattermost
* Visit the **Webhooks** page in AIR,
* Click the "**+ New Webhook**" button in the upper right corner,
* Provide a self-explanatory name (examples: RDP Brute Force Trigger, Phishing Detected Trigger, etc.),
* Select "**Mattermost: Generic Mattermost Webhook Parser**" as the parser for this webhook,
* Select an **Acquisition Profile** when **Mattermost** activates this webhook,
* Select the **Ignore** option or leave with its default value (defaults to 24 hours for recurrent alerts for a single endpoint),
* Provide other settings such as **Evidence Repository**, **CPU Limit**, **Compression & Encryption** to use or let AIR configure them automatically based on the matching policy
* Click the "**Save**" button
#### Step 2 - Setting Up Mattermost Server
* Open the dropdown menu on the left pane and click on Integrations.
* Select "Slash Commands" and click on "Add Slash Command" button.
* Fill in the text box accordingly:
* **Title:** AIR Acquisition
* **Description:** You can start an acquisition task in the specified endpoint by using this command.
* **Command Trigger Word:** Type a trigger word that can easily relate to the specified acquisition profile. **For example:** /air-acquisition-full
* **Request URL:** Webhook URL that you obtained from AIR Server.
* **Request Method: POST**
* **Response Username:** AIR
* **Response Icon:** Leave Blank.
* **Autocomplete: Selected**
* **Autocomplete Hint:** \[Endpoint Hostname]
* **Autocomplete Description:** Provide the hostname of the endpoint.
* Click save.
Mattermost will provide a Token to authenticate the slash command in AIR Server. Click done.
#### Step 3- Using integration
Go to a channel and press "/" for available commands.
Type `/air-acquisition-full [ENDPOINT HOSTNAME]`.
For example:
`/air-acquisition-full SampleDummyHostForTest`
---
# Splunk Integration
> Source: https://kb.binalyze.ai/air/integrations/webhooks/splunk.html
Integration of AIR with Splunk is possible via a feature called "[Post Actions](https://docs.splunk.com/Documentation/Splunk/8.1.3/Knowledge/SetupaPOSTworkflowaction)".
* When Splunk generates an alert for an incident, it sends a JSON payload to the URL provided in Workflow Actions.
* The payload that is POSTed contains essential information about the alert, such as the Host Name, IP Address, and other alert-specific details.
* Upon receiving this JSON data, AIR parses the payload and extracts the IP address or Hostname from it, and automatically assigns an acquisition task to the endpoint in question. The acquisition profile that will be used for this task is provided when you create a trigger.
## Steps to Integrate
* Visit the Triggers page in AIR
* Click the "+ New Trigger" button in the upper right corner
* Provide a self-explanatory name (examples: RDP Brute Force Trigger, Phishing Detected Trigger, etc)
* Select "Splunk: Generic Splunk Webhook Parser" as the parser for this trigger.
* Select an Acquisition Profile that will be used when Splunk activates this trigger
* Select the Ignore option or leave with its default value (defaults to 24 hours for recurrent alerts for a single endpoint)
* Provide additional settings, such as Compression, Encryption, and Evidence Repository, to use or let the AIR configure them automatically based on the matching policy.
* Click the "Save" button.
* Hover your mouse over the link below the Trigger name and click to copy (see below)
* Head over to Splunk and create a [POST Workflow Action](https://docs.splunk.com/Documentation/Splunk/8.1.3/Knowledge/SetupaPOSTworkflowaction) for your workflow
* Provide the Trigger URL you have copied above as the **`URI`** to the newly created Workflow Action,
* Make sure you have provided the Host Name or IP Address in **`Post Arguments`**
* At this point, whenever Splunk generates an alert for an endpoint, the information will be sent to AIR for it to assign an acquisition task to the endpoint in question automatically.
---
# IBM QRadar Integration
> Source: https://kb.binalyze.ai/air/integrations/webhooks/ibm-qradar-integration.html
Integration of AIR with IBM QRadar is possible via a feature called "[Custom Actions](https://www.ibm.com/docs/en/qsip/7.4?topic=tasks-adding-custom-actions)".
* When QRadar generates an alert for an incident, it runs a script provided in Custom Actions,
* The properties of the alert alongside some fixed properties are then sent to the trigger URL provided in the bash script,
* Upon receiving the URL request, AIR extracts the IP address or Hostname from the URL and automatically assigns an acquisition task to the endpoint in question. The acquisition profile that will be used for this task is provided when you create a trigger.
### Steps to Integrate
#### Step 1: Create a Script File
Create a script file with the contents below and save it as "_**air-trigger.sh**_"
```
#!/bin/bash
# Define external variables
air_address=$1
trigger_name=$2
trigger_token=$3
endpoint=$4
# Make a GET request to AIR console API
output=$(curl -k http://$air_address/api/webhook/$trigger_name/$endpoint?token=$trigger_token)
# Print out the output
echo $output
```
#### Step 2: Create a Trigger for QRadar
* Visit the Triggers page in AIR
* Click the "+ New Trigger" button on the upper right corner
* Provide a self-explanatory name (examples: RDP Brute Force Trigger, Phishing Detected Trigger, and etc.)
* Select "QRadar Read Endpoint Name or IP Address from URL Path" as the parser for this trigger
* Select an Acquisition Profile that will be used when this trigger is activated by QRadar
* Select the Ignore option or leave it with its default value (defaults to 24 hours for recurrent alerts for a single endpoint)
* Provide other settings such as Compression, Encryption, Evidence Repository to use or let AIR configure them automatically based on the matching policy
* Click the "Save" button
* Hover your mouse over the link below the Trigger name and click to copy
#### Step 3: Create a Custom Action in QRadar
* Go to QRadar Admin > Define Action > Add > Custom Action Define
* In the "Edit Custom Action" dialog, upload the script file created in the step above
* Select "Bash" as the Interpreter value
* In the "Script Parameters" section
* Leave "Parameter Name" empty
* Select the "Fixed Property" radio button and leave the "Value" field empty
* Do \*not\* check the "Encrypt Value" option
* Click the "Add" button and add the parameters listed in the below table
* Click Save
| Name | Type | Value |
| -------------- | ---------------------- | ---------------------- |
| air\_address | Fixed Property | **TYPE-AIR-ADDRESS** |
| trigger\_name | Fixed Property | **TYPE-TRIGGER-NAME** |
| trigger\_token | Fixed Property | **TYPE-TRIGGER-TOKEN** |
| endpoint | Network Event Property | sourceip |
:::caution
Please provide the values in the order they are listed above.
:::
:::note
Fixed Property values can be retrieved from the Trigger URL.
Network Event Property values are provided by QRadar for each alert.
:::
---
# Wazuh Integration
> Source: https://kb.binalyze.ai/air/integrations/webhooks/wazuh-integration.html
Integration of AIR with Wazuh is possible through the "Integrations" feature.
When Wazuh's configuration file contains the integration setting with the specified Rule ID, it executes a defined script. The defined Python script sends the relevant information with a POST request to the AIR.
### Steps to Integrate
#### **Step 1: Create a Trigger for Wazuh**
- Visit the **Webhooks** page in AIR.
- Click the "**+ New Webhook**" button in the upper right corner,
- Provide a self-explanatory name (examples: RDP Brute Force Trigger, Phishing Detected Trigger, etc.),
- Select "**Wazuh: Wazuh AIR Integration**" as the parser for this webhook.
- Select an **Acquisition Profile** when Wazuh activates this webhook.
- Select the **Ignore** option or leave with its default value (defaults to 24 hours for recurrent alerts for a single asset).
- Provide other settings, such as Evidence Repository, CPU Limit, Compression, and Encryption, to use or let AIR configure them automatically based on the matching policy.
- Click the "**Save**" button,
- Hover your mouse over the link below the Webhook name and double-click to copy (see below),
#### **Step 2: Add the Integration Settings in Wazuh**
Open the ossec.conf file with a preferred text editor and add the following line to the end of the file before closing the ossec_config. The name must be precisely custom-air. For detailed information, please see the [Wazuh Documentation](https://documentation.wazuh.com/current/user-manual/reference/ossec-conf/integration.html).
```
///redacted///
…
custom-airThe Webhook URL copied in Step 1The Rule ID you want to trigger AIRjson
```
#### **Step 3: Creating the scripts in Wazuh**
- Every time the relevant rule_id is triggered, a bash script named custom-air is executed. Create a file named **custom-air** in **/var/ossec/integrations/** paste the following script. For detailed information, please refer to the [Wazuh Documentation](https://wazuh.com/blog/how-to-integrate-external-software-using-integrator/).
```
#!/bin/sh
WPYTHON_BIN="framework/python/bin/python3"
SCRIPT_PATH_NAME="$0"
DIR_NAME="$(cd $(dirname ${SCRIPT_PATH_NAME}); pwd -P)"
SCRIPT_NAME="$(basename ${SCRIPT_PATH_NAME})"
case ${DIR_NAME} in
*/active-response/bin | */wodles*)
if [ -z "${WAZUH_PATH}" ]; then
WAZUH_PATH="$(cd ${DIR_NAME}/../..; pwd)"
fi
PYTHON_SCRIPT="${DIR_NAME}/${SCRIPT_NAME}.py"
;;
*/bin)
if [ -z "${WAZUH_PATH}" ]; then
WAZUH_PATH="$(cd ${DIR_NAME}/..; pwd)"
fi
PYTHON_SCRIPT="${WAZUH_PATH}/framework/scripts/${SCRIPT_NAME}.py"
;;
*/integrations)
if [ -z "${WAZUH_PATH}" ]; then
WAZUH_PATH="$(cd ${DIR_NAME}/..; pwd)"
fi
PYTHON_SCRIPT="${DIR_NAME}/${SCRIPT_NAME}.py"
;;
esac
${WAZUH_PATH}/${WPYTHON_BIN} ${PYTHON_SCRIPT} "$@"
```
- Create a python script named **custom-air.py /var/ossec/integrations/** and paste the following script. The script runs another python script and makes a request to the air server.
```
#!/usr/bin/env python
import json
import sys
import time
import os
try:
import requests
from requests.auth import HTTPBasicAuth
except Exception as e:
print("No module 'requests' found. Install: pip3 install requests")
sys.exit(1)
# ossec.conf configuration:
#
# custom-air
# Wazuh WebHook URL
# XXXXXX
# json
#
debug_enabled = False
pwd = os.path.dirname(os.path.dirname(os.path.realpath(__file__)))
json_alert = {}
now = time.strftime("%a %b %d %H:%M:%S %Z %Y")
# Set paths
log_file = '{0}/logs/integrations.log'.format(pwd)
def main(args):
debug("# Starting")
# Read args
alert_file_location = args[1]
webhook = args[3]
debug("# Webhook")
debug(webhook)
debug("# File location")
debug(alert_file_location)
# Load alert. Parse JSON object.
with open(alert_file_location) as alert_file:
json_alert = json.load(alert_file)
debug("# Processing alert")
debug(json_alert)
debug("# Generating message")
msg = generate_msg(json_alert)
debug(msg)
debug("# Sending message")
send_msg(msg, webhook)
def debug(msg):
if debug_enabled:
msg = "{0}: {1}\n".format(now, msg)
print(msg)
f = open(log_file, "a")
f.write(msg)
f.close()
def generate_msg(alert):
level = alert['rule']['level']
msg = {}
msg['pretext'] = "WAZUH AIR integration"
msg['Name'] = alert['agent']['name']
msg['IP'] = alert['agent']['ip']
msg['Title'] = alert['rule']['description'] if 'description' in alert['rule'] else "N/A"
msg['Rule ID'] = alert['rule']['id']
msg['ts'] = alert['id']
attach = {'attachments': [msg]}
return json.dumps(attach)
def send_msg(msg, url):
headers = {'User-Agent': 'AIR Script', 'Content-type': 'application/json', 'Accept-Charset': 'UTF-8'}
res = requests.post(url, data=msg, headers=headers)
debug(res)
if __name__ == "__main__":
try:
# Read arguments
bad_arguments = False
if len(sys.argv) >= 4:
msg = '{0} {1} {2} {3} {4}'.format(
now,
sys.argv[1],
sys.argv[2],
sys.argv[3],
sys.argv[4] if len(sys.argv) > 4 else '',
)
debug_enabled = (len(sys.argv) > 4 and sys.argv[4] == 'debug')
else:
msg = '{0} Wrong arguments'.format(now)
bad_arguments = True
# Logging the call
f = open(log_file, 'a')
f.write(msg + '\n')
f.close()
if bad_arguments:
debug("# Exiting: Bad arguments.")
sys.exit(1)
# Main function
main(sys.argv)
except Exception as e:
debug(str(e))
raise
```
- The scripts must be placed in **/var/ossec/integrations**, have the same name as indicated in the configuration block, contain execution permissions, and belong to the root user of the ossec group. **Execute** the following two commands:
```
#chmod 750 /var/ossec/integrations/custom-air
#chown root:ossec /var/ossec/integrations/custom-air
#chmod 750 /var/ossec/integrations/custom-air.py
#chown root:ossec /var/ossec/integrations/custom-air.py
```
---
# Cortex XSOAR Integration
> Source: https://kb.binalyze.ai/air/integrations/webhooks/cortex-xsoar-integration.html
### Steps to Integrate
**Step 1: Preparing API Token**
1. Create a new API Token by clicking the Settings → API Tokens.
2. Give a Token Name.
3. Choose an expiration date.
4. Click **Save** and copy the token.
#### **Step 2: Adding Integration to Cortex XSOAR**
1. Sign in to Cortex XSOAR server.
2. Click “**Marketplace**” on the left bottom corner.
3. Search and install the AIR Integration to your instance.
#### **Step 3: Setting up the Integration**
1. Click “**Settings**” on the left bottom corner.
2. Find installed integration, and click “**Add instance**”
3. Fill in the AIR Server URL and API Key. Click “**Test**”, and you will see “**Success**”, which means Cortex XSOAR established the test connection with the AIR Server.
4. **Save** and **Exit.**
### Usage
**Isolation**
* You can use the integration in Automations, Playbooks, or War Room.
* To execute an isolation task, write the following command at the bottom of the page:
```
!air-isolate hostname= organization_id= isolation=
```
* **Acquisition**
* To execute an acquisition task, write the following command at the bottom of the page:
```
!binalyze-air-acquire case_id= hostname= organization_id=0 profile="PROFILE"
```
---
# Elasticsearch Logstash Kibana Integration
> Source: https://kb.binalyze.ai/air/integrations/webhooks/elasticsearch-logstash-kibana-integration.html
#### Step 1 - Creating A webhook for ELK
* Visit the **Webhooks** page in AIR,
* Click the "**+ New Webhook**" button in the upper right corner,
* Provide a self-explanatory name (examples: RDP Brute Force Trigger, Phishing Detected Trigger, etc.),
* Select "Elasticsearch Logstash Kibana**: Generic** Elasticsearch Logstash Kibana" as the parser for this webhook,
* Select an **Acquisition Profile** when ELK activates this webhook,
* Select the **Ignore** option or leave with its default value (defaults to 24 hours for recurrent alerts for a single endpoint),
* Provide other settings such as **Evidence Repository**, **CPU Limit**, **Compression & Encryption** to use or let AIR configure them automatically based on the matching policy
* Click the "**Save**" button
#### Step 2: Preparing ELK Watcher
* Visit the \/app/management/insightsAndAlerting/watcher/watches . On the right, click **"Create"** then **"Create advanced watch"**.
* Add an action part to your watcher.
* Change the following JSON:
1. Host: AIR Server address,
2. Port: AIR Server port,
3. Path: The webhook full path,
4. Token: The token that you created in AIR Server.
5. Body: The body part must include either the endpoint hostname or endpoint IP. Mapping must be customized with the watcher payload itself.
`{ "trigger": { "schedule": { "interval": "30m" } }, "input": { "search": { "request": { "search_type": "query_then_fetch", "indices": [ "*" ], "rest_total_hits_as_int": true, "body": { "size": 0, "query": { "match_all": {} } } } } }, "condition": { "compare": { "ctx.payload.hits.total": { "gte": 10 } } }, "actions": { "binalyzeAIR_webhook": { "webhook": { "scheme": "http", "host": "`**`air-server-url`**` ", "port":`` `` `**`80`**`, "method": "post", "path": "`**`/api/webhook/NAME`**`", "params": { "token": "`**`9236a8a1-ffb9-4521-9947-3f46548916c0`**`" }, "headers": { "Content-Type": "application/json" }, "body": """["{{`**`ctx.payload.endpoint`**`}}"]""" } } } }`
* You can simulate the post request to learn if it's working.
Please refer to the vendor's [documentation](https://www.elastic.co/guide/en/elasticsearch/reference/current/how-watcher-works.html) for more information.
---
# ServiceNow Integration
> Source: https://kb.binalyze.ai/air/integrations/webhooks/servicenow-integration.html
### Steps to Integrate
#### **Step 1: Create a Trigger for ServiceNow**
* Visit the **Webhooks** page in AIR,
* Click the "**+ New Webhook**" button in the upper right corner,
* Provide a self-explanatory name (examples: RDP Brute Force Trigger, Phishing Detected Trigger, etc.),
* Select "**ServiceNow: Generic ServiceNOW Webhook Parser**" as the parser for this webhook,
* Select an **Acquisition Profile** when ServiceNow activates this webhook,
* Select the **Ignore** option or leave with its default value (defaults to 24 hours for recurrent alerts for a single endpoint),
* Provide other settings such as **Evidence Repository**, **CPU Limit**, **Compression & Encryption** to use or let AIR configure them automatically based on the matching policy,
* Click the "**Save**" button,
* Hover your mouse over the link below the Webhook name and double-click to copy.
#### **Step 2: Creating the Integration Settings in ServiceNow**
* Open the Business Rules under the System Definitions and click **New**,
* Give your new Business Rule a descriptive name, choose the table you want it to trigger on, and check the **Advanced** box.
* Under the option: **When**, choose **after.** You can use various conditions and filtering functions accordingly.
* Click the **Advanced** Tab and paste the following script. **Change the 5th line** \ with the webhook link you copied in **Step 1**.
* ```javascript
(function executeRule(current, previous /*null when async*/) {
try {
var r = new sn_ws.RESTMessageV2();
// paste related webhook url below
var airwebhookurl = "";
//defining the hostname of endpoint or ip
var endpointIP = current.getValue("hostname");
r.setRequestHeader("Content-Type","application/json");
r.setHttpMethod("post");
r.setStringParameter("baseUrl",airwebhookurl);
var obj = {
"endpoint": endpointIP
};
var body = JSON.stringify(obj);
r.setRequestBody(body);
var response = r.execute();
var httpStatus = response.getStatusCode();
if(httpStatus==200) {
gs.info("Webhook target HTTP status response: " + httpStatus);
return httpStatus;
} else {
gs.log(response.getErrorCode()+"---"+response.getErrorMessage());
return httpStatus;
}
} catch (ex) {
var message = ex.message;
gs.error("Error message: " + message);
}
gs.info("Webhook target HTTP status response: " + httpStatus);
})(current, previous);
```
* Click **Submit** on the top right.
#### **Step 3: Testing the business rule.**
Once you have set up the webhook, you can test the business rule based on the triggering conditions. Check the response body for the data being sent from ServiceNow.
---
# Sumo Logic Integration
> Source: https://kb.binalyze.ai/air/integrations/webhooks/sumo-logic-integration.html
### Steps to Integrate
#### **Step 1: Create a Webhook**
* Visit the **Webhooks** page in AIR,
* Click the "**+ New Webhook**" button on the upper right corner,
* Provide a self-explanatory name (examples: RDP Brute Force Trigger, Phishing Detected Trigger, etc.),
* Select "**Sumo Logic: Generic Sumo Logic Webhook Parser**" as the parser for this webhook,
* Select an **Acquisition Profile**,
* Provide other settings such as **Evidence Repository**, **CPU Limit**, **Compression & Encryption** to use or let AIR configure them automatically based on the matching policy
* Click the "**Save**" button,
* Hover your mouse over the link below the Webhook name and double-click to copy
#### **Step 2: Configure Sumo Logic SIEM**
On the left pane, click "**Manage Data**" then "**Monitoring**", and alter "**Connections**".
* Give a name to webhook,
* Write a description (optional),
* Paste Webhook URL, you copied in Step 1,
* Type your payload\*: \["\{{ResultsJson.client\_ip\}}"]
* Save and exit.
For more information, please visit [here](https://help.sumologic.com/docs/alerts/webhook-connections/set-up-webhook-connections/#Webhook_payload_variables).
---
# Crowdstrike Integration
> Source: https://kb.binalyze.ai/air/integrations/webhooks/crowdstrike-integration.html
## Steps to Integrate
#### **Step 1: Create a Webhook**
* Visit the **Webhooks** page in AIR,
* Click the "**+ New Webhook**" button in the upper right corner,
* Provide a self-explanatory name (examples: RDP Brute Force Trigger, Phishing Detected Trigger, etc.),
* Select "**Crowd Strike Webhook Parser**" as the parser for this webhook,
* Select an **Acquisition Profile**,
* Provide other settings such as **Evidence Repository**, **CPU Limit**, **Compression & Encryption** to use or let AIR configure them automatically based on the matching policy.
* Click the "**Save**" button,
* Hover your mouse over the link below the Webhook name and double-click to copy
#### **Step 2: Configure Crowdstrike**
#### Navigate to the CrowdStrike
* Go to Crowdstrike Store, find the Webhook Plugin, and open it.
* Click Configure, and fill in the blanks
* Name: Give an explanatory name
* Webhook URL: Paste the webhook you created earlier,
* Click Notify On Configuration Failure and save the configuration.
* Go to Fusion workflow,
* Create a workflow or use an existing one,
* Create a trigger, **Add action**
* Choose action type: **Notification**
* Choose the webhook name you created in the second step
* Add **Sensor Hostname** to **Data to Include**
Save and exit.
---
# Microsoft Sentinel Integration
> Source: https://kb.binalyze.ai/air/integrations/webhooks/microsoft-sentinel-integration.html
#### Step 1 - Creating A webhook for Microsoft Sentinel
- Visit the **Webhooks** page in AIR,
- Click the "**+ New Webhook**" button in the upper right corner,
- Provide a self-explanatory name,
- Select "**Microsoft Sentinel: Generic Sentinel Webhook Parser**" as the parser for this webhook,
- Select an **Acquisition Profile** when the trigger activates this webhook,
- Select the **Ignore** option or leave with its default value (defaults to 24 hours for recurrent alerts for a single endpoint),
- Provide other settings such as **Evidence Repository**, **CPU Limit**, **Compression & Encryption** to use or let AIR configure them automatically based on the matching policy
- Click the "**Save**" button
**Step 2:**
- Sign in to the [Azure portal](https://portal.azure.com/). Open your related logic app in Logic App Designer.
- Under the designer's search box, select **Built-in**. In the search box, enter `http web hook` as a filter. From the **Triggers** list, select the **HTTP** W**ebhook**.
- Fill in the box accordingly:
- Subscribe Method: **POST**
- Subscribe URI: **Webhook URL**
- Subscribe body: **Extended properties.**
For more information, please refer to [**Microsoft Documentation**](https://learn.microsoft.com/en-us/azure/connectors/connectors-native-http)**.**
---
# Slack Integration
> Source: https://kb.binalyze.ai/air/integrations/webhooks/slack-integration.html
### **Step 1 - Create Triggers for Slack**
* Visit the **Webhooks** page in AIR,
* Click the "**+ New Webhook**" button on the upper right corner,
* Provide a self-explanatory name (examples: RDP Brute Force Trigger, Phishing Detected Trigger, etc.),
* Select "**Slack: Generic Slack Webhook Parser**" as the parser for this webhook,
* Select an **Acquisition Profile** when **Slack** activates this webhook,
* Select the **Ignore** option or leave with its default value (defaults to 24 hours for recurrent alerts for a single endpoint),
* Provide other settings such as **Evidence Repository**, **CPU Limit**, **Compression & Encryption** to use or let AIR configure them automatically based on the matching policy
* Click the "**Save**" button,
* Hover your mouse over the link below the Webhook name and double-click to copy.
### Step 2 - Create A Slack app
You need to [create a new Slack app](https://api.slack.com/apps?new_app=1\&ref=bolt_start_hub).
Click **From scratch**, type App Name: **AIR,** pick a workspace to develop your app in and click **Create App** (no matter what workspace you select, you'll still be able to [distribute your app](https://api.slack.com/start/distributing/public) to the other workspaces if you choose).
#### Scopes
Scopes give your app permission to do things (for example, post messages) in your development workspace. Make sure that AIR is chosen on the top of the sidebar and then you can select the scopes to add to your app by navigating over to the **OAuth & Permissions** sidebar.
Scroll down to the **Bot Token Scopes** section and click **Add an OAuth Scope**. You should add:
`chat:write` and `commands` .
#### Installing your app
Install your own app by selecting the **Install to Workspace** button on the OAuth & Permissions page.
After **allowing the AIR,** you'll be sent through the Slack OAuth UI.
### Step 3 - Create A Slash Command
* In **app's management dashboard,** click the **Slash Commands** feature in the menu.
* Click on the **Create New Command**.
* Fill in the blanks as shown below.
* **Command:** /air-acquisition-ACQUISITION-PROFILE
* **Request URL:** The webhook URL that you create in the AIR Server.
* **Short Description:** Trigger full acquisition
* **Usage Hint:** endpoint
* Save and exit.
### Step 4 - Using A Slash Command
* Add the application to the relevant channel.
* Invoke a command with:
`/air-acquisition-compromise-assessment WINXXXX`
---
# Carbon Black Cloud Integration
> Source: https://kb.binalyze.ai/air/integrations/webhooks/carbon-black-cloud-integration.html
### Prerequisites
* Carbon Black Defense API key with access level type.
* Creating a credentials.psc file with the help of `cbapi-defense configure`
* AIR instance URL and webhook name and token.
* Docker
* A machine with Network Connection to AIR and Carbon Black Cloud instances.
### Configuration
#### Navigate to Carbon Black Cloud Console
* Create API key
* Navigate to Settings > API Keys > Add API Key
* Create an API Key with _Access Level_ SIEM and Copy both keys
* API ID _Connector ID_
* API Secret Key _API Key_
* Create an Alert Notification
* Navigate to \*\*Settings > Notification > Add Notification
* Fill in the necessary details
* Select the Created API Key on the first step
* Save
#### Navigate to AIR Console
* Create a webhook
* Click Webhook on the left-hand pane
* Click **+ New Webhook**
* Select **Carbon Black Parser** from **Parser**
* Fill in all the necessary information and save
* Copy the **Webhook URL,** and paste it to the value of AIR\_WEBHOOK\_URL in .env:1.
#### Navigate the environment you want to run the script
* Create credentials.defense file
* Install [cbapi](https://cbapi.readthedocs.io/en/latest/installation.html)
* Run cbapi-defense configure and follow the instructions. Please refer to [Carbon Black Documentation](https://developer.carbonblack.com/reference/enterprise-response/guide/getting-started-with-the-cbapi/) for more information.
* A credentials.defense file will be created and copy it to the current working directory.
### Usage
* Clone the repo
* Follow the Configuration part and make the proper changes.
* Run `docker build -t carbonblack-air-integration .` and finally `docker run --env-file=.env carbonblack-air-integration`
* The script will start running and will listen to new Carbon Black alerts. Once a new alert is detected, it will send an acquisition request to the specified AIR instance.
* A message appears when an acquisition request has been sent to the device.
* If an error occurs, the script will print the error message and log it in the integration.log file.
For more information and script, please visit: [https://github.com/binalyze/carbonblack-air](https://github.com/binalyze/carbonblack-air)
---
# Rapid7 InsightIDR Integration
> Source: https://kb.binalyze.ai/air/integrations/webhooks/rapid7-insightidr-integration.html
**Step 1 - Creating A webhook for Rapid7 InsightIDR**
* Visit the **Webhooks** page in AIR,
* Click the "**+ New Webhook**" button in the upper right corner,
* Provide a self-explanatory name,
* Select "**Rapid7 InsightIDR** **Webhook Parser**" as the parser for this webhook,
* Select an **Acquisition Profile** when the trigger activates this webhook,
* Select the **Ignore** option or leave with its default value (defaults to 24 hours for recurrent alerts for a single endpoint),
* Provide other settings such as **Evidence Repository**, **CPU Limit**, **Compression & Encryption** to use or let AIR configure them automatically based on the matching policy
* Click the "**Save**" button.
**Step 2: Create Triggers for InsightIDR**
* From the left menu, go to **Data Collection** and click **Data Exporters**.
* Click **Add Data Exporter**.
* Select Universal Webhook as the **Data Exporter Type**.
* Choose your collector. You can also name your data exporter if you want. Provide the URL that you previously configured.
* Add `Content-Type: application/json` for your webhook HTTP POST request.
* Select the **Alerts** checkbox to export asset-specific alerts from InsightIDR.
* Optionally, trust all certificates or self-signed certificates by selecting the **Certificate Settings** checkboxes.
* Click **Save**
Please refer to [Rapid7 documentation](https://docs.rapid7.com/insightidr/webhook/) for more information.
---
# LogicHub SOAR (DEVO) Integration
> Source: https://kb.binalyze.ai/air/integrations/webhooks/logichub-soar-devo-integration.html
**Step 1 - Creating A webhook for LogicHub SOAR (DEVO)**
* Visit the **Webhooks** page in AIR,
* Click the "**+ New Webhook**" button in the upper right corner,
* Provide a self-explanatory name,
* Select "**LogicHub SOAR (DEVO) Webhook Parser**" as the parser for this webhook,
* Select an **Acquisition Profile** when the trigger activates this webhook,
* Select the **Ignore** option or leave with its default value (defaults to 24 hours for recurrent alerts for a single endpoint),
* Provide other settings such as **Evidence Repository**, **CPU Limit**, **Compression & Encryption** to use or let AIR configure them automatically based on the matching policy
* Click the "**Save**" button.
**Step 2 - Navigate to DEVO Console**
* To define new alerts, you need to have a role with management permissions on **Alert configuration** and also in **My Alerts** or any of the subcategories (**Administration** → **Roles** → **Permissions**/**Alerts** tabs).
* Alerts are tasks that continually monitor active queries to look for and report on specific events or conditions. Therefore, alerts are created from within the **Data Search** area where queries are made.
* Open the required data table and perform the operations and filters necessary to identify the alert condition. Then, select **New Alert Definition** on the toolbar and fill in the required information as instructed in the section [below](https://docs.devo.com/space/latest/95126538/Creating+new+alerts#New-Alert-Definition-window). Click **Create** to save the alert.
* The new alert is automatically associated with the default sending policy. If you want to choose a different one, go to **Administration → Alert Configuration**. Check the [Manage defined alerts](https://docs.devo.com/space/latest/95127087) article to know how to do it.
* You can also click on the **Configure Alerts** button on the message that appears right after creating the alert. Follow the [instructions](https://docs.devo.com/space/latest/95126538/Creating+new+alerts) to create an alert in the alert window.
**Step 3 - Create** [**HTTP-JSON Delivery Method**](https://docs.devo.com/space/latest/95127355/HTTP-JSON+delivery+methods)
* HTTP-JSON type delivery methods send alerts to any server configured to receive JSON objects.
* Alerts are encapsulated as a JSON object and sent using the POST request method over HTTP or HTTPS. If the destination server uses [Digest access authentication](http://en.wikipedia.org/wiki/Digest_access_authentication), you can identify the user and password required for authentication.
* Fill in the information required on the **New Delivery Method** window for this delivery method (for the creation process, visit [Manage delivery methods](https://docs.devo.com/space/latest/95127270).
**Step 4 - Activate the delivery method**
* The new delivery method is saved in **Pending** status.
* To activate it, you must introduce in Devo the HTTP validation code you will receive through the URL specified. This activation code must be validated on the server before the delivery method can be used.
* Copy the code and then return to Devo's newly created delivery method. Click **pending activation** under the **status** column, paste the validation code into the **Activation Code** window, and click **Apply**.
* Now associate this new delivery method with [sending policies](https://docs.devo.com/space/latest/95127214) to start receiving alerts through this method.
---
# Fortigate SIEM Integration
> Source: https://kb.binalyze.ai/air/integrations/webhooks/fortigate-siem-integration.html
**Step 1 - Creating A webhook for Fortigate SIEM**
* Visit the **Webhooks** page in AIR,
* Click the "**+ New Webhook**" button in the upper right corner,
* Provide a self-explanatory name,
* Select "**Fortigate SIEM** **Webhook Parser**" as the parser for this webhook,
* Select an **Acquisition Profile** when the trigger activates this webhook,
* Select the **Ignore** option or leave with its default value (defaults to 24 hours for recurrent alerts for a single endpoint),
* Provide other settings such as **Evidence Repository**, **CPU Limit**, **Compression & Encryption** to use or let AIR configure them automatically based on the matching policy
* Click the "**Save**" button.
**Step 2 - Creating the Integration Settings in Fortinet,**
In this integration, a specific log message (failed administrator login attempt) triggers the FortiGate to send the contents of the log to **AIR Console.**
**To configure the webhook automation stitch in the GUI:**
1. Go to _Security Fabric > Automation_ and click _Create New_.
2. Enter the stitch name.
3. Configure the trigger:
* Click _Add Trigger_.
* Click _Create_ and select _FortiOS Event Log_.
* Enter the following:
* Name: _\_
* Event: _\_
* Click OK.
* Select the trigger in the list and click Apply.
4. Configure the automation stitch action:
* Click _Add Action_.
* Click _Create_ and select _Webhook_.
* Enter the following:
* Name: Trigger an Acquisition in AIR
* Protocol: HTTP
* URL: Paste the Webhook URL
* Method: POST
* HTTP body: _%%log%% **or** %%results.source%%_
* Add HTTP Header `Content-Type: application/json`
* Click _OK_.
* Select the action in the list and click _Apply_.
5. Click _OK_.
**Step 3 - To test the automation stitch in Fortinet**
1. Trigger the related event,
2. On the server, check the log to see that FortiGate sent its contents.
3. The body content is replaced with the log from the trigger.
4. On the FortiGate, go to _Log & Report > Events_ and select _System Events_ to confirm that the stitch was activated.
5. Go to _Security Fabric > Automation_ to see when the stitch was triggered.
---
# Dynatrace Integration
> Source: https://kb.binalyze.ai/air/integrations/webhooks/dynatrace-integration.html
#### Step 1 - Creating A webhook for Dynatrace
* Visit the **Webhooks** page in AIR,
* Click the "**+ New Webhook**" button in the upper right corner,
* Provide a self-explanatory name,
* Select "**Dynatrace Webhook Parser**" as the parser for this webhook,
* Select an **Acquisition Profile** when the trigger activates this webhook,
* Select the **Ignore** option or leave with its default value (defaults to 24 hours for recurrent alerts for a single endpoint),
* Provide other settings such as **Evidence Repository**, **CPU Limit**, **Compression & Encryption** to use or let AIR configure them automatically based on the matching policy
* Click the "**Save**" button
#### Step 2 - **Creating the Integration Settings in Dynatrace**
* In the Dynatrace menu, go to **Settings** > **Integration** > **Problem notifications,**
* Select **Add notification,** and a drop-down sub-menu appears,
* **Display name** This is the freeform name of this integration that will be displayed in Dynatrace on **Settings** > **Integration** > **Problem notifications** after finishing this configuration.
* **Webhook URL** The WebHook URL that you created in **Step 1,**
* **Custom payload** Once a problem is detected or resolved, this customizable payload is pushed through an **HTTP POST** to AIR,
* _Optional_ Turn on **Accept any SSL certificate,**
* _Optional_ Turn on **Call webhook if new events merge into existing problems,**
* Assign an **Alerting profile,**
* Select **Send test notification** to make sure your webhook integration is working,
* **Save** changes.
---
# Stellar XDR Integration
> Source: https://kb.binalyze.ai/air/integrations/webhooks/stellar-xdr-integration.html
**Step 1 - Create Webhook for Stellar XDR**
* Visit the **Webhooks** page in AIR,
* Click the "**+ New Webhook**" button on the upper right corner,
* Provide a self-explanatory name (examples: RDP Brute Force Trigger, Phishing Detected Trigger, etc.),
* Select "**Stellar XDR: Stellar XDR Webhook Parser**" as the parser for this webhook,
* Select an **Acquisition Profile** when InsightIDR activates this webhook,
* Select the **Ignore** option or leave with its default value (defaults to 24 hours for recurrent alerts for a single endpoint),
* Provide other settings such as **Evidence Repository**, **CPU Limit**, **Compression & Encryption** to use or let AIR configure them automatically based on the matching policy
* Click the "**Save**" button.
* Copy the Webhook URL for Step 2.
**Step 2 - Setting up Stellar XDR**
Log in to Stellar Cyber.
* Click **System | Administration** | **Saved Scripts**. The **Script Template** page appears.
* Click **Create** to add a new script. The **Add Script Template** screen appears.
* Enter the **Name**. Each script must have a unique name. This field does not support multibyte characters. You cannot edit the name after you submit it.
* Choose a **Tenant Name**.
* In the **Script Body**, call the script you created earlier. Change the AIR-WEBHOOK-URL with the one that you create in Step 1.
`curl AIR-WEBHOOK-URL --header 'Content-Type: application/json' --data-raw {"result":{"host":{{_source.srcip}}"}}`
---
# SentinelOne Integration
> Source: https://kb.binalyze.ai/air/integrations/webhooks/sentinelone-integration.html
**Step 1 - Create Webhook for SentinelOne**
* Visit the **Webhooks** page in AIR,
* Click the "**+ New Webhook**" button in the upper right corner,
* Provide a self-explanatory name (examples: RDP Brute Force Trigger, Phishing Detected Trigger, etc.),
* Select "**Sentinel One Webhook Parser**" as the parser for this webhook,
* Select an **Acquisition Profile** when SentinelOne activates this webhook,
* Select the **Ignore** option or leave with its default value (defaults to 24 hours for recurrent alerts for a single endpoint),
* Provide other settings such as **Evidence Repository**, **CPU Limit**, **Compression & Encryption** to use or let AIR configure them automatically based on the matching policy
* Click the "**Save**" button.
* Copy the Webhook URL for Step 2.
**Step 2 - Setting up SentinelOne**
* Find **Singularity XDR Webhook** in the marketplace and click **Configure**
* Click and expand the dropdown menu:
* Select the box under **Response Actions**: **Make "Hooks" available as "Manual Response Actions" from Threats**
* Give an explanatory **Threat Response Action Name**
* Select a relevant **"Options for triggering"**
* Paste the webhook created in Step 1 to the **URL field**
* Select POST in **Action**
* Choose **Full Threat Details** in **Webhook Request Body**
* Insert the following header into the **Headers**
```
{"Content-Type": "application/json"}
```
* Select **Always send body**
* Click **Next**
* Select your organization and site in the **Access Level**
* Click **Install**.
---
# Microsoft 365 Defender Integration
> Source: https://kb.binalyze.ai/air/integrations/webhooks/microsoft-365-defender-integration.html
**Step 1: Create Webhook for Microsoft 365 Defender**
* Visit the **Webhooks** page in AIR,
* Click the "**+ New Webhook**" button on the upper right corner,
* Provide a self-explanatory name (examples: RDP Brute Force Trigger, Phishing Detected Trigger, etc.),
* Select " **Microsoft 365 Defender** **Webhook Parser**" as the parser for this webhook,
* Select an **Acquisition Profile** when Microsoft 365 activates this webhook,
* Select the **Ignore** option or leave with its default value (defaults to 24 hours for recurrent alerts for a single endpoint),
* Provide other settings such as **Evidence Repository**, **CPU Limit**, **Compression & Encryption** to use or let AIR configure them automatically based on the matching policy
* Click the "**Save**" button.
* Copy the Webhook URL for Step 2.
**Step 2: Setting up Power Automate**
* Log in to [Power Automate](https://make.powerautomate.com/).
* Go to My Flows on the left-hand pane.
* Click New Flow and Automated Cloud Flow
* Give an explanatory **Flow Name,** select Microsoft Defender ATP as the flow’s trigger and create it.
* Set up your alert conditions according to [Microsoft Documentation](https://learn.microsoft.com/en-us/microsoft-365/security/defender-endpoint/api-microsoft-flow?view=o365-worldwide).
* Go to Actions and find HTTP Webhook.
* Use the copied Webhook URL created in the first step as an HTTP Post URL,
* Add `Content-Type: application/json` header,
* Click Add dynamic content, and use the dynamic content from your trigger in your response’s post body “MachineName”.
`{"result":{"host": "MachineName"}}`
---
# Cisco XDR Integration
> Source: https://kb.binalyze.ai/air/integrations/webhooks/cisco-xdr-integration.html
**Step 1 - Create Webhook for Cisco XDR**
* Visit the **Webhooks** page in AIR,
* Click the "**+ New Webhook**" button in the upper right corner,
* Provide a self-explanatory name (examples: RDP Brute Force Trigger, Phishing Detected Trigger, etc.),
* Select "**Cisco XDR: Cisco XDR Webhook Parser**" as the parser for this webhook,
* Select an **Acquisition Profile** when Cisco XDR activates this webhook,
* Select the **Ignore** option or leave with its default value (defaults to 24 hours for recurrent alerts for a single endpoint),
* Provide other settings such as **Evidence Repository**, **CPU Limit**, **Compression & Encryption** to use or let AIR configure them automatically based on the matching policy
* Click the "**Save**" button.
* Copy the Webhook URL for Step 2.
**Step 2 - Setting up Cisco XDR**
* Go to **Automate** - **Targets**
* Click **New Target**.
* Select **HTTP Endpoint** in **Target Type**
* Enter a unique display name for the target in the **Display Name** field and a brief description in the **Description** field
* In the **HTTP** area, paste the Webhook URL you created in Step 1.
* **Protocol** - Choose the appropriate protocol (HTTP or HTTPS)
* **Host/IP Address** - Enter the hostname or IP address for the HTTP Endpoint.
* **Port** - Enter the HTTP port number
* **Path** - Enter the HTTP path
* Click **Submit** to add and save the target
* For more information, please refer to Product's [Documentation](https://docs.xdr.security.cisco.com/Content/Automate/about-automation.htm).
---
# On-Prem Troubleshooting
> Source: https://kb.binalyze.ai/air/troubleshooting/index.html
[Understanding MSI Error Code 1618](understanding-msi-error-code-1618)
[Collecting Responder Log Files](how-to-gather-logs-for-troubleshooting/collecting-responder-log-files)
[Collecting Off-Network Responder Log Files](how-to-gather-logs-for-troubleshooting/collecting-off-network-responder-log-files)
---
# Understanding MSI Error Code 1618
> Source: https://kb.binalyze.ai/air/troubleshooting/understanding-msi-error-code-1618.html
## Overview
MSI Error Code 1618 is a common issue encountered during software installations or updates on Windows systems.
This error indicates that another MSI-based installation is already in progress, which blocks the current installation or update from proceeding. Although this error can occur while updating or operating the **AIR Responder**, it is not caused by the AIR Responder software itself.
## Why Does This Error Occur?
The error code is related to the Microsoft Windows Installer service. It typically appears when:
* Another installation is already running in the background (e.g., a Windows update or another MSI-based installer).
* The Windows Installer service is locked by a pending installation or system process.
Since this issue originates from the Windows environment, resolving it involves managing the underlying MSI processes.
## Steps to Resolve MSI Error Code 1618
1. **Check for Running Installations**
* Manually verify if there are any ongoing installations:
* Open **Task Manager** (Ctrl + Shift + Esc).
* Look for any processes related to Windows Installer or other installation programs (e.g.,`msiexec.exe`).
* End these processes if they are blocking the current installation.\
2. **Check for Pending Windows Update**s
Sometimes, a pending or ongoing Windows update can cause this error. Follow these steps:
* Go to **Settings > Update & Security > Windows Update.**
* Check if there are any updates in progress or requiring a restart to complete.
* Allow the updates to finish or reboot the machine to clear them.
3. **Restart the Windows Installer Service**
Restarting the Windows Installer service can resolve locked or unresponsive installer issues:
1. Open the Run dialog box (`Win + R`).
2. Type `services.msc` and press Enter.
3. Locate the **Windows Installer** service (`msiserver`).
4. Right-click and select **Restart**.
**4. Reboot the System**
The simplest and most effective first step is to reboot the affected machine. Rebooting clears any pending installations or processes using the Windows Installer service.
#### Additional Notes
You can also refer to Microsoft's official support page for more details:
[https://answers.microsoft.com/en-us/windows/forum/all/error-code-1618-when-trying-to-install-new/fb4e98b3-59d9-4cfd-916c-215502864bce](https://answers.microsoft.com/en-us/windows/forum/all/error-code-1618-when-trying-to-install-new/fb4e98b3-59d9-4cfd-916c-215502864bce)
#### Need Further Assistance?
If you continue experiencing issues or have additional questions, please contact our support team at: **support@binalyze.com**
:::caution
If you experience this error while updating or operating the **AIR Responder**, it is not caused by the AIR Responder software itself.
:::
---
# Collecting Responder Log Files
> Source: https://kb.binalyze.ai/air/troubleshooting/how-to-gather-logs-for-troubleshooting/collecting-responder-log-files.html
### AIR Responder Log Files
AIR Responder categorizes and stores the log files as nine separate files as listed below. All associated log records are stored in the related log file.
* TACTICAL.Log.txt
* TACTICAL.Process.Log.txt
* TACTICAL.Error.txt
* AIR.Log.txt
* AIR.Process.Log.txt
* DRONE.log
* DRONE.Process.log
* WATCHDOG.Process.Log.txt
* WATCHDOG.Log.txt
The log files that are generated by AIR responders are stored under the directory that is given below.
| **Windows** | C:\Program Files (x86)\Binalyze\AIR\agent |
| ----------- | ----------------------------------------- |
| **Linux** | /opt/binalyze/air/agent |
| **macOS** | /opt/binalyze/air/agent |
#### By using the command line interface
1. Log in directly or connect remotely to the asset that AIR responder is installed on by the appropriate remote device management tool
2. Browse to the directory which is mentioned above according to the associated operating system
3. Download the files or view the contents of the files with relevant tools.
#### By using the user interface
1. Select the Assets button on the left of the main console menu
2. Select the asset from which AIR responder logs are required
3. Select 'Logs' from the bottom of the secondary menu
4. Click on the 'Collect Logs' icon in the main Assets Logs page
This action creates a Task for collecting logs. After this log retrieval task is finished, the Task status will be changed to Completed, and it can be downloaded by clicking the icon on the right side of the green Completed bar. All available log files will be compressed as a single zip file and can be downloaded.
The Log Retrieval tasks can also be accessed in the Tasks section.
---
# Collecting Off-Network Responder Log Files
> Source: https://kb.binalyze.ai/air/troubleshooting/how-to-gather-logs-for-troubleshooting/collecting-off-network-responder-log-files.html
The Off-Network AIR responder categorizes and stores log files in two locations:
1. At the root of the directory from which the AIR Off-Network responder is executed.
2. In the 'bin' directory which is also found at the root of the directory from which the AIR Off-Network responder is executed.
At the root of the directory from which the AIR Off-Network responder is executed, users will find the following log files:
* OFFNETWORK\_WINDOWS\_AMD64.Log.txt
* OFFNETWORK\_WINDOWS\_AMD64.Process.Log.txt
* troubleshoot-\[TIMESTAMP].zip
In the 'bin' directory which is also found at the root of the directory from which the AIR Off-Network responderis executed, users will find the following log files:
* TACTICAL-Legacy.Log.txt
* TACTICAL.Log.txt
* TACTICAL.Process.Log.txt
* TACTICAL.Error.txt
* AIR.Log.txt
* AIR.Process.Log.txt
* DRONE.log.txt
* DRONE.Process.log.txt
:::caution
NOTE: With AIR v4.4 (responder v2.30) and later, the 'troubleshoot-\[TIMESTAMP].zip' will always be generated, even if there have been no errors and this file will consolidate all of the other log files shown on this page. This is to make it simple for users to collect and send log files to support if required.
:::
---
# FAQs
> Source: https://kb.binalyze.ai/air/faqs/index.html
[Investigation Hub](../features/investigation-hub/)
[Responder troubleshooting](responder-troubleshooting)
[Understanding Port Usage](what-ports-are-used)
[How many assets can connect to a single Console instance?](how-many-endpoints-can-connect-to-a-single-console-instance)
[How to download the collected evidence and artifacts?](how-to-download-the-collected-evidence-and-artifacts)
[How do I enable SSL on console?](../self-hosted/setup/security/ssl-enforcement/)
[Can I use AIR with EDR/XDR Products?](edr-xdr-integration)
[Can I integrate AIR with my SOAR/SIEM?](siem-soar-integration)
[What external URLs are used?](what-are-the-external-urls-used)
["Monitoring Responder and UI API's"](monitoring-responder-and-ui-apis)
[How do I update Responders on assets?](how-do-i-update-endpoints)
[Is there a way to move an asset from one Organization or Case to another?](is-there-a-way-to-move-an-asset-from-one-organization-or-case-to-another)
---
# How to download the collected evidence and artifacts?
> Source: https://kb.binalyze.ai/air/faqs/how-to-download-the-collected-evidence-and-artifacts.html
## Introduction
AIR provides two separate mechanisms for storing collected evidence, artifacts, and data. The first and default method is to use the local storage of the asset and the server machines' file system. The second method utilizes remote network services, which we refer to as Evidence Repositories, including SFTP, FTPS, SMB, Amazon S3 Buckets, Azure Blob Storage, and Google Cloud Storage.
The location of the evidence and artifacts storage is defined in the Policy section of the AIR Console. Since the Acquisition tasks are directly bound to these policies, investigators and analysts can change the type (Local or Evidence Repository) and path of the collected evidence and artifacts by using the options fields in the Policy screen.
The exact location and path of the evidence and artifacts can be viewed through the **Evidence URL** value, which is located under the **Metadata** page that is accessible via a button shown under the **Status** of the associated **Task**.
The evidence and artifacts collection and storage flow is summarized as follows.
1. An Acquisition Task is created on the AIR Console.
2. The AIR responder installed on asset machines connects to the AIR Console to retrieve the task and task details.
3. The AIR responder installed on asset machines runs the Acquire Task on the asset, collecting evidence and artifacts.
4. AIR responder stores the collected evidence and artifacts according to the configuration options defined in the Policies section.
1. If the Local option is selected, the collected evidence and artifacts will be stored in the file system location defined in the configuration options.
How to download the collected evidence and artifacts: Fig1
2. If the Evidence Repository option is selected, the collected evidence and artifacts will be stored in a temporary location on the local file system. Then, the asset machine directly connects to the remote network service/server and uploads the evidence and artifacts to the location defined in the configuration options. All the evidence and artifacts will be deleted from the asset**.** The flow is depicted in the picture below.
How to download the collected evidence and artifacts: Fig2
## Download The Evidence and Artifacts from Local Storage
Two separate methods can be used to download collected evidence and artifacts, which are stored in the local file system of the asset machines. Investigators and analysts can use AIR built-in remote management tool, interACT, or their favorite remote management tool to connect and download the requested evidence and artifacts.
The default location of all collected evidence and artifacts are listed below according to the operating systems. The default location can be changed by editing the policies.
| **Windows** | C:\Binalyze\AIR\Cases |
| ----------- | ------------------------------ |
| **Linux** | /opt/binalyze/air/Cases |
| **macOS** | /opt/binalyze/air/Cases |
### Using interACT
1. Find the task of interest.\
The relevant task can be viewed either by navigating through the **Global Tasks Tab** or by selecting the associated assets from the asset listings and then locating the related task under the asset details page.
2. Locate the exact path of the evidence and artifacts that require downloading.\
Click the **Metadata** button under this **Status** on the page and view the value of the **Evidence URL.** It is also possible to directly copy the value of the Evidence URL by clicking the copy button, which is located at the beginning of the Evidence URL line.
3. Connect to the machine using interACT by clicking the interACT button, located under the asset details page.
4. Navigate to the path provided with the Evidence URL by using the **cd** command.
5. Download the associated file by using the **get** command provided by the interACT.
### By Using Remote Management tools
1. Find the task of interest.\
The relevant task can be viewed either by navigating through the **Global Tasks Tab** or by selecting the associated assets from the asset listings and then locating the related task under the asset details page.
2. Locate the exact path of the evidence and artifacts that require downloading.\
Click the **Metadata** button under this **Status** on the page and view the value of the **Evidence URL.** It is also possible to directly copy the value of the Evidence URL by clicking the copy button, which is located at the beginning of the Evidence URL line.
3. Connect to the asset with your favorite remote management tool. This tool may vary depending on the operating system installed on the asset. The most commonly used tools include SSH, Remote Desktop Manager, and VNC, among others.
4. Navigate to the path provided with the Evidence URL by using the **cd** command.
5. Download the associated file by using the commands and activities provided by the remote management tool.
## Download The Evidence and Artifacts from Evidence Repositories
1. Find the task of interest.\
The relevant task can be viewed either by navigating through the Global Tasks Tab or by selecting the associated assets from the asset listings and then locating the related task under the asset details page.
2. Download the compressed/encrypted zip file by clicking the **Evidence URL**\
The downloadable link will be created and bonded directly to the **Evidence URL.** Click the **Metadata** button under this **Status** on the page, and then click on the Evidence URL to download the zip file, which includes the chosen evidence and artifacts.
---
# Collecting Responder Log Files
> Source: https://kb.binalyze.ai/air/faqs/how-to-gather-logs-for-troubleshooting/collecting-responder-log-files.html
### AIR Responder Log Files
AIR Responder categorizes and stores the log files as nine separate files as listed below. All associated log records are stored in the related log file.
* TACTICAL.Log.txt
* TACTICAL.Process.Log.txt
* TACTICAL.Error.txt
* AIR.Log.txt
* AIR.Process.Log.txt
* DRONE.log
* DRONE.Process.log
* WATCHDOG.Process.Log.txt
* WATCHDOG.Log.txt
The log files that are generated by AIR responders are stored under the directory that is given below.
| **Windows** | C:\Program Files (x86)\Binalyze\AIR\agent |
| ----------- | ----------------------------------------- |
| **Linux** | /opt/binalyze/air/agent |
| **macOS** | /opt/binalyze/air/agent |
#### By using the command line interface
1. Log in directly or connect remotely to the asset that AIR responder is installed on by the appropriate remote device management tool
2. Browse to the directory which is mentioned above according to the associated operating system
3. Download the files or view the contents of the files with relevant tools.
#### By using the user interface
1. Select the Assets button on the left of the main console menu
2. Select the asset from which AIR responder logs are required
3. Select 'Logs' from the bottom of the secondary menu
4. Click on the 'Collect Logs' icon in the main Assets Logs page
This action creates a Task for collecting logs. After this log retrieval task is finished, the Task status will be changed to Completed, and it can be downloaded by clicking the icon on the right side of the green Completed bar. All available log files will be compressed as a single zip file and can be downloaded.
The Log Retrieval tasks can also be accessed in the Tasks section.
---
# Managing Database Usage (Close vs Archive)
> Source: https://kb.binalyze.ai/air/faqs/managing-database-usage.html
## Overview
Customers sometimes ask how to “delete” cases and reclaim disk space. In AIR, cases **cannot be deleted**. Instead, **Close** and **Archive** are used, and the impact is primarily on **database usage (PostgreSQL)**.
This guidance applies to **both SaaS and self-hosted** deployments.
## Key Concepts
- **DB Usage** refers to storage used in PostgreSQL (the application database).
- **Case.ppc** and **Drone.zip** are source files that can be re-read if a case is reopened after Close.
- Some evidence types (PST, CSV, Tornado) are **stored only as database records**, not as files.
## What Happens When a Case Is Closed
When a case is closed, only specific database records are deleted.
**Deleted from PostgreSQL**
- Records derived from **Case.ppc**
- Records derived from **Drone.zip**
**Not deleted (remains in PostgreSQL)**
- User-generated data such as:
- Comments
- Flags
- Activity logs
- Notes
- Manually created findings
- Evidence types that exist **only as database records** (see PST/CSV/Tornado below)
### Example
If a case has a **DB Usage** value of 10 GB and only 10 MB of that is user-generated data, the DB Usage becomes ~10 MB after the case is closed. User-generated data usually occupies a negligible amount of space.
## Important Note: “Historical DB Usage”
The sizes shown in **Settings → Investigation Hub Historical DB Usage** represent **only PostgreSQL storage**. They **do not include** the sizes of Case.ppc or Drone.zip files.
## Reopening a Closed Case
If a case is reopened:
- **Case.ppc** and **Drone.zip** are re-read
- Their data is written back into PostgreSQL
Because Case.ppc and Drone.zip are compressed files, they do not take up much disk space **as files**, but they may expand significantly **in the database**.
### Example
A 50 MB Case.ppc file might occupy **3 GB** when written to the database. There is no fixed ratio; it could be 500 MB or 2 GB depending on the evidence content.
## Special Case: PST, CSV, Tornado Evidence
PST, CSV, and Tornado evidence are **not stored as files in AIR**. Only the database records exist. Because AIR does not have the original source files to recreate these records, they are **not deleted** when a case is closed.
### Why this matters
If a case contains only PST/CSV/Tornado evidence, closing the case **will not change DB usage**, because there is no Case.ppc or Drone.zip data to delete.
### Example case contents
- 4 GB PST evidence
- 2 GB CSV evidence
- 1 GB Tornado evidence
- 5 GB Case.ppc (acquisition/triage/full text search tasks)
- 3 GB Drone.zip (findings)
When this case is closed, DB usage decreases from 15 GB to 7 GB.
## What Happens When a Case Is Archived
When a case is archived:
- Only the **case status** changes
- The case **cannot be reopened**
**Archiving does not reduce database usage** beyond what already happened during Close.
## Summary (Short Version)
- Cases cannot be deleted.
- **Closing** a case removes DB records created from Case.ppc and Drone.zip, which may significantly reduce DB usage.
- User-generated content remains and is usually very small.
- **Archiving** only changes status and prevents reopening; it does not further reduce DB usage.
---
# Collecting Off-Network Responder Log Files
> Source: https://kb.binalyze.ai/air/faqs/how-to-gather-logs-for-troubleshooting/collecting-off-network-responder-log-files.html
The Binalyze Off-Network AIR responder categorizes and stores log files in two locations:
1. At the root of the directory from which the AIR Off-Network responder is executed.
2. In the 'bin' directory which is also found at the root of the directory from which the AIR Off-Network responder is executed.
At the root of the directory from which the AIR Off-Network responder is executed, users will find the following log files:
* OFFNETWORK\_WINDOWS\_AMD64.Log.txt
* OFFNETWORK\_WINDOWS\_AMD64.Process.Log.txt
* troubleshoot-\[TIMESTAMP].zip
In the 'bin' directory which is also found at the root of the directory from which the AIR Off-Network responders executed, users will find the following log files:
* TACTICAL-Legacy.Log.txt
* TACTICAL.Log.txt
* TACTICAL.Process.Log.txt
* TACTICAL.Error.txt
* AIR.Log.txt
* AIR.Process.Log.txt
* DRONE.log.txt
* DRONE.Process.log.txt
:::caution
NOTE: With AIR v4.4 (responder v2.30) and later, the 'troubleshoot-\[TIMESTAMP].zip' will always be generated, even if there have been no errors and this file will consolidate all of the other log files shown on this page. This is to make it simple for users to collect and send log files to support if required.
:::
---
# Responder troubleshooting
> Source: https://kb.binalyze.ai/air/faqs/responder-troubleshooting.html
### **Installation Problems**
Responder installer name contains version information and IP address fields. Make sure that the MSI installer file name doesn't change and has relevant fields before installation. You can see an example below:
> AIR.Responder\_2.38.7\_air-demo.ACME.com\_176\_9df51c56a73341f4\_386\_.msi
### **Post-Installation Problems**
Default installation path is "C:\Program Files (x86)\Binalyze\AIR\agent". Check this folder to ensure it contains the following responder files:
> TACTICAL.exe
>
> TACTICAL.Log.txt
### **Service Problems**
AIR responder uses "AIR Responder Service". Check this service from Windows Services Manager and make sure it exists and its state is "running".
### **Uninstall Problems**
If system time and date are not set correctly or the necessary permissions are not set on %temp% and "C:\Windows\Installer" folders, you may encounter "Called RunScript when not marked in progress” and/or “Called InstallFinalize when no install in progress” errors during uninstall process.
First, check the system time/date and make sure it's correct.
Second, check the security properties of %temp% and "C:\Windows\Installer" folders and make sure that "System" and "Everyone" users have "Full control" permission over these folders.
---
# Understanding Port Usage
> Source: https://kb.binalyze.ai/air/faqs/what-ports-are-used.html
AIR uses specific ports to manage communication between the AIR Console, responders, and other components of the system. Ensuring that the correct ports are open and configured can prevent connectivity issues and optimize performance. Below is a breakdown of the key ports used by AIR and their purposes.
#### **Key Ports Used in AIR**
* **TCP 443**: This is the default port for most AIR communications, including:
* **AIR User -> Console**: Used for users accessing the AIR Console.
* **Asset -> Console**: Used by responders on assets to communicate with the console. This is the default and preferred port, in some cases, users may wish to switch to 8443:
Understanding Port Usage: Console Port
* **Responder Downloads**: The responder download links (on the deploy page) are accessible via port 443. Using this port ensures consistent download access, especially in environments where only port 443 is available.
* **TCP 8443**: This is an alternative port used for user access to the console, as well as other specific functions, including:
* **AIR User -> Console**: Optional port for user access to the AIR Console.
* **Shareable Deploy Page**: The shareable page for responder deployment is available on this port.
* **Off-Network Tasks**: The download links for tasks that run off-network are accessible on this port.
* **Admin Portal**: The administrative portal operates on this port.
* **REST API**: API calls to the AIR Console (`api/public/*`) are handled on this port.
* **Azure and Okta SSO**: If you're using Azure or Okta Single Sign-On (SSO), the callback from within the browser should happen over port 8443.
* **TCP 4222**: This port is used for real-time task pushes to assets. If real-time communication is needed for task assignment, this port should be enabled.
* **TCP/UDP 389 and 636**: These ports are optional and used when Active Directory (AD) integration is enabled:
* **389**: For LDAP (Lightweight Directory Access Protocol) communication.
* **636**: For LDAPS (LDAP over SSL) communication.
* **TCP/UDP 514**: This is the optional port used when Syslog integration is enabled. Syslog helps in forwarding system logs to a centralized log server.
#### **Recommended Usage**
While port 8443 can be used manually for downloading responders and accessing the console, we **strongly recommend** using port 443 for the following reasons:
1. **Consistency**: Port 443 is universally available across most environments and networks, reducing the risk of connectivity issues.
2. **Responder Communication**: Responders may not have access to port 8443 in certain configurations, making port 443 the preferred choice for ensuring reliable responder-console communication.
**Summary of Port Functions:**
| Port | Function |
| ------------------- | ------------------------------------------------------------------ |
| **TCP 443** | Default for user and responder communication with AIR Console |
| **TCP 8443** | Optional for user access, API, and other console functionalities |
| **TCP 4222** | Enables real-time task pushes to assets |
| **TCP/UDP 389/636** | LDAP and LDAPS for Active Directory integration |
| **TCP/UDP 514** | Syslog port for logging |
By ensuring that these ports are correctly configured and open, you can optimize communication between the AIR Console and responders, allowing for seamless operation.
---
# How many assets can connect to a single Console instance?
> Source: https://kb.binalyze.ai/air/faqs/how-many-endpoints-can-connect-to-a-single-console-instance.html
AIR responders deployed to your assets are passive responders and a single basic install of the AIR Console has been tested on networks with up to 25,000 assets.
AIR is designed to deal with many more connected assets, so if you are planning to install AIR on a bigger network, please contact [support@binalyze.com](mailto:support@binalyze.com).
---
# Can I use AIR with EDR/XDR Products?
> Source: https://kb.binalyze.ai/air/faqs/edr-xdr-integration.html
The level of forensic information AIR provides is the biggest differentiator that separates it from the rest of the crowd. This fact makes AIR a perfect candidate for using it side-by-side with an EDR/XDR product.
Here are some EDR/XDR use-case examples:
* Eliminating false positives by providing analysts with AIR reports,
* Investigating pre-cursors,
* Enriching an alert,
* Responding to EDR/XDR alerts automatically.
If you use an EDR/XDR or EPP software along with Binalyze, check our **exclusion/exception rules** [page](../setup/responder-deployment/responder-exception-rules/).
---
# Can I integrate AIR with my SOAR/SIEM?
> Source: https://kb.binalyze.ai/air/faqs/siem-soar-integration.html
AIR can be triggered by your SIEM/SOAR product without human intervention. This makes it a perfect match for responding to alerts you receive from these solutions.
Communication with SIEM products is bi-directional. So, AIR not only receives alerts/triggers from your SIEM but also reports the actions it performed back to it via Syslog Protocol.
---
# What external URLs are used?
> Source: https://kb.binalyze.ai/air/faqs/what-are-the-external-urls-used.html
This domain is used by AIR Server instances to update artefacts like MITRE Attack Rules , docker compose files, update scripts, offline installer packages.
This domain is a container registry for AIR Server instances to update server components like the application server images, database images, caching server images etc.
:::caution
**A note on Cloud Infrastructure**
All of the web services and API backends listed above are hosted on Microsoft Azure preferably in East/West US Datacenters and protected by Cloudflare.
:::
## What data is sent or received by Binalyze domains
| Domain | Data Sent To Domain | Data Received From Domain |
| ------------------------------------------------------------- | -------------------------------------------------------------------------------------------------------------------------------------------------------------------------------------------------------------------------------------------------------------------------------------------------------------------------------------------------------------------------------------------------------------------------------------------------------------------------------------------------------------------------------------------------------------------------------------------------------- | -------------------------------------------------------------------- |
| [https://binalyze.com](https://binalyze.com/) | N/A | Version Information |
| [https://license.binalyze.com](https://license.binalyze.com/) | License Key | License Status Details |
| [https://api.binalyze.com](https://api.binalyze.com/) |
|
| [https://cr.binalyze.com](https://cr.binalyze.com/) | N/A | Binary Packages |
---
# Monitoring Responder and UI API's
> Source: https://kb.binalyze.ai/air/faqs/monitoring-responder-and-ui-apis.html
## **Responder API**
Send a HTTP GET request to **https**_**://\[AIR\_SERVER\_ADDRESS]/api/app/check**_
The app check URL doesn't require any authentication.
A successful response would be 200 OK, and the response body will be like this:
`{`
`"success": true`
`}`
## **UI API**
Send a HTTP GET request to **https://\[AIR\_SERVER\_ADDRESS]:8443/api/app/check**
The app check URL doesn't require any authentication.
A successful response would be 200 OK, and the response body will be like this:
`{`
`"success": true`
`}`
_Note: It is highly recommended to check the response body along with the HTTP status code for both the_ responder _and the UI API's._
---
# How do I update Responders on assets?
> Source: https://kb.binalyze.ai/air/faqs/how-do-i-update-endpoints.html
You can keep AIR Responders up to date in two ways:
1. **Manually** — Use **Update now** on the asset's **Version update** card, or assign an **Update Responder Version** task to one or more assets (run now or schedule for later).
2. **Automatically** — Enable Automatic Updates and configure the Default policy and optional custom policies under **Settings → Assets → Responder Updates**.
By default, updates are set to **manual**. Automatic Updates only run when that mode is enabled and saved, and when each asset is eligible.
For the full Automatic Updates model (Default policy, custom update and exclusion policies, manual exclusions, and precedence), see **[Responder Updates](../settings/console-settings/assets/responder-updates)**.
## Automatic Responder updates (summary)
1. Open **Settings → Assets → Responder Updates**.
2. Select **Update asset Responders automatically**.
3. Review the **Default policy** schedule and any **custom policies**.
4. Confirm and **Save**.
When Automatic Updates are enabled, managed assets update according to your policies when they check in and are eligible. Enabling Automatic Updates removes outstanding scheduled or assigned manual Responder update tasks.
:::tip
Use custom policies when different groups of assets need different schedules or must be excluded from automatic updates. Details are in the [Responder Updates](../settings/console-settings/assets/responder-updates) guide.
:::
## Manual Responder updates
Use Manual Updates (or assign a task even when Automatic Updates are on) when you want to update specific assets yourself.
### Before you start
- You need permission to assign Responder version update tasks.
- Only assets that **require** a Responder update can be selected in the update drawer.
- If an asset is **manually excluded from updates**, include it in updates again before you expect an assigned update task to run on that asset.
### Update a single asset
The fastest path for one asset is **Update now** on the **Version update** card:
1. Open the asset detail page.
2. Expand **Version update**.
3. Choose **Update now** (shown when a manual update is allowed).
4. Confirm if AIR warns that running tasks would be stopped.
To schedule the update, or to use the full task drawer:
1. Open the asset detail page.
2. Choose **Update Responder Version** (from the update actions, or from **Responder Update Status → Assign an update task manually**).
3. The **Update Responder Version** drawer opens.
4. On **Setup**:
- Optionally enter a **task name** (leave empty to auto-generate).
- Choose **Now** or **Schedule for later**.
- If scheduling, choose the timezone (asset timezone or a selected timezone) and the **start time**.
5. Start / confirm the task.
:::note
If an update is already scheduled for the asset, assigning a new scheduled update **replaces** the previous schedule.
:::
### Update multiple assets
1. In the assets list, select the assets (or use filters and bulk selection).
2. Open the bulk actions menu and choose **Update Responder Version**.
3. In the drawer, confirm the asset selection step if shown, then complete **Setup** (Now or Schedule for later) as above.
4. Confirm if prompted for a large selection.
You can also start **Update Responder Version** from group or tag actions where that action is available.
### Schedule for later (drawer options)
When you select **Schedule for later** in the **Update Responder Version** drawer:
- Choose **Use asset's timezone** or **Select timezone**.
- Set the **start time**.
- Review the warning that an existing scheduled update for the selected asset(s) will be replaced.
## Already up to date
If an asset is already running the Console's current Responder version:
- The **Version update** card shows **Up to date**.
- It does not appear as selectable for a new update task in the drawer.
- Automatic Updates do not issue another version update for that asset.
When the asset is behind the target version, the card uses lifecycle labels such as **Update required** (mandatory / compatibility) or **Update available** (newer version can be installed manually). Those are not the same strings as the Home **Assets Summary** filters **Update Required** and **Update Advised** — see [Responder Updates](../settings/console-settings/assets/responder-updates#version-update-statuses-vs-assets-summary-labels).
## An asset is not updating
1. Open the asset and expand **Version update** — the status and explanation name the blocker.
2. Choose **View update history** (or open the **Version Updates** tab) if the card shows a failure or retry.
3. Use **Update now** to bypass windows and the automatic attempt limit when you need an immediate install.
Full status and history references: [Responder Update Status](../settings/console-settings/assets/responder-update-status) and [Responder Update History](../settings/console-settings/assets/responder-update-history).
## Related articles
- **[Responder Updates](../settings/console-settings/assets/responder-updates)** — Automatic Updates, Default policy, custom policies, exclusions, precedence
- [Responder Update Status](../settings/console-settings/assets/responder-update-status) — why an asset is updating, waiting, scheduled, failed, or excluded
- [Responder Update History](../settings/console-settings/assets/responder-update-history) — past update attempts and failure diagnosis
- [Assets (Console Settings)](../settings/console-settings/assets) — Asset Settings overview
- [Post-Deployment Configuration Guide](../self-hosted/setup/post-deployment-configuration-guide) — self-hosted setup checklist
---
# Is there a way to move an asset from one Organization or Case to another?
> Source: https://kb.binalyze.ai/air/faqs/is-there-a-way-to-move-an-asset-from-one-organization-or-case-to-another.html
**Moving an asset from one Organization to another is prohibited.**
Organization assignment is performed on the installation of the AIR responder process, and assets are directly bonded to the associated Organization. So there is no way to directly move an asset from one Organization to another. If you want to move an asset from one Organization, you must uninstall the responder from the asset, and then you must create a new responder deployment package and must select the Organization you want.
**Moving an asset directly from one Case to another is not a valid action.**
Actually, assets are not directly attached to Cases. They attach to a Case via a Task. When the Tasks of the assets are added to the Cases, the assets appear in the Case. An asset can be included in more than one Case. When you add the asset's Tasks to different Cases, the asset appears in those Cases. You can add Tasks to a Case or send a completed Task to other Cases with the "Send to case" action.
If you remove all the Tasks of the asset from the Case, the asset will be removed. You can directly remove the asset from the Case. This way, all its Tasks will be removed from the Case. Then you can add Tasks in interest to any Case you want.
---
# Anything missing?
> Source: https://kb.binalyze.ai/air/faqs/roadmap.html
::::note
**Your ideas are important**
Something missing? Tell us about it by clicking the link below!
[Give your Binalyze AIR feedback](https://binalyze.com/products/air/feedback)
::::
---
# Self-Hosted Setup
> Source: https://kb.binalyze.ai/air/self-hosted/setup/index.html
This section covers the complete installation and setup process for self-hosted AIR deployments.
## Installation Process
Follow these steps in order for a successful AIR self-hosted installation:
1. **[Pre-Installation Requirements](pre-installation)** - Review system requirements, network configuration, and preparation steps
2. **[Installation Guide](installation)** - Complete Docker-based installation instructions for supported Linux distributions
## Additional Configuration
After installation, you may need to configure:
- **[Security Settings](security/)** - SSL enforcement, access control, and security hardening
- **[Post-Deployment Configuration](post-deployment-configuration-guide/)** - Initial setup and configuration tasks
## Support
If you encounter issues during installation, see the troubleshooting section or contact support.
---
# Console Hardware Requirements
> Source: https://kb.binalyze.ai/air/self-hosted/setup/console-hardware-requirements.html
:::note
**Quick Tip**
Resource Planning
It is not possible to estimate resource requirements based solely on the number of deployed Responders. The determining factors are the type and volume of evidence collected, which can vary significantly between deployments. For instance, 1,000 Responders may generate 5 TB of evidence data, while 10,000 Responders could generate as little as 100 GB. Because of this variability, Responder count is not a reliable sizing metric.
We recommend proceeding with the installation using the suggested hardware values provided in the deployment guide, rather than attempting to calculate requirements based on the number of Responders.
As a general guideline, if you plan to deploy 20,000 or more Responders, allocate approximately double the recommended values to ensure optimal performance and scalability.
Learn more about the [deployment models](installation.md#deployment-models) for AIR.
:::
### Minimum Requirements
Below are the minimum hardware requirements for AIR components:
### Single Tier Deployment - Server (Console & DB)
Minimum
Suggested
RAM
16 GB
32 GB
CPU
8 Cores
16 Cores
DISK
256 GB
512 GB
### 2-Tier Deployment
#### Console Server
| | Minimum | Suggested |
| :--: | :-----: | :-------: |
| RAM | 8 GB | 16 GB |
| CPU | 4 Cores | 8 Cores |
| DISK | 256 GB | 256 GB |
#### Database Server
| | Minimum | Suggested |
| :--: | :-----: | :-------: |
| RAM | 16 GB | 32 GB |
| CPU | 8 Cores | 16 Cores |
| DISK | 256 GB | 512 GB |
### Cloud Platform Counterparts
Cloud Platform systems that meet the relevant hardware requirements are outlined below:
### Single Tier Deployment - Server (Console & DB)
Minimum
Suggested
Hetzner
CPX41
CPX51
Azure
D8ds_v4
D16ds_v4
AWS
c5.2xlarge
c5.4xlarge
GCP
n1-highcpu-8
n1-highcpu-16
### 2-Tier Deployment
#### Console Server
| | Minimum | Suggested |
| :-----: | :----------: | :-----------: |
| Hetzner | CX41 | CX51 |
| Azure | D4ds\_v4 | D8s\_v4 |
| AWS | c5.xlarge | c5.2xlarge |
| GCP | n1-highcpu-8 | n2-highcpu-16 |
#### Database Server
| | Minimum | Suggested |
| :-----: | :----------: | :-----------: |
| Hetzner | CX51 | CPX51 |
| Azure | D8ds\_v4 | D16ds\_v4 |
| AWS | m5d.2xlarge | m5d.4xlarge |
| GCP | n1-highcpu-8 | n2-highcpu-16 |
---
# Pre-Installation Requirements
> Source: https://kb.binalyze.ai/air/self-hosted/setup/pre-installation.html
#### Secure and Efficient Setup for AIR Console and Database Servers
1. **Assign Static IP Addresses**
* Ensure each server running the AIR Console and Database is assigned a static IP address to maintain a stable network connection.
2. **Configure Ports for Initial and Ongoing Access**
* **Port 80 (HTTP):** Only enabled for initial configuration access through the user interface (UI). This allows for system setup upon installation.
* **Port 443 (HTTPS):** After initial setup, use this port permanently for all administrative access. It provides a secure, encrypted connection for managing the AIR Console UI.
3. **Additional Port Configuration for Responders**
* **Port 443 (HTTPS):** Keep open for secure communication and ongoing operations.
* **Port 4222 (NATS.io):** Enable to allow inbound traffic for asset responders using NATS.io, facilitating effective communication across distributed systems.
4. **2-Tier Deployment Specific Configuration**
* Allow inbound access from the AIR Console server to the DB Server on:
* **5432 (PostgreSQL)**
5. **Internet Access for Essential Domains (2-Tier Deployment on AIR Console Server and DB Server)**
* Allow access to the following domains from the Console Server:
* [https://binalyze.com](https://binalyze.com)
* [https://license.binalyze.com](https://license.binalyze.com)
* [https://api.binalyze.com](https://api.binalyze.com)
* [https://cdn.binalyze.com](https://cdn.binalyze.com)
* [https://one.binalyze.com](https://one.binalyze.com)
* [https://cr.binalyze.com](https://cr.binalyze.com)
* [\*.docker.com](http://*.docker.com/)
* Allow access to the following domains from the DB Server:
* [https://cr.binalyze.com](https://cr.binalyze.com*.docker.com)
* [https://cdn.binalyze.com](https://cdn.binalyze.com)
* [\*.docker.com](https://cr.binalyze.com*.docker.com)
6. **Additional Optional Steps**
* If you're using EDR/XDR or EPP software along with Binalyze, please take a look at our exclusion/exception [rules page](../../setup/responder-deployment/responder-exception-rules/).
* (Optional) Create an SSL certificate for the provided Static IP Address or FQDN.
* (Optional) Allow inbound access for alternative secure access to the web UI on the AIR Console server on:
* **8443 (HTTPS) inbound**
* (Optional) Create a password-protected network share on the server.
* (Optional) Create an Active Directory user for AIR to enumerate LDAP computers on your network. This account should have limited rights, sufficient only to enumerate computers, and not hold privileged status like a Domain Admin.
* **Installation directory disk space:** AIR is installed under `/opt` by default. Before starting the installation, make sure this directory has enough free disk space.
* **Docker image directory disk space:** By default, Docker stores pulled images under `/var` (typically `/var/lib/docker`). This directory is managed by Docker independently of AIR; while the required space depends on image size, having at least ~25 GB of free space is generally sufficient.
This structured approach ensures that every step and detail is laid out clearly, making it easier to follow and implement for a secure and efficient server setup.
---
# Console Installation
> Source: https://kb.binalyze.ai/air/self-hosted/setup/installation.html
### Supported Distributions (x64 only)
The list below is limited to the widely adopted Linux distribution families that Docker documents for installing Docker Engine: **Debian**, **Ubuntu**, **RHEL**, **CentOS**, and **Fedora**. Raspberry Pi OS and SLES (s390x) are not included, as they are niche or specialized and have not been tested.
* Debian Bullseye 11 (oldoldstable)
* Debian Bookworm 12 (oldstable)
* Debian Trixie 13 (stable)
* Ubuntu Jammy 22.04 (LTS)
* Ubuntu Noble 24.04 (LTS)
* Ubuntu Questing 25.10
* RHEL 8
* RHEL 9
* RHEL 10
* CentOS Stream 9
* CentOS Stream 10
* Fedora 41
* Fedora 42
* Fedora 43
This list is maintained and updated by Docker. For the most up-to-date version information for each distribution, see the official Docker documentation: [Install Docker Engine](https://docs.docker.com/engine/install/).
### Deployment Models
You can deploy AIR in one of two models:
* [**Single Tier Deployment**](#single-tier-deployment)\
All platform components, such as App, Web, NATS, DB, and Redis, are installed and run on the same machine.
* [**2-Tier Deployment**](#2-tier-deployment)\
All components except the Database Layer are installed and run on a single instance, while the Database has its own dedicated instance.
:::note
**Which deployment model to use?**
**The Single-Tier Model** is the fastest way to deploy AIR and is recommended for, proof of concept (PoC), and testing purposes.
**The Two-Tier Model** is designed for all production environments and will support tens of thousands of assets/endpoints. This model includes the Console Server along with a separate dedicated Database Server, which enhances the overall performance of AIR at scale.
Our team is always available to collaborate with you to define the optimal setup.
:::
### Installation
Before you start
* Make sure you have updated package repositories of the Operating System you are using. Please find below the commands for CentOS and Ubuntu:
For CentOS:
```
yum update
```
For Ubuntu:
```
apt-get update
```
* Start and enable Docker service by executing the following command:
```
systemctl start docker && systemctl enable docker
```
### Single-Tier Deployment
:::note
Suitable for PoCs, Demos, and non-mission-critical deployments.
:::
This deployment model installs all components into a single machine.
#### **Method 1: Quick Deployment (preferred method)**
1. Run the one-liner below and wait for it to complete.
```
curl -fsSL https://cdn.binalyze.com/air-deploy/console.sh | sudo -E bash
```
2. Proceed with the [Finalizing Setup section](#finalizing-setup).
#### **Method 2: Manual Deployment (use only when required)**
1. Create a folder for the AIR under **/opt** directory and cd into it
```
mkdir /opt/binalyze-air && cd /opt/binalyze-air
```
2. Download the **docker-compose.yml** file and save it.
```
curl -fsSL "https://cdn.binalyze.com/air-deploy/docker-compose.yml" -o docker-compose.yml
```
3. Create the directory for the database volume with defined access:
```
install -d -o 1001 -g 1001 ./volumes/data-master/binalyze-air/{data,log}
install -d -o 1001 -g 1001 ./volumes/tornado/{data,config}
```
4. Create environment variables:
```
AIR_POSTGRESQL_PASSWORD=$(head /dev/urandom | tr -dc 'a-zA-Z0-9' | head -c 32)
echo "AIR_POSTGRESQL_PASSWORD=$AIR_POSTGRESQL_PASSWORD" >> .env
echo "AIR_POSTGRESQL_URI=postgresql://air-data:$AIR_POSTGRESQL_PASSWORD@air.data-master.server:5432/airdb" >> .env
echo "AIR_NATS_PASSWORD=$(head /dev/urandom | tr -dc 'a-zA-Z0-9' | head -c 32)" >> .env
```
5. Run the following command to start the AIR installation in Docker:
```
docker compose -p binalyze-air up -d
```
6. Wait for the installation to complete. It may take several minutes.
7. Proceed with the [Finalizing Setup section](#finalizing-setup).
### 2-Tier Deployment
:::note
Suitable for Enterprise Deployments.
:::
This deployment model requires you to first deploy the Database Component (Step 1). Once the database is successfully installed and running, you can proceed with the deployment of the Console Server (Step 2). During this step, you will need to provide the IP address of the previously installed Database Server. This sequence is critical, as the Console Server relies on an active and accessible database instance to function correctly.
### **Method 1: Quick Deployment (preferred method)**
1. **Step 1 - On the Database Server:** Run the one-liner command below and wait for it to complete (this script will deploy the database component).
```
curl -fsSL https://cdn.binalyze.com/air-deploy/db.sh | sudo -E bash
```
2. **Step 2 - On the Console Server:** Once the database is deployed, the above script will output the commands that need to be executed on the Console Server machine.
* SSH into the Console Server machine.
* Run the commands provided by the above script and wait for it to complete.
* Proceed with the Finalizing Setup section.
### **Method 2: Manual Deployment (use only when required)**
:::caution
You should execute the commands below on the Database Server!
:::
1. SSH into the Database Server.
2. Create a folder for the AIR DB under **/opt** directory and cd into it
```
mkdir /opt/binalyze-air-db && cd /opt/binalyze-air-db
```
3. Download the **docker compose.yml** file and save it.
```
curl -fsSL "https://cdn.binalyze.com/air-deploy/docker-compose-db.yml" -o docker-compose.yml
```
4. Create the directory for the database volume with defined access:
```
install -d -o 1001 -g 1001 ./volumes/data-master/binalyze-air/{data,log}
```
5. Create environment variables.
```
AIR_POSTGRESQL_PASSWORD=$(head /dev/urandom | tr -dc 'a-zA-Z0-9' | head -c 32)
echo "AIR_POSTGRESQL_PASSWORD=$AIR_POSTGRESQL_PASSWORD" >> .env
```
6. Run the following command to start the AIR Database component in Docker:
```
docker compose -p binalyze-air-db up -d
```
7. Wait for the installation to complete. It may take several minutes.
8. Proceed to the installation of the Console Server
:::caution
You should execute the commands below on the Console Server!
:::
1. SSH into the Console Server
2. Create a folder for the AIR under **/opt** directory and cd into it
```
mkdir /opt/binalyze-air && cd /opt/binalyze-air
```
3. Download the **docker-compose.yml** file and save it
```
curl -fsSL "https://cdn.binalyze.com/air-deploy/docker-compose-without-db.yml" -o docker-compose.yml
```
4. Create the directory for the volume of the services with defined access:
```
install -d -o 1001 -g 1001 ./volumes/tornado/{data,config}
```
5. Set the database URI for connecting the Console Server to the DB
:::caution[IMPORTANT]
You must fill in the values of the following three variables. You need the passwords created on the DB server and the DB server IP address. You can find the passwords in the `/opt/binalyze-air-db/.env` file on the DB Server.
:::
```
AIR_POSTGRESQL_PASSWORD=
DB_SERVER_IP=
echo "AIR_POSTGRESQL_URI=postgresql://air-data:$AIR_POSTGRESQL_PASSWORD@$DB_SERVER_IP:5432/airdb" >> .env
echo "AIR_NATS_PASSWORD=$(head /dev/urandom | tr -dc 'a-zA-Z0-9' | head -c 32)" >> .env
```
6. Run the following command to start the AIR installation in Docker
```
docker compose -p binalyze-air up -d
```
7. Wait for the installation to complete. It may take several minutes
8. Proceed with the [Finalizing Setup section](#finalizing-setup)
### **Finalizing Setup**
Regardless of the deployment model you choose, you will be asked to provide several configurations at the end of the deployment, such as an organization name and the credentials of the first user account.
Once you have completed the above steps successfully, you should:
1. Visit http://IP-ADDRESS for accessing the Console (IP address here is the public IP address of the machine you have deployed AIR)
2. Accept the EULA and provide the configuration you are asked for in each step
3. Complete the setup and log in using the credentials you have provided
4. Enjoy AIR!
:::note
**Checking the Health of Docker Containers**
To ensure your AIR deployment is functioning correctly, regularly checking the status of your Docker containers is crucial. Here’s how you can monitor and manage the health of your containers:
1. **Check Container Status:**
* Run the command `sudo docker ps` to list all active Docker containers. This command displays the current state of each container, allowing you to identify any that aren't running as expected.
2. **Recommended Method for Restarting Containers in AIR**
* When restarting your AIR containers, we recommend using the **`docker compose restart`** command instead of the **`docker compose down/up`** method.
* The **`docker compose restart`** command allows you to restart all the containers without removing them, ensuring that essential logs and state information are retained. This is crucial for effective troubleshooting, as it helps preserve valuable data that could provide insights into potential issues.
* Additionally, the **`docker compose restart`** command is a faster and less disruptive option compared to using **`docker compose down/up`**. The down/up approach can result in data loss from container recreation, whereas **`docker compose restart`** avoids this by maintaining the containers' state.
* By using the **`docker compose restart`** command, you help ensure logs remain intact, which can assist in resolving issues more efficiently.
**Importance of Regular Checks**
Regular monitoring and proactive management of your Docker containers help maintain the stability and reliability of your AIR deployment. By monitoring container statuses and knowing how to restart services quickly, you can ensure continuous operational performance.
:::
---
# Post-Deployment Configuration Guide
> Source: https://kb.binalyze.ai/air/self-hosted/setup/post-deployment-configuration-guide/index.html
This document has two parts: The first is a guide to the key post-deployment configuration settings available after installing the AIR console.
The second part is a prioritized checklist of settings to review and adjust based on your specific needs.
## PART 1
## AIR Post-Deployment Configuration Guide
After installing the AIR console, an Organization is automatically created to help structure and manage your assets and cases. Your next step should be to navigate to the settings in the upper right corner of the console to configure your deployment according to your organization's requirements.
If you're using AIR to support multiple customers or tenants, this is also the time to create and set up additional organizations for each customer. Additional tenants can be added at any time as your needs evolve.
These settings also provide important information, such as the Deployment Token, Shareable Deployment Page URL, and options to add a Relay Server or manage specific users.
For MSSPs, a new Organization should be created for each client engagement. Enterprise clients may only need one Organization but can create additional ones if required.
### 2. Single Sign-On (SSO)
Using Single Sign-On (SSO) is optional in AIR but is available for those who want to implement it. You can integrate with either:
* Azure AD:[ Azure Integration Guide](../../../features/integrations/microsoft-azure-cloud-platform-integration)
* Okta SSO:[ Okta SAML 2.0 SSO Integration](../../../features/integrations/sso-integrations/okta-saml-2.0-sso-integration)
For more details, visit the[ SSO Integrations Guide](../../../features/integrations/sso-integrations/).
### 3. Two-Factor Authentication (2FA)
Two-factor authentication (2FA) is not required if SSO is implemented. However, if you are not using SSO and wish to utilize the built-in remediation capability, interACT, enabling 2FA is mandatory. Enabling 2FA is also recommended to strengthen user account protection and general security.
### 4. Responder Management & Updates
The Assets Summary on the AIR home page shows assets in states such as:
* **Managed:** The asset's Responder has been deployed and can receive tasks from the Console.
* **Unmanaged:** The asset was discovered (for example via Active Directory) but does not have an AIR Responder deployed.
The summary may also report:
* **Off-Network:** The Responder supplied data via an off-network acquisition or hunt/triage task.
* **Unreachable:** The Responder has not connected for an extended period (over 30 days moves the asset to unreachable; until then it may appear online or offline).
* **Update Required:** The Responder must be updated for correct operation.
* **Update Advised:** The Responder still works, but an update is recommended for full functionality.
* **Isolated:** The asset is isolated from the network except for communication with the AIR Console.
#### Responder version updates
After Responders are deployed, keep them aligned with your Console version.
AIR supports:
1. **Manual updates** — Assign an **Update Responder Version** task to selected assets (immediate or scheduled).
2. **Automatic updates** — Enable Automatic Updates under **Settings → Assets → Responder Updates**, then use the Default policy and optional custom update or exclusion policies.
3. **External deployment tools** (for example SCCM) — Use your organization's software distribution process where appropriate. This is outside the Console's Responder Updates settings.
For configuration details, policy precedence, exclusions, and troubleshooting, see [Responder Updates](../../../settings/console-settings/assets#responder-updates).
For step-by-step task assignment, see [How do I update Responders on assets?](../../../faqs/how-do-i-update-endpoints).
### 5. Create Exception Rules for AIR in EDR/AV Systems
To ensure seamless operation and maximize the effectiveness of AIR in your investigations, it is important to allow-list AIR components in your security tools. AIR collects and analyzes extensive forensic data from assets, which may involve activities like executing binaries, creating temporary files, and accessing sensitive directories. These actions can trigger alarms in EDR or AV solutions, potentially disrupting or slowing down forensic investigations. Configuring exception rules for AIR in your security systems, prevents such interference, ensuring fast and complete evidence acquisition without compromising the investigation process.
Visit this page for the full list of items to exclude: [AIR Responder Exception Rules](../../../setup/responder-deployment/responder-exception-rules/)
Visit this page for information about [AIR Network Communication and Firewall Rules](../../../home/network).
### 6. Evidence Repositories
AIR allows you to store collected evidence either on the local machine where the task was executed or in external repositories. Supported external storage options include:
* SMB
* SFTP
* FTPS
* AWS S3
* Azure Blob
For cloud-based deployments, it is recommended to use cloud-based repositories like AWS S3, Azure Blob, or Google Cloud Storage instead of SMB, SFTP, or FTPS. More details can be found in the[ Evidence Repositories Guide](../../../features/evidence-repositories/).
### 7. Assets
AIR-supported assets include traditional computers, workstations, and servers running Windows, Linux, IBM AIX, or macOS, as well as off-network or cloud-based systems (e.g., AWS EC2 and Azure VMs) running the same operating systems.
Disk images (e.g., RAW, VMDK, E01, Ex01) are also supported for importing into the AIR File Explorer.
After creating an Organization, deploy AIR Responders to assets. Note that assets are associated with a single Organization but can appear in multiple Cases.
For deployment instructions, refer to the[ AIR Responder Deployment Guide](../../../setup/responder-deployment/).
### 8. Cases
Cases in AIR manage acquisitions, triages, interACT sessions, comparisons, scheduled tasks, case notes, and assigned users. Cases with no tasks performed will appear empty, while active cases will display relevant data and activities.
One of the Case Assets 'Action Buttons' will launch the Investigation Hub for that case.
### 9. Libraries
Libraries in AIR store reusable resources like acquisition profiles, triage rules, interACT files, and more, ensuring easy access and consistency across investigations. Now is the time to create, upload, and configure your triage rules for efficient threat hunting, fine-tune your acquisition profiles, and add any Auto Asset Tags you want to apply during responder deployment.
### 10. Integrations (Automation)
AIR supports automation through integrations, including:
* API Tokens:[ API Documentation](https://docs.binalyze.com/air/api)
* Webhooks (Triggers):[ Webhooks Documentation](../../../features/integrations/webhooks/)
### 11. Hunt/Triage
Hunt/Triage functionality allows for quick and effective threat hunting across assets. For more information, see the[ Hunt/Triage Guide](../../../features/triage/).
### 12. Auto Asset Tagging
The Auto Asset Tagging task will run immediately after Responders are installed, this helps organize and manage assets within AIR. It automates the tagging process based on predefined rules.
The process, along with manual tagging, can also be executed on-demand at a later time for individual or multiple assets.
Details can be found in the[ Auto Asset Tagging Guide](../../../features/auto-tagging-and-tags/).
### 13. Policies
AIR policies allow you to configure settings such as:
* Saving collected evidence to a local repository or external repository.
* Sending files collected by interACT to a download location or evidence repository.
* Resource limits for CPU, bandwidth, and disk space.
* Enabling compression and encryption.
* Configuring IP, port, and process allow lists for isolation policies.
For more information, see the[ Policies Guide](../../../features/policies).
### 14. Additional Configurations
Additional configurations that may be necessary include:
**Console Proxy Settings**
* When using web proxies, configure the AIR console with the correct proxy and SSL/TLS settings. Administrators can enter proxy details (IP, port, username, password) and import SSL/TLS certificates in PEM, DER, or PKCS formats.
**Tamper Detection and Uninstallation Password**
* With Tamper Detection switched on, the Responder will notify AIR of attempts to interfere with its normal operation.
**Chain of Custody using RFC3161 Timestamping**
* The RFC3161 timestamping feature provides proof that the data existed at a particular moment in time and when combined with hashing that it has not changed.
**SMTP Server Configuration**
* Specifying an SMTP server will allow AIR to send password-reset emails to users.
**Syslog/SIEM Integration**
* Integrate with Syslog or SIEM systems for centralized audit logging. Ensure both TCP and UDP protocols are configured correctly.
* Logs from AIR should be forwarded to ensure security monitoring and compliance tracking.
**AI Assistant Integration**
* AI Assistant is a chat-based AI helper for DFIR workflows. It can be toggled on or off. Self-hosted customers must provide their own OpenAI API key under **Settings > Features > AI Assistant**.
**Users and Roles Management**
* AIR enables the creation of users and their assignment to specific Roles and Organizations. Roles offer granular control, with 109 adjustable privileges
**Backup Settings**
* Configure database backup settings. Schedule regular backups or run an instant backup. View your backup history and statuses.
**Active Directory Integration**
* Integrate Active Directory to mirror your organizational structure. This simplifies management by grouping assets based on AD units.
* Validate that assets are correctly categorized and managed through AD synchronization.
* This integration also allows authorized users to log in to AIR using their Active Directory credentials.
## PART 2
## AIR setup Checklist
Following on from the AIR Post-Deployment Configuration Guide above, here is a prioritized checklist to ensure thorough configuration before operational use:
### Priority 1: Core Setup
1. **Organization Setup**
Check/Configure your Organization settings in the Main Menu.
For MSSPs, set up a new Organization for each client. For enterprises, ensure the appropriate organizational structure is established.
2. **Console Proxy Settings**
Check/configure proxy server settings if using web proxies within your network.
3. **Check the Health of Docker Containers**
Run sudo docker ps to list all active Docker containers and check their current status, identifying any that aren't running as expected.
4. **Responder Deployment**
Deploy AIR Responders to all assets (Windows, Linux, macOS, IBM AIX, Cloud Systems).
Check the status of assets and ensure they are connected and associated with the correct Organization(s).
Create Exception Rules for AIR in EDR/AV Systems.
5. **Active Directory Integration**
Integrate AD to mirror your organizational structure.
Validate AD synchronization and ensure assets are categorized correctly.
6. **Users and Roles Management**
Configure roles with appropriate privileges for granular control.
Create users and assign them to roles and organizations.
7. **Case Management**
Set up a Case(s) to manage your investigations these will act as containers for tasks such as acquisitions, triages, interACT sessions, and scheduled tasks.
Assign users to specific cases.
8. **Evidence Repository Configuration**
Configure external repositories (SMB, SFTP, FTPS, AWS S3, Azure Blob, Google Cloud Storage) to store collected evidence.
Prefer cloud-based repositories for cloud deployments.
9. **Backup Configuration**
Schedule regular backups of the AIR database.
Validate backup settings and review backup history.
Consider an approach for backing up AIR audit logs which the system will only keep for 3 months.
### Priority 2: Security Enhancements
1. **Single Sign-On (SSO)**
Optional: Configure SSO using Azure AD or Okta for centralized authentication.
2. **Two-Factor Authentication (2FA)**
Enable 2FA for users if SSO is not implemented, especially if using interACT.
3. **Tamper Detection and Uninstallation Password**
Enable tamper detection to monitor for unauthorized interference with Responders (It is off by default).
Set an uninstallation password to prevent unauthorized removal of Responders.
4. **SSL/TLS Configuration**
Configure proxy server and SSL/TLS settings, including importing necessary certificates.
5. **SMTP Server Configuration**
Set up an SMTP server to enable AIR to send password reset and other critical emails.
6. **Chain of Custody using RFC3161 Timestamping**
Enable RFC3161 timestamping to ensure data integrity and proof of existence.
### Priority 3: Automation and Advanced Features
1. **AI Assistant Integration**
Enable or disable AI Assistant, the chat-based AI helper for DFIR workflows. Self-hosted customers must provide their own OpenAI API key.
2. **API and Webhook Integrations**
Set up API tokens for automation and Webhooks (Triggers) for real-time event management. (The API is the recommended method for integration, preferred over Webhooks for most use cases)
3. **Auto Asset Tagging**
Configure Auto Asset Tagging to organize and manage assets efficiently.
4. **Hunt/Triage Library Setup**
Enable, write, upload, and configure your triage rules in AIR Libraries for efficient threat hunting.
5. **Policy Management**
Establish and configure policies for evidence storage, resource limits, encryption, and isolation settings.
6. **Syslog/SIEM Integration**
Integrate AIR with Syslog or SIEM systems for centralized audit logging and monitoring.
### Priority 4: Ongoing/regular checks
1. **Version Updates**
New releases generally occur once or twice a month - be sure to use the most up-to-date version to ensure the best feature sets, fixes, and performance.
2. **Responder Health**
Use the Assets Summary widget on the Home page to manage the status of your deployed responders.
3. **AIR Audit Logs Backup**
AIR audit logs are saved to the console's PostgreSQL database and retained for 3 months after which they are deleted, so please arrange to back them up if required. Please see [this KB page](../../../features/console-audit-logs) to learn more
This prioritized checklist ensures that your AIR instance is fully configured and optimized for operational use, covering core setup, security enhancements, automation, and advanced features.
---
# Using CLI on Console
> Source: https://kb.binalyze.ai/air/self-hosted/setup/post-deployment-configuration-guide/using-cli-on-console.html
### Overview
AIR CLI is a command-line utility that enables system administrators to manage and troubleshoot the AIR Console. It provides several operations such as restoring backups, managing users, adjusting security settings, and toggling system features. The tool is executed inside the container where the AIR application runs.
Using CLI on Console: The UI
***
### How to Access AIR CLI
To open the AIR CLI, execute the following command on the AIR Console host machine:
```bash
sudo docker exec -ti binalyze-air-app-1 /air-cli
```
This will launch an interactive command-line interface (CLI) where you can select from available operations using a menu.
### 1. Restore Using a Backup File
This operation allows you to restore the entire AIR Console system from a backup file. It can be useful in disaster recovery scenarios or when migrating between environments.
:::caution
**Important:** Restoring a backup will delete all current data and replace it with the data from the backup. Be sure to take a fresh backup if needed before proceeding.
:::
Before using this option, you must copy the backup file into the container using the following command (replace \{{BACKUP\_FILE\_PATH\}} with the actual file path):
```
docker cp {{BACKUP_FILE_PATH}} binalyze-air_app_1:/air.backup
```
Once the file is copied, you can select this option in the CLI and follow the prompts.
**Example input/output:**
```
1 ? I would like to... restore using a backup file
2 ? Please enter the path of file (Just press "Enter" to use the default) /air-backup.abf
3 ? Please provide the MongoDB URI (Just press "Enter" to use the default) mongodb://air.mongodb.server/airdb
4 ? Please provide the PostgreSQL URI (Just press "Enter" to use the default) postgresql://air-
data:#DBPASSWORD#@air.data-master.server:5432/airdb
5 ? Please provide the backed up MongoDB name (Just press "Enter" to use the default) airdb
6 ? Please provide the MongoDB name to restore (Just press "Enter" to use the default) airdb
7 ? This operation will drop your current database and restore the provided backup. Are you sure to continue?
Yes
8
9 (...)
10
11 Restore operation started.
12 .env file restored.
13 Data directory (data.zip) restore started.
14 Data directory restored. Path: /binalyze-air
15
16 postgresql.dump extraction started.
17 postgresql.dump extraction completed.
18 PostgreSQL restore started.
19
20 (...)
21
22 2025-04-17T18:42:59.626+0000 3375 document(s) restored successfully. 0 document(s) failed to restore.
23 MongoDB restore completed.
24 Restore operation completed!
```
You can access the article with details about this operation here: [Restore AIR Backup using the CLI | Knowledge Base](#)
### 2. Reset Local User Password
This option allows you to reset the password of a local user account. The new password is temporary, and the user will be required to change it upon their next login.
Use this as a recovery fallback for when no administrator can sign in to the Console. When the Console is reachable, reset passwords from **Settings > User Management > Users**, which issues a [single-use reset link](/air/settings/console-settings/user-management/resetting-a-user-password) instead of a temporary password.
**Example input/output:**
```
1 ? I would like to... reset password for a user
2 ? Please provide a username binalyze
3 ? Please provide a password *********
4 ? Please provide the PostgreSQL URI (Just press "Enter" to use the default) postgresql://air-
data:#DBPASSWORD#@air.data-master.server:5432/airdb
5 Password for user 'binalyze' updated.
6 Password reset operation completed!
```
### 3. Reset Local User TFA
This option resets two-factor authentication (TFA) for a specified user. It is useful if the user loses access to their authenticator device and cannot log in.
```
1 ? I would like to... reset TFA for a user
2 ? Please provide a username binalyze
3 ? Please provide the PostgreSQL URI (Just press "Enter" to use the default) postgresql://air-
data:#DBPASSWORD#@air.data-master.server:5432/airdb
4 TFA reset operation completed!
```
:::danger
If the 'Enforce 2FA authentication for all users' option under Settings > Security is enabled, users will be required to reconfigure 2FA following the reset.
:::
### 4. Enable/Disable IP Restriction Settings
You can use this option to enable or disable IP restriction for accessing the console. When enabled, only allowed IP addresses can connect to the AIR Console interface.
**Example input/output:**
```
1 ? I would like to... set ip restriction settings
2 ? What would you like to do? Disable
3 ? Please provide the PostgreSQL URI (Just press "Enter" to use the default) postgresql://air-
data:#DBPASSWORD#@air.data-master.server:5432/airdb
4 IP restriction settings is disabled.
5 Set IP Restriction Successfully completed!
```
### 5. Reset Statistics Start Date
This option allows you to reset the start date used for the Activity Dashboard. The date will be set to the time you run this command.
**Example input/output:**
```
1 ? I would like to... reset statistics start date
2 ? Please provide the PostgreSQL URI (Just press "Enter" to use the default) postgresql://air-
data:#DBPASSWORD#@air.data-master.server:5432/airdb
3 Statistics Start Date is 2025-04-17T18:48:54.688Z.
4 Statistics Start Date Reset Successfully completed!
```
### 6. Enable/Disable Console Port Settings
This option allows you to enable or disable the UI access port 8443 settings.
Example input/output
```
1 ? I would like to... set console port settings
2 ? What would you like to do? Disable
3 ? Please provide the PostgreSQL URI (Just press "Enter" to use the default) postgresql://airdata:#
DBPASSWORD#@air.data-master.server:5432/airdb
4 Console port settings is disabled.
5 Please restart the app for the settings to take effect.
6 Set Console Port Successfully completed!
```
### 7. Turn On/Off Features
This option allows you to toggle features. You will be presented with a list of available features and can enable/disable them individually.
**Available feature flags include:**
* investigation-hub-data-access
* investigation-findings-object-columns
* cloud-forensics
* investigation-event-records-details-columns
* purge-without-uninstall
* skip-2fa-for-api-users
* user-management-via-api
* userflow
* auth-management-via-api
* isolation-allowed-list
* cloud-forensics-trial
* relay-server
* investigation-hub-generate-report
* linux-isolation
* sample-feature
* disk-image-asset-type
* frank-ai
* consolidated-report
* locard
* integra-ui
* activity-overview
* sentry-monitoring
* backward-compatibility
* investigation-hub-import-evidence
**Example input/output:**
```
1 ? I would like to... turn on/off features for offline installations
2 ? Select a feature to turn on/off (Use arrow keys)
3 ❯ (...)
4 ? Select a feature to turn on/off sample-feature
5 ? What would you like to do? Disable
6 ? Please provide the PostgreSQL URI (Just press "Enter" to use the default) postgresql://air-
data:#DBPASSWORD#@air.data-master.server:5432/airdb
7 Feature flags updated.
8 Turn on/off feature flag completed!
```
:::danger
This setting is applicable only to offline systems. If your AIR Console server has internet access, feature flags are updated during each license check, and this setting will be overridden.
:::
### 8. Update MITRE Rules
This operation updates the MITRE ATT\&CK rules used by the AIR Console manually.
🔄 You must first download the MITRE rules file from: [https://cdn.binalyze.com/dfir-mitre-attack-rules/mitre.zip](https://cdn.binalyze.com/dfir-mitre-attack-rules/mitre.zip)
Then, copy it into the container using the command below (replace \{{MITRE\_FILE\_PATH\}} with your actual file path):
```
docker cp {{MITRE_FILE_PATH}} binalyze-air_app_1:/mitre.zip
```
After that, run the CLI and follow the prompts to complete the update.
**Example input/output:**
```
1 ? I would like to... update mitre rules
2 ? Please enter the path of file (Just press "Enter" to use the default) /mitre.zip
3 ? Please provide the PostgreSQL URI (Just press "Enter" to use the default) postgresql://air-
data:#DBPASSWORD#@air.data-master.server:5432/airdb
4
5 Current Mitre version: 9.1.3
6 New Mitre version: 9.1.4
7 Restart the AIR app container to apply the new ruleset.
8 Update Mitre rules completed!
```
### 9. Change Users' Organization
This command enables you to transfer one or more users to a different organization by specifying their email addresses and the new organization ID.
**Example input/output:**
```
1 ? I would like to... change users organization
2 ? Please provide a email(s), for multiple please use comma seperated emails test@dummy.com
3 ? Please provide a organizationId 0
4 ? Please provide the PostgreSQL URI (Just press "Enter" to use the default) postgresql://air-
data:#DBPASSWORD#@air.data-master.server:5432/airdb
5 #1 Users will be updated
6 List: test@dummy.com
7 Update in progress....
8 #1 Users were updated:
9 Update progress done!
10 Change user organizations operation completed!
```
---
# Security
> Source: https://kb.binalyze.ai/air/self-hosted/setup/security/index.html
---
# Console Access Control
> Source: https://kb.binalyze.ai/air/self-hosted/setup/security/console-access-control.html
To address a security vulnerability involving Host header injection, we have (with AIR v4.33) implemented more stringent controls on AIR Console access.
This update enhances security protocols and provides administrators with better control over access settings:
### Key Points:
* **Access Restriction:** The AIR Console will now only be accessible through the specific address registered during the initial setup, ensuring that only legitimate requests are processed.
* **Technical Enforcement:** This measure counters manipulations of the Host header that could potentially allow unauthorized access.
* **Configuration Flexibility:** For legitimate access needs from multiple domains or IP addresses, users can specify allowable entries via the AIR\_CONSOLE\_ADDRESSES environment variable.
* **Enhanced Security:** This change prevents unauthorized access and aligns with best practices for secure network management.
:::tip
If you are unsure of your AIR Console Address, you can check the **`config.yml`** file on one of your assets:
Windows: **Program files x86 /binalyze/agent/config.yml**
Linux or macOS; **/opt/binalyze/agent/config.yml**
:::
config.yml viewed in a text editor
:::caution
**Troubleshooting Console Access Issues**
If you encounter the error message **"Invalid Host Header. Host must be the Console Address"** when accessing AIR, it means the system is enforcing stricter security controls to prevent unauthorized access. This typically occurs after upgrading to **AIR Console v4.33 or later**. To understand why this happens and how to resolve it, please refer to our detailed FAQ guide.
:::
---
# Trust Center: Your Security and Compliance Hub
> Source: https://kb.binalyze.ai/air/self-hosted/setup/security/trust-center-your-security-and-compliance-hub.html
## Binalyze Trust Center: Your Security and Compliance Hub
### Why Visit the Binalyze Trust Center?
The Binalyze Trust Center is your one-stop resource for information on security, compliance, and transparency. It provides immediate access to everything you need to evaluate, procure, and confidently deploy Binalyze solutions.
### Key Benefits at a Glance
#### **Comprehensive Security Transparency**
* Real-time compliance status and certifications
* Detailed security architecture and controls
* Third-party audit results and validation
#### **Industry-Leading Certifications**
* **ISO/IEC 27001:2022** - Information Security Management
* **ISO/IEC 27701:2019** - Privacy Information Management
* **SOC 2 Type II** - Continuous security validation
* **GDPR Compliant** - Full data protection compliance
* **CSA STAR Level 1** - Cloud security certification
#### **Accelerate Your Processes**
* **Procurement Teams**: Streamlined vendor assessments and faster approvals
* **Security Teams**: Ready-to-use technical documentation and integration guides
* **Compliance Teams**: Pre-validated audit evidence and regulatory documentation
* **Legal Teams**: Complete data processing agreements and privacy documentation
#### **Global Regulatory Support**
* Multi-regional compliance across different jurisdictions
* Cross-border data transfer safeguards
* Continuous updates for evolving regulatory requirements
### What You'll Find
* **Live Compliance Dashboard** - Current certification status
* **Security Documentation** - Policies, procedures, and technical controls
* **Audit Reports** - Independent third-party validation
* **Integration Guides** - Technical security requirements
* **Privacy Documentation** - GDPR compliance and data handling practices
### Perfect For
* **IT Security Professionals** evaluating technical security controls
* **Compliance Officers** gathering audit evidence and regulatory documentation
* **Procurement Teams** conducting vendor risk assessments
* **Legal Teams** reviewing data processing and privacy commitments
### Take Action
**Ready to explore the** Binalyze **security commitment?**
Visit the Binalyze Trust Center at [https://trust.binalyze.com/](https://trust.binalyze.com/) to:
**Accelerate your vendor evaluation process**\
**Access comprehensive compliance documentation**\
**Review third-party security validations**\
**Download audit reports and certifications**
***
_The Trust Center is regularly updated with the latest certifications, audit results, and security documentation to ensure you always have access to current information._
---
# SSL Enforcement
> Source: https://kb.binalyze.ai/air/self-hosted/setup/security/ssl-enforcement/index.html
### Overview
In order to improve the overall security posture of AIR, accessing AIR over HTTPS is **mandatory**.
For this reason, it is required that all existing users obtain an SSL certificate issued by a valid public Certificate Authority before updating their instances.
As a fallback to ensure system continuity, you can also use the unique self-signed certificate issued automatically by AIR, either temporarily or as a permanent solution.
**IMPORTANT NOTE**: Port 443 should be allowed inbound on your AIR console instance.
### What Happens When Using a Private Root Certificate Authority (CA)
When the AIR Console is configured to use a TLS certificate issued by a private Root Certificate Authority (CA), all client components must explicitly trust that Root CA. This applies to:
* All browsers accessing the AIR Console
* All assets where the AIR Responder is installed
The Root CA certificate must be securely distributed and added to the trusted certificate store of each browser and asset. This ensures TLS validation succeeds and secure communication with the AIR Console can be established without errors.
:::caution
If the private Root CA is not trusted on assets running the Responder, TLS certificate validation will fail. As a result, Responders will be unable to register with the AIR Console and will remain disconnected due to certificate trust errors.
:::
### How does it work?
* A unique Root CA (self-signed) and shares the public key of this with the asset responders upon their first connection to the AIR console.
* Then an SSL certificate is issued by this Root CA for responder-console communication.
* This SSL certificate is only used by the asset responder and is not available to other applications on your assets for security reasons.
### **My browser displays a warning message when I use the automatically created SSL certificate. What should I do?**
Self-signed certificates are provided for business continuity purposes and we strongly suggest using an SSL certificate that is issued by a trusted Root CA. Until you obtain a valid certificate, you can follow the workarounds for major browsers listed below:
* [Mozilla Firefox](https://support.mozilla.org/en-US/kb/error-codes-secure-websites)
* [Google Chrome](https://support.google.com/chrome/answer/95617)
### **What if I already use a valid certificate?**
During the update, AIR will still create a unique Root CA for your instance and share the public key with the responders. If you already use AIR with a valid SSL certificate, a new SSL certificate will not be issued, and your current certificate will continue to be used.
### **What happens if I update with a self-signed/invalid/unverified/expired certificate installed?**
In this case, the old certificate will be saved locally on the AIR console for backup purposes and AIR will issue a unique Root CA (self-signed) and share the public key of this Root CA with the responders. From this point on, an SSL certificate that is issued using this Root CA will be used for responder-console communication.
### What if I haven't installed any certificates yet?
AIR will issue a unique Root CA (self-signed) and share the public key of this Root CA with the responders. From this point on, an SSL certificate that is issued using this Root CA will be used for responder-console communication.
### What if I'm installing AIR now for the first time?
AIR will issue a unique Root CA (self-signed) and share the public key of this Root CA with the responders. From this point on, an SSL certificate that is issued using this Root CA will be used for responder-console communication.
---
# SSL Certificate Management in AIR
> Source: https://kb.binalyze.ai/air/self-hosted/setup/security/ssl-enforcement/ssl-certificate-management.html
Are you encountering security warnings when accessing AIR? Let's demystify the process of changing SSL certificates in AIR to ensure seamless and secure connections.
## Prerequisites
- **Full-chain certificate (complete trust chain):** The uploaded file must contain the full certificate chain — your server (leaf) certificate followed by all intermediate certificates up to (but not including) the trusted root CA. Uploading the leaf certificate alone will cause clients to reject the connection with an untrusted-issuer error.
- **SAN must match the Console address:** The certificate's Subject Alternative Name (SAN) must include the exact hostname (FQDN or IP) used to reach the AIR Console. If the SAN does not match the address users browse to, the browser will block the connection with a hostname-mismatch error.
**Understanding Self-Signed Certificates:**
Many users wonder why they receive security warnings when accessing AIR. These warnings often stem from the use of self-signed certificates, which are SSL certificates created without a certificate authority. While self-signed certificates offer convenience, they lack the validation provided by certificate authorities, leading to "untrusted" status in browsers.
**Navigating CSR and Certificate Authorities:**
To obtain SSL/TLS certificates, organizations generate Certificate Signing Requests (CSRs) and submit them to certificate authorities (CAs) for validation. However, AIR does not handle CSRs due to identity verification complexities and associated fees. Instead, users are encouraged to create CSRs using tools like OpenSSL and obtain certificates from trusted CAs.
**Importing Certificates into AIR:**
To import corporate or self-signed certificates into AIR, users must establish the certificate chain, including the certificate itself, intermediate certificate, and root certificate. This process can be accomplished using a text editor and importing the combined certificate chain into the platform.
**Clarifying Common Queries:**
Properly posed questions, such as "How can I import my corporate certificate to AIR?" or "How can I upload my self-signed certificate to AIR?" help streamline the process. The answer lies in establishing the certificate chain and ensuring inclusion in clients' trusted root-certificates section for self-signed certificates.
**Final Thoughts:**
While SSL certificate management may seem complex, the tasks involved are straightforward. Support engineers need not possess extensive SSL knowledge, and consulting system administrator is always recommended for SSL-related tasks. By understanding these fundamentals, users can navigate SSL certificate changes with confidence in AIR.
---
# Uninstalling Responders
> Source: https://kb.binalyze.ai/air/self-hosted/setup/uninstalling-responders.html
There are several ways to uninstall the AIR Responder from assets and these include using the AIR console or working on the actual asset.
It is important to understand that you should only remove the Responder if you have no intention of revisiting the asset for further investigations. If you do need to do so, then a fresh responder deployment will be needed.
From the Assets button in the Main Menu it is possible to select one or multiple assets and then, via the Bulk Action Bar, choose to either 'Uninstall a Responder' or to 'Uninstall responder and purge console data'.
Uninstalling Responders: Bulk Action uninstall
It is also possible to uninstall a Responder from the individual asset's, Asset Info page by selecting the option from the Asset Actions drop-down menu:
The '**Uninstall Responder**' will remove the AIR Responder application from any selected assets.
The '**Uninstall Responder and purge console data**' option will remove the AIR Responder application from the selected assets and delete the data saved from the assets on the console. All associated Tasks (eg, Timeline) will also be deleted from the console. Data saved to remote storage and locally saved data on the asset will remain intact. interACT or standard asset management tools can be used to remove this data.
:::caution
**Uninstall Protection for AIR Responder Uninstallation**
When Uninstall Protection is enabled in AIR's settings, a Console-generated uninstall code is required to uninstall the AIR Responder manually. This feature restricts manual uninstallation to command-line operations only, as uninstallation through the local operating system's user interface (UI) is disabled.
Here are the key points regarding this feature:
1. **Command-Line Uninstallation**: The AIR Responder must be uninstalled using shell commands. During this process, a valid uninstall code must be included as an argument. This can be executed either locally or through remote management tools, such as SCCM.
2. **Local User Restrictions**: Local users must supply a valid uninstall code to uninstall the Responder. Without a code, uninstallation via local user interfaces is not possible.
3. **UI and API Uninstallation**: Uninstallation through the AIR UI or API does not require a manual uninstall code. Console-initiated uninstall tasks carry a signed authorization instead, allowing for more flexible remote management.
4. **Tamper Detection**: AIR monitors and logs any tampering with the responder. This includes actions such as deletion, pausing, termination, or any other interference, thereby enhancing security and accountability.
This structured approach ensures that only authorized personnel can remove the AIR Responder, providing an additional layer of security against unauthorized tampering and ensuring compliance with security policies.
:::
Uninstalling Responders: Tamper Detection Alerts amongst other 'normal' AIR activity in Audit Logs
### Delete Asset option
The Delete Asset button is available **only for Disk Image asset types**. For any other asset type, this option remains grayed out. When used, it simply removes the Disk Image of the asset from the console without affecting the asset itself.
Uninstalling Responders: You must select deleable assets
As shown above, when attempting to delete assets in the system, certain restrictions apply based on the type of assets selected. For instance, if you select both a Windows asset and a Disk Image asset simultaneously, the "Delete Asset" option becomes unavailable (greyed out). This is because the Windows Asset is classified as non-deletable.
**Key Details:**
* **Non-Deletable Assets**: Windows assets are considered non-deletable within this system due to their critical nature or specific configuration settings that prevent deletion.
* **Tooltip Information**: When the "Delete Asset" option is greyed out, a tooltip will appear indicating that a non-deletable asset (the Windows Asset) has been selected, providing clarity on why deletion is restricted.
This design ensures that critical assets are protected from accidental deletion, enhancing the security and integrity of the system's data management.
## Managing uninstall codes
Go to **Settings > Assets > Uninstall Protection** in the Console to manage manual uninstall codes.
* **New Code:** Generates a new Console-wide uninstall code. It can be used on any Responder managed by that Console for approximately 30 days. Previously generated codes remain valid until they expire.
* **Revoke All Codes:** Rotates the Console signing key, invalidating all previously generated uninstall codes and task authorizations, and automatically generates a new code. Responders that are offline apply the new key when they reconnect; until then, they continue to accept codes signed with the key they currently have.
Console-initiated uninstall tasks do not require a manual code. Each task carries a signed authorization valid for approximately seven days, allowing temporarily offline Responders to process the task after they reconnect.
## Uninstalling on Windows assets
#### Graphical User Interface (GUI) Method
To gracefully uninstall the Responder application from your Windows operating system, follow these steps:
1. Navigate to the Control Panel.
2. Access the "Add/Remove Programs" feature.
3. Locate and select the AIR Responder application from the list.
4. Choose the option to uninstall.
#### Command Prompt Method
You can also uninstall the Responder application using the command prompt with the following methods:
**Using Product Code**
To uninstall via the product code, execute the following steps:
* Identify the product code of the Responder using PowerShell:
```
get-wmiobject Win32_Product | Sort-Object -Property Name | Format-Table IdentifyingNumber, Name, LocalPackage -AutoSize
```
Identifying the product code of the Responder using Powershell
* Copy the identified product code.
* Uninstall the Responder using `msiexec`:
```
msiexec /x "{84662419-2FEB-48D0-AFBF-C174D871A3CA}"
```
**Using the Original MSI File**
If you possess the original MSI file of the Responder, you can proceed as follows:
```
msiexec /x "C:\Users\hio\Downloads\AIR.Agent_2.25.0_air-dev.binalyze.com_44_4ce0820f14f6461a_amd64_.msi"
```
In either method, you can efficiently uninstall the Responder application from your system.
#### Uninstalling a Responder with Uninstall Protection Enabled
When Uninstall Protection is enabled, manual uninstallation requires a Console-generated uninstall code and must be performed from the command line.
1. In the Console, go to **Settings > Assets > Uninstall Protection**.
2. Select **New Code**, confirm the action, and copy the generated uninstall code.
3. Run the following command, replacing `` with the generated code:
```powershell
msiexec /x "{84662419-2FEB-48D0-AFBF-C174D871A3CA}" UNINSTALL_CODE=""
```
An uninstall code can be used on any Responder managed by the same Console and remains valid for approximately 30 days. Generating a new code does not invalidate previously generated codes.
#### Uninstalling without Purge
To uninstall without removing leftover files, include the `NO_PURGE=1` parameter in your command line:
```powershell
msiexec /x "{84662419-2FEB-48D0-AFBF-C174D871A3CA}" NO_PURGE=1
```
This ensures that the uninstallation process leaves the configuration and data files behind.
#### **Uninstallation File and Directory Cleanup Process**
When uninstalling the AIR Responder program from a computer, certain files and directories are methodically cleaned up to ensure no residual data remains. All of these files are deleted by the Responder before the uninstallation process is finalized.
* **Utils Directory:** The utils binaries located in the Responder's installation directory are removed. If the installation directory is `C:\Program Files (x86)\Binalyze\AIR\agent`, folder can be found in:
* C:\Program Files (x86)\Binalyze\AIR\agent\\**utils**
* **Upload Temporary Directory:** The directory used for temporary storage of upload files is cleared. This can be found in one of the following paths.
* C:\Users\\\[user]\AppData\Local\Temp\\**BinalyzeUploadTemp**
* C:\Windows\TEMP\\**BinalyzeUploadTemp**
* **Update Temporary Directory:** The directory used for temporary storage of update files is cleared. This file can be found in one of the following paths.
* C:\Users\\\[user]\AppData\Local\Temp\\**BinalyzeUpdateTemp**
* C:\Windows\TEMP\\**BinalyzeUpdateTemp**
* **Update Task Download Directory:** The directory used for downloading MSI binaries, If the Windows system directory is `C:\`, the path can be found as follows.
* C:\\**BinalyzeUpdateTemp**
* **Binalyze Temp Directories:** If the temp location is `C:\Windows\TEMP\`, the paths can be found as follows.
* C:\Windows\TEMP\\**Binalyze**
* C:\Windows\TEMP\\**BinalyzeTemp**
:::note
On Windows systems, the program selects the first non-empty value from the environmental variables %TMP%, %TEMP%, %USERPROFILE%, or the Windows directory for temporary storage.
:::
## Uninstalling on Linux assets
#### On Ubuntu and Debian
1. Open a terminal window.
2. To uninstall the AIR Responder package, use the following command:
`sudo apt remove binalyze-air-agent`
This command will uninstall the package.
#### On CentOS, Fedora, Redhat and similar distributions (using dnf)
1. Open a terminal window.
2. To uninstall the AIR Responder package, run the following command:
`sudo dnf remove binalyze-air-agent`
This command will uninstall the package.
#### Uninstalling a Responder with Uninstall Protection Enabled
When Uninstall Protection is enabled, manual uninstallation requires a Console-generated uninstall code.
1. In the Console, go to **Settings > Assets > Uninstall Protection**.
2. Select **New Code**, confirm the action, and copy the generated uninstall code.
3. Run the following command, replacing `` with the generated code.
**On Ubuntu and Debian:**
```bash
sudo env AIR_UNINSTALL_CODE="" apt remove binalyze-air-agent
```
**On CentOS, Fedora, Redhat and similar distributions:**
```bash
sudo env AIR_UNINSTALL_CODE="" dnf remove binalyze-air-agent
```
An uninstall code can be used on any Responder managed by the same Console and remains valid for approximately 30 days. Generating a new code does not invalidate previously generated codes.
#### Uninstalling without Purge
To uninstall without removing leftover files, you can set the `AIR_NO_PURGE` environment variable before initiating the uninstallation of the Responder. Execute the following command in your terminal to proceed with this method:
**On Ubuntu and Debian:**
`AIR_NO_PURGE="1" sudo -E apt remove binalyze-air-agent`
**On CentOS, Fedora, Redhat and similar distributions:**
`AIR_NO_PURGE="1" sudo -E dnf remove binalyze-air-agent`
This ensures that the uninstallation process will leave behind configuration and data files.
#### **Uninstallation File and Directory Cleanup Process**
When uninstalling the AIR Responder program from a computer, certain files and directories are methodically cleaned up to ensure no residual data remains.
* **Drone Config File:** Drone config file located in the Responder's installation directory. If the installation directory is `/opt/binalyze/air/agent`, the file can be found in:
* /opt/binalyze/air/agent/**DRONE.Config.yml**
* **Utils Directory:** The utils binaries located in the Responder's installation directory are removed before the uninstallation of the service. If the installation directory is `/opt/binalyze/air/agent`, the folder can be found in:
* /opt/binalyze/air/agent/**utils**
* **Upload Temporary Directory:** The directory used for temporary storage of upload files is cleared. This folder can be found as follows.
* /var/lib/binalyze/**BinalyzeUploadTemp**
* **Update Temporary Directory:** The directory used for temporary storage of update files is cleared. This folder can be found as follows.
* /var/lib/binalyze/**BinalyzeUpdateTemp**
* **Update Task Download Directory:** The directory used for downloading deb or rpm binaries, If the Linux temp directory is `/tmp`, the folder can be found as follows.
* /tmp/**BinalyzeUpdateTemp**
* **Binalyze Temp Directories:** If the temp location is `/tmp`, the folders can be found as follows.
* /tmp/**Binalyze**
* /tmp/**BinalyzeTemp**
* **Persistent Folder:** The persistent folder can be found in:
* /var/lib/binalyze
* Config File: Config file is located in the Responder's installation directory. After deleting the Responder, the configuration file is deleted. If the installation directory is `/opt/binalyze/air/agent` the file can be found in:
* `/opt/binalyze/air/agent/config.yml`
:::note
On Linux systems, it returns $TMPDIR if non-empty, else /tmp.
:::
## Uninstalling on macOS assets
To initiate the uninstallation process for the Responder via the Terminal on macOS, execute the following command:
`sudo /opt/binalyze/air/agent/air --uninstall`
This command, executed in the Terminal, will guide you seamlessly through the removal of the Responder application from your macOS system.
#### Uninstalling a Responder with Uninstall Protection Enabled
When Uninstall Protection is enabled, manual uninstallation requires a Console-generated uninstall code.
1. In the Console, go to **Settings > Assets > Uninstall Protection**.
2. Select **New Code**, confirm the action, and copy the generated uninstall code.
3. Run the following command, replacing `` with the generated code:
```bash
sudo env AIR_UNINSTALL_CODE="" /opt/binalyze/air/agent/air --uninstall
```
An uninstall code can be used on any Responder managed by the same Console and remains valid for approximately 30 days. Generating a new code does not invalidate previously generated codes.
#### Uninstalling without Purge
To uninstall without removing leftover files, set the `AIR_NO_PURGE` environment variable before initiating the uninstallation of the Responder:
```bash
AIR_NO_PURGE="1" sudo -E /opt/binalyze/air/agent/air --uninstall
```
This ensures that the uninstallation process leaves the configuration and data files behind.
**Uninstallation File and Directory Cleanup Process**
When uninstalling the `com.binalyze.air-agent` program from a computer, specific files and directories are methodically cleaned up to ensure no residual data remains. All of these files are deleted by the Responder after the package info is deleted.
* **Utils Directory:** The utils binaries located in the Responder's installation directory are removed before the uninstallation of the service. If the installation directory is `/opt/binalyze/air/agent`, the folder can be found in:
* /opt/binalyze/air/agent/**utils**
* **Binaries:** If the installation directory is `/opt/binalyze/air/agent`, these files are located in:
* /opt/binalyze/air/agent/**air**
* /opt/binalyze/air/agent/**tactical**
* /opt/binalyze/air/agent/**drone**
* **Config File:** This file is located in the Responder's installation directory. If the installation directory is `/opt/binalyze/air/agent`, file can be found in:
* /opt/binalyze/air/agent/**config.yml**
* **Drone Config File:** This file is located in the Responder's installation directory. If the installation directory is `/opt/binalyze/air/agent`, the file can be found in:
* /opt/binalyze/air/agent/**DRONE.Config.yml**
* **Service File:** This file can be found in:
* /Library/LaunchDaemons/com.binalyze.air-agent.plist
* **Upload Temporary Directory:** The directory used for temporary storage of upload files are cleared. This folder can be found as follows.
* /var/lib/binalyze/**BinalyzeUploadTemp**
* **Update Temporary Directory:** The directory used for the temporary storage of update files is cleared. This folder can be found as follows.
* /var/lib/binalyze/**BinalyzeUpdateTemp**
* **Update Task Download Directory:** The directory used for downloading pkg binaries, if the unix temp directory is `/tmp`, the folder can be found as follows.
* /tmp/**BinalyzeUpdateTemp**
* **Binalyze Temp Directories:** If the temp location is `/tmp`, the folders can be found as follows.
* /tmp/**Binalyze**
* /tmp/**BinalyzeTemp**
* **Persistent Folder:** The persistent folder can be found in:
* /var/lib/binalyze
:::note
On Unix systems, it returns $TMPDIR if non-empty, else /tmp.
:::
---
# Self-Hosted Updating
> Source: https://kb.binalyze.ai/air/self-hosted/updating/index.html
[Single-Tier Systems](single-tier-systems)
[2-Tier Systems](2-tier-systems)
[Retiring MongoDB after upgrading to AIR v4.37+](retiring-mongodb-after-upgrading-to-air-v4-37)
[AIR PostgreSQL 15 → 18 Upgrade Guide](postgresql-15-to-18-upgrade-guide)
---
# 2-Tier Systems
> Source: https://kb.binalyze.ai/air/self-hosted/updating/2-tier-systems.html
### (1) - **Taking a System Backup**
1. Login to the AIR Console Web UI using a Global Admin Account.
2. Navigate to the Backup Management section by selecting the **Gear Button** and then "**Backup History**" from the drop-down list.
3. Make a backup of the system by clicking the "**Backup Now**" button on the top right corner.
4. Download the backup file by clicking the **Vertical Ellipsis** **Button** under the "**Actions**" column and clicking **Download** from the drop-down list.
* This will download a zip file with the ABF extension (AIR Backup File).
### **(2) - Stop AIR Systems**
**NOTE: You must stop AIR System first.**
1. Use a terminal emulator, such as PuTTY to connect to the CLI of the AIR Server via SSH.
2. Navigate to the AIR folder (/opt/binalyze-air by default) by executing the following command:
* `cd /opt/binalyze-air`
3. Stop containers by executing the following command:
* `docker compose down -v`
### **(3) - Stop DB System**
1. Navigate to the AIR DB folder (/opt/binalyze-air-db by default) by executing the following command:
* `cd /opt/binalyze-air-db`
2. Stop containers by executing the following command:
* `docker compose down -v`
### **(4) - Updating the DB System**
**NOTE: You must upgrade DB first.**
1. Use a terminal emulator, such as PuTTY to connect to the CLI of the DB Server via SSH.
2. Navigate to the AIR DB folder (/opt/binalyze-air-db by default) by executing the following command:
* `cd /opt/binalyze-air-db`
3. Pull the latest images by executing the following command:
* `docker compose pull`
4. Start containers by executing the following command:
* `docker compose up -d`
### **(5) - Updating the AIR System**
1. Use a terminal emulator, such as PuTTY to connect to the CLI of the AIR Server via SSH.
2. Navigate to the AIR folder (/opt/binalyze-air by default) by executing the following command:
* `cd /opt/binalyze-air`
3. Pull the latest images by executing the following command:
* `docker compose pull`
4. Start containers by executing the following command:
* `docker compose up -d`
---
# Single-Tier Systems
> Source: https://kb.binalyze.ai/air/self-hosted/updating/single-tier-systems.html
### **Taking a System Backup**
1. Login to the AIR Console Web UI using a Global Admin Account.
2. Navigate to the Backup management section by selecting the **Gear Button** and then "**Backup History**" from the drop-down list.
3. Make a backup of the system by clicking the "**Backup Now**" button in the top right corner.
4. Download the backup file by clicking the **Vertical Ellipsis** **Button** under the "**Actions**" column and clicking **Download** from the drop-down list.
* This will download a zip file with the ABF extension (AIR Backup File).
### **Updating the System**
* Use a terminal emulator, such as PuTTY to connect to the CLI of the AIR Console & DB Server via SSH.
* Navigate to the AIR folder (/opt/binalyze-air by default) by executing the following command:
* `cd /opt/binalyze-air`
* Stop containers by executing the following command:
* `docker compose -p binalyze-air down -v`
**(NB: If you are using AIR v3.4 or older, change 'docker compose' to 'docker-compose' in all commands)**
* Pull latest images by executing the following command:
* `docker compose pull`
* Start containers by executing the following command:
* `docker compose -p binalyze-air up -d`
---
# Retiring MongoDB after upgrading to AIR v4.37+
> Source: https://kb.binalyze.ai/air/self-hosted/updating/retiring-mongodb-after-upgrading-to-air-v4-37.html
This guide is for self-hosted and air-gapped environments that have already upgraded to AIR v4.37 or later.
It applies to:
- Single-tier deployments (`/opt/binalyze-air/docker-compose.yml`)
- Two-tier deployments (`/opt/binalyze-air-db/docker-compose.yml`)
## Why MongoDB is no longer needed
From v4.37 onward, Timeline data is stored in PostgreSQL. MongoDB is no longer required for normal AIR operations.
Keeping an unused MongoDB container has drawbacks:
- Security scan noise from CVEs in an unused image
- Extra CPU, RAM, and disk usage
- Operational overhead in upgrades and image management (especially in air-gapped environments)
## Is removal mandatory?
No. AIR v4.37+ can still run if the MongoDB container remains in place.
However, removal is strongly recommended. Starting with v4.38+, `air.mongo` images are no longer shipped, which can create avoidable image-pull and maintenance issues in environments that pin tags.
## Before you begin
1. Confirm your Console is running v4.37 or newer in **Settings > General > Version**.
2. Create an AIR backup in **Settings > Backup History > Backup Now**.
3. Optionally create a VM snapshot for rollback safety.
## Step 1: Stop running containers
### Single-tier
```bash title="Stop containers on the Console server"
cd /opt/binalyze-air
docker compose down
```
### Two-tier
```bash title="Stop containers on the Console server"
cd /opt/binalyze-air
docker compose down
```
```bash title="Stop containers on the DB server"
cd /opt/binalyze-air-db
docker compose down
```
## Step 2: Edit docker-compose and remove MongoDB
Open the compose file for your deployment type:
```bash title="Single-tier"
sudo nano /opt/binalyze-air/docker-compose.yml
```
```bash title="Two-tier (DB server)"
sudo nano /opt/binalyze-air-db/docker-compose.yml
```
Remove the entire `mongodb:` service block and any `depends_on` references to MongoDB.
Keep the `./volumes/mongodb` directory for now. Delete it only after validating that you no longer need legacy Timeline data from versions earlier than v4.37.
## Step 3: Start containers again
### Single-tier
```bash
cd /opt/binalyze-air
docker compose up -d --remove-orphans
```
### Two-tier
```bash title="Start DB server first"
cd /opt/binalyze-air-db
docker compose up -d --remove-orphans
```
```bash title="Then start Console server"
cd /opt/binalyze-air
docker compose up -d
```
## Step 4: Security cleanup (required)
If your environment is scanned by vulnerability tooling, remove unused image layers:
```bash
docker image prune -a
```
Removing only the MongoDB container is not enough. The image should also be removed to avoid false-positive findings from unused, unpatched CVEs.
## Step 5: Verify
1. Confirm MongoDB is no longer running:
```bash
docker ps | grep mongo
```
No output is expected.
2. In the AIR UI, open Timeline and verify data is still visible.
## FAQ
### Do I lose old Timeline data?
No. Timeline was migrated to PostgreSQL in v4.37. Data created after upgrade is stored in PostgreSQL.
### Will future upgrades break if MongoDB is still present?
Not immediately, but the unused service remains a maintenance burden. Removing it is recommended.
### Can I delete `./volumes/mongodb`?
Yes, once you have confirmed you no longer need legacy Timeline data from versions earlier than v4.37.
### Does this apply to SaaS?
No. SaaS environments are managed by Binalyze.
## Need help?
If you encounter issues, contact Support at support@binalyze.com.
---
# AIR PostgreSQL 15 → 18 Upgrade Guide
> Source: https://kb.binalyze.ai/air/self-hosted/updating/postgresql-15-to-18-upgrade-guide.html
This guide walks you through upgrading the PostgreSQL database in a self-hosted AIR deployment from PostgreSQL 15 to PostgreSQL 18. It covers single-tier, two-tier, and offline (air-gapped) deployments.
:::caution
PostgreSQL 18 is supported only on **AIR v5.23** and later.
If you are running an earlier AIR version, upgrade to **AIR v5.23** first and allow the environment to run normally for at least **24 hours** before performing the PostgreSQL upgrade.
:::
## 1. One Day Before
Complete the following preparation steps at least **24 hours before** your planned PostgreSQL upgrade.
**Recommended actions the day before:**
- Before the maintenance window opens, ask your team to close any cases that are no longer actively being worked on.
This is strongly recommended. During the upgrade, the AIR database will be unavailable for a period of time. Closing idle cases in advance has two benefits: it protects against data loss for any unsaved work, and it allows AIR's internal database operations to complete — freeing up the disk space that those cases were occupying. Make sure AIR has been running normally for at least one full day after the case closures so that these cleanup operations have time to finish and the freed disk space is properly reflected before you check disk requirements.
- Notify all AIR users of the upcoming maintenance window and its expected duration.
- Ask users to close any cases they are no longer actively using.
- Confirm with team leads that no time-sensitive case activity is expected during the window.
## 2. Before the Upgrade
We strongly recommend taking an **AIR Backup** before starting the upgrade.
During the PostgreSQL upgrade, the database is offline. While the upgrade is in progress:
- Users cannot log in to AIR.
- Database operations are not available.
- API requests requiring database access may fail.
- Background jobs that require the database resume after the upgrade completes.
Although the upgrade process preserves your data, an AIR Backup provides an additional recovery option in the unlikely event of an unexpected failure.
### What is an AIR Backup?
An AIR Backup is a `pg_dump`-based export of your AIR data, taken through the AIR application. It captures the logical contents of your database and can be used to restore your data into a working AIR environment. See [Backup](../../settings/console-settings/backup.md).
### AIR Backup vs. `--keep-legacy-backup`
These are two distinct mechanisms that serve different purposes:
| | AIR Backup | `--keep-legacy-backup` |
| --- | --- | --- |
| **What it is** | A `pg_dump` export of AIR data | A raw copy of the entire PostgreSQL 15 cluster directory |
| **Who manages it** | You, before the upgrade | The upgrade script, automatically |
| **Used for** | Data recovery, migration, general restore | Rollback to PostgreSQL 15 if the upgrade fails |
| **Data coverage** | Point-in-time snapshot of AIR application data | Full cluster state at the moment of upgrade |
Both are recommended. Take an AIR Backup yourself before starting, and run the upgrade with `--keep-legacy-backup` to preserve the rollback option.
### Disk space requirement
Before starting the upgrade, confirm that the host has enough free disk space. The upgrade process copies the entire PostgreSQL cluster before swapping to the new version, so it needs room for both copies to exist simultaneously.
**Minimum free disk space required: 1.2× the current PostgreSQL cluster size.**
You don't have to calculate this manually. The `pg-upgrade.sh` script can verify it for you with the `--disk-space-check` flag. This is a read-only check — it does not change any configuration, restart the database, or start the upgrade.
**Step 1 — Download the upgrade script**
```bash
cd /opt/binalyze-air
curl -fsSL https://cdn.binalyze.com/air-deploy/pg-upgrade.sh -o pg-upgrade.sh
chmod +x pg-upgrade.sh
```
**Step 2 — Run the disk space check**
```bash
sudo -E bash pg-upgrade.sh --disk-space-check
```
The check reports:
- the current PostgreSQL cluster size,
- the free space required for the upgrade (1.2× the cluster size),
- the space currently available on the data volume, and
- a clear **PASS / FAIL** result.
If you plan to keep the rollback backup (`--keep-legacy-backup`), the report also shows the extra space the retained PostgreSQL 15 backup will occupy — long-term usage stays at roughly **2× the cluster size** while the backup is kept.
If the check fails, free up disk space (for example, close idle cases as described above and let AIR run for a day so cleanup completes), then run it again before starting the upgrade.
:::note[Two-tier deployments]
Run the check on the **DB host**, using that host's AIR folder:
```bash
cd /opt/binalyze-air-db
curl -fsSL https://cdn.binalyze.com/air-deploy/pg-upgrade.sh -o pg-upgrade.sh
chmod +x pg-upgrade.sh
sudo AIR_FOLDER=/opt/binalyze-air-db bash pg-upgrade.sh --disk-space-check
```
:::
## 3. Running the PostgreSQL Upgrade
The upgrade is performed by the `pg-upgrade.sh` script. It sets the required flags, restarts the database service, streams progress logs, and manages the old PostgreSQL 15 data.
:::caution[Key principle]
The PostgreSQL upgrade runs **only on the host where `data-master` runs**. For two-tier deployments, this is the DB host — not the console/app host.
:::
### About `--keep-legacy-backup`
The upgrade script accepts an optional flag: `--keep-legacy-backup`
**We recommend using this flag.**
| Without `--keep-legacy-backup` | With `--keep-legacy-backup` |
| --- | --- |
| The PostgreSQL 15 backup is deleted automatically after a successful upgrade. | The PostgreSQL 15 backup (`postgresql.pg15.bak/`) is preserved on disk. |
| Rollback is not possible after the upgrade completes. | Rollback remains possible for as long as the backup exists. |
| Disk space is reclaimed immediately. | Disk space is reclaimed later, when you finalize (see [Finalizing: Removing the Legacy Backup](#6-finalizing-removing-the-legacy-backup)). |
Using `--keep-legacy-backup` gives you a rollback window after the upgrade. You decide when to finalize and remove the old backup once you are confident the upgrade is stable.
### 3.1 Single-Tier Deployments
Run all commands on the single AIR host.
**Step 1 — Download the upgrade script**
```bash
cd /opt/binalyze-air
curl -fsSL https://cdn.binalyze.com/air-deploy/pg-upgrade.sh -o pg-upgrade.sh
chmod +x pg-upgrade.sh
```
**Step 2 — Run the upgrade with backup**
```bash
sudo -E bash pg-upgrade.sh --keep-legacy-backup
```
Large databases may spend several minutes in checksum verification. This is normal — wait for the process to complete.
### 3.2 Two-Tier Deployments
Run all commands **on the DB host only**. The console/app host is not involved in the PostgreSQL upgrade.
**Step 1 — Stop app containers**
```bash
cd /opt/binalyze-air
docker compose down
```
**Step 2 — Download the upgrade script**
```bash
cd /opt/binalyze-air-db
curl -fsSL https://cdn.binalyze.com/air-deploy/pg-upgrade.sh -o pg-upgrade.sh
chmod +x pg-upgrade.sh
```
**Step 3 — Run the upgrade with backup**
```bash
sudo AIR_FOLDER=/opt/binalyze-air-db bash pg-upgrade.sh --keep-legacy-backup
```
### 3.3 Offline Deployments
For offline environments, `pg-upgrade.sh` is not included in the offline bundle and must be obtained separately. Download it from a machine with internet access and manually copy it to the correct path on the target host before starting:
- **Single-tier:** copy to `/opt/binalyze-air/pg-upgrade.sh`
- **Two-tier DB host:** copy to `/opt/binalyze-air-db/pg-upgrade.sh`
#### Offline Single-Tier
**Step 1 — Run the upgrade with backup**
```bash
cd /opt/binalyze-air
chmod +x pg-upgrade.sh
sudo -E bash pg-upgrade.sh --keep-legacy-backup
```
#### Offline Two-Tier
**Step 1 — Stop app containers**
Run on the **DB host only**.
```bash
cd /opt/binalyze-air
docker compose down
```
**Step 2 — Copy and make the upgrade script executable**
Copy `pg-upgrade.sh` to `/opt/binalyze-air-db/`, then:
```bash
cd /opt/binalyze-air-db
chmod +x pg-upgrade.sh
```
**Step 3 — Run the upgrade with backup**
```bash
sudo AIR_FOLDER=/opt/binalyze-air-db bash pg-upgrade.sh --keep-legacy-backup
```
### Monitoring the Upgrade
Use the same `AIR_FOLDER` value used for the upgrade.
Single-tier:
```bash
export AIR_FOLDER=/opt/binalyze-air
sudo -E bash pg-upgrade.sh --get-status
sudo -E bash pg-upgrade.sh --get-logs
```
Two-tier DB host:
```bash
export AIR_FOLDER=/opt/binalyze-air-db
sudo -E bash pg-upgrade.sh --get-status
sudo -E bash pg-upgrade.sh --get-logs
```
### Post-Upgrade Verification
Before closing the maintenance window, confirm the upgrade completed successfully.
**Check that containers are healthy:**
```bash
# Single-tier
docker compose --project-directory /opt/binalyze-air ps
# Two-tier DB host
docker compose --project-directory /opt/binalyze-air-db ps
```
**Confirm the PostgreSQL version is 18:**
```bash
# Single-tier
source /opt/binalyze-air/.env && \
docker compose --project-directory /opt/binalyze-air \
exec data-master \
psql "$AIR_POSTGRESQL_URI" -c "SHOW server_version;"
# Two-tier DB host
source /opt/binalyze-air-db/.env && \
docker compose --project-directory /opt/binalyze-air-db \
exec data-master \
psql "$AIR_POSTGRESQL_URI" -c "SHOW server_version;"
```
**Validate the application:**
- Log in to AIR and confirm the main pages load.
- Verify that existing case data is visible.
- Confirm background jobs and services are running normally.
## 4. Rolling Back
:::danger
Rollback is only possible while `postgresql.pg15.bak/` still exists. This directory is preserved when you run the upgrade with `--keep-legacy-backup`. If it has already been removed, rollback through the script is not possible — you must restore from your pre-upgrade backup instead.
Any data written to the database after the PostgreSQL 18 upgrade began is lost if you roll back.
:::
**Single-tier:**
```bash
cd /opt/binalyze-air
export AIR_FOLDER=/opt/binalyze-air
sudo -E bash pg-upgrade.sh --rollback
```
**Two-tier DB host:**
```bash
cd /opt/binalyze-air-db
export AIR_FOLDER=/opt/binalyze-air-db
sudo -E bash pg-upgrade.sh --rollback
```
The rollback process stops `data-master`, restores the PostgreSQL 15 cluster from the backup directory, and restarts the service.
If your console/app tier was also updated to a release that requires PostgreSQL 18, you also need to roll it back to the previous compatible AIR release.
## 5. Troubleshooting: Sending Logs to Support
If the upgrade fails or `data-master` enters a crash loop, collect a diagnostic archive before contacting Support.
**Archive logs — Single-tier:**
```bash
export AIR_FOLDER=/opt/binalyze-air
sudo -E bash pg-upgrade.sh --archive-logs
```
**Archive logs — Two-tier DB host:**
```bash
export AIR_FOLDER=/opt/binalyze-air-db
sudo -E bash pg-upgrade.sh --archive-logs
```
The archive is saved under:
```text
/pg-upgrade-logs-.zip
```
When contacting Binalyze Support at support@binalyze.com, include:
- Your deployment topology (single-tier / two-tier / offline)
- AIR version before the upgrade
- Target AIR version
- The value of `AIR_FOLDER`
- Whether `--keep-legacy-backup` was used
- The archived log ZIP file
## 6. Finalizing: Removing the Legacy Backup
If you ran the upgrade with `--keep-legacy-backup`, the PostgreSQL 15 backup (`postgresql.pg15.bak/`) is kept on disk until you explicitly remove it. This is intentional — it preserves your rollback option.
Once you are satisfied that the upgrade is stable and you no longer need the rollback option, you can reclaim the disk space using the `--reclaim-legacy-disk` flag.
**Single-tier:**
```bash
cd /opt/binalyze-air
sudo -E bash pg-upgrade.sh --reclaim-legacy-disk
```
**Two-tier DB host:**
```bash
cd /opt/binalyze-air-db
sudo AIR_FOLDER=/opt/binalyze-air-db bash pg-upgrade.sh --reclaim-legacy-disk
```
This removes `postgresql.pg15.bak/` and reclaims the disk space it occupied.
---
# Self-Hosted Backup
> Source: https://kb.binalyze.ai/air/self-hosted/backup/index.html
AIR Console can be backed up in 2 different ways:
* by using the AIR Console user interface
* by using manual commands
## 1. By using AIR Console User Interface
1. Log in to AIR Console Web UI using a Global Admin Account.
2. Navigate to **Settings**.
3. Navigate to **Backup**.
4. Select **Backup History**.
5. Click on **Backup Now**.
## 2. By Using Command Line Interface
:::note
In order to successfully back up from the command line, you must have enough space on your backup disk.
:::
Before starting to back up, check and verify that there is enough disk space on the system, more than the size of the AIR Console installation directories (more details are specified below).
* If you have a 2-Tier installation, you need to check the size of both the Application and Database installation directories.
* To back up the Single Tier and 2-Tier installations, first, you need to connect to the AIR Console machines via SSH.
Check the size of the AIR Console installation directories by using the following commands:
```
du -sh /opt/binalyze-air
du -sh /opt/binalyze-air-db
```
Run the following command to check if there is more free space on the system than the size of the AIR Console installation directories:
```
df -h
```
### Single-Tier
To back up the Single Tier setup, first, you need to connect to the AIR Console via SSH, then, run the commands given below.
The commands below simply perform the following: navigating to the AIR Console installation directory, stopping the Docker service, and then copying the directory.
```
cd /opt/binalyze-air
docker compose down
cp -r /opt/binalyze-air /opt/binalyze-air-backup
```
### For 2-Tier Setup
Since there are two components in a 2-Tier setup, both the Application Server and Database Server have to be **backed up separately**.
To back up the 2-Tier setup, first, you need to connect to AIR Console Application and Database servers via SSH. Then, run the commands given below.
The commands below simply perform the following: navigating to the AIR Console installation directory, stopping the Docker service, and then copying the directory.
#### 2-Tier Application Server
```
cd /opt/binalyze-air
docker compose down
cp -r /opt/binalyze-air /opt/binalyze-air-backup
```
#### 2-Tier Database Server
```
cd /opt/binalyze-air-db
docker compose down
cp -r /opt/binalyze-air-db /opt/binalyze-air-db-backup
```
---
# Restore Backup using the CLI
> Source: https://kb.binalyze.ai/air/self-hosted/backup/restore-backup-using-the-cli.html
Follow these commands to restore your AIR backup using the CLI.
This procedure applies to both Single-tier and 2-tier systems and is performed on the Console server.
***
### 1. Pre-Restore Setup
* Install a fresh AIR Console (choose Single-tier or 2-tier based on your needs).
:::danger
**Important:** After installation, **do not access the UI for first-time setup until you have completed the steps below.**
:::
***
### 2. Transfer and Copy the Backup File
* Use your preferred file transfer tool to transfer your backup file to the new server.
* Ensure the file has the .abf extension (e.g., 23-8-14\_16.43.5.216\_v3.abf).
* Copy the backup file from the host system to the APP container:
`docker cp binalyze-air-app-1:/binalyze-air/`
***
### 3. Retrieve AIR DB URIs (For Two-Tier Installations Only)
* If using a 2-tier system, retrieve the AIR DB connection strings by running:
`cat /opt/binalyze-air/.env`
* These URIs will be needed for validation in the next step.
***
### 4. Run the AIR-CLI to Restore the Backup
Execute the CLI tool with:
`sudo docker exec -ti binalyze-air-app-1 /air-cli`
In the AIR-CLI interface, select:
**"1) Restore using a backup file"**\
When prompted, enter the directory and filename where the backup file was copied, for example:
`/binalyze-air/23-8-14_16.43.5.216_v3.abf`
Press Enter through the default options until you see the confirmation message:
\&#xNAN;**"This operation will drop your current database and restore the provided backup. Are you sure to continue?"**
Type **'y'** and press Enter to continue.\
***
### 5. Finalize the Restore Process
Once the restore completes successfully, a confirmation message will appear.
Exit the container by typing: **Exit**
Restart the containers by running:
`cd /opt/binalyze-air`
`docker compose down && docker compose up -d`
***
Don't hesitate to get in touch with **support@binalyze.com** if you have any problems or questions about the restoration process
---
# Self-Hosted FAQs
> Source: https://kb.binalyze.ai/air/self-hosted/faqs/index.html
[Console Backup Procedure](console-backup-procedure)
[Console CPU Profiling for Performance Issues](console-cpu-profiling-for-performance-issues)
[How can I install a version that isn't the latest?](how-can-i-install-a-version-that-isnt-the-latest)
[How do I perform OS upgrades, security patching, or hardware upgrades on the on-prem AIR host?](air-host-maintenance)
[How do I update Console?](how-do-i-update-console)
[How to reset the password of a user via the CLI?](how-to-reset-the-password-of-a-user-via-the-cli)
[Evidence Acquisition Data Flow in AIR](evidence-acquisition-data-flow)
[Resolving the "Invalid Host Header. Host must be the Console Address" Error](resolving-the-invalid-host-header.-host-must-be-the-console-address-error)
[Anything missing?](roadmap)
---
# How to gather logs for Troubleshooting
> Source: https://kb.binalyze.ai/air/self-hosted/faqs/how-to-gather-logs-for-troubleshooting.html
The AIR **Console** generates the activities log, errors log, and warnings logs. These logs can be used to investigate and solve problems both by the users and the Binalyze AIR Support Team. The log files are stored in separate files on the Console machine.
Investigators and analysts can **download** these log files either by using the **AIR Console** user interface or by **connecting to the console** machine directly (find more details below).
System Administrators must collect log files from:
1. **The AIR Console machine**
[Collecting Console Log Files](collecting-console-log-files)
---
# Collecting Console Log Files
> Source: https://kb.binalyze.ai/air/self-hosted/faqs/collecting-console-log-files.html
### AIR Console log files
AIR Console categorizes and stores the log files under three separate files as listed below:
* Binalyze.AIR.Console.log
* Binalyze.AIR.Console.UI.log
* Binalyze.AIR.Console.API.log
* Binalyze.AIR.Console.Migration.log
The log files generated by the AIR Console are stored in the directory listed below.
/opt/binalyze-air/volumes/app/binalyze-air/logs/
### Downloading the AIR Console Logs and log files
Investigators and analysts can download AIR Console log files either by using AIR Console user interface or by connecting the console machines directly.
#### Method 1: By using Linux machine console commands
1. Log in directly or connect remotely to the AIR Console machine with SSH
2. Browse to the folder /opt/binalyze-air/volumes/app/binalyze-air/logs/
3. Download the files by using `SCP` or view the contents of the files with `tail`, `cat,` or other CLI tools.
#### Method 2: By using the user interface
1. Click on **Settings** in the primary menu.
2. In the section titled **Logging**, a log level can be selected.
3. Click the **Download Log Files** button to generate a compressed zip file containing the log archive.
:::note
AIR Console Logs are rotated regularly, and only the last log files will be downloaded by using the Download Log Files action.
:::
### What's Included in the Log Archive
When you download log files via the user interface, the archive includes:
**Console Log Files:**
* Binalyze.AIR.Console.log
* Binalyze.AIR.Console.UI.log
* Binalyze.AIR.Console.API.log
* Binalyze.AIR.Console.Migration.log
**PostgreSQL Database Diagnostics** *(available from v5.11):*
The log archive now automatically includes PostgreSQL database logs and predefined diagnostic query outputs. This enhancement enables security teams and system administrators to diagnose investigation performance or data ingestion issues without requiring system-level access or engineering assistance.
**Log file name format (example):**
* postgresql-2026-02-22.log
**Log directories:**
* **Single-tier AIR Console Server:** `/opt/binalyze-air/volumes/data-master/binalyze-air/log/postgresql`
* **Two-tier Database Server:** `/opt/binalyze-air-db/volumes/data-master/binalyze-air/log/postgresql`
The PostgreSQL diagnostics help identify issues related to:
* Evidence storage and retrieval
* Query performance bottlenecks
* Data ingestion reliability
* Analysis processing delays
:::tip
No additional action is required to include PostgreSQL diagnostics—they are bundled automatically when you download log files.
:::
By providing standardized diagnostic data, analysts can more quickly correlate anomalies between data ingestion and investigation results, facilitating faster triage of system-level evidence management issues during active incident response workflows.
**Tornado container logs:**
The Tornado container is responsible for the following features:
* Acquire Evidence from Disk Image
* File Explorer
* Repository Explorer
* Server-side DRONE (re-analyze)
AIR Console logs already include the Tornado container logs.
Tornado logs are located on the AIR Console server:
* **Log file name:** `tornado_linux_amd64.log.txt`
* **Log directory:** `/opt/binalyze-air/volumes/tornado/data`
The log level of the AIR Console can be adjusted according to your needs. For example, if an issue occurs in the AIR Console, the log level can be changed to Debug or HTTP to explore the issue better. The log levels can be configured from the same page where the log files are downloaded.
The log levels are explained below:
**Debug:** Debugging logs are used for troubleshooting and debugging purposes. When activated, it generates a large number of detailed log records. This may impact the system's performance and consume excessive disk space. Therefore, this level should be used carefully and only until the problem is resolved. Then it should be pulled back to the info level. Debug level covers both HTTP and info levels.
**HTTP:** HTTP logs are used for troubleshooting purposes. When it is activated, it generates HTTP requests in addition to standard logging. HTTP level covers the info level.
**Info:** Default required log level.
---
# Console Backup Procedure
> Source: https://kb.binalyze.ai/air/self-hosted/faqs/console-backup-procedure.html
* [1. By using AIR Console User Interface](console-backup-procedure.md#1.-by-using-binalyze-air-console-user-interface)
* [2. By Using Command Line Interface](console-backup-procedure.md#2.-by-using-command-line-interface)
* [For Single-Tier Setup](console-backup-procedure.md#for-single-tier-setup)
* [For 2-Tier Setup](console-backup-procedure.md#for-2-tier-setup)
* [2-Tier Application Server](console-backup-procedure.md#2-tier-application-server)
* [2-Tier Database Server](console-backup-procedure.md#2-tier-database-server)
AIR Console can be backed up in 2 different ways:
* by using the AIR Console user interface
* by using the command line interface.
## 1. By using AIR Console User Interface
1. Log in to AIR Console Web UI using a Global Admin Account.
2. Navigate to the Backup Management section by clicking the **Gear Button** and selecting **"Backup History"** from the drop-down list.
3. Get a backup of the system by clicking the **"Backup Now"** button in the top right corner.
4. Download the backup file by clicking the **Vertical Ellipsis Button** under the **"Actions"** column and clicking **Download** from the drop-down list.
5. This will download a compressed file with the ABF extension (AIR Backup File).
## 2. By Using Command Line Interface
**In order to successfully backup from the command line, you must have enough space on your backup disk.**
Before starting to backup, check and verify that there is enough disk space on the system, more than the size of the AIR Console installation directories (more details are specified below).
* If you have a 2-Tier installation, you need to check the size of both the Application and Database installation directories.
* To back up the Single Tier and 2-Tier installations, first, you need to connect to the AIR Console machines via SSH.
Check the size of the AIR Console installation directories by using the following commands:
`du -sh /opt/binalyze-air du -sh /opt/binalyze-air-db`
Run the following command to check if there is more free space on the system than the size of the AIR Console installation directories:
`df -h`
### For Single-Tier Setup
To back up the Single Tier setup, first, you need to connect to the AIR Console via SSH, then, run the commands given below.
The commands below simply perform the following: navigating to the AIR Console installation directory, stopping the Docker service, and then copying the directory.
`cd /opt/binalyze-air docker compose down cp -r /opt/binalyze-air /opt/binalyze-air-backup`
### For 2-Tier Setup
Since there are two components in a 2-tier setup, both the Application Server and Database Server must be **backed up separately**.
To back up the 2-Tier setup, first, you need to connect to the AIR Console Application and Database servers via SSH. Then, run the commands given below.
The commands below simply perform the following: navigating to the AIR Console installation directory, stopping the Docker service, and then copying the directory.
#### 2-Tier Application Server
`cd /opt/binalyze-air docker compose down cp -r /opt/binalyze-air /opt/binalyze-air-backup`
#### 2-Tier Database Server
`cd /opt/binalyze-air-db docker compose down cp -r /opt/binalyze-air-db /opt/binalyze-air-db-backup`
---
# Console CPU Profiling for Performance Issues
> Source: https://kb.binalyze.ai/air/self-hosted/faqs/console-cpu-profiling-for-performance-issues.html
CPU issues are not uncommon in software development and can be frustrating. Therefore, software development teams sometimes need very detailed information about the processes and CPU load to understand the issues better. This document describes how to get detailed information about the processes and CPU load by using CPU profiling.
## Symptoms
If you experience the symptoms below, profile CPU and send the resulting CSV document to our support team at support@binalyze.com
* Slowdowns and lags in the graphical user interface
* Some other performance issues are experienced
## CPU Profiler
CPU Profiler shows what functions consume what percent of CPU time. This information can provide you with a better understanding of how your application is executed and how exactly resources are allocated.
## Profiling
You can initiate CPU profiling by sending a signal to the AIR Console processes. AIR Console works with more than one process according to the number of cores. Profiling using one of these is usually sufficient, but we should do at least half of it for the best results.
List the processes with the `ps` command in the Docker container.
```
docker exec -ti binalyze-air-app-1 sh
ps
```
Run the following command with the ID value of one of the other processes **except for the one with an id value of 1**. Profiling will start with the command below and end when you run the same command again. It will automatically end after 5 minutes if you don't stop it.
After running the command, you should start doing the operations that cause performance problems via AIR Console.
For example, if the CSV Import operation causes performance problems, we should import CSV after starting profiling.
```
kill -USR1
```
After you stop the process, a profile file will be created in the current directory.\
Example: `profile_1681501753028.cpuprofile`
We should exit the container and copy this file to the host server.
```
exit
docker cp binalyze-air-app-1:/binalyze-air/
```
**This file needs to be sent to our support (support@binalyze.com) team for a detailed examination.**
---
# Docker & Host System IP Conflict
> Source: https://kb.binalyze.ai/air/self-hosted/faqs/docker-and-host-system-ip-conflict.html
Docker uses the default **172.17.** **0.0/16** subnet for container networking. If your host system is in this subnet block, you will experience an IP conflict when the docker service or a container is started. To avoid IP conflict, you can change the default docker subnet by modifying the **/etc/docker/daemon.json** file:
* First, check if /etc/docker/daemon.json exists, if not, create it:
```
touch /etc/docker/daemon.json
```
* Modify daemon.json file with a preferred text editor
```
sudo nano /etc/docker/daemon.json
```
Paste the following lines:
`{`
`"default-address-pools":`
`[`
`{"base":"`[`10.10.0.0/16`](http://10.10.0.0/16)`","size":24}`
`]`
`}`
* Save the file by clicking “ctrl+x” and then clicking “y” and finally pressing the “enter".
* Restart docker service by executing the following command:
```
sudo service docker restart
```
* Check the IP address of the docker0 interface:
```
ifconfig docker0
```
* The output should look like this:
docker0: flags=4099\ mtu 1500
**inet 10.10.0.1 netmask 255.255.0.0** broadcast 10.10.255.255
ether AA:BB:CC:DD:EE:FF txqueuelen 0 (Ethernet)
RX packets 0 bytes 0 (0.0 B)
RX errors 0 dropped 0 overruns 0 frame 0
TX packets 0 bytes 0 (0.0 B)
TX errors 0 dropped 0 overruns 0 carrier 0 collisions 0
---
# How can I install a version that isn't the latest?
> Source: https://kb.binalyze.ai/air/self-hosted/faqs/how-can-i-install-a-version-that-isnt-the-latest.html
Occasionally, AIR users may prefer to install or maintain an old version of the software rather than automatically update to the latest release. The instructions below explain how you can select and use the version of your choice:
### Offline Installation/Upgrade Package
To download the installation or upgrade package for your system, use the URLs provided below. The tag "latest" in the URL defaults to the most recent version of the package. To download a specific version, replace "latest" with the version number you require (e.g., "v4.3.3").
**Ubuntu 18.04 to 22.04**\
Download URL: `https://cdn.binalyze.com/air-deploy/offline/latest/binalyze-air-setup-ubuntu.tgz`
**CentOS 7 / RHEL 7**\
Download URL: `https://cdn.binalyze.com/air-deploy/offline/latest/binalyze-air-setup-centos7.tgz`
**CentOS 8 & 9/ RHEL 8 & 9**\
Download URL: `https://cdn.binalyze.com/air-deploy/offline/latest/binalyze-air-setup-centos8.tgz`
**Example for downloading a specific version**:\
For Ubuntu 18.04 to 22.04, use:\
`https://cdn.binalyze.com/air-deploy/offline/v4.3.3/binalyze-air-setup-ubuntu.tgz`
### Online Upgrade
#### 2-Tier
Run the following commands on the Application and Database servers before upgrading your systems online by following [air/updating-air/2-tier-systems](../updating/2-tier-systems)
**AIR Console Server**
* `echo -e "AIR_VERSION=v4.3.3" >> /opt/binalyze-air/.env`
**AIR Database Server**
* `echo -e "AIR_VERSION=v4.3.3" >> /opt/binalyze-air-db/.env`
#### Single Tier
Run the following commands on the Application servers before upgrading your systems online by following [air/updating-air/single-tier-systems](../updating/single-tier-systems)\
\&#xNAN;**AIR Console Server**
* `echo -e "AIR_VERSION=v4.3.3" >> /opt/binalyze-air/.env`
In the next upgrade, you should delete this line in /opt/binalyze-air/.env or edit the version number you want.\
You can track the version tags from the link below:\
[https://cr.binalyze.com/harbor/projects/90/repositories/air.console/artifacts-tab?publicAndNotLogged=yes](https://cr.binalyze.com/harbor/projects/90/repositories/air.console/artifacts-tab?publicAndNotLogged=yes)
---
# How do I perform OS upgrades, security patching, or hardware upgrades on the on-prem AIR host?
> Source: https://kb.binalyze.ai/air/self-hosted/faqs/air-host-maintenance.html
**Category:** FAQ → Installation & Maintenance
**Applies to:** On-premises AIR Console and Database nodes
---
## Overview
Customers can safely perform operating system upgrades, security patching, or hardware maintenance on their on-premises AIR environment, provided the system continues to meet the supported platform requirements and all Binalyze Docker containers remain healthy before and after maintenance.
---
## Requirements and Recommendations
### 1. Supported Environment
Your AIR system must always run on one of the officially supported operating systems and Docker versions listed in the *Supported Distributions (x64 only)* section of the [Console Installation Guide](../setup/installation).
Ensure the target OS version is compatible with Docker and remains within Binalyze’s supported list.
### 2. System Continuity
You can safely perform OS, security, or hardware upgrades as long as all Binalyze Docker containers are running and healthy before making changes.
After completing the maintenance, verify that all containers show a *healthy* status by running `docker ps` and confirm that the AIR web interface is accessible.
### 3. Backup Recommendation
Before performing any maintenance, take a full backup or snapshot of the AIR system.
See [Backup by AIR Console UI](../backup/) for detailed steps.
This allows the environment to be quickly restored in case of unexpected issues.
### 4. Customer Responsibility
All on-prem OS and hardware maintenance operations are the customer’s responsibility.
Binalyze Support does not manage, validate, or assist with customer-initiated OS updates, patches, or migrations.
### 5. Post-Upgrade Validation Checklist
After completing OS or hardware maintenance, verify the following:
- Run `docker ps` and confirm all containers show healthy.
- Log in to the AIR Console and verify version, license, and system status.
- Check that all assets are connected and reporting.
- Review **Settings → System Info** for expected configuration values.
---
## Disclaimer
As long as all Binalyze Docker containers are running and healthy before the change, and the environment remains within supported OS and Docker requirements, it is safe to proceed.
Always back up the environment first.
Binalyze cannot be held responsible for issues resulting from unsupported OS, Docker, or hardware configurations.
---
# How do I update Console?
> Source: https://kb.binalyze.ai/air/self-hosted/faqs/how-do-i-update-console.html
You will see a notification on Console whenever a new version is released.
Clicking this notification will download the latest version for you to install manually.
There is no auto-update feature in AIR Console.
Please see this page for details re [Updating the Console.](../updating/)
---
# How to reset the password of a user via the CLI?
> Source: https://kb.binalyze.ai/air/self-hosted/faqs/how-to-reset-the-password-of-a-user-via-the-cli.html
You can reset a user's password via the AIR-CLI. Use this method as a recovery fallback for when no administrator can sign in to the Console, as it assigns a **temporary password** that the user must change at their next sign-in.
When the Console is reachable, reset passwords from **Settings > User Management > Users** instead. That action issues a **single-use reset link** rather than a temporary password, and records the reset in the Console audit log.
[Resetting a User Password](/air/settings/console-settings/user-management/resetting-a-user-password)
To access AIR-CLI and reset the password of a user:
1. Use a terminal emulator, such as PuTTY, to connect to the CLI of the AIR Console Server via SSH.
2. Get the AIR DB URI using the command: (It's only necessary for two-tier installation)
`cat /opt/binalyze-air/volumes/app/binalyze-air/config/.env`
3. Access the app container by executing the following command:
`sudo docker exec -ti binalyze-air_app_1 sh`
4. Navigate to the root directory by executing the following command:
`cd /`
5. Run AIR-CLI by executing the following command:
`./air-cli`
6. Continue by selecting option 2 "reset password for a user" on the AIR-CLI screen.
7. Continue by providing the necessary information
If your system is single-tier, you can leave the values as default. (DB URI and DB name)
If your system is two-tier, you should manually provide the DB URI (on step 2). You can leave the DB name value as default.
8. When you log in with the new password, the system will prompt you to reset it.
---
# Evidence Acquisition Data Flow in AIR
> Source: https://kb.binalyze.ai/air/self-hosted/faqs/evidence-acquisition-data-flow.html
This article explains the end-to-end evidence acquisition data flow in AIR, covering how evidence moves from asset collection through to the Investigation Hub. Understanding this flow helps administrators plan network configurations, storage capacity, and firewall rules for their self-hosted deployments.
## Architecture Overview
The evidence acquisition data flow involves four main components:
| Component | Role |
|-----------|------|
| **AIR Console** | Central management server that creates tasks, coordinates Responders, and hosts the Investigation Hub |
| **Responder** | Lightweight agent installed on assets that executes acquisition tasks and collects evidence |
| **Evidence Repository** | Remote storage destination (SMB, SFTP, FTPS, AWS S3, Azure Blob, or GCS) for collected evidence |
| **DRONE** | Automated analysis engine that processes collected evidence and generates findings |
## Data Flow Stages
### 1. Task Creation
An investigator creates an acquisition task through the AIR Console. The task definition includes:
- **Target assets** — one or more assets with an installed Responder
- **Acquisition profile** — defines which evidence types to collect (e.g., Quick, Full, Compromise Assessment, or a custom profile)
- **Policy** — determines where evidence is stored (local or Evidence Repository), resource limits (CPU, bandwidth, disk), and compression/encryption settings
- **DRONE analysis** — whether to enable automated analysis during or after collection
### 2. Task Distribution
The Console distributes the task to each target asset's Responder:
- **Primary channel (TCP 443):** Responders maintain a persistent connection to the Console on port 443 (or 8443 if configured) and poll for new task assignments.
- **Real-time push (TCP 4222):** For immediate task delivery, the Console pushes task notifications to Responders via NATS on port 4222. This ensures assets receive tasks without waiting for the next polling interval.
- **Relay Server:** In segmented network environments, a Relay Server acts as an intermediary between Responders and the Console, forwarding task assignments and evidence metadata across network boundaries.
:::tip
If an asset is offline when a task is assigned, the Responder automatically receives and executes the task upon its next connection to the Console.
:::
### 3. Evidence Collection
Once the Responder receives the task, it executes the acquisition on the asset:
1. The Responder parses the task details and acquisition profile to determine which evidence types to collect.
2. Evidence is collected from the asset's file system, memory, network state, event logs, applications, and other sources as defined by the profile.
3. Collected data is organized into a directory structure under the **Cases** folder on the asset.
4. **SHA-256 hashes** are generated for all collected files to maintain chain of custody integrity.
5. Evidence is packaged into a compressed archive (.zip) containing a `.ppc` (Protected Package Container) file.
6. If encryption is enabled in the policy, the archive is encrypted with AES-256.
7. An **RFC 3161 timestamp certificate** is obtained from a Trusted Timestamp Authority (TSA) to cryptographically prove the exact time of collection.
### 4. Evidence Transfer
After collection, evidence is transferred according to the storage destination configured in the policy:
#### Option A — Local Storage
Evidence remains on the asset in the Cases folder. The default paths are:
| Platform | Default Path |
|----------|-------------|
| Windows | `C:\Binalyze\AIR\Cases` |
| Linux | `/opt/binalyze/air/Cases` |
| macOS | `/opt/binalyze/air/Cases` |
Investigators can retrieve evidence using interACT or any remote management tool.
#### Option B — Evidence Repository
Evidence is uploaded **directly from the asset to the Evidence Repository**. The upload does not route through the AIR Console. The supported repository types are:
| Repository Type | Default Port |
|----------------|-------------|
| SMB | 445 |
| SFTP | 22 |
| FTPS | 21 |
| AWS S3 | 443 (HTTPS) |
| Azure Blob Storage | 443 (HTTPS) |
| Google Cloud Storage | 443 (HTTPS) |
After a successful upload, evidence is removed from the asset's local storage.
:::caution
Firewall rules must allow direct traffic from each asset to the Evidence Repository on the relevant port. The Console also needs access to the Evidence Repository for features such as File Explorer and Repository Explorer.
:::
#### Option C — Direct Collection
When **Direct Collection** is enabled in the policy, the Responder streams evidence directly to the Evidence Repository during collection, minimizing local disk usage. Approximately 100 MB of temporary data is stored in the Cases folder during the upload process and is automatically deleted upon completion.
### 5. DRONE Analysis
If DRONE is enabled for the task, automated analysis runs against the collected evidence:
- **Responder-side analysis:** DRONE analyzers execute on the asset during or immediately after evidence collection. This includes live-asset analyzers such as the MITRE ATT&CK Analyzer, which scans running processes and filesystem locations.
- **Server-side analysis:** DRONE processors run on the AIR Console against the stored evidence (PPC files). This mode does not require a live connection to the asset and can be triggered at any time after collection, including for imported off-network evidence.
DRONE classifies each finding with a severity level — **High**, **Medium**, **Low**, or **Matched** — based on its analysis pipelines, YARA rules, Sigma rules, and keyword logic.
### 6. Investigation Hub
All collected evidence and DRONE findings are presented in the **Investigation Hub**, which serves as the unified workspace for investigation:
- Parsed evidence is displayed in a structured, human-readable format.
- DRONE findings are prioritized by severity to accelerate triage.
- Hash values for all collected files are available for export.
- RFC 3161 timestamp certificates can be downloaded to verify chain of custody.
- Evidence can be browsed using **File Explorer** (for assets with local storage) or **Repository Explorer** (for Evidence Repositories).
## Network Flow Summary
The following table summarizes the key network communication paths involved in the acquisition data flow:
| Source | Destination | Port | Purpose |
|--------|------------|------|---------|
| Responder | Console | TCP 443 | Task polling, status reporting, metadata |
| Console | Responder | TCP 4222 | Real-time task push (NATS) |
| Responder | Evidence Repository | Varies by type | Direct evidence upload |
| Console | Evidence Repository | Varies by type | File Explorer / Repository Explorer access |
| User | Console | TCP 443 / 8443 | Web UI access, task creation, Investigation Hub |
| Console | TSA Server | TCP 443 | RFC 3161 timestamp requests |
:::note
For complete port configuration details, see [Understanding Port Usage](../../faqs/what-ports-are-used).
:::
## Key Considerations for Self-Hosted Deployments
- **Storage planning:** Estimate storage capacity based on the number of assets, acquisition frequency, and the evidence types collected. Full acquisition profiles generate significantly more data than Quick profiles.
- **Network bandwidth:** Evidence uploads from assets to Evidence Repositories can be bandwidth-intensive, especially during large-scale acquisitions. Use the bandwidth limit setting in Policies to control upload rates.
- **Firewall rules:** Ensure that assets can reach both the Console (TCP 443 and 4222) and the Evidence Repository (on the relevant protocol port). The Console must also access the Evidence Repository for File Explorer functionality.
- **DRONE resource usage:** Server-side DRONE analysis runs on the Console and may increase CPU and memory usage during processing. Plan Console hardware capacity accordingly.
---
# Resolving the "Invalid Host Header. Host must be the Console Address" Error
> Source: https://kb.binalyze.ai/air/self-hosted/faqs/resolving-the-invalid-host-header.-host-must-be-the-console-address-error.html
This FAQ explains why the **"Invalid Host Header"** error occurs, how to resolve it, and how to add multiple console addresses for **AIR**.
***
### **1. What Does the "Invalid Host Header" Error Mean?**
From **AIR Console version 4.33** onward, AIR strictly enforces the **configured Console Address** as a security measure to **prevent unauthorized access**.
:::danger
If you see the error:
> **"Invalid Host Header. Host must be the Console Address",**
This means that AIR is receiving **requests from an unapproved address**. This behavior was introduced to **mitigate Host Header injection vulnerabilities**.
:::
***
### **2. Why Did This Error Appear After Upgrading?**
If you upgraded from **pre-4.33 versions** (e.g., **4.31.x or 4.23.x**) to **4.33 or later**, the new security measures require you to **explicitly whitelist console addresses** (IP addresses or domain names) in the **AIR environment file**.
***
### **3. How Do I Fix This Error?**
To resolve this issue, you need to define the **AIR\_CONSOLE\_ADDRESSES** environment variable in the `.env` file. Follow these steps:
#### **Step 1: Access the AIR Console Server**
Log into the server (via **SSH**) where the AIR Console is hosted.
#### **Step 2: Back Up the Environment File**
Run the following command to create a backup of the `.env` file:
```bash
cp -v /opt/binalyze-air/volumes/app/binalyze-air/config/.env \
/opt/binalyze-air/volumes/app/binalyze-air/config/.env-BACKUP
```
#### **Step 3: Add Additional Console Addresses**
Use the following command to append the new console address:
```bash
echo "AIR_CONSOLE_ADDRESSES=" >> /opt/binalyze-air/volumes/app/binalyze-air/config/.env
```
* Replace **``** with the IP or domain name you want to allow.
* Example:
```bash
AIR_CONSOLE_ADDRESSES=my-air-console.example.com
```
* If multiple addresses are needed, separate them with commas:
```bash
AIR_CONSOLE_ADDRESSES=my-air-console.example.com,10.0.0.50
```
#### **Step 4: Restart the Containers**
After updating the `.env` file, restart the AIR containers:
```bash
cd /opt/binalyze-air
docker compose down && docker compose up -d
```
#### **Step 5: Verify Access**
Once the containers are up, log in using the newly added console addresses. If the error persists:
* Check for **typos** in the `.env` file.
* Ensure **case sensitivity** matches browser behavior (browsers often lowercase domain names).
* Confirm that **DNS/host settings** are correct.
***
### **4. What Should I Use as My Console Address: IP or Domain?**
You can add any valid address, such as:\
**IP Addresses** (e.g., `10.0.0.50`)\
**Fully Qualified Domain Names (FQDNs)** (e.g., `my-air-console.example.com`)
If you plan to **connect using multiple addresses** (e.g., internal IP + domain), add **all of them** to `AIR_CONSOLE_ADDRESSES`.
**Important:** Browsers may **automatically lowercase domain names**, so ensure your entry in `.env` matches how users type it.
***
### **5. Troubleshooting Tips**
#### **Case Sensitivity Issues**
* Some browsers convert uppercase domain names to **lowercase**. Ensure your `.env` file reflects this behavior.
#### **Backup & Revert if Needed**
* If an update causes issues, **restore your backup** and restart the containers.
```bash
cp -v /opt/binalyze-air/volumes/app/binalyze-air/config/.env-BACKUP \
/opt/binalyze-air/volumes/app/binalyze-air/config/.env
docker compose down && docker compose up -d
```
#### **Network & DNS Configuration**
* Ensure **DNS records** and **network settings** reflect your environment.
***
### **6. Reference Articles**
**AIR Console Access Control**
* [**This page in the Binalyze Knowledge Base**](../setup/security/console-access-control) explains the security updates enforcing **approved console addresses** to prevent Host Header injection.
**AIR Release Notes**
* Track news regarding new and enhanced security measures in our [**release notes**](https://www.binalyze.com/air/release-notes/).
***
We hope this FAQ helps you resolve the **"Invalid Host Header"** error and keep your **AIR environment secure**.
For **further troubleshooting**, please contact **support@binalyze.com**
---
# Anything missing?
> Source: https://kb.binalyze.ai/air/self-hosted/faqs/roadmap.html
:::note
**Your ideas are important**
Something missing? Tell us about it by clicking the link below!
[https://binalyze.com/products/air/feedback](https://binalyze.com/products/air/feedback)
:::
---
# Home
> Source: https://kb.binalyze.ai/fleet/home/index.html
## Welcome to Fleet Documentation
Fleet is Binalyze's AI-powered SOC Analyst, purpose-built for cybersecurity professionals. It combines advanced AI capabilities with industry-standard DFIR tooling to assist SOC analysts, incident responders, threat hunters, detection engineers, and forensic investigators in their daily work.
Fleet provides a conversational interface where you can upload evidence, ask questions, and receive structured analysis results. Whether you need to reverse engineer a suspicious binary, generate detection rules from a threat report, or triage an endpoint through AIR, Fleet handles the heavy lifting while you stay in control.
[What is Fleet?](what-is-fleet)
[Terminology](terminology)
[Architecture](architecture/)
[Use Cases](../use-cases/)
[UI Guide](../ui-guide/)
---
# What is Fleet?
> Source: https://kb.binalyze.ai/fleet/home/what-is-fleet.html
## Overview

Fleet is an AI-powered SOC Analyst developed by Binalyze. It is a standalone product designed to accelerate and automate the work of cybersecurity professionals across the full spectrum of security operations.
Fleet is not a chatbot that answers general questions. It is a specialized analyst that runs real tools, produces verifiable outputs, and integrates directly with your AIR deployment. When you ask Fleet to analyze a binary, it performs actual static analysis with industry-standard reverse engineering tools. When you ask it to generate a YARA rule, it writes the rule, validates that it compiles, and can scan files with it. When you ask it to triage an endpoint, it connects to AIR and executes the operation.
## Who Fleet is For
Fleet is built for security professionals who need to move fast without sacrificing depth:
- **SOC Analysts** who triage alerts, investigate incidents, and need rapid context on indicators of compromise
- **Incident Responders** who need to acquire evidence, analyze artifacts, and contain threats across distributed environments
- **Threat Hunters** who proactively search for adversary activity using detection rules, threat intelligence, and endpoint telemetry
- **Detection Engineers** who create, validate, and maintain YARA, Sigma, osquery, and Suricata rules
- **Forensic Investigators** who analyze malware, documents, network captures, event logs, and disk images
## How Fleet Works
Fleet provides a chat-based interface through its own web application. The workflow is straightforward:
1. **Start a conversation** -- open Fleet and start a new session. You can start with a blank prompt or choose from pre-configured quickstart cards.
2. **Provide context** -- describe what you need in natural language. Attach files by dragging and dropping them into the prompt, or use the attachment button. Fleet accepts any file type: executables, documents, archives, network captures, event logs, detection rules, images, and text files.
3. **Fleet analyzes** -- Fleet selects the appropriate tools and techniques for your request, executes the analysis in a secure isolated environment, and streams results back to you in real time. You can see its reasoning process and tool usage as it works.
4. **Review results** -- Fleet delivers structured outputs: IOC tables, detection rules, analysis reports, MITRE ATT&CK mappings, and actionable recommendations. All generated files are saved to your workspace for download.
5. **Iterate** -- ask follow-up questions, request deeper analysis on specific findings, or pivot to a new line of investigation. Fleet maintains context within the session.
Fleet always asks clarifying questions when a request is ambiguous rather than making assumptions that could lead to incorrect results.
## What Fleet Can Do
Fleet's capabilities span the full range of security operations. Each capability is covered in detail in the [Features](../features/) section.
### Detection Engineering
Generate and validate detection rules from natural language descriptions, threat reports, or malware analysis findings:
- **YARA rules** -- create rules for file and memory scanning, validate compilation, scan files, fix broken rules
- **Sigma rules** -- create rules from attack scenarios, validate against the Sigma specification, convert to Splunk SPL and Microsoft Sentinel KQL, test against sample logs
- **osquery queries** -- generate SQL queries for endpoint state inspection, validate syntax and column references
- **Suricata rules** -- validate IDS/IPS rule syntax
### Malware Analysis and Reverse Engineering
Perform deep static analysis on suspicious files:
- **Windows executables (PE)** -- headers, sections, imports, exports, strings, entropy, packer detection, disassembly
- **Linux executables (ELF)** -- structure analysis, symbol extraction, capability identification
- **.NET assemblies** -- decompilation to C# source code, deobfuscation (SmartAssembly and similar), metadata extraction, API hash resolution
- **Shellcode** -- decoding, disassembly, capability classification, XOR key brute-forcing
- **Packed malware** -- packer identification, unpacking, side-by-side comparison of packed vs. unpacked variants
### Document Analysis
Investigate documents for embedded threats:
- **Office documents** (Word, Excel, PowerPoint) -- VBA macro extraction and deobfuscation, embedded OLE objects, ActiveX controls, DDE fields, external template injection
- **PDF files** -- JavaScript extraction, embedded file detection, URL extraction, metadata analysis
- **RTF and CAB files** -- embedded payload detection, exploit analysis
### Network Forensics
Analyze network captures for malicious activity:
- **PCAP analysis** -- protocol breakdown, DNS query extraction, HTTP/TLS inspection, connection statistics
- **C2 detection** -- beacon pattern identification, unusual port usage, high-entropy data transfers
- **Exfiltration indicators** -- data staging detection, unusual outbound connections, DNS tunneling
### Threat Intelligence
Extract, enrich, and operationalize threat intelligence:
- **Observable extraction** -- extract IOCs (IPs, domains, URLs, hashes, emails, mutexes, registry keys, file paths) from URLs, documents, text, and files
- **Enrichment and scoring** -- automatic reputation checking, risk scoring with confidence levels, domain popularity analysis, known-good software identification
- **STIX 2.1** -- generate structured threat intelligence bundles
- **Web research** -- search for the latest threat advisories, CVE details, and security research
- **Report processing** -- locate, download, and convert vendor advisories and APT reports into actionable intelligence packages
### AIR Operations
Interact with your AIR deployment directly from Fleet:
- **Endpoint management** -- list, search, isolate, tag, and reboot managed endpoints
- **Case management** -- create, update, and close investigation cases
- **Evidence acquisition** -- trigger forensic evidence collection using built-in or custom acquisition profiles
- **Triage** -- deploy YARA, Sigma, and osquery rules to endpoints
- **interACT** -- execute remote commands on managed endpoints, transfer files
- **Investigation** -- browse collected evidence and DRONE findings
### Browser Automation
Control a remote browser for web-based research and evidence collection:
- Navigate to URLs, interact with page elements, take screenshots, download files
- Record browsing sessions for audit trails
- Safely interact with suspicious web content in an isolated environment
### Workspace and Terminal
A full working environment for hands-on analysis:
- **Workspace** -- persistent file storage for uploads, analysis outputs, and generated reports with a browsable file tree
- **Terminal** -- interactive shell sessions with a full Linux environment and standard utilities
## What Fleet Cannot Do
- Fleet does not have direct access to production systems, internal networks, or user endpoints. It operates in an isolated environment and can only interact with AIR through the authenticated API integration.
- Fleet works only with evidence and files you provide. It cannot independently scan your network or pull data from systems you have not connected.
- Fleet requires an internet connection and is available only in online mode.
- Context is scoped to the current session. Fleet does not retain memory across separate conversations.
## Requirements
| Requirement | Details |
|---|---|
| AIR Version | 4.41 or later (for AIR integration) |
| Internet Connectivity | Required |
| Licensing | Fleet license required |
## Getting Started
Fleet is a standalone web application. Log in at your organization's Fleet URL with your credentials. No additional software installation is required. To connect Fleet to your AIR deployment, configure the API integration in Fleet's settings.
---
# Terminology
> Source: https://kb.binalyze.ai/fleet/home/terminology.html
## Defender
How Fleet addresses you, the user. In every interaction, Fleet refers to the person it is assisting as "Defender," reflecting its role as a SOC Analyst working alongside security professionals.
## Skill
A specialized capability that Fleet can invoke to perform a specific type of analysis or operation. Each skill represents a distinct area of expertise, such as YARA rule generation, malware reverse engineering, network forensics, or AIR endpoint management. Skills are self-contained: Fleet automatically selects and loads the appropriate skill based on your request. You do not need to manually specify which skill to use.
See [Skills](../features/skills/) for the complete list of available skills.
## Recipe
A pre-built, multi-step workflow that chains multiple skills together to accomplish a common task from start to finish. Recipes encode proven methodologies for tasks like "triage a PE binary," "process an APT threat report," or "acquire evidence from an endpoint." When your request matches a known recipe, Fleet follows the established workflow automatically, ensuring consistent and thorough results.
See [Recipes](../features/recipes/) for the complete list of available recipes.
## Quickstart
A pre-configured prompt card displayed on the new chat screen. Each quickstart provides a ready-to-use prompt (and often a sample file) that demonstrates a specific Fleet capability. Quickstarts are designed to help new users explore what Fleet can do and to provide experienced users with one-click access to common workflows.
See [Quickstarts](../features/quickstarts/) for the complete list of available quickstarts.
## Session
A single conversation thread with Fleet. Each session maintains its own context: the messages exchanged, files uploaded, analysis results produced, and workspace state. Context is scoped to the session and does not carry over to other sessions.
## Workspace
The file storage area associated with your Fleet session. All files you upload, analysis outputs Fleet generates, and reports it writes are saved to the workspace. The workspace is organized by date folders and is accessible through the file tree in the sidebar. You can browse, download, copy, move, and delete files from the workspace.
See [Workspace & Terminal](../features/workspace/) for details.
## Terminal
An interactive shell session inside Fleet's secure environment. The terminal provides a full Linux command-line interface where you can run commands directly, inspect files, and perform manual analysis alongside Fleet's automated workflows. Multiple terminal tabs can be open simultaneously.
See [Workspace & Terminal](../features/workspace/) for details.
## Attachment
A file uploaded to Fleet for analysis. You can attach files by dragging and dropping them into the prompt input area, using the attachment button, or selecting a sample file from a quickstart card. Fleet accepts any file type, including executables, documents, archives, network captures, event logs, detection rules, images, and text files.
## Observable
An indicator of compromise (IOC) extracted from evidence during analysis. Observables include IP addresses, domain names, URLs, file hashes (MD5, SHA1, SHA256), email addresses, mutexes, registry keys, and file paths. Fleet extracts observables automatically during threat intelligence workflows and can enrich them with reputation data and risk scores.
## Enrichment
The process of augmenting extracted observables with additional context from reputation databases and threat intelligence sources. During enrichment, Fleet checks each observable against multiple data sources to determine whether it is known-malicious, suspicious, or benign. The result is a risk score with a confidence level for each observable.
## STIX
Structured Threat Information Expression (STIX) is a standardized language and format for representing and sharing cyber threat intelligence. Fleet can generate STIX 2.1 bundles from extracted observables, producing machine-readable threat intelligence packages that can be imported into SIEM platforms, threat intelligence platforms (TIPs), and other security tools.
## MITRE ATT&CK
The MITRE ATT&CK framework is a globally recognized knowledge base of adversary tactics, techniques, and procedures (TTPs) based on real-world observations. Fleet maps its analysis findings to ATT&CK techniques and tactics, providing standardized context that helps analysts understand the nature of threats, assess coverage gaps, and prioritize defensive actions.
## DRONE
AIR's suite of integrated analyzers that automatically assess collected evidence. DRONE findings are surfaced in the AIR Investigation Hub. When Fleet is connected to AIR, it can browse and analyze DRONE results as part of investigation workflows.
## Investigation Hub
The centralized dashboard in AIR that consolidates acquisition data, DRONE findings, and triage results from multiple assets into a single view. Fleet can access Investigation Hub data when connected to AIR, enabling AI-assisted analysis of consolidated investigation results.
## interACT
AIR's remote command execution feature that allows running shell commands on managed endpoints. Fleet can initiate interACT sessions, execute commands, and transfer files to and from endpoints when connected to AIR.
## Acquisition Profile
A collection of evidence types grouped into a reusable set for forensic evidence collection in AIR. Fleet can trigger evidence acquisition using built-in or custom acquisition profiles when connected to AIR.
## Triage
The process of deploying detection rules (YARA, Sigma, osquery) to AIR endpoints for rapid scanning and threat hunting. Fleet can create triage rules, deploy them to endpoints, and review the results.
---
# Architecture
> Source: https://kb.binalyze.ai/fleet/home/architecture/index.html
## Overview
Fleet is designed around three core architectural principles: **isolation**, **security**, and **integration**. Every analysis Fleet performs runs in a secure, isolated environment that is completely separate from your AIR deployment, your network, and your endpoints. This ensures that evidence analysis cannot affect production systems, and that sensitive data remains protected throughout the process.
## How Fleet Processes Requests
When you send a request to Fleet, the following sequence occurs:
1. **Request routing** -- your message and any attached files are sent from Fleet's web interface to the secure analysis environment through an encrypted channel.
2. **Analysis execution** -- Fleet selects the appropriate tools and techniques, then performs the analysis entirely within its isolated environment. This environment includes a full suite of industry-standard DFIR tools for forensics, reverse engineering, detection engineering, and threat intelligence.
3. **Result streaming** -- as Fleet works, results stream back to your browser in real time. You can observe Fleet's reasoning process, see tool outputs, and review findings as they are produced.
4. **Output persistence** -- all generated files (reports, detection rules, IOC tables, STIX bundles) are saved to your workspace for download and further use.
## Isolation Model
Fleet's analysis environment is fully isolated:
- **No direct network access** -- Fleet cannot reach your internal network, production systems, or endpoints. It operates exclusively within its own secure boundary.
- **AIR API access only** -- when you configure AIR integration, Fleet communicates with your AIR deployment through authenticated, encrypted API channels. This is the only path through which Fleet can interact with your infrastructure.
- **Ephemeral sessions** -- each Fleet session runs in its own environment. Session data does not persist after the session ends, and no customer data is retained between sessions.
- **Separate from AIR** -- Fleet's analysis environment is architecturally separate from your AIR deployment. A compromise of the analysis environment cannot affect AIR, and vice versa.
## Credential Protection
Fleet implements a strict credential separation model:
- **Encrypted credential storage** -- API keys and credentials you configure for AIR integration are encrypted at rest and in transit. They are never exposed to the AI agent in plaintext.
- **Secure gateway** -- all external API calls (threat intelligence lookups, web searches, AIR operations) are routed through a secure gateway that handles authentication independently. The AI agent sends requests through the gateway, which attaches the appropriate credentials on the other side. This means the AI never sees, handles, or has access to your actual API keys.
- **No credential leakage** -- even if the AI agent were to attempt to extract credentials (which it is designed not to do), the architecture prevents it. Credentials exist only within the secure gateway layer, outside the AI's execution boundary.
## External Service Access
Fleet can access external services for threat intelligence enrichment and web research. All external access is mediated:
- **Threat intelligence** -- reputation lookups, domain popularity checks, known-good software identification, and vulnerability databases are accessed through the secure gateway.
- **Web search** -- Fleet can search the internet for threat advisories, CVE details, and security research. All web requests route through the secure gateway.
- **Browser automation** -- Fleet can control a remote browser for interacting with web content. The browser runs in its own isolated environment, separate from both Fleet's analysis environment and your network.
## AIR Integration
Fleet connects to AIR through a secure, authenticated API:
- **Authentication** -- Fleet uses its own authentication system. Users log in with their organization credentials.
- **API integration** -- to enable Fleet to perform operations on your AIR deployment (endpoint management, evidence acquisition, triage, interACT), you configure an API key in Fleet's settings. This key is encrypted and handled exclusively by the secure gateway.
- **Supported operations** -- endpoint listing and search, asset isolation, case management, evidence acquisition, triage rule deployment, interACT command execution, and investigation result browsing.
## AI Model
Fleet uses advanced large language models to power its conversational interface and analytical reasoning. The specific model may be updated over time to provide the best results. All AI communication is routed through Binalyze-managed secure endpoints. No customer data is sent to third-party AI providers outside of the secure processing pipeline.
## Availability
Fleet requires an active internet connection and is available only in online mode. It is included in the AIR subscription for licensed environments running version 4.41 or later.
---
# Use Cases
> Source: https://kb.binalyze.ai/fleet/use-cases/index.html
## Overview
Fleet serves different security roles with different priorities. This section provides end-to-end workflows tailored to each persona, showing how Fleet fits into real operational scenarios rather than listing features in isolation.
Each use case walks through a realistic scenario from start to finish, demonstrating which Fleet capabilities come into play and in what order.
[SOC Analyst](soc-analyst)
[Incident Responder](incident-responder)
[Threat Hunter](threat-hunter)
---
# SOC Analyst
> Source: https://kb.binalyze.ai/fleet/use-cases/soc-analyst.html
## Role Overview
SOC analysts are the first line of defense. They triage alerts, investigate indicators, escalate incidents, and document findings under constant time pressure. Fleet accelerates every stage of this workflow by handling the repetitive, tool-intensive work while the analyst stays in control of decisions.
## Workflow: Phishing Email Triage
A phishing alert arrives from the email gateway. The analyst needs to determine whether the email is malicious, extract indicators, and decide whether to escalate.
### Step 1: Extract and Enrich Observables

Open Fleet and paste the suspicious URL or upload the email attachment. Ask Fleet to extract and enrich all observables.
```text
Extract and assess all observables from this URL: https://example.com/suspicious-page
```
Fleet fetches the page content, extracts all indicators (IPs, domains, URLs, hashes, email addresses), checks each against reputation databases, scores risk with confidence levels, and filters out known-good domains using popularity data.
**Result:** A scored IOC table organized by type, with high-risk indicators flagged.
### Step 2: Analyze the Attachment
If the email contains a document attachment, upload it directly.
```text
Analyze this macro-enabled Word document for malicious content.
```
Fleet extracts and deobfuscates VBA macros, identifies auto-execution triggers, detects embedded objects and external template references, and traces the full execution chain.
**Result:** Deobfuscated macro code, execution chain, extracted IOCs, MITRE ATT&CK mapping, and a verdict with confidence level.
### Step 3: Generate Detection Rules
Based on the findings, ask Fleet to create detection rules to catch similar attacks across the organization.
```text
Generate a Sigma rule to detect the PowerShell download cradle found in this macro, and a YARA rule for the document itself.
```
Fleet generates both rules, validates them (Sigma against the specification, YARA compilation), and converts the Sigma rule to Splunk SPL and Microsoft Sentinel KQL.
**Result:** Validated detection rules ready for deployment.
### Step 4: Deploy via AIR
If connected to AIR, deploy the rules immediately.
```text
Deploy this YARA rule to all Windows endpoints tagged "email-gateway-users".
```
Fleet sends the triage task through AIR and monitors deployment progress.
**Result:** Detection rules active across targeted endpoints.
### Step 5: Document and Escalate
Ask Fleet to produce a summary for the incident ticket.
```text
Summarize the findings from this session as an incident report suitable for escalation.
```
**Result:** A structured report with timeline, indicators, analysis results, detection rules deployed, and recommended next steps.
## Workflow: Bulk IOC Assessment
The threat intelligence team shares a list of indicators from a new advisory. The analyst needs to assess which ones are relevant to the environment.
### Step 1: Ingest and Enrich
Upload the advisory or paste the IOC list.
```text
Extract all observables from this threat advisory PDF, enrich them, and produce a STIX 2.1 bundle.
```
Fleet extracts every observable, enriches each with reputation data, filters out known-good software hashes (NSRL) and popular domains, scores risk, and produces output in multiple formats.
**Result:** Markdown report for human review, STIX 2.1 bundle for SIEM import, and optionally YARA rules generated from the enriched indicators.
### Step 2: Cross-Reference with Endpoints
If connected to AIR, check whether any indicators are present in the environment.
```text
Search for endpoints that have communicated with any of the high-risk domains from the previous analysis.
```
Fleet queries AIR endpoints and correlates findings with the enriched IOC list.
### Step 3: Generate and Deploy Rules
```text
Generate Sigma rules for the top 5 highest-risk indicators and deploy them to all managed endpoints.
```
Fleet creates, validates, converts, and deploys the rules in a single workflow.
## Workflow: Suspicious Process Alert
An EDR alert fires for an unusual process on a workstation. The analyst needs to determine whether it is malicious.
### Step 1: Acquire the Binary
```text
Download the file C:\Users\jdoe\AppData\Local\Temp\svchost.exe from WORKSTATION-042 for analysis.
```
Fleet retrieves the file from the endpoint via AIR's interACT feature.
### Step 2: Analyze
```text
Perform full static analysis on this binary. Focus on persistence mechanisms, network indicators, and process injection techniques.
```
Fleet runs PE analysis, string extraction, import analysis, entropy measurement, packer detection, capability identification, and MITRE ATT&CK mapping.
**Result:** Capability summary, IOC table, risk level, and technique mapping.
### Step 3: Contain
If the binary is malicious, contain the endpoint immediately.
```text
Isolate WORKSTATION-042 from the network.
```
Fleet isolates the endpoint through AIR while maintaining management communication.
### Step 4: Sweep the Organization
```text
Generate a YARA rule from the IOCs found in this binary and deploy it to all Windows endpoints.
```
Fleet creates the rule from the analysis findings, validates it, and deploys it organization-wide through AIR triage.
## Shift Handoff
At the end of a shift, the analyst needs to hand off open investigations to the next team.
Fleet sessions contain the full conversation history, tool outputs, and generated files. The analyst can:
1. **Export session files** from the workspace -- all reports, detection rules, STIX bundles, and analysis outputs are available for download.
2. **Reference the session** -- share the session with the next analyst so they can review the full investigation context.
3. **Produce a handoff summary** -- ask Fleet to summarize all findings and open items from the session.
```text
Summarize everything we have done in this session. List findings, actions taken, detection rules deployed, and any open items that need follow-up.
```
**Result:** A structured handoff document ready for the next shift.
---
# Incident Responder
> Source: https://kb.binalyze.ai/fleet/use-cases/incident-responder.html
## Role Overview
Incident responders coordinate the full lifecycle of a security incident: detection, containment, evidence collection, analysis, eradication, and recovery. Fleet compresses the time between each phase by handling tool-intensive analysis and AIR operations through a single conversational interface.
## Workflow: Ransomware Response
A ransomware infection is detected on a workstation. The responder needs to contain the threat, collect evidence, analyze the sample, and deploy organization-wide detection.
### Step 1: Contain the Affected Endpoint
```text
Isolate WORKSTATION-042 from the network immediately.
```
Fleet isolates the endpoint through AIR, cutting network access while preserving management communication for continued investigation.
### Step 2: Assess the Endpoint
```text
Run an endpoint triage on WORKSTATION-042. Check for running processes, network connections, scheduled tasks, and recently modified files.
```
Fleet connects to the endpoint via AIR interACT, executes the assessment commands, and returns a structured security posture report.
**Result:** Prioritized findings with suspicious processes, persistence mechanisms, and network connections flagged.
### Step 3: Acquire Evidence
```text
Trigger a full evidence acquisition on WORKSTATION-042 using the default acquisition profile.
```
Fleet initiates forensic evidence collection through AIR, monitors task progress, and notifies when collection is complete.
### Step 4: Retrieve and Analyze the Ransomware Sample
```text
Download the file C:\Users\jdoe\Desktop\README_DECRYPT.txt and C:\ProgramData\svchost.exe from WORKSTATION-042.
```
Fleet retrieves the files via interACT. Then analyze the sample:
```text
Perform ransomware triage on this binary. Assess the encryption scheme and evaluate decryption feasibility.
```
Fleet identifies cryptographic imports and constants, analyzes the key management scheme, determines whether keys are local or server-side, rates decryption feasibility, and produces an IR decision matrix (decrypt vs. restore vs. negotiate).
**Result:** Crypto scheme analysis, decryption feasibility rating, detection rules, and recommended response path.
### Step 5: Generate and Deploy Detection Rules
```text
Generate a YARA rule for this ransomware binary and a Sigma rule for the process creation pattern. Deploy both to all Windows endpoints.
```
Fleet creates both rules from the analysis findings, validates them, and deploys through AIR triage to detect the threat across the environment.
### Step 6: Check for Lateral Movement
```text
Search for all endpoints that have communicated with the C2 IP addresses found in the ransomware analysis.
```
Fleet queries AIR endpoints and identifies any additional compromised machines.
If more endpoints are found:
```text
Isolate all endpoints that communicated with those C2 addresses.
```
### Step 7: Document the Incident
```text
Produce a full incident response report covering: timeline of events, affected endpoints, malware analysis summary, containment actions taken, detection rules deployed, and recommended recovery steps.
```
**Result:** A structured IR report ready for management and compliance review.
## Workflow: Supply Chain Compromise
A vendor update package is suspected of containing a backdoor. The responder needs to analyze the package and determine the blast radius.
### Step 1: Analyze the Suspicious Package
Upload the vendor update file to Fleet.
```text
Perform full static analysis on this binary. Focus on network indicators, backdoor functionality, and any code that does not match expected vendor behavior.
```
Fleet runs comprehensive PE analysis, identifies suspicious capabilities (C2 communication, data exfiltration, persistence), and maps techniques to MITRE ATT&CK.
### Step 2: Extract and Enrich IOCs
```text
Extract all network indicators from this binary and enrich them. Check domains and IPs against reputation databases.
```
Fleet extracts all embedded IPs, domains, URLs, and hashes, enriches each with reputation data, and produces a scored IOC table.
### Step 3: Determine Blast Radius
```text
Search for all endpoints where this file hash is present. Also check for endpoints that have communicated with the C2 domains found in the analysis.
```
Fleet queries AIR to identify every affected endpoint.
### Step 4: Contain and Remediate
```text
Isolate all affected endpoints. Then generate detection rules for both the binary and its network indicators.
```
Fleet isolates the endpoints, generates YARA and Sigma rules, and deploys them organization-wide.
### Step 5: Produce the Investigation Package
```text
Create a complete investigation package: STIX 2.1 bundle with all IOCs, detection rules, ATT&CK mapping, affected endpoint list, and executive summary.
```
**Result:** A complete, distributable intelligence package for internal teams and external reporting.
## Workflow: Insider Threat Investigation
Suspicious data access patterns are detected for an employee account. The responder needs to investigate without alerting the subject.
### Step 1: Review Endpoint Activity
```text
List all recent activity on WORKSTATION-077 including process creation, file modifications, and network connections from the last 48 hours.
```
Fleet retrieves the data through AIR and presents a timeline of activity.
### Step 2: Analyze Collected Evidence
If evidence has already been acquired, upload the relevant artifacts.
```text
Analyze these Windows Event Logs. Focus on authentication events, file access patterns, USB device connections, and any data staging activity.
```
Fleet parses the EVTX files, extracts security-relevant events, identifies suspicious patterns (bulk file access, USB connections, data staging in temporary directories), and produces a timeline.
### Step 3: Check for Data Exfiltration
Upload any network captures from the monitoring period.
```text
Analyze this PCAP for data exfiltration indicators. Look for large outbound transfers, DNS tunneling, cloud storage uploads, and encrypted connections to unusual destinations.
```
Fleet performs protocol analysis, identifies exfiltration patterns, and quantifies the data volume involved.
### Step 4: Document for Legal and HR
```text
Produce a forensic investigation report suitable for legal review. Include: timeline of suspicious activity, evidence of data access, exfiltration indicators, and chain of custody notes for all analyzed artifacts.
```
**Result:** A legally defensible investigation report with timestamped evidence and clear methodology documentation.
## Cross-Incident Patterns
Regardless of the incident type, Fleet supports several patterns that recur across all IR workflows:
| Pattern | How Fleet Helps |
|---|---|
| Rapid containment | Isolate endpoints through AIR in seconds, directly from the conversation |
| Evidence preservation | Trigger forensic acquisition through AIR before remediation begins |
| Artifact analysis | Upload and analyze any artifact type without switching tools |
| Detection deployment | Generate rules from findings and deploy organization-wide in the same session |
| Blast radius assessment | Query AIR endpoints for IOCs found during analysis |
| Case documentation | Produce structured reports at any point in the investigation |
| Intelligence sharing | Export STIX 2.1 bundles for distribution to partner organizations or ISACs |
---
# Threat Hunter
> Source: https://kb.binalyze.ai/fleet/use-cases/threat-hunter.html
## Role Overview
Threat hunters proactively search for adversary activity that evades automated detection. They form hypotheses based on intelligence, craft detection logic, sweep the environment, and refine rules based on results. Fleet accelerates every stage of this cycle by handling the research, rule generation, validation, and deployment while the hunter focuses on strategy.
## Workflow: Hypothesis-Driven Hunt
The hunter suspects an APT group is targeting the organization based on a recent industry advisory. They need to research the threat, build detection, and sweep the environment.
### Step 1: Research the Threat
```text
Search for the latest advisories and technical reports on APT41 activity targeting the financial sector. Summarize TTPs, known infrastructure, and recommended detection approaches.
```
Fleet searches the web for current intelligence, retrieves relevant reports, and produces a consolidated briefing.
**Result:** Summary of APT41 TTPs, known IOCs, infrastructure patterns, and detection recommendations from multiple sources.
### Step 2: Process a Threat Report
Upload a detailed threat report for deeper analysis.
```text
Process this APT41 report into a full intelligence package. Extract all observables, enrich them, map TTPs to MITRE ATT&CK, and generate detection rules for each attack stage.
```
Fleet extracts every observable, enriches with reputation data, maps techniques to ATT&CK, and generates Sigma rules per attack stage plus YARA rules for known file indicators.
**Result:** Enriched IOC table, ATT&CK mapping, Sigma rules (with Splunk SPL and Sentinel KQL conversions), YARA rules, and STIX 2.1 bundle.
### Step 3: Validate Detection Rules
Before deployment, test the rules against sample data.
```text
Test these Sigma rules against the attached Windows event logs. Show which rules trigger and on which events.
```
Fleet runs the rules against the provided EVTX or JSONL logs and reports matches, false positives, and coverage gaps.
### Step 4: Deploy and Sweep
```text
Deploy all validated YARA and Sigma rules to all managed endpoints. Also deploy the osquery queries to check for the persistence mechanisms described in the report.
```
Fleet deploys through AIR triage and monitors results.
### Step 5: Analyze Results
```text
Show me the triage results. Which endpoints had matches? Summarize the findings by rule and endpoint.
```
Fleet retrieves and summarizes the scan results, highlighting confirmed detections and recommending next steps for each finding.
## Workflow: Proactive Endpoint Sweep
The hunter wants to check the environment for living-off-the-land techniques without a specific threat report as input.
### Step 1: Generate Detection Queries
```text
Generate osquery queries to detect the following across all endpoints:
1. Scheduled tasks created in the last 7 days
2. Services with unusual binary paths (temp directories, user profiles)
3. PowerShell execution policy overrides
4. WMI event subscriptions
5. Startup folder modifications
```
Fleet generates five validated osquery queries, each targeting a specific persistence or execution technique.
### Step 2: Deploy the Queries
```text
Deploy all five queries to all Windows endpoints.
```
Fleet deploys through AIR triage.
### Step 3: Review and Triage Results
```text
Show the triage results for all five queries. Flag any findings that look suspicious and explain why.
```
Fleet retrieves results, filters noise (known-good scheduled tasks, legitimate services), and highlights anomalies with context.
### Step 4: Deep-Dive on Findings
For any suspicious finding, pivot into deeper analysis.
```text
Download the binary at C:\Users\admin\AppData\Local\Temp\updater.exe from WORKSTATION-119 and perform full static analysis.
```
Fleet retrieves the file via interACT and runs comprehensive analysis.
### Step 5: Build Targeted Detection
```text
Based on this analysis, generate a YARA rule for the binary and a Sigma rule for the process creation pattern. Deploy both to all endpoints.
```
The hunt cycle closes with new detection rules deployed from the findings.
## Workflow: Intelligence Operationalization
The hunter receives a batch of IOCs from an ISAC or partner organization and needs to operationalize them.
### Step 1: Ingest and Enrich
Upload the IOC list or advisory document.
```text
Extract all observables from this ISAC advisory. Enrich them and produce a scored report. Filter out known-good hashes and popular domains.
```
Fleet processes the input, enriches every indicator, applies NSRL and domain popularity filtering, and produces a prioritized list.
**Result:** Scored IOC table with high-confidence malicious indicators separated from noise.
### Step 2: Generate Multi-Format Detection
```text
For the top 10 highest-risk indicators, generate:
- YARA rules for file-based indicators
- Sigma rules for network and process indicators
- osquery queries for persistence indicators
```
Fleet generates all three rule types, validates each, and converts Sigma rules to SIEM query languages.
### Step 3: Deploy Across the Environment
```text
Deploy all generated rules to all managed endpoints.
```
### Step 4: Produce the Intelligence Package
```text
Export the full intelligence package: STIX 2.1 bundle with all enriched IOCs, all detection rules, ATT&CK mapping, and a summary suitable for sharing with the SOC team.
```
**Result:** A complete, distributable package that the SOC team can use for ongoing monitoring.
## Workflow: Detection Rule Maintenance
The hunter maintains a library of custom detection rules and needs to update them based on new intelligence.
### Step 1: Validate Existing Rules
Upload the current rule set.
```text
Validate these 15 YARA rules. Identify any that have syntax errors, and suggest improvements for rules that are too broad or too narrow.
```
Fleet validates each rule, reports errors, and provides specific improvement suggestions.
### Step 2: Update Rules from New Intelligence
```text
Update the YARA rule "APT41_Loader" to also detect the new variant described in this report. Keep the existing detection logic and add patterns for the new variant.
```
Fleet modifies the rule, validates compilation, and tests against any provided samples.
### Step 3: Convert Detection Formats
```text
Convert these 5 Sigma rules to Splunk SPL and Microsoft Sentinel KQL. Verify that the conversions preserve the original detection logic.
```
Fleet converts each rule and highlights any detection features that do not have direct equivalents in the target query language.
## Hunt Cycle Summary
| Phase | Fleet Capability |
|---|---|
| Research | Web search, report finder, threat intelligence enrichment |
| Hypothesis | ATT&CK mapping, observable extraction, intelligence processing |
| Detection | YARA, Sigma, osquery generation with validation and conversion |
| Deployment | AIR triage rule deployment to targeted or all endpoints |
| Analysis | Triage result retrieval, artifact analysis, endpoint assessment |
| Refinement | Rule validation, improvement suggestions, format conversion |
| Documentation | STIX 2.1 export, structured reports, intelligence packages |
---
# Features
> Source: https://kb.binalyze.ai/fleet/features/index.html
[Skills](skills/)
[Recipes](recipes/)
[Quickstarts](quickstarts/)
[AIR Integration](air-integration/)
[Browser Automation](browser/)
[Workspace & Terminal](workspace/)
[Detection Engineering](detection-engineering/)
[Forensic Analysis](forensics/)
[Threat Intelligence](threat-intelligence/)
---
# Skills
> Source: https://kb.binalyze.ai/fleet/features/skills/index.html
## Overview
Skills are Fleet's specialized capabilities. Each skill represents a distinct area of expertise that Fleet can invoke to perform a specific type of analysis or operation. When you make a request, Fleet automatically identifies and loads the appropriate skill based on what you need. You do not need to manually select or reference skills.
Skills are self-contained. Each one encapsulates the tools, techniques, and methodology required for its domain. Fleet loads only the skills relevant to your current task, keeping analysis focused and efficient.
## Threat Intelligence Skills
### Observable Extraction and Enrichment
Extract indicators of compromise (IOCs) from any source and enrich them with threat intelligence context.
**Inputs:** URLs, documents, text, files, or threat reports.
**What it extracts:** IP addresses, domain names, URLs, file hashes (MD5, SHA1, SHA256), email addresses, mutexes, registry keys, and file paths.
**Enrichment process:** each extracted observable is checked against multiple reputation databases and threat intelligence sources. Results include a risk score with confidence level for each indicator. Domain popularity is assessed against the Alexa Top 1M list to distinguish benign infrastructure from suspicious domains. File hashes are checked against the National Software Reference Library (NSRL) to identify known-good software.
**Output formats:**
- Markdown report with observables organized by type, enrichment results, and risk scores
- Text report sorted by risk score for quick triage
- STIX 2.1 bundle with full enrichment data for machine consumption
- YARA rules generated directly from enriched observables
**Example prompt:**
```text
Extract and assess all observables from this URL: https://example.com/threat-report
```
### Web Search
Search the internet for the latest threat intelligence, security advisories, CVE details, and research publications.
**Use cases:** researching a specific threat actor, finding the latest advisories for a CVE, locating technical write-ups on a malware family, checking if a technique has been observed in the wild.
**Example prompt:**
```text
Search for the latest APT29 advisories from CISA and Mandiant.
```
### Report Finder
Locate, download, and convert security reports into a readable format for analysis.
**Use cases:** finding vendor threat reports, APT campaign analyses, CVE advisories, and incident write-ups. Reports are downloaded and converted to markdown for easy reading and further processing.
**Example prompt:**
```text
Find and download the latest Mandiant report on APT29 techniques.
```
### Alexa Domain Lookup
Check domains against the Alexa Top 1M popularity list to distinguish benign, well-known domains from potentially suspicious ones.
**Use cases:** filtering noise from observable extraction results, validating whether a domain is a legitimate popular service or an unknown/suspicious domain.
### NSRL Hash Lookup
Check file hashes against the National Software Reference Library (NSRL) to identify known-good software.
**Use cases:** filtering false positives during malware triage by identifying files that match known legitimate software distributions.
## Detection Engineering Skills
### YARA Rule Generation
Create YARA rules from natural language descriptions, malware analysis findings, or threat intelligence.
**Inputs:** natural language description of what to detect, malware samples for signature extraction, threat report with IOCs.
**Process:** Fleet generates the rule, validates that it compiles successfully, and can optionally scan files to test for matches. If the rule has errors, Fleet identifies and fixes them.
**Example prompts:**
```text
Create a YARA rule to detect in-memory execution of Mimikatz.
```
```text
Generate a YARA rule based on the strings and imports found in the attached binary.
```
### Sigma Rule Generation
Create Sigma detection rules from attack scenarios, threat descriptions, or log analysis.
**Inputs:** attack scenario description, MITRE ATT&CK technique references, sample log entries, threat intelligence.
**Process:** Fleet generates the Sigma rule with proper metadata (title, description, logsource, detection logic), validates it against the Sigma specification, and can convert it to Splunk SPL and Microsoft Sentinel KQL. Fleet can also test rules against sample EVTX or JSONL log files to verify they trigger correctly.
**Example prompts:**
```text
Create a Sigma rule to detect encoded PowerShell execution via Event ID 4688.
```
```text
Build Sigma rules for each stage of this attack scenario: spearphishing -> PowerShell -> process hollowing -> scheduled task persistence -> HTTPS exfiltration.
```
### osquery Query Generation
Create osquery SQL queries from natural language descriptions for endpoint state inspection.
**Inputs:** natural language description of what to query.
**Process:** Fleet generates the SQL query, validates syntax and column references against the osquery schema, and provides the ready-to-use query.
**Example prompt:**
```text
Write an osquery rule that lists all USB devices connected in the last 24 hours.
```
### Detection Validation
Validate and convert detection rules across formats.
**Capabilities:**
- **YARA** -- validate compilation, scan files, fix syntax errors
- **Sigma** -- validate against specification, convert to Splunk SPL and Microsoft Sentinel KQL, test against EVTX and JSONL logs
- **osquery** -- validate SQL syntax and column references
- **Suricata** -- validate IDS/IPS rule syntax
## Forensic Analysis Skills
### Malware Reverse Engineering
Perform deep static analysis on executable files.
**Supported formats:** PE (Windows), ELF (Linux), .NET assemblies, raw shellcode.
**Analysis capabilities:**
- PE/ELF headers, sections, imports, exports, and resources
- String extraction and classification (URLs, IPs, registry keys, file paths, encoded data)
- Entropy analysis and packer detection (UPX, Themida, ASPack, and others)
- Disassembly and decompilation
- .NET deobfuscation (SmartAssembly and similar protectors) with full C# decompilation
- API hash resolution for malware using dynamic API loading
- Capability identification: persistence mechanisms, C2 communication, process injection, privilege escalation, credential theft
- MITRE ATT&CK technique mapping
**Example prompt:**
```text
Perform static analysis on the attached PE binary. Deliver: capability summary, IOC table, risk level, and MITRE ATT&CK mapping.
```
### Document Analysis
Analyze documents for embedded threats, malicious macros, and hidden payloads.
**Supported formats:** PDF, Microsoft Office (Word, Excel, PowerPoint, including macro-enabled variants), OLE, RTF, CAB.
**Analysis capabilities:**
- VBA macro extraction and deobfuscation (Base64, string concatenation, character code chains)
- Auto-execution trigger identification (AutoOpen, Document_Open, Document_Close)
- Embedded OLE object and ActiveX control detection
- External template injection analysis (T1221)
- DDE field inspection
- JavaScript extraction from PDFs
- Metadata extraction (author, timestamps, template, last saved by)
- Social engineering tactic assessment
**Example prompt:**
```text
Analyze the attached macro-enabled Word document flagged by our email gateway as a suspicious invoice.
```
### Network Forensics
Analyze network captures for malicious activity, C2 communication, and data exfiltration.
**Supported formats:** PCAP, PCAPNG.
**Analysis capabilities:**
- Protocol breakdown and distribution statistics
- DNS query extraction with suspicious domain flagging
- HTTP/HTTPS request analysis (URLs, user agents, POST data, file downloads)
- TLS certificate inspection
- Connection statistics (top talkers, port usage, geographic distribution)
- C2 beacon pattern detection (regular intervals, jitter analysis)
- Data exfiltration indicators (high-entropy transfers, DNS tunneling, unusual outbound volumes)
- SMTP analysis for email-based exfiltration
**Example prompt:**
```text
Analyze the attached PCAP file for C2 communication and exfiltration indicators.
```
### Host Forensics
Perform system-level forensic analysis within Fleet's secure environment.
**Capabilities:**
- Filesystem timeline reconstruction (file modifications over configurable time windows)
- Rootkit detection
- System auditing and configuration review
- Metadata extraction from files and system artifacts
- Risk flagging for suspicious patterns (executables in temp directories, hidden files, SUID/SGID changes, modified authentication configs)
**Example prompt:**
```text
Create a forensic timeline of files modified in the last 24 hours, focusing on IR-relevant directories.
```
### File Triage
Perform initial assessment of unknown files to determine their nature and risk level.
**Capabilities:**
- File type identification
- Hash generation (MD5, SHA1, SHA256)
- Entropy analysis (detecting encryption, compression, or packing)
- Metadata extraction (EXIF, document properties, PE timestamps)
- String extraction and classification
- Routing to specialized analysis (malware RE, document analysis) based on file type
## AIR Operations Skills
### Endpoint Management
List, search, and manage AIR endpoints directly from Fleet.
**Operations:**
- List all managed endpoints with status information
- Search endpoints by hostname, IP address, tag, operating system, or status
- Isolate endpoints from the network (maintaining AIR agent communication)
- Remove endpoint isolation
- Apply tags to endpoints for organization
- Reboot endpoints remotely
### Case Management
Create and manage investigation cases in AIR.
**Operations:**
- Create new cases with title, description, and assigned endpoints
- Add endpoints to existing cases
- Update case details and status
- Close cases
### Evidence Acquisition
Trigger forensic evidence collection on AIR endpoints.
**Operations:**
- Initiate evidence acquisition using built-in acquisition profiles
- Initiate evidence acquisition using custom acquisition profiles
- Monitor task progress and status
- Review acquisition results
### Triage Operations
Deploy detection rules to AIR endpoints for threat hunting.
**Operations:**
- Deploy YARA rules to endpoints for file and memory scanning
- Deploy Sigma rules for log-based detection
- Deploy osquery queries for endpoint state inspection
- Schedule triage scans
- Review triage results and findings
### interACT
Execute remote commands on managed AIR endpoints.
**Operations:**
- Establish remote command sessions on endpoints
- Execute shell commands
- Transfer files to and from endpoints
- Review command output and results
### Investigation Results
Browse and analyze evidence collected through AIR.
**Operations:**
- Access collected evidence for specific cases and endpoints
- Browse DRONE analysis findings
- Access Investigation Hub data
- Review triage scan results
## Utility Skills
### Browser Automation
Control a remote browser for web-based research and evidence collection.
**Capabilities:**
- Navigate to URLs
- Click elements and type text
- Take viewport or full-page screenshots
- Download files from web pages
- Record browsing sessions for audit trails
See [Browser Automation](../browser/) for full details.
### Knowledge Base Search
Search the AIR knowledge base for documentation, guides, and troubleshooting information.
**Use cases:** finding documentation on AIR features, looking up configuration guides, troubleshooting AIR issues.
### Document Query
Extract text content from files for further analysis.
**Supported formats:** PDF, HTML, images (via OCR), and text files.
**Use cases:** extracting readable text from scanned documents, converting PDFs to searchable text, reading content from screenshots or images.
---
# Recipes
> Source: https://kb.binalyze.ai/fleet/features/recipes/index.html
## Overview
Recipes are pre-built, multi-step workflows that chain multiple Fleet skills together to accomplish a common task from start to finish. Each recipe encodes a proven methodology, ensuring consistent, thorough results every time.
When your request matches a known recipe, Fleet follows the established workflow automatically. You do not need to reference recipes by name. Simply describe what you want to accomplish, and Fleet determines whether a recipe applies.
Recipes cover four major categories: AIR operations, forensic analysis, malware analysis, and threat intelligence.
## AIR Operations Recipes
### Endpoint Triage
Assess an endpoint's security posture through AIR. Fleet connects to the specified endpoint, gathers system information, reviews recent activity, and produces a security assessment with findings and recommended next steps.
### Linux Quick Triage
Rapid security assessment of a Linux endpoint. Fleet performs filesystem timeline analysis, checks for rootkits, reviews system configurations, identifies suspicious processes, and flags anomalies. Produces a prioritized findings report.
### interACT Session
Establish and manage a remote command session on a AIR endpoint. Fleet guides you through connecting to the endpoint, executing commands, and interpreting results. Useful for live response during active incidents.
### File Transfer
Transfer files to or from AIR endpoints. Fleet handles the file transfer process through interACT, managing the connection, transfer, and verification steps.
### Investigation Results
Retrieve and analyze evidence collected for a specific case in AIR. Fleet accesses the Investigation Hub data, reviews DRONE findings, and provides a summary of key findings with recommendations for further investigation.
### Evidence Acquisition
Collect forensic evidence from AIR endpoints. Fleet triggers acquisition using the appropriate profile, monitors task progress, and notifies you when collection is complete. Supports both built-in and custom acquisition profiles.
### Incident Response
Full incident response workflow from detection to containment. Fleet coordinates across multiple AIR capabilities: endpoint assessment, evidence acquisition, triage rule deployment, endpoint isolation, and finding documentation. Produces an IR summary with timeline, findings, containment actions taken, and recommended next steps.
## Forensic Analysis Recipes
### Filesystem Timeline
Reconstruct the file modification history of a system for incident scoping. Fleet analyzes filesystem metadata to build a chronological timeline of changes, categorizes modifications by type and location, and flags suspicious patterns such as executables in temporary directories, modified authentication configurations, hidden files, and SUID/SGID changes.
### EVTX Analysis
Analyze Windows Event Log files for attack indicators. Fleet parses EVTX files, extracts security-relevant events (authentication attempts, privilege escalation, process creation, service changes, scheduled tasks), identifies suspicious patterns (brute-force attempts, lateral movement, persistence mechanisms, log tampering), correlates related events by session, and produces a timeline with risk assessment.
### PCAP Triage
Analyze network captures for command-and-control communication and data exfiltration. Fleet performs protocol breakdown, extracts DNS queries, HTTP requests, and TLS metadata, identifies beacon patterns and unusual connections, exports transferred objects, and produces a structured analysis report with IOCs and threat assessment.
### Steganography Detection
Detect hidden data embedded within image files. Fleet analyzes images using multiple detection methods: LSB (Least Significant Bit) analysis, EOF (End of File) marker inspection, known steganography tool signature detection, and entropy analysis across image regions. Attempts extraction of any detected hidden content and reports confidence levels for each method.
## Malware Analysis Recipes
### PE Static Analysis
Comprehensive static analysis of Windows PE executables. Fleet performs file identification and hashing, PE header analysis, section inspection with entropy measurement, import and export analysis, string extraction and classification, packer detection, capability identification, MITRE ATT&CK mapping, and IOC extraction. Produces a structured threat assessment report.
### Document Analysis
Investigate Office and PDF documents for embedded threats. Fleet extracts and deobfuscates macros, identifies auto-execution triggers, detects embedded objects and external template references, analyzes URLs and network indicators, extracts metadata, and assesses social engineering tactics. Produces a complete analysis with the deobfuscated attack chain and IOCs.
### Shellcode Decode
Decode and analyze obfuscated shellcode payloads. Fleet identifies the encoding scheme (XOR, rolling XOR, Base64, custom ciphers), writes a decryption script, decodes the shellcode, disassembles it, identifies its purpose (downloader, reverse shell, stager, full payload), extracts IOCs, maps techniques to MITRE ATT&CK, and generates detection rules for both encoded and decoded forms.
### .NET Deobfuscation
Strip obfuscation from .NET assemblies to reveal true functionality. Fleet identifies the obfuscation method (SmartAssembly and similar protectors), locates string decryption routines, decompiles the assembly to C# source code, analyzes the deobfuscated functionality, extracts IOCs, and generates detection rules for both obfuscated and clean variants.
### Packed Malware Comparison
Compare packed and unpacked variants of the same malware to reveal what packing conceals. Fleet performs packing detection on each variant, runs full static analysis on both, generates a side-by-side comparison table (imports, strings, entropy, API calls, size, timestamps), identifies capabilities in the unpacked variant, maps to MITRE ATT&CK, and generates a YARA rule detecting both forms.
### Ransomware Triage
Assess a ransomware sample's encryption scheme and evaluate decryption feasibility. Fleet identifies cryptographic imports and constants, analyzes the key management scheme (symmetric vs. hybrid, local vs. server-side keys, per-file vs. global key), identifies file targeting patterns, analyzes the ransom note, searches for available decryptors, rates decryption feasibility, generates detection rules, and produces an IR decision matrix (decrypt vs. restore vs. negotiate).
### Credential Stealer Profiling
Map the targeted applications and credential stores of an information stealer. Fleet identifies the API hashing algorithm used for dynamic resolution, resolves API hashes, extracts and classifies targeted paths (browsers, cryptocurrency wallets, FTP/email/VPN clients, gaming platforms), analyzes the C2 protocol, creates a target matrix table, generates detection rules, and produces a threat advisory with mitigation recommendations.
### PowerShell Investigation
Deobfuscate and trace PowerShell-based attacks. Fleet decodes encoded commands (Base64, string concatenation, variable substitution, Invoke-Expression chains), traces the full execution chain, analyzes exfiltration protocols, researches associated CVEs, maps to MITRE ATT&CK, generates detection rules (Sigma for PowerShell logging, YARA for scripts, osquery for vulnerability indicators), and produces an IR playbook.
## Threat Intelligence Recipes
### Observable Extraction
Extract and enrich indicators of compromise from any source. Fleet processes URLs, documents, text, or files to extract all observables, enriches them with reputation data and risk scores, and produces structured output in multiple formats (markdown report, scored text report, STIX 2.1 bundle, or YARA rules).
### APT Report Processing
Convert a threat intelligence report into a complete, actionable intelligence package. Fleet extracts all observables from the report, converts them to STIX 2.1 format, enriches IOCs against threat intelligence sources, maps TTPs to the MITRE ATT&CK matrix, searches for supplementary advisories, generates detection rules (Sigma, YARA, osquery), and produces an executive threat briefing ready for distribution to SOC and IR teams.
### Detection from Scenario
Build detection rules from a described attack scenario. Fleet analyzes the attack stages, maps each to specific MITRE ATT&CK techniques, generates a Sigma rule per stage, validates all rules, converts to Splunk SPL and Microsoft Sentinel KQL, designs a correlation meta-rule chaining all stages, tests against provided sample logs, and documents each rule with coverage analysis, false positive scenarios, required log sources, and tuning guidance.
### YARA Fix and Validate
Debug, fix, and validate broken YARA rules. Fleet reads the rule, identifies syntax errors, explains what the rule is trying to detect and why the syntax is broken, fixes the rule, validates compilation, scans files to test for matches, and suggests improvements to make the rule more effective.
---
# Quickstarts
> Source: https://kb.binalyze.ai/fleet/features/quickstarts/index.html
## Overview

Quickstarts are pre-configured prompt cards displayed on the new chat screen when you open Fleet. Each quickstart provides a ready-to-use prompt that demonstrates a specific Fleet capability. Many quickstarts also include a sample file so you can see Fleet in action immediately without needing to provide your own evidence.
Quickstarts serve two purposes:
1. **Discovery** -- new users can explore Fleet's capabilities by clicking any quickstart card and observing the full analysis workflow.
2. **Efficiency** -- experienced users get one-click access to common workflows. Select a quickstart, optionally replace the sample file with your own, and Fleet executes the full analysis.
To use a quickstart, click its card on the new chat screen. The prompt is pre-filled and any sample file is automatically attached. You can modify the prompt or replace the attachment before sending.

## Threat Hunting
### Analyze URL and Extract Observables
Extract IOCs from a suspicious URL and classify them by type. Fleet fetches the page content, extracts all observables, enriches them with reputation data and risk scores, and delivers an organized IOC table filtered for relevance.
**Includes sample:** a URL to a threat report page.
**Fleet delivers:** enriched and scored IOC table organized by type.
### Hunt APT29 Indicators from Threat Report
Build a full threat intelligence pipeline from a threat report. Fleet extracts and enriches all observables, converts to STIX 2.1, searches for the latest advisories, and produces detection rules and an executive threat briefing.
**Includes sample:** APT29 threat report archive.
**Fleet delivers:** enriched IOC table, ATT&CK technique mapping, detection rules (Sigma, YARA, osquery), and executive threat briefing.
## Malware Analysis
### Reverse Engineer Binary File
Static analysis of a PE binary to identify capabilities and threat indicators.
**Includes sample:** a PE executable (`sample-binary.exe`).
**Fleet delivers:** capability summary, IOC table (hashes and network indicators), risk level with reasoning, and MITRE ATT&CK mapping.
### Unpack and Compare Packed vs. Unpacked Malware
Side-by-side analysis of packed and unpacked LokiBot variants to reveal hidden capabilities.
**Includes sample:** archive containing packed and unpacked LokiBot variants.
**Fleet delivers:** side-by-side comparison table (imports, strings, entropy, API calls, size, timestamps), capability assessment, ATT&CK mapping, and a YARA rule detecting both forms.
### Analyze Dumped and Repaired Binary
Reverse engineer a memory-dumped svchost.exe with reconstructed IAT to uncover injected malware capabilities.
**Includes sample:** suspicious svchost.exe archive dumped from memory.
**Fleet delivers:** evidence of the injection technique, capability assessment, IOC table, ATT&CK mapping, and forensic report.
### Deobfuscate .NET Malware
Strip SmartAssembly obfuscation from a .NET binary to reveal true functionality.
**Includes sample:** obfuscated .NET assembly archive.
**Fleet delivers:** identified obfuscation techniques, deobfuscation script, capability assessment, extracted IOCs, and YARA rule for both variants.
### Profile Credential Stealer Capabilities
Deep-dive analysis of KPOT 2.0 stealer to map targeted applications and credential stores.
**Includes sample:** KPOT 2.0 stealer archive (password-protected).
**Fleet delivers:** target matrix (application, category, targeted paths, data stolen), C2 protocol analysis, detection rules, and threat advisory.
### Ransomware Triage and Decryption Assessment
Analyze ransomware cryptographic implementation to assess data recovery feasibility.
**Includes sample:** CryptoCrazy ransomware archive (password-protected).
**Fleet delivers:** crypto scheme analysis, decryption feasibility rating, detection rules, and IR decision matrix.
## Reverse Engineering
### Decode Obfuscated Shellcode
Reverse engineer encoded shellcode by decoding, disassembling, and extracting IOCs.
**Includes sample:** encoded shellcode archive.
**Fleet delivers:** decryption script, disassembly highlights, extracted IOCs, ATT&CK mapping, and YARA rule for both encoded and decoded forms.
## Phishing Investigation
### Analyze Suspicious Invoice Document
Investigate a macro-enabled invoice document for malicious payloads.
**Includes sample:** macro-enabled Word document (`invoice-details.docm`).
**Fleet delivers:** deobfuscated macro code, full execution chain, extracted IOCs, ATT&CK mapping, and verdict with confidence level.
### Investigate Office Template Injection
Analyze a Word document using external template references to bypass macro detection.
**Includes sample:** Word document archive using template injection.
**Fleet delivers:** extracted external URLs, bypass technique explanation, detection rules (YARA, Sigma, osquery), and comparison table of template injection vs. traditional macro attacks.
## Steganography
### Detect Image Steganography
Analyze an image for hidden data or malicious content.
**Includes sample:** a PNG image (`stego-image.png`).
**Fleet delivers:** detection results per method (LSB, EOF, tool signatures, entropy), any extracted hidden content, and confidence assessment.
## Detection Engineering
### Fix and Validate YARA Rule
Debug a broken YARA rule that detects remote access tools abused by attackers.
**Includes sample:** a YARA rule file with syntax errors (`sample-rule.yara`).
**Fleet delivers:** explanation of the error, corrected rule, scan results with matches, and improvement suggestions.
### Build Sigma Rules from Attack Scenario
Generate, validate, and convert Sigma detection rules for a multi-stage attack chain.
**Includes sample:** Windows event log archive (JSONL format with Security, Sysmon, and PowerShell events).
**Fleet delivers:** validated Sigma rule per attack stage, converted to Splunk SPL and Sentinel KQL, correlation meta-rule, test results, and per-rule documentation.
## DFIR and Investigation
### Create Timeline for Linux
Generate a command to create a forensic timeline of recently modified files on a Linux machine.
**No sample file included.**
**Fleet delivers:** a ready-to-paste bash command targeting IR-relevant directories, with explanation and red flags to watch for.
### Analyze Windows Event Log
Investigate a Windows EVTX event log for suspicious activity and security events.
**Includes sample:** a Windows Event Log file (`sample-eventlog.evtx`).
**Fleet delivers:** timeline of significant security events, suspicious patterns, extracted IOCs, and risk assessment with recommended response actions.
### Investigate PowerShell Exfiltration Script
Trace a HiveNightmare exploit chain from PowerShell exfiltration script to Python C2 server.
**Includes sample:** archive containing a PowerShell script and Python C2 server.
**Fleet delivers:** deobfuscated code, exploit chain explanation, exfiltration protocol analysis, ATT&CK mapping, detection rules, and IR playbook.
## Network Forensics
### Crack and Analyze Encrypted PCAP
Crack an encrypted ZIP archive and analyze the network capture inside.
**Includes sample:** password-protected ZIP archive containing a PCAP file.
**Fleet delivers:** cracked password, protocol statistics, IOC table, suspicious findings, and threat assessment.
---
# AIR Integration
> Source: https://kb.binalyze.ai/fleet/features/air-integration/index.html
## Overview
Fleet integrates directly with AIR, enabling you to manage endpoints, collect evidence, deploy detection rules, execute remote commands, and browse investigation results without leaving the Fleet conversation. This turns Fleet into a force multiplier for your existing AIR deployment: you describe what you need in natural language, and Fleet translates that into the appropriate AIR operations.
All communication between Fleet and AIR passes through authenticated, encrypted API channels. Credentials are encrypted and handled by a secure gateway, never exposed to the AI agent.
## Configuration

To enable Fleet's AIR integration, you need to configure an API connection:
1. Open Fleet and use the left sidebar.
2. Select **Integrations** and open the AIR integration card.
3. Provide your AIR API key.
4. Fleet validates the connection and confirms access.
Once configured, Fleet can perform all supported AIR operations on your behalf. The API key is encrypted at rest and in transit, and is never visible to the AI agent.
## Endpoint Management
Fleet can list, search, and manage AIR endpoints directly from the conversation.
### Listing and Searching Endpoints
Ask Fleet to find endpoints using any combination of criteria:
- **Hostname** -- search by full or partial hostname
- **IP address** -- search by IP address or subnet
- **Tags** -- filter by assigned tags
- **Operating system** -- filter by Windows, macOS, Linux, or ChromeOS
- **Status** -- filter by managed, unmanaged, off-network, or isolated status
**Example prompts:**
```text
List all Windows endpoints with the tag "finance-department".
```
```text
Show me all endpoints with IP addresses in the 10.0.1.0/24 range.
```
```text
Which endpoints are currently isolated?
```
### Endpoint Isolation
Fleet can isolate endpoints from the network while maintaining AIR agent communication, and remove isolation when containment is no longer needed.
**Example prompts:**
```text
Isolate the endpoint WORKSTATION-042 immediately.
```
```text
Remove isolation from WORKSTATION-042.
```
### Tagging
Fleet can apply and remove tags on endpoints for organization and filtering.
**Example prompt:**
```text
Tag all endpoints in the 10.0.5.0/24 subnet with "incident-2024-003".
```
### Reboot
Fleet can trigger remote reboots on managed endpoints.
**Example prompt:**
```text
Reboot the endpoint SERVER-DB-01.
```
## Case Management
Fleet can create and manage investigation cases in AIR.
### Creating Cases
Fleet creates cases with the information you provide, including title, description, and initial endpoint assignments.
**Example prompt:**
```text
Create a new case titled "Suspicious PowerShell Activity - Finance" and add endpoints WORKSTATION-042 and WORKSTATION-043.
```
### Managing Cases
Fleet can update case details, add or remove endpoints, and close cases when investigations are complete.
**Example prompts:**
```text
Add endpoint SERVER-WEB-01 to case "Suspicious PowerShell Activity - Finance".
```
```text
Close case "Suspicious PowerShell Activity - Finance" with resolution: contained and remediated.
```
## Evidence Acquisition
Fleet can trigger forensic evidence collection on AIR endpoints using acquisition profiles.
### Triggering Acquisition
Specify the endpoint and acquisition profile. Fleet initiates the collection and monitors progress.
**Example prompts:**
```text
Acquire full evidence from WORKSTATION-042 using the default acquisition profile.
```
```text
Run the "Browser Artifacts" acquisition profile on all endpoints tagged "incident-2024-003".
```
### Monitoring Progress
Fleet tracks acquisition task status and notifies you when collection is complete or if issues arise.
**Example prompt:**
```text
What is the status of the acquisition task on WORKSTATION-042?
```
## Triage
Fleet can deploy detection rules to AIR endpoints for rapid threat hunting.
### Deploying Rules
Fleet can deploy YARA, Sigma, and osquery rules to endpoints. You can provide existing rules or ask Fleet to generate them first.
**Example prompts:**
```text
Deploy this YARA rule to all Windows endpoints in the "finance-department" tag group.
```
```text
Generate a Sigma rule for detecting Mimikatz execution and deploy it to WORKSTATION-042.
```
### Scheduling Scans
Fleet can schedule triage scans for specific times or recurring intervals.
**Example prompt:**
```text
Schedule a daily YARA scan using the "ransomware-indicators" rule on all servers.
```
### Reviewing Results
Fleet can retrieve and summarize triage scan results, highlighting matches and providing context.
**Example prompt:**
```text
Show me the triage results for the last scan on WORKSTATION-042.
```
## interACT
Fleet can establish remote command sessions on managed AIR endpoints, execute commands, and transfer files.
### Remote Command Execution
Fleet executes shell commands on endpoints through AIR's interACT feature and returns the output.
**Example prompts:**
```text
Run "netstat -an" on WORKSTATION-042 and show me any connections to external IPs.
```
```text
Check if the file C:\Windows\Temp\suspicious.exe exists on WORKSTATION-042.
```
### File Transfer
Fleet can transfer files to and from endpoints through interACT.
**Example prompts:**
```text
Download the file C:\Windows\Temp\suspicious.exe from WORKSTATION-042 for analysis.
```
```text
Upload the remediation script to WORKSTATION-042.
```
## Investigation Results
Fleet can browse and analyze evidence collected through AIR, including DRONE findings and Investigation Hub data.
### Browsing Evidence
Fleet accesses collected evidence for specific cases and endpoints, providing summaries and enabling deeper analysis.
**Example prompts:**
```text
Show me the DRONE findings for case "Suspicious PowerShell Activity - Finance".
```
```text
What evidence has been collected from WORKSTATION-042?
```
### Analyzing Findings
Fleet can analyze investigation results and provide context, recommendations, and next steps.
**Example prompt:**
```text
Summarize the key findings from the Investigation Hub for case "Suspicious PowerShell Activity - Finance" and recommend next steps.
```
## Combining Fleet Analysis with AIR Operations
Fleet's most powerful use case is combining its analysis capabilities with AIR operations in a single workflow. For example:
1. **Ask Fleet to triage an endpoint** -- Fleet connects to AIR, gathers endpoint information, and assesses the security posture.
2. **Fleet identifies suspicious activity** -- based on the triage, Fleet recommends acquiring specific evidence.
3. **Fleet triggers acquisition** -- evidence collection runs on the endpoint through AIR.
4. **Fleet analyzes the evidence** -- once collected, Fleet analyzes the artifacts using its forensic tools.
5. **Fleet generates detection rules** -- based on findings, Fleet creates YARA and Sigma rules.
6. **Fleet deploys rules organization-wide** -- the new rules are deployed to all relevant endpoints through AIR triage.
This end-to-end workflow happens within a single Fleet conversation, with each step building on the previous one.
---
# Browser Automation
> Source: https://kb.binalyze.ai/fleet/features/browser/index.html
## Overview

Fleet includes a remote browser that you can control through natural language commands. The browser runs in its own isolated environment, completely separate from your network and endpoints. This allows you to safely navigate to suspicious URLs, interact with web content, download files, and capture evidence without exposing your infrastructure.
## Capabilities
### Navigation
Fleet can navigate the browser to any URL. The page loads in the isolated browser environment, and Fleet can read the page content, interact with elements, and capture the state.
**Example prompts:**
```text
Navigate to https://example.com/suspicious-page and take a screenshot.
```
```text
Open the VirusTotal page for this hash: abc123def456...
```
### Page Interaction
Fleet can interact with web page elements: clicking buttons and links, typing text into form fields, scrolling, and hovering. This enables interaction with single-page applications, search interfaces, login forms (using test credentials), and multi-step web workflows.
**Example prompts:**
```text
Go to the MalwareBazaar search page, search for "LokiBot", and show me the results.
```
```text
Navigate to the threat intel portal, click on "Recent Reports", and download the latest APT29 analysis.
```
### Screenshots
Fleet can capture screenshots of the browser viewport or the full page. Screenshots are saved to your workspace for download.
**Example prompts:**
```text
Take a full-page screenshot of the current page.
```
```text
Navigate to the phishing URL and capture a screenshot of what the victim would see.
```
### File Downloads
Fleet can download files from web pages. Downloaded files are saved to the workspace and can be analyzed immediately using Fleet's forensic capabilities.
**Example prompts:**
```text
Download the malware sample from this MalwareBazaar link.
```
```text
Navigate to the vendor advisory page and download the PDF report.
```
### Session Recording
Fleet can record browsing sessions, capturing the sequence of actions taken for audit trails and documentation. Recordings can be started and stopped on demand.
**Example prompts:**
```text
Start recording the browser session.
```
```text
Stop recording and save the session.
```
## Use Cases
### Threat Intelligence Research
Use the browser to access threat intelligence portals, search for IOCs on VirusTotal or similar platforms, and download threat reports from vendor websites. Fleet can navigate multi-page results, interact with search interfaces, and extract relevant information.
### Malware Sample Retrieval
Safely download malware samples from repositories like MalwareBazaar, VirusTotal, or other malware sharing platforms. The browser's isolated environment ensures that navigating to these sites poses no risk to your infrastructure.
### Phishing Investigation
Navigate to suspected phishing URLs to capture what the victim would see, take screenshots for evidence documentation, and analyze the page content for credential harvesting forms, redirects, and embedded scripts.
### Evidence Capture
Document web-based evidence by navigating to relevant pages, taking screenshots, and downloading content. Session recording provides a complete audit trail of the browsing activity.
### Single-Page Application Scraping
Many modern threat intelligence platforms and security tools use single-page applications that cannot be accessed with simple URL fetching. The browser can interact with these applications, navigate through dynamic content, and extract the information you need.
## Limitations
- The browser runs in an isolated environment and cannot access resources on your internal network.
- Some websites may block automated browsers or require CAPTCHA completion.
- The browser does not persist cookies or sessions between Fleet sessions.
- JavaScript-heavy pages may require additional interaction steps to fully load content.
---
# Workspace & Terminal
> Source: https://kb.binalyze.ai/fleet/features/workspace/index.html
## Overview
Every Fleet session includes a workspace for file storage and an interactive terminal for direct command execution. Together, they give you full control over your analysis environment: upload evidence, browse generated outputs, download reports, and run commands alongside Fleet's automated workflows.
## Workspace
The workspace is a persistent file storage area associated with your Fleet session. It serves as the central location for all files involved in your analysis.
### What Goes in the Workspace
- **Uploaded files** -- any files you attach to your prompts (executables, documents, archives, PCAPs, event logs, detection rules, images, text files) are stored in the workspace.
- **Analysis outputs** -- all files Fleet generates during analysis (reports, IOC tables, detection rules, STIX bundles, deobfuscated code, disassembly output) are saved to the workspace.
- **Downloaded files** -- files downloaded through browser automation or web fetching are saved to the workspace.
- **User-created files** -- any files you create through the terminal are stored in the workspace.
### Organization
Fleet organizes workspace files by date. Each day's work is stored in a dated folder (e.g., `2026-03-19`). Within each folder, files are named descriptively based on their content and the tool that produced them.
### File Tree

The workspace file tree is displayed in the sidebar of the Fleet interface. From the file tree, you can:
- **Browse** -- navigate through folders and see all files in your workspace.
- **Download** -- download any file to your local machine.
- **Copy** -- copy files within the workspace.
- **Move** -- move files between workspace folders.
- **Delete** -- remove files you no longer need.
### Uploading Files
You can upload files to Fleet in several ways:
- **Drag and drop** -- drag files directly into the prompt input area.
- **Attachment button** -- click the attachment button in the prompt bar to open a file picker.
- **Quickstart samples** -- quickstart cards that include sample files automatically attach them when selected.
Fleet accepts any file type. There are no restrictions on file extensions. Common formats include:
| Category | Formats |
|---|---|
| Executables | PE (.exe, .dll), ELF, .NET assemblies, shellcode |
| Documents | PDF, Word (.doc, .docx, .docm), Excel, PowerPoint, RTF, OLE |
| Archives | ZIP, 7z, RAR, TAR, GZ (including password-protected) |
| Network captures | PCAP, PCAPNG |
| Event logs | EVTX, JSON, JSONL |
| Detection rules | YARA (.yar), Sigma (.yml), osquery (.sql), Suricata (.rules) |
| Images | PNG, JPG, GIF, BMP |
| Text | TXT, CSV, MD, JSON, XML, HTML |
### Downloading Results
All analysis outputs are saved to the workspace automatically. To download results:
1. Open the file tree in the sidebar.
2. Navigate to the file you want.
3. Click the download action.
Alternatively, ask Fleet to point you to specific output files, and it will provide the workspace path.
## Terminal
The terminal provides an interactive shell session inside Fleet's secure Linux environment. It gives you direct command-line access for manual analysis, file inspection, and custom workflows.
### Accessing the Terminal
The terminal is available from the Fleet interface. You can open multiple terminal tabs simultaneously, each running an independent shell session.
### Environment
The terminal runs in a full Linux environment with standard utilities available:
- **File operations** -- `ls`, `cd`, `cp`, `mv`, `rm`, `find`, `tree`
- **Text processing** -- `grep`, `awk`, `sed`, `sort`, `uniq`, `jq`
- **Networking** -- `curl`, `wget`, `dig`, `nslookup`, `whois`
- **Compression** -- `7z`, `zip`, `unzip`, `tar`, `gzip`
- **Development** -- `python3`, `node`, `git`, `sqlite3`
- **Search** -- `ripgrep` (`rg`) for fast text search
### Use Cases
- **Manual file inspection** -- examine files that Fleet has analyzed, verify outputs, or inspect specific details.
- **Custom scripting** -- write and run Python or Bash scripts for analysis tasks that require custom logic.
- **Parallel work** -- run commands in the terminal while Fleet performs automated analysis in the chat.
- **Ad-hoc queries** -- quickly check file hashes, inspect hex dumps, search for strings, or run one-off commands.
### Relationship with Fleet
The terminal and Fleet's chat share the same workspace. Files created or modified in the terminal are visible to Fleet, and files generated by Fleet are accessible from the terminal. This allows you to seamlessly combine manual and AI-assisted analysis:
1. Upload a file through the chat.
2. Ask Fleet to perform initial triage.
3. Open the terminal to manually inspect specific findings.
4. Return to the chat to ask Fleet for deeper analysis based on what you found.
## Limitations
- The workspace and terminal are scoped to the current session. Files do not persist across separate Fleet sessions.
- The terminal environment is Linux-based. Windows-specific commands are not available, but you can analyze Windows artifacts (PE files, EVTX logs, registry hives) using the available Linux tools.
- The environment does not have internet access from the terminal. All external access (web searches, threat intelligence lookups, URL fetching) is handled through Fleet's secure gateway.
---
# Detection Engineering
> Source: https://kb.binalyze.ai/fleet/features/detection-engineering/index.html
## Overview
Fleet provides a complete detection engineering workflow: describe what you want to detect in natural language, and Fleet generates the rule, validates it, converts it to your SIEM's query language, and optionally tests it against sample logs. Fleet supports YARA, Sigma, osquery, and Suricata rule formats.
The detection engineering workflow follows a consistent pattern across all rule types:
1. **Describe** -- tell Fleet what you want to detect (a behavior, a malware family, an attack technique, or a specific indicator).
2. **Generate** -- Fleet creates the rule with proper syntax, metadata, and detection logic.
3. **Validate** -- Fleet compiles or checks the rule to ensure it is syntactically correct.
4. **Convert** (Sigma only) -- Fleet converts the rule to Splunk SPL, Microsoft Sentinel KQL, or other SIEM query languages.
5. **Test** (optional) -- Fleet runs the rule against sample files or logs to verify it triggers correctly.
6. **Deploy** (optional) -- if connected to AIR, Fleet can deploy the rule to endpoints for live scanning.
## YARA Rules
YARA is a pattern-matching tool used to identify and classify malware based on textual or binary patterns. Fleet can generate, validate, fix, and scan with YARA rules.
### Generating YARA Rules
Fleet creates YARA rules from:
- **Natural language descriptions** -- describe the malware behavior, indicators, or characteristics you want to detect.
- **Malware analysis findings** -- after analyzing a binary, Fleet can generate a YARA rule based on the unique strings, imports, and structural indicators it found.
- **Threat intelligence** -- provide IOCs or a threat report, and Fleet generates rules targeting the described indicators.
- **Observable extraction** -- Fleet can run its full observable extraction and enrichment pipeline and generate YARA rules directly from the enriched results.
**Example prompts:**
```text
Create a YARA rule to detect in-memory execution of Mimikatz.
```
```text
Generate a YARA rule based on the strings and imports found in the attached binary.
```
```text
Create a YARA rule that detects remote control software (TeamViewer, AnyDesk, Radmin) commonly abused by attackers.
```
### Validating and Fixing YARA Rules
Fleet validates that generated rules compile successfully. If you provide a broken YARA rule, Fleet identifies the syntax errors, explains what is wrong, and fixes the rule.
**Example prompt:**
```text
This YARA rule won't compile. Fix it and explain what was wrong.
```
### Scanning with YARA Rules
Fleet can scan files in the workspace using a YARA rule to test for matches. Results include the matched rule name, file path, and which strings triggered the match.
**Example prompt:**
```text
Scan all files in the workspace with this YARA rule and show me the matches.
```
## Sigma Rules
Sigma is a generic signature format for log-based detections. Fleet can generate, validate, convert, and test Sigma rules.
### Generating Sigma Rules
Fleet creates Sigma rules with proper metadata including rule ID, title, status, description, author, date, references, logsource definitions, and detection logic using selection/filter/condition patterns.
**Inputs:**
- Attack scenario descriptions with MITRE ATT&CK technique references
- Sample log entries showing the behavior to detect
- Threat intelligence reports describing adversary techniques
- Natural language descriptions of suspicious behavior
**Example prompts:**
```text
Create a Sigma rule to detect encoded PowerShell execution via Event ID 4688.
```
```text
Build a Sigma rule for detecting scheduled task creation used for persistence (T1053.005).
```
```text
Generate Sigma rules for each stage of this attack: spearphishing -> encoded PowerShell -> process hollowing -> scheduled task -> HTTPS exfiltration.
```
### Validating Sigma Rules
Fleet validates generated rules against the Sigma specification, checking for syntax errors, invalid logsource definitions, and detection logic issues.
### Converting to SIEM Queries
Fleet converts validated Sigma rules to the query languages used by major SIEM platforms:
| Target Platform | Query Language |
|---|---|
| Splunk | SPL (Search Processing Language) |
| Microsoft Sentinel | KQL (Kusto Query Language) |
**Example prompt:**
```text
Convert this Sigma rule to both Splunk SPL and Microsoft Sentinel KQL.
```
### Testing Against Logs
Fleet can test Sigma rules against sample log files to verify they trigger correctly:
- **EVTX files** -- Windows Event Log files are parsed and matched against the Sigma detection logic.
- **JSONL files** -- JSON-lines log files are evaluated event by event against the Sigma detection block, supporting all standard modifiers (contains, endswith, startswith, regex, all) and condition combinators.
**Example prompt:**
```text
Test this Sigma rule against the attached EVTX file and show me which events match.
```
### Correlation Rules
For multi-stage attack detection, Fleet can create correlation meta-rules that chain individual Sigma rules together with time-based correlation windows. This enables detection of complete attack sequences rather than isolated events.
**Example prompt:**
```text
Create a correlation rule that chains these five Sigma rules into a single detection for the full attack sequence, with a 24-hour correlation window.
```
## osquery Queries
osquery uses SQL to query endpoint state. Fleet generates and validates osquery queries from natural language.
### Generating osquery Queries
Fleet creates osquery SQL queries targeting the appropriate tables and columns for your request.
**Example prompts:**
```text
Write an osquery query that lists all USB devices connected in the last 24 hours.
```
```text
Create an osquery query to find all processes listening on network ports.
```
```text
Generate an osquery query that checks for unauthorized SSH keys in all user home directories.
```
### Validating osquery Queries
Fleet validates generated queries by checking:
- SQL syntax correctness
- Table and column name validity against the osquery schema
- Common mistakes (SELECT *, invalid strftime usage, wrong column names)
## Suricata Rules
Suricata is a network-based IDS/IPS. Fleet can validate Suricata rule syntax to ensure rules are correctly formatted before deployment.
**Example prompt:**
```text
Validate this Suricata rule for syntax errors.
```
## End-to-End Workflow Example
Here is a typical detection engineering workflow in Fleet:
1. **You:** "An analyst reported seeing encoded PowerShell commands in Event ID 4688 logs. Create detection rules for this."
2. **Fleet:** generates a Sigma rule targeting PowerShell execution with Base64-encoded commands in process creation events.
3. **Fleet:** validates the rule against the Sigma specification.
4. **Fleet:** converts the rule to Splunk SPL and Microsoft Sentinel KQL.
5. **You:** "Test it against this EVTX file." (attach file)
6. **Fleet:** runs the rule against the EVTX file and reports which events match.
7. **You:** "Deploy this to all Windows endpoints."
8. **Fleet:** deploys the rule to AIR endpoints via triage (requires AIR integration).
## Limitations
- Sigma conversion is currently supported for Splunk SPL and Microsoft Sentinel KQL. Additional backends may be added in the future.
- Suricata support is limited to syntax validation. Fleet does not generate Suricata rules from scratch.
- YARA scanning runs against files in the workspace only. Live endpoint scanning requires deployment through AIR triage.
---
# Forensic Analysis
> Source: https://kb.binalyze.ai/fleet/features/forensics/index.html
## Overview
Fleet provides deep forensic analysis capabilities across multiple evidence types. Upload a file, describe what you need, and Fleet performs the analysis using industry-standard DFIR tools in its secure, isolated environment. All analysis outputs are saved to your workspace for download and further use.
## Malware Reverse Engineering
Fleet performs comprehensive static analysis on executable files to identify capabilities, extract indicators, and assess threat levels.
### Supported Formats
| Format | Description |
|---|---|
| PE (.exe, .dll, .sys) | Windows Portable Executable files |
| ELF | Linux executable files |
| .NET assemblies | Managed code executables and libraries |
| Shellcode | Raw machine code payloads |
| Packed binaries | UPX, Themida, ASPack, and other packers |
### Analysis Capabilities
**PE and ELF Analysis:**
- File header inspection (compilation timestamp, entry point, subsystem, linker version)
- Section analysis with entropy measurement to detect encryption, compression, or packing
- Import and export table analysis with flagging of suspicious API calls (process injection, credential access, networking, anti-analysis)
- String extraction and classification: URLs, IP addresses, registry keys, file paths, encoded data, mutex names
- Resource and overlay data inspection
- Packer detection and identification
- Disassembly of functions and code flow analysis
**Example prompt:**
```text
Perform static analysis on the attached PE binary. Deliver: capability summary, IOC table with hashes and network indicators, risk level with reasoning, and MITRE ATT&CK mapping.
```
**.NET Assembly Analysis:**
- CLR metadata extraction (framework version, entry point, assembly references)
- Full decompilation to C# source code for understanding what the code actually does
- Deobfuscation of protected assemblies (SmartAssembly and similar protectors)
- String decryption routine identification and automated decryption
- Obfuscation technique identification (name mangling, control flow obfuscation, resource encryption)
**Example prompt:**
```text
Deobfuscate the attached .NET assembly and show me the decompiled C# source code. Identify what the malware does and extract all IOCs.
```
**Shellcode Analysis:**
- Encoding/encryption scheme identification (XOR, rolling XOR, Base64, custom ciphers)
- Automated key brute-forcing and decoding
- Disassembly with function call identification
- API resolution analysis (hash-based dynamic API loading)
- Purpose classification: downloader, reverse shell, stager, or full payload
- IOC extraction from decoded shellcode
**Example prompt:**
```text
Decode the attached shellcode, identify the encryption scheme, and classify its purpose.
```
**Packed Malware:**
- Packer identification (UPX, Themida, ASPack, custom packers)
- Entropy-based packing detection
- Side-by-side comparison of packed vs. unpacked variants
- Capability delta analysis showing what packing conceals
**Example prompt:**
```text
Compare the packed and unpacked variants in the attached archive. Show me what the packing hides.
```
### Output
Malware analysis produces structured reports including:
- File metadata and hashes (MD5, SHA1, SHA256)
- Capability assessment with confidence levels
- IOC table (network indicators, file indicators, behavioral indicators)
- MITRE ATT&CK technique mapping
- Risk level with supporting evidence
- Recommended response actions
## Document Analysis
Fleet investigates documents for embedded threats, malicious macros, and hidden payloads.
### Supported Formats
| Format | Description |
|---|---|
| Word (.doc, .docx, .docm) | Microsoft Word documents, including macro-enabled |
| Excel (.xls, .xlsx, .xlsm) | Microsoft Excel spreadsheets, including macro-enabled |
| PowerPoint (.ppt, .pptx) | Microsoft PowerPoint presentations |
| PDF | Portable Document Format |
| RTF | Rich Text Format |
| OLE | Object Linking and Embedding compound files |
| CAB | Cabinet archive files |
### Analysis Capabilities
**VBA Macro Analysis:**
- Macro extraction from Office documents
- Deobfuscation of encoded macros (Base64, character code chains, string concatenation, string reversal, environment variable abuse)
- Auto-execution trigger identification (AutoOpen, Document_Open, Document_Close, Workbook_Open)
- Full execution chain tracing: what the macro does step by step
- Payload download and execution identification
**Embedded Object Detection:**
- OLE object inspection
- ActiveX control detection
- DDE (Dynamic Data Exchange) field analysis
- External template injection detection (T1221) with URL extraction from OOXML relationships
**PDF Analysis:**
- JavaScript extraction and deobfuscation
- Embedded file detection
- URL and action extraction
- Metadata analysis (author, creation date, modification date, producer)
- Suspicious structure identification
**Metadata Extraction:**
- Author, creation and modification timestamps
- Template information
- Last saved by
- Revision count and editing time
**Example prompts:**
```text
Analyze the attached Word document for malicious macros. Deobfuscate any encoded content and trace the full execution chain.
```
```text
Check this PDF for embedded JavaScript, hidden URLs, and suspicious actions.
```
```text
This Word document appears clean but might use template injection. Analyze the OOXML relationships for external template references.
```
### Output
Document analysis produces:
- Deobfuscated macro code (if present)
- Full execution chain description
- Extracted IOCs (URLs, IPs, domains, file hashes)
- Social engineering tactic assessment
- MITRE ATT&CK mapping
- Verdict (malicious, suspicious, or benign) with confidence level
## Network Forensics
Fleet analyzes network captures to identify malicious activity, command-and-control communication, and data exfiltration.
### Supported Formats
| Format | Description |
|---|---|
| PCAP | Packet capture files |
| PCAPNG | Next-generation packet capture files |
### Analysis Capabilities
**Protocol Analysis:**
- Protocol breakdown with distribution statistics
- Per-protocol deep inspection (DNS, HTTP, HTTPS/TLS, SMTP, FTP, SMB)
- Connection summary with top talkers (source and destination IPs)
- Port usage analysis
**DNS Analysis:**
- Complete DNS query extraction
- Suspicious domain identification
- DNS tunneling detection (high-entropy subdomain queries, unusual query volumes)
- Domain reputation assessment
**HTTP/HTTPS Analysis:**
- URL extraction and classification
- User agent analysis
- POST data inspection
- File download detection and extraction
- TLS certificate inspection (issuer, subject, validity, self-signed detection)
**C2 Detection:**
- Beacon pattern identification (regular intervals, jitter analysis)
- Connections to unusual ports
- High-entropy data transfers indicating encrypted C2 channels
- Known C2 framework signature detection
**Exfiltration Detection:**
- Unusual outbound data volumes
- Data staging patterns
- DNS exfiltration (encoded data in DNS queries)
- Encrypted channel analysis
**Example prompts:**
```text
Analyze the attached PCAP for C2 communication and data exfiltration indicators.
```
```text
Extract all DNS queries from this PCAP and flag any suspicious domains.
```
```text
Identify beacon patterns in this network capture and determine the C2 interval.
```
### Output
Network forensics produces:
- Protocol statistics and connection summary
- Extracted IOCs (IPs, domains, URLs, user agents)
- Suspicious findings with evidence
- Exported HTTP objects (downloaded files)
- Threat assessment with confidence levels
## Host Forensics
Fleet performs system-level forensic analysis within its secure environment.
### Capabilities
**Filesystem Timeline:**
- Reconstruct file modification history over configurable time windows
- Focus on IR-relevant directories: system configuration, temporary directories, log files, scheduled tasks, binary directories, user home directories
- File classification by type and risk level
- Suspicious pattern flagging:
- New executables in temporary directories
- Modified authentication configurations (passwd, shadow, sudoers)
- Altered or cleared log files
- Hidden files and directories
- SUID/SGID permission changes
- Recently added cron entries or SSH authorized keys
**Rootkit Detection:**
- System-level rootkit scanning
- Hidden process detection
- Kernel module inspection
- File integrity verification
**System Auditing:**
- Configuration review
- Service and process enumeration
- Network connection analysis
- User account and privilege review
**Example prompt:**
```text
Create a forensic timeline of files modified in the last 48 hours, focusing on /etc, /tmp, /var/log, and home directories. Flag anything suspicious.
```
## Disk and Memory Forensics
Fleet can analyze disk images and memory dumps uploaded to the workspace.
### Disk Image Analysis
**Supported formats:** RAW, E01, VMDK, VHD/VHDX.
**Capabilities:**
- Partition layout analysis
- File system browsing and file recovery
- Deleted file recovery
- File carving from unallocated space
- Timeline generation from filesystem metadata
### Memory Dump Analysis
**Capabilities:**
- Process listing and analysis
- Network connection enumeration
- Malware detection in memory (code injection, hollowed processes, suspicious memory regions)
- DLL and module listing
- Registry hive extraction from memory
**Example prompt:**
```text
Analyze this memory dump. List all running processes, identify any injected code, and extract network connections.
```
## Cryptographic and Steganographic Analysis
### Password Cracking
Fleet can attempt to crack password-protected archives using common malware analysis passwords (infected, malware, virus) and custom wordlists or patterns.
**Example prompt:**
```text
The attached ZIP is password-protected using the format "infected_YYYYMMDD". Crack it and extract the contents.
```
### Steganography Detection
Fleet analyzes images for hidden data using multiple detection methods:
- LSB (Least Significant Bit) analysis
- EOF (End of File) marker inspection for appended data
- Known steganography tool signature detection (Steghide, OpenStego, and others)
- Entropy analysis across image regions to identify areas with unusual randomness
- Attempted extraction of detected hidden content
**Example prompt:**
```text
Analyze the attached image for steganographic content. Try all detection methods and report confidence levels.
```
## Limitations
- All forensic analysis runs within Fleet's isolated environment. Fleet cannot directly scan live systems or endpoints.
- Memory forensics requires a compatible memory dump format. Raw memory dumps produce the best results.
- Password cracking is limited to dictionary-based and pattern-based approaches. Complex passwords may not be recoverable.
- Steganography detection is probabilistic. Not all steganographic methods can be detected, and false positives are possible.
---
# Threat Intelligence
> Source: https://kb.binalyze.ai/fleet/features/threat-intelligence/index.html
## Overview
Fleet provides a complete threat intelligence pipeline: extract indicators of compromise from any source, enrich them with reputation data and risk scores, generate structured intelligence outputs, and convert findings into actionable detection rules. The pipeline runs end-to-end in a single request, or you can use individual capabilities as needed.
## Observable Extraction
Fleet extracts indicators of compromise (IOCs) from URLs, documents, text, files, and threat reports.
### Supported Observable Types
| Type | Examples |
|---|---|
| IPv4 addresses | `192.168.1.1`, `10.0.0.0/24` |
| IPv6 addresses | `2001:0db8::1` |
| Domain names | `evil-c2.example.com` |
| URLs | `https://malware-host.example.com/payload.exe` |
| File hashes (MD5) | `d41d8cd98f00b204e9800998ecf8427e` |
| File hashes (SHA1) | `da39a3ee5e6b4b0d3255bfef95601890afd80709` |
| File hashes (SHA256) | `e3b0c44298fc1c149afbf4c8996fb924...` |
| Email addresses | `attacker@example.com` |
| Mutexes | `Global\MalwareMutex_001` |
| Registry keys | `HKLM\SOFTWARE\Microsoft\Windows\CurrentVersion\Run` |
| File paths | `C:\Windows\Temp\payload.exe` |
### Extraction Sources
- **URLs** -- Fleet fetches the page content (handling JavaScript-rendered single-page applications) and extracts all observables from the rendered text.
- **Documents** -- upload PDF, Office, or text files containing threat intelligence, and Fleet extracts all embedded indicators.
- **Text** -- paste raw text (email bodies, log entries, chat messages, report excerpts) and Fleet identifies all observables.
- **Files** -- upload any file, and Fleet extracts observables from its content and metadata.
### Noise Filtering
Fleet automatically filters extraction results to remove noise:
- Navigation links and UI elements from the source domain are excluded when extracting from URLs.
- Common benign infrastructure (CDN domains, analytics services) is flagged but not removed, allowing you to make the final determination.
**Example prompts:**
```text
Extract all observables from this URL: https://example.com/threat-report
```
```text
Extract IOCs from the attached PDF threat report.
```
```text
Parse this email body for indicators of compromise.
```
## Enrichment and Risk Scoring
Fleet enriches extracted observables with context from multiple intelligence sources and assigns risk scores.
### Enrichment Process
For each extracted observable, Fleet performs:
1. **Reputation lookup** -- checks the observable against multiple threat intelligence databases and reputation services.
2. **Domain popularity** -- for domain observables, checks against the Alexa Top 1M list to distinguish well-known legitimate domains from unknown or suspicious ones.
3. **Known-good identification** -- for file hash observables, checks against the National Software Reference Library (NSRL) to identify known legitimate software.
4. **Web intelligence** -- searches the internet for recent mentions of the observable in security advisories, threat reports, and research publications.
### Risk Scoring
Each observable receives a risk score based on the enrichment results:
| Score Range | Classification | Meaning |
|---|---|---|
| High | Malicious | Multiple sources confirm malicious activity |
| Medium | Suspicious | Some indicators of risk, requires investigation |
| Low | Likely benign | No negative reputation, possibly legitimate |
| Info | Known good | Confirmed legitimate (NSRL match, Alexa Top 1M) |
Scores include a confidence level indicating how much evidence supports the classification.
**Example prompt:**
```text
Extract and enrich all observables from this URL. Score each by risk level and filter out navigation noise.
```
## STIX 2.1 Output
Fleet can generate Structured Threat Information Expression (STIX) 2.1 bundles from extracted and enriched observables. STIX bundles are machine-readable and can be imported into:
- SIEM platforms (Splunk, Microsoft Sentinel, QRadar)
- Threat Intelligence Platforms (MISP, OpenCTI, ThreatConnect)
- SOAR platforms for automated response workflows
- Other security tools that support STIX ingestion
STIX bundles include the full enrichment data: reputation results, DNS records, web search findings, and evidence flags for each observable.
**Example prompt:**
```text
Extract observables from the attached report and generate a STIX 2.1 bundle with full enrichment data.
```
## Web Search
Fleet can search the internet for the latest threat intelligence, security advisories, CVE details, and research publications.
### Use Cases
- **CVE research** -- look up vulnerability details including CVSS score, affected versions, patch status, and known exploitation in the wild.
- **Threat actor research** -- find the latest advisories and campaign analyses for specific threat groups (APT29, Lazarus Group, FIN7, etc.).
- **Malware family research** -- locate technical write-ups, IOC lists, and detection guidance for specific malware families.
- **Technique research** -- find documentation on specific attack techniques, including detection strategies and defensive recommendations.
**Example prompts:**
```text
Search for the latest APT29 advisories from CISA and Mandiant.
```
```text
What is the CVSS score and patch status for CVE-2021-36934?
```
```text
Find recent technical analyses of LokiBot stealer variants.
```
## Report Finder
Fleet can locate, download, and convert security reports into a readable format for analysis and further processing.
### Supported Report Types
- Vendor threat reports (Mandiant, CrowdStrike, Microsoft, Recorded Future)
- Government advisories (CISA, FBI, NSA joint advisories)
- APT campaign analyses
- CVE advisories and technical details
- Malware family analyses
- Industry-specific threat assessments
### Process
Fleet searches for reports matching your criteria, downloads them, and converts them to markdown format for easy reading. The original files are also saved to the workspace.
**Example prompts:**
```text
Find and download the latest Mandiant report on APT29 techniques.
```
```text
Download the CISA advisory for CVE-2024-XXXXX.
```
## MITRE ATT&CK Mapping
All Fleet analysis findings are mapped to the MITRE ATT&CK framework. This provides standardized context for understanding threats:
- **Tactics** -- the adversary's goals (Initial Access, Execution, Persistence, Privilege Escalation, Defense Evasion, Credential Access, Discovery, Lateral Movement, Collection, Command and Control, Exfiltration, Impact).
- **Techniques and sub-techniques** -- the specific methods used to achieve each goal (e.g., T1059.001 PowerShell, T1055.012 Process Hollowing, T1053.005 Scheduled Task).
ATT&CK mappings appear in:
- Malware analysis reports
- Document analysis results
- Network forensics findings
- Detection rule metadata
- Threat intelligence packages
**Example prompt:**
```text
Analyze this binary and map all identified capabilities to MITRE ATT&CK techniques.
```
## Output Formats
Fleet produces threat intelligence outputs in multiple formats to suit different use cases:
| Format | Best For | Description |
|---|---|---|
| Markdown report | Human reading | Observables organized by type with enrichment results and risk scores |
| Text report | Quick triage | Flat list sorted by risk score for rapid prioritization |
| STIX 2.1 bundle (JSON) | Machine consumption | Full structured intelligence with all enrichment data |
| YARA rules | File scanning | Detection rules generated directly from enriched observables |
**Example prompt:**
```text
Extract observables from this URL in full mode. Give me a markdown report and also generate a STIX bundle.
```
## End-to-End Workflow Example
A typical threat intelligence workflow in Fleet:
1. **You:** "Process this APT29 threat report and build a detection package."
2. **Fleet:** extracts all observables from the report (IPs, domains, URLs, hashes, file paths, registry keys).
3. **Fleet:** enriches each observable with reputation data, risk scores, and web intelligence.
4. **Fleet:** converts enriched observables to a STIX 2.1 bundle.
5. **Fleet:** maps all TTPs to MITRE ATT&CK and creates a technique heat map.
6. **Fleet:** searches for supplementary advisories to ensure coverage of the latest indicators.
7. **Fleet:** generates detection rules: Sigma for log-based detection, YARA for file scanning, osquery for endpoint state.
8. **Fleet:** produces an executive threat briefing with IOC table, ATT&CK mapping, detection rules, and recommended defensive actions.
9. **Fleet:** saves all outputs to the workspace for download and distribution.
## Limitations
- Enrichment quality depends on the availability and coverage of external intelligence sources. Some newly registered domains or recently created infrastructure may not yet appear in reputation databases.
- Web search results reflect publicly available information. Classified or restricted intelligence sources are not accessible.
- STIX 2.1 bundle generation follows the OASIS standard. Custom STIX extensions are not supported.
---
# UI Guide
> Source: https://kb.binalyze.ai/fleet/ui-guide/index.html
## Layout Overview

Fleet's interface is organized into three main areas:
| Area | Purpose |
|---|---|
| **Sidebar** | Navigation, chat history, integrations, user menu |
| **Header** | Breadcrumbs, global search, theme toggle, view controls |
| **Content area** | The main workspace where conversations, settings, and other views are displayed |
On desktop, the sidebar is always visible and can be collapsed to maximize the content area. On mobile, the sidebar opens as a slide-out panel when triggered from the header.
The content area adapts based on the current view. During a conversation, it can be split into resizable panels for the chat, browser, and terminal/workspace side by side.
## Home Screen
The home screen is the first view you see after logging in. It serves as the starting point for all new conversations.
### Quickstart Cards

The center of the home screen displays a library of quickstart cards organized by category (Threat Hunting, Malware Analysis, Reverse Engineering, Phishing Investigation, Detection Engineering, DFIR and Investigation, Network Forensics, Steganography). Each card shows a title and brief description of the workflow it initiates.
Cards are paginated when there are more than fit on screen. Use the navigation controls to browse categories.
Clicking a card pre-fills the composer with a ready-to-use prompt and, where applicable, attaches a sample file. You can modify the prompt or replace the attachment before sending.
See [Quickstarts](../features/quickstarts/) for the full list of available cards.
### Composer

Below the quickstart cards is the main composer -- a text input where you type your prompt. The composer on the home screen is in its expanded form, giving you full space to write detailed requests.
You can attach files by:
- Clicking the attachment button in the composer
- Dragging and dropping files anywhere onto the home screen (a drop overlay appears to confirm)
The composer also provides:
- **Voice input** -- dictate your prompt using the microphone button
- **Sound toggle** -- enable or disable completion sounds
- **Mode selector** -- choose the assistant mode (when multiple modes are available)
Press **Enter** to send the prompt and start a new conversation. Fleet creates a new session and navigates to the conversation view.
## Conversation View
The conversation view is where you interact with Fleet during an active session. It displays the full message history and provides the composer for follow-up messages.
### Message Stream

Messages appear in chronological order, scrolling down as the conversation progresses:
- **Your messages** -- displayed with your text and any attached files
- **Fleet's responses** -- displayed with structured output including text, code blocks, tables, and generated files
- **Reasoning blocks** -- collapsible sections showing Fleet's thought process and tool selection logic (click to expand or collapse)
- **Tool outputs** -- results from specific tools Fleet used during analysis, displayed with headers identifying the tool and its output
- **Interactive prompts** -- when Fleet needs input from you mid-analysis, it presents structured prompts (confirmation buttons, single-choice options, multi-select lists, or free-text fields)
- **Error messages** -- dismissible banners at the bottom of the chat area if something goes wrong
When Fleet is actively working, a loading indicator shows progress. You can observe the analysis in real time as results stream in.
### Scroll and Search
For long conversations:
- A **scroll-to-bottom** button appears when you scroll up, letting you jump back to the latest message
- **In-thread search** (keyboard shortcut) opens a search bar at the top of the conversation. Type to find text within the current session, with match navigation (previous/next) to jump between results
### Compact Composer
In the conversation view, the composer switches to a compact form at the bottom of the message stream. It provides the same capabilities as the home screen composer (text input, attachments, voice, mode selector) plus:
- **Stop button** -- abort the current generation if Fleet is still working
- **Usage indicator** -- shows token usage when relevant
## Sidebar

The sidebar is the primary navigation element, always accessible on the left side of the screen.
### Top Section
- **Logo** -- clicking the logo returns to the home screen
- **Collapse/expand control** -- toggle the sidebar width on desktop. When collapsed, only icons are visible; hovering reveals labels
- **New chat button** -- start a fresh conversation (keyboard shortcut available)
### Integrations
A dedicated section listing configured integrations (such as AIR). Clicking an integration navigates to its configuration page.
### Chat History
All previous conversations are listed below the integrations section, grouped chronologically. Each entry shows the conversation title (auto-generated from the first message or manually renamed).
Right-clicking or using the menu on a conversation entry provides:
- **Rename** -- change the conversation title
- **Delete** -- remove the conversation (with confirmation)
Active conversations show a busy indicator when Fleet is currently working.
### Footer
- **Admin** -- visible only to users with administrator privileges; links to the admin dashboard
- **Documentation** -- links to this knowledge base
- **Support** -- links to Binalyze support
- **Feedback** -- opens a feedback panel where you can submit product feedback directly
### User Menu
At the bottom of the sidebar, your avatar and email are displayed. Clicking opens a menu with:
- **Settings** -- navigate to the settings pages
- **Billing** -- navigate to usage and plan information
- **Log out** -- end your session
## Header
The header bar runs across the top of the content area.
### Breadcrumbs
On pages with navigation depth (settings, integrations, admin), breadcrumbs show your current location and allow quick navigation to parent pages.
### Global Search

A search/command palette accessible via keyboard shortcut. It provides:
- **Chat search** -- find previous conversations by content
- **Navigation** -- jump to settings, integrations, or other pages
- **Recent items** -- quick access to recently viewed conversations
### Theme Toggle
Switch between **light mode** and **dark mode**. The preference persists across sessions. Fleet's interface, including logos and images, adapts to the selected theme.
### View Selector
Available during conversations, the view selector controls which panels are visible in the content area:
| View | What It Shows |
|---|---|
| **Chat only** | Full-width conversation |
| **Chat + Browser** | Conversation alongside the remote browser panel |
| **Chat + Terminal** | Conversation alongside the terminal/workspace panel |
| **Chat + Browser + Terminal** | All three panels side by side |
Panels can be resized by dragging the dividers between them. The layout persists within the session.
A keyboard shortcut cycles through the available view configurations.
## Workspace Panels
When enabled via the view selector, workspace panels appear alongside the conversation.

### Browser Panel
The browser panel displays Fleet's remote browser. When Fleet performs browser automation (navigating URLs, taking screenshots, interacting with web pages), the activity is visible here in real time.
You can observe:
- Page navigation and loading
- Element interactions (clicks, form fills)
- Screenshots being captured
- Files being downloaded
The browser runs in an isolated environment separate from your local machine and network. See [Browser Automation](../features/browser/) for capability details.
### Terminal Panel

The terminal panel provides interactive shell access to Fleet's analysis environment. It supports multiple tabs, so you can run several terminal sessions simultaneously.
Use the terminal to:
- Run commands directly in Fleet's Linux environment
- Inspect files generated during analysis
- Execute custom scripts or tools
- Verify analysis results manually
### File Workspace
The file workspace is accessible from the terminal panel area and provides a visual file tree of all files in Fleet's working directory. This includes:
- Files you uploaded as attachments
- Files Fleet generated during analysis (reports, detection rules, STIX bundles, deobfuscated code)
- Files downloaded from web pages or AIR endpoints
The file tree supports:
- **Browsing** -- navigate the directory structure
- **Preview** -- click a file to preview its contents
- **Download** -- download individual files or directories to your local machine
See [Workspace and Terminal](../features/workspace/) for full details.
## Settings

The settings area is accessible from the user menu in the sidebar. On desktop, a sub-navigation sidebar lists the available settings pages. On mobile, settings pages are accessible via horizontal tabs.
### General
General preferences for your Fleet experience:
- **Sound** -- enable or disable notification sounds when Fleet completes a task
- **Logging** -- configure the verbosity of operational logging
### Billing

Usage and plan information:
- **Monthly allowance** -- your organization's token allocation for the current billing cycle
- **Usage progress** -- how much of the allowance has been consumed
- **Cycle dates** -- when the current billing period started and when it resets
If your usage limit is reached, a dialog appears explaining the situation, showing cycle dates, and providing an option to request an extension from your administrator.
### Advanced
Account management:
- **Delete account** -- permanently delete your Fleet account and all associated data (requires confirmation)
## Integrations
The integrations hub is accessible from the sidebar. It displays cards for each available integration.
### AIR Integration
The AIR integration page provides a form to configure the API connection:
1. Enter your AIR API key
2. Fleet validates the connection
3. Once confirmed, Fleet can perform AIR operations (endpoint management, evidence acquisition, triage, interACT, investigation)
The integration can be reconfigured or removed at any time. Removing the integration disconnects Fleet from AIR but does not affect your AIR deployment.
See [AIR Integration](../features/air-integration/) for the full list of supported operations.
## Onboarding
First-time users see an onboarding wizard after their initial login. The wizard walks through:
1. **Storage setup** -- configure where Fleet stores session data
2. **Integration setup** -- optionally connect to AIR (can be skipped and configured later)
3. **Completion** -- confirmation that setup is complete, with a link to start using Fleet
The onboarding wizard appears only once. All settings configured during onboarding can be changed later from the settings and integrations pages.
## Dialogs and Overlays
Fleet uses several dialogs and overlays for specific interactions:

| Dialog | When It Appears |
|---|---|
| **Usage limit** | When your monthly token allowance is exhausted. Shows cycle dates and provides an option to request an extension. |
| **Usage feedback** | When usage passes a threshold. Optional rating and comment on your experience. |
| **Feedback sheet** | When you click "Feedback" in the sidebar footer. A side panel with a form to submit product feedback. |
| **Delete confirmation** | When deleting a conversation, integration, or account. Requires explicit confirmation before proceeding. |
| **Message feedback** | When providing feedback on a specific Fleet response (thumbs up/down with optional comment). |
| **Drag-and-drop overlay** | When dragging files over the chat area. A full-area highlight confirms the drop target. |
| **In-thread search** | When searching within a conversation. A semi-transparent overlay at the top of the message stream with match navigation. |
## Keyboard Shortcuts
Fleet provides keyboard shortcuts for common actions. Shortcut hints are displayed in the UI next to the relevant controls (sidebar buttons, search, view selector).
Key shortcuts include:
| Action | Where |
|---|---|
| New conversation | Sidebar, home screen |
| Global search / command palette | Header |
| In-thread search | Conversation view |
| Cycle view panels | Conversation view |
| Toggle sidebar | Any page |
Exact key combinations are displayed in the interface and may vary by operating system.
## Theme
Fleet supports two visual themes:

- **Light mode** -- light backgrounds with dark text
- **Dark mode** -- dark backgrounds with light text
Toggle the theme using the button in the header. The selected theme persists across sessions and applies to all interface elements, including logos, integration images, and the login screen.
## Admin Pages
Users with administrator privileges have access to additional pages via the "Admin" link in the sidebar footer.
### Dashboard

A high-level overview of the organization:
- Key metrics (active users, recent activity)
- Recent sign-ups
- Recent sign-ins
### Invitations
Manage user invitations for the organization:
- Draft and send invitations (individual or CSV bulk upload)
- View sent invitations with status (pending, accepted, expired)
- Resend or revoke invitations
### Logs
Operational log viewer for monitoring Fleet activity:
- Filter by time range
- Filter by component
- Refresh to see latest entries
### Environment Management
View and manage the execution environment:
- List active environments
- Restart environments when needed (with confirmation dialog)
---
# Security
> Source: https://kb.binalyze.ai/fleet/security/index.html
## Overview
Fleet is designed with a security-first architecture. Every aspect of the system, from how analysis runs to how credentials are handled to how external services are accessed, is built to protect your data, your infrastructure, and your privacy. This page details Fleet's security model.
## Isolated Execution Environment
All analysis Fleet performs runs in a secure, isolated environment that is completely separate from:
- **Your AIR deployment** -- Fleet's analysis environment has no access to AIR's internal systems, databases, or configuration.
- **Your network** -- Fleet cannot reach your internal network, VPNs, or any systems behind your firewall.
- **Your endpoints** -- Fleet cannot directly access managed endpoints. All endpoint interaction goes through the AIR API (see [AIR Integration](../features/air-integration/)).
- **Other users** -- each Fleet session runs in its own isolated environment. There is no cross-session or cross-user data access.
This isolation ensures that even if Fleet processes malicious files (which is its primary purpose), the malware cannot escape the analysis environment or affect any production systems.
## Credential Protection
Fleet implements a strict credential separation architecture to ensure that API keys and credentials are never exposed to the AI agent.
### How Credentials Are Protected
When you configure an API key for AIR integration or other services, the following protections apply:
1. **Encryption at rest** -- credentials are encrypted when stored. They are never saved in plaintext.
2. **Encryption in transit** -- all communication channels use encryption. Credentials are never transmitted in the clear.
3. **Secure gateway separation** -- all external API calls (to AIR, threat intelligence services, web search) are routed through a secure gateway. The AI agent sends requests to the gateway, which attaches the appropriate credentials on the other side. The AI agent never sees, handles, or has access to your actual API keys.
4. **No credential exposure** -- the architecture is designed so that even if the AI agent were instructed to extract credentials (which it is designed to refuse), it physically cannot access them. Credentials exist only within the secure gateway layer, outside the AI's execution boundary.
### What This Means in Practice
- You can safely use Fleet with your AIR API keys knowing they cannot be leaked through the AI conversation.
- External service credentials (for threat intelligence lookups, web searches) are handled the same way.
- No credentials appear in Fleet's conversation history, workspace files, or analysis outputs.
## Data Handling
### No Persistent Storage
Fleet does not retain customer data between sessions:
- **Session-scoped data** -- all files, analysis results, and conversation history exist only for the duration of the session.
- **No cross-session memory** -- Fleet does not remember previous conversations or retain context from past sessions.
- **No training on customer data** -- customer evidence and analysis results are not used to train AI models.
### Data in Transit
- All communication between your browser and Fleet uses encrypted channels.
- All communication between Fleet and AIR uses authenticated, encrypted API channels.
- All communication between Fleet and external services routes through the secure gateway with encryption.
### What Fleet Processes
Fleet processes only the data you explicitly provide:
- Files you upload as attachments
- Text you type in prompts
- Data retrieved from AIR when you request specific operations (endpoint information, evidence, triage results)
- Data retrieved from external services when you request threat intelligence lookups or web searches
Fleet does not independently scan your network, pull data from systems you have not connected, or access information beyond what you explicitly request.
## AI Communication Security
All AI model communication is routed through Binalyze-managed secure endpoints:
- **No direct third-party access** -- your data does not flow directly to AI model providers. All requests pass through Binalyze's secure infrastructure.
- **Request isolation** -- each request is processed independently. There is no shared context between different users or organizations.
- **Response filtering** -- Fleet is designed to refuse requests that attempt to extract system information, credentials, or internal configuration details.
## Administrative Controls
### Usage Limits
Administrators can configure monthly usage limits to control Fleet consumption:
- Token-based usage limits can be set per organization.
- When the limit is reached, Fleet becomes unavailable until the next billing cycle or until the limit is increased.
### Authentication
Fleet uses its own authentication system:
- Users log in to Fleet with their organization credentials.
- When AIR integration is configured, Fleet respects AIR's role-based access control for endpoint operations. Users can only perform AIR operations that their role permits.
- All Fleet interactions are associated with the authenticated user for audit purposes.
## Audit Trail
All Fleet interactions are logged and auditable:
- **Session history** -- which users accessed Fleet, when, and for how long.
- **Operations performed** -- what AIR operations Fleet executed on behalf of the user (endpoint queries, evidence acquisition, triage deployment, interACT commands).
- **File uploads** -- what files were uploaded for analysis.
Audit logs are available through Fleet's administration interface.
## Summary
| Security Control | Implementation |
|---|---|
| Execution isolation | Separate environment, no network/endpoint access |
| Credential protection | Encrypted storage, secure gateway separation, no AI exposure |
| Data persistence | None -- session-scoped only |
| Data in transit | Encrypted on all channels |
| AI communication | Routed through Binalyze-managed secure endpoints |
| Administrative control | Usage limits, organization management |
| Authentication | Fleet credentials, RBAC enforced for AIR operations |
| Audit | Full interaction logging |
---
# Troubleshooting
> Source: https://kb.binalyze.ai/fleet/troubleshooting/index.html
## Common Issues
| Issue | Possible Cause | Resolution |
|---|---|---|
| Cannot access Fleet | Internet connectivity issue or account not provisioned | Ensure your internet connection is active and that your organization administrator has provisioned your Fleet account. |
| Fleet not responding after opening | Internet connectivity issue or temporary service disruption | Verify your internet connection. If the connection is stable, wait a few minutes and try again. If the issue persists, contact Binalyze support. |
| "Usage limit reached" message | Monthly token limit has been exceeded | Contact your organization administrator to review or increase the monthly usage limit. Usage resets at the start of each billing cycle. |
| File upload fails | File exceeds size limits or upload was interrupted | Try uploading the file again. For very large files, consider splitting archives or uploading individual files rather than large bundles. |
| Analysis appears stuck or takes very long | Large or complex files require more processing time | Large binaries, memory dumps, and extensive PCAP files may take several minutes to analyze. If analysis does not progress after 5 minutes, try aborting and re-submitting with a more specific request. |
| Fleet does not recognize the file type | File has an unusual extension or is corrupted | Fleet identifies files by content, not extension. If the file is valid, try describing the file type in your prompt (e.g., "This is a PE executable renamed to .dat"). |
## AIR Integration Issues
| Issue | Possible Cause | Resolution |
|---|---|---|
| "Cannot connect to AIR" error | API integration is not configured or the API key is invalid | Open Fleet's settings and verify the AIR integration configuration. Ensure the API key is correct and has not expired. |
| Endpoint operations fail | Insufficient permissions for the configured API key | Verify that the API key has the necessary permissions for the requested operation (endpoint management, acquisition, triage, interACT). |
| Triage deployment fails | Target endpoint is offline or unreachable | Check the endpoint status in AIR. Ensure the endpoint is online and managed before deploying triage rules. |
| interACT commands time out | Endpoint is offline, under heavy load, or network latency is high | Verify endpoint connectivity in AIR. Try the command again. For long-running commands, consider breaking them into smaller operations. |
| Evidence acquisition does not start | Endpoint is offline, or another task is already running | Check the endpoint status and current task queue in AIR. Only one acquisition task can run on an endpoint at a time. |
## Detection Engineering Issues
| Issue | Possible Cause | Resolution |
|---|---|---|
| YARA rule does not compile | Syntax error in the rule | Ask Fleet to identify and fix the error: "This YARA rule won't compile. Fix it and explain what was wrong." |
| Sigma rule validation fails | Invalid logsource definition or detection logic | Ask Fleet to validate and fix the rule. Ensure the logsource product, category, and service fields match the Sigma specification. |
| Sigma conversion produces unexpected results | Rule uses features not supported by the target backend | Some Sigma detection features may not have direct equivalents in all SIEM query languages. Ask Fleet to simplify the detection logic for the target platform. |
| osquery query returns no results | Query references tables or columns not available on the target OS | Ask Fleet to validate the query against the osquery schema. Some tables are platform-specific (Windows-only, macOS-only, Linux-only). |
| YARA scan finds no matches | Rule is too specific, or the target files do not contain the expected patterns | Review the rule's string definitions and conditions. Ask Fleet to suggest broader patterns or alternative detection approaches. |
## Analysis Quality Issues
| Issue | Possible Cause | Resolution |
|---|---|---|
| Fleet's analysis seems incomplete | Request was too broad or ambiguous | Provide more specific instructions. Instead of "analyze this file," specify what you are looking for: "Perform static analysis on this PE binary, focusing on network indicators and persistence mechanisms." |
| Fleet asks too many questions before starting | Request is ambiguous and Fleet needs clarification | This is expected behavior. Fleet asks questions to avoid making wrong assumptions. Provide the requested context to proceed. |
| Generated detection rules have false positives | Rule logic is too broad | Ask Fleet to tighten the detection logic: "This Sigma rule is too noisy. Add filters to reduce false positives for legitimate administrative PowerShell usage." |
| Enrichment results are limited | Observable is too new or not yet indexed by intelligence sources | Newly registered domains, recently created infrastructure, and zero-day indicators may not yet appear in reputation databases. Fleet reports what is available and notes when data is limited. |
## Browser Automation Issues
| Issue | Possible Cause | Resolution |
|---|---|---|
| Browser cannot load a page | Target URL is unreachable, requires authentication, or blocks automated browsers | Verify the URL is accessible from a regular browser. Some sites block automated access or require CAPTCHA completion. Try a different approach or use Fleet's web search capability instead. |
| Browser interaction fails | Page structure changed or element is not interactable | Provide more specific instructions about which element to interact with. Try using CSS selectors or describing the element's visual position. |
| Downloaded file is empty or corrupted | Download was interrupted or the file requires authentication | Try the download again. If the file requires authentication, provide the necessary credentials in the prompt. |
## Getting Help
If you encounter an issue not covered here:
1. **Check the AIR Knowledge Base** -- Fleet can search the knowledge base for you: "Search the knowledge base for [your issue]."
2. **Contact Binalyze Support** -- reach out to support@binalyze.com with a description of the issue, including any error messages and the steps that led to the problem.
---
# FAQs
> Source: https://kb.binalyze.ai/fleet/faqs/index.html
## General
### What is Fleet?
Fleet is an AI-powered SOC Analyst developed by Binalyze. It assists security professionals with threat hunting, detection engineering, digital forensics, incident response, malware analysis, and threat intelligence. Fleet provides a conversational interface where you can upload evidence, ask questions, and receive structured analysis results.
### Who is Fleet designed for?
Fleet is built for SOC analysts, incident responders, threat hunters, detection engineers, and forensic investigators. Anyone who works with security operations and has a Fleet license can use it.
### What AI model does Fleet use?
Fleet uses advanced large language models to power its conversational interface and analytical reasoning. The specific model may be updated over time to provide the best results. Binalyze manages the AI infrastructure, and all communication is routed through Binalyze-managed secure endpoints.
### How does Fleet differ from a general-purpose AI chatbot?
Fleet is a specialized security analyst, not a general-purpose chatbot. It runs real DFIR tools, produces verifiable outputs (detection rules that compile, analysis reports with hashes and timestamps, STIX bundles that conform to the standard), and integrates directly with AIR for endpoint operations. When Fleet analyzes a binary, it performs actual static analysis with industry-standard tools. When it generates a YARA rule, it validates that the rule compiles and can scan files with it.
## Security and Privacy
### Is my data sent to third parties?
No customer evidence data is stored or shared externally. All analysis runs in a secure, isolated environment managed by Binalyze. AI communication is routed through Binalyze-managed secure endpoints. No customer data is used to train AI models.
### Are my API keys safe?
Yes. API keys and credentials configured for AIR integration are encrypted at rest and in transit. They are handled by a secure gateway that is architecturally separate from the AI agent. The AI agent never sees, handles, or has access to your actual API keys. See [Security](../security/) for full details.
### Can Fleet access my production systems?
Fleet operates in an isolated environment and cannot directly access your network, endpoints, or internal systems. It can interact with AIR endpoints only through the authenticated API integration you configure. All endpoint operations go through AIR's standard API with your configured permissions.
### Does Fleet retain data between sessions?
No. All data (files, analysis results, conversation history) exists only for the duration of the session. Fleet does not retain memory across separate conversations and does not store customer data persistently.
## Capabilities
### What file types can I upload to Fleet?
Fleet accepts any file type. Common formats include:
- **Executables:** PE (.exe, .dll), ELF, .NET assemblies, shellcode
- **Documents:** PDF, Word (.doc, .docx, .docm), Excel, PowerPoint, RTF, OLE
- **Archives:** ZIP, 7z, RAR, TAR, GZ (including password-protected)
- **Network captures:** PCAP, PCAPNG
- **Event logs:** EVTX, JSON, JSONL
- **Detection rules:** YARA (.yar), Sigma (.yml), osquery (.sql), Suricata (.rules)
- **Images:** PNG, JPG, GIF, BMP
- **Text:** TXT, CSV, MD, JSON, XML, HTML
- **Disk images:** RAW, E01, VMDK, VHD/VHDX
- **Memory dumps:** Raw memory dump files
### What detection rule formats does Fleet support?
Fleet supports four detection rule formats:
| Format | Capabilities |
|---|---|
| YARA | Generate, validate, fix, scan files |
| Sigma | Generate, validate, convert to Splunk SPL and Microsoft Sentinel KQL, test against EVTX and JSONL logs |
| osquery | Generate, validate syntax and column references |
| Suricata | Validate rule syntax |
### Can Fleet deploy detection rules to my endpoints?
Yes, when connected to AIR through the API integration. Fleet can deploy YARA, Sigma, and osquery rules to managed endpoints via AIR's triage feature. See [AIR Integration](../features/air-integration/) for details.
### What operating systems can Fleet analyze artifacts from?
Fleet can analyze artifacts from Windows, macOS, Linux, ChromeOS, and ESXi. The analysis environment itself runs Linux, but it includes tools capable of analyzing artifacts from all these platforms (PE analysis for Windows, plist parsing for macOS, ELF analysis for Linux, etc.).
### Can Fleet analyze password-protected archives?
Yes. Fleet automatically tries common malware analysis passwords (infected, malware, virus) when encountering password-protected archives. You can also provide the password in your prompt, or Fleet will ask you for it if the common passwords do not work.
### What threat intelligence outputs does Fleet produce?
Fleet produces threat intelligence in multiple formats:
- **Markdown reports** -- human-readable reports with observables organized by type, enrichment results, and risk scores
- **Text reports** -- flat lists sorted by risk score for quick triage
- **STIX 2.1 bundles** -- machine-readable structured intelligence with full enrichment data, importable into SIEM and TIP platforms
- **YARA rules** -- detection rules generated directly from enriched observables
## AIR Integration
### How do I connect Fleet to my AIR deployment?
In Fleet's settings, locate the AIR integration section and provide your AIR API key. Fleet validates the connection and confirms access. Once configured, Fleet can perform endpoint management, evidence acquisition, triage, interACT, and investigation operations.
### What AIR operations can Fleet perform?
Fleet can perform the following operations through AIR:
- **Endpoint management** -- list, search, isolate, remove isolation, tag, reboot
- **Case management** -- create, update, close cases
- **Evidence acquisition** -- trigger collection using built-in or custom acquisition profiles
- **Triage** -- deploy YARA, Sigma, and osquery rules to endpoints
- **interACT** -- execute remote commands, transfer files
- **Investigation** -- browse evidence, view DRONE findings, access Investigation Hub data
### Does Fleet respect AIR's role-based access control?
Yes. Fleet inherits the user's AIR session authentication and respects role-based access control. Users can only perform AIR operations that their assigned role permits.
## Usage
### Can I use Fleet offline?
No. Fleet requires an active internet connection and is available only in online mode.
### Is there a usage limit?
Usage is subject to monthly token limits that can be configured by your organization administrator. When the limit is reached, Fleet becomes unavailable until the next billing cycle or until the administrator increases the limit.
### What AIR version is required?
Fleet requires AIR version 4.41 or later.
### Do I need a separate license for Fleet?
Fleet is licensed separately. Contact Binalyze sales or your account representative for licensing details.
### How do I access Fleet?
Fleet is a standalone web application. Log in at your organization's Fleet URL with your credentials. No additional software installation is required.
### Can multiple users use Fleet simultaneously?
Yes. Each user gets their own isolated Fleet session. Multiple users can use Fleet concurrently without interfering with each other's work.
---
# URL Whitelist
> Source: https://kb.binalyze.ai/fleet/faqs/url-whitelist.html
Below is the list of domains/URLs that need to be whitelisted in your firewall for Fleet to work properly from a browser.
## Required
These are essential — Fleet will not function without them.
| Domain | Port | Reason |
| --- | --- | --- |
| `fleet.binalyze.ai` | 443 | The Fleet application (UI, API, auth) |
| `*.binalyze.ai` | 443 | Sandbox API (agent sessions, files, workspace) |
| `*.binalyze.ai` | 443 | Sandbox WebSocket (in-browser terminal, over WSS) |
| `*.r2.cloudflarestorage.com` | 443 | File attachment uploads via presigned URLs |
| `*.onkernel.com` | 8443 | Browser live-view (remote desktop stream) |
Plus at least one OAuth provider set, depending on which login method you use:
### Google login
| Domain | Port | Reason |
| --- | --- | --- |
| `accounts.google.com` | 443 | Google sign-in consent screen |
| `oauth2.googleapis.com` | 443 | Google OAuth token exchange |
### Microsoft login
| Domain | Port | Reason |
| --- | --- | --- |
| `login.microsoftonline.com` | 443 | Microsoft sign-in consent screen |
### LinkedIn login
| Domain | Port | Reason |
| --- | --- | --- |
| `www.linkedin.com` | 443 | LinkedIn sign-in consent screen |
| `api.linkedin.com` | 443 | LinkedIn OAuth token/profile exchange |
## Optional
Fleet works without these. The impact of blocking each one is noted.
| Domain | Port | Impact If Blocked |
| --- | --- | --- |
| `*.sentry.io` | 443 | Error reporting stops (no user-facing impact) |
| `lh3.googleusercontent.com` | 443 | Google profile avatars won't load (placeholder shown) |
| `media.licdn.com` | 443 | LinkedIn profile avatars won't load (placeholder shown) |
| `kb.binalyze.ai` | 443 | "Knowledge Base" sidebar link won't open (new tab only) |
| Binalyze corporate website | 443 | "Contact Support" link won't open (new tab only) |
| `cdn.skypack.dev` | 443 | Sandbox landing page animation won't load (cosmetic only) |
---
# Inventory of Third-Party Software Components
> Source: https://kb.binalyze.ai/general/licenses-open-source-software-list.html
| Dependency | Version | License | Description |
| --- | --- | --- | --- |
| github.com/binalyze/gora | v1.7.1-0.20250505155236-fb6215830195 | Apache-2.0 | Binalyze Go utilities and shared runtime components. |
| github.com/brianvoe/gofakeit/v6 | v6.24.0 | MIT | Fake data generator for testing and demos. |
| github.com/containerd/cgroups/v3 | v3.0.3 | Apache-2.0 | Linux cgroups management library. |
| github.com/elastic/go-sysinfo | v1.13.1 | Apache-2.0 | System and host information for Go. |
| github.com/gofrs/flock | v0.8.1 | BSD-3-Clause | File locking utility for Go. |
| github.com/nats-io/nats-server/v2 | v2.10.16 | Apache-2.0 | NATS messaging server. |
| github.com/pact-foundation/pact-go/v2 | v2.0.1 | MIT | Contract testing framework for services. |
| github.com/spf13/afero | v1.11.0 | Apache-2.0 | Filesystem abstraction for Go. |
| golang.org/x/exp | v0.0.0-20240716175740-e3f259677ff7 | BSD-3-Clause | Experimental Go packages. |
| golang.org/x/mod | v0.20.0 | BSD-3-Clause | Go module mechanics and parsing. |
| github.com/capnspacehook/taskmaster | v0.0.0-20210519235353-1629df7c85e9 | MIT | Task scheduling and orchestration helper. |
| github.com/rickb777/date | v1.14.2 | BSD-3-Clause | Date handling utilities. |
| github.com/PuerkitoBio/purell | v1.2.0 | BSD-3-Clause | URL normalization and sanitization. |
| cloud.google.com/go/storage | v1.43.0 | Apache-2.0 | Google Cloud Storage client library. |
| github.com/Azure/azure-pipeline-go | v0.2.3 | MIT | Azure Storage pipeline utilities. |
| github.com/Azure/azure-storage-blob-go | v0.15.0 | MIT | Azure Blob Storage client library. |
| github.com/alexmullins/zip | v0.0.0-20180717182244-4affb64b04d0 | MIT | ZIP encryption support for Go. |
| github.com/armon/go-socks5 | v0.0.0-20160902184237-e75332964ef5 | MIT | SOCKS5 proxy server library. |
| github.com/asalih/go-ewf | v0.0.0-20241030131659-cf494c40b8c0 | MIT | EWF (E01) forensic image support. |
| github.com/avast/retry-go/v3 | v3.1.1 | MIT | Retry helper for transient errors. |
| github.com/aws/aws-sdk-go-v2 | v1.27.0 | Apache-2.0 | AWS SDK for Go v2. |
| github.com/aws/aws-sdk-go-v2/config | v1.27.11 | Apache-2.0 | AWS SDK v2 configuration loader. |
| github.com/aws/aws-sdk-go-v2/credentials | v1.17.11 | Apache-2.0 | AWS SDK v2 credential providers. |
| github.com/aws/aws-sdk-go-v2/feature/s3/manager | v1.16.15 | Apache-2.0 | AWS SDK S3 transfer manager. |
| github.com/aws/aws-sdk-go-v2/service/s3 | v1.53.1 | Apache-2.0 | AWS S3 service client. |
| github.com/aws/aws-sdk-go-v2/service/transfer | v1.48.0 | Apache-2.0 | AWS Transfer Family service client. |
| github.com/aws/smithy-go | v1.20.2 | Apache-2.0 | Smithy runtime for AWS SDKs. |
| github.com/binalyze/bizip | v1.1.0 | Apache-2.0 | Binalyze ZIP handling utilities. |
| github.com/bmatcuk/doublestar/v4 | v4.7.1 | MIT | Glob matching with doublestar patterns. |
| github.com/cenkalti/backoff/v4 | v4.3.0 | MIT | Exponential backoff utilities. |
| github.com/containerd/cgroups | v1.1.0 | Apache-2.0 | Linux cgroups management library. |
| github.com/coreos/go-iptables | v0.8.0 | Apache-2.0 | Go bindings for iptables. |
| github.com/coreos/go-systemd/v22 | v22.5.0 | Apache-2.0 | Go bindings for systemd. |
| github.com/davecgh/go-spew | v1.1.1 | ISC | Deep pretty printing for Go values. |
| github.com/djherbis/times | v1.6.0 | MIT | File timestamp access helpers. |
| github.com/dustin/go-humanize | v1.0.1 | MIT | Human-friendly formatting utilities. |
| github.com/elastic/go-freelru | v0.16.0 | Apache-2.0 | LRU cache implementation. |
| github.com/elastic/gosigar | v0.14.3 | Apache-2.0 | System information and metrics. |
| github.com/fatih/color | v1.17.0 | MIT | Colored terminal output. |
| github.com/go-test/deep | v1.1.1 | MIT | Deep comparison utilities for tests. |
| github.com/godbus/dbus/v5 | v5.1.0 | BSD-2-Clause | D-Bus client library for Go. |
| github.com/golang/mock | v1.6.0 | Apache-2.0 | Mocking framework for Go. |
| github.com/google/go-cmp | v0.6.0 | BSD-3-Clause | Structural comparison for Go values. |
| github.com/google/gopacket | v1.1.19 | BSD-3-Clause | Packet parsing and crafting. |
| github.com/google/shlex | v0.0.0-20191202100458-e7afc7fbc510 | Apache-2.0 | Shell-like lexer and parser. |
| github.com/google/uuid | v1.6.0 | BSD-3-Clause | UUID generation and parsing. |
| github.com/gorilla/websocket | v1.5.1 | BSD-3-Clause | WebSocket client/server library. |
| github.com/hillu/go-yara/v4 | v4.3.4 | BSD-2-Clause | Go bindings for YARA. |
| github.com/hirochachacha/go-smb2 | v1.1.0 | BSD-2-Clause | SMB2 client library. |
| github.com/jeandeaual/go-locale | v0.0.0-20240204043739-672d8d016d9a | MIT | Locale detection utilities. |
| github.com/johannesboyne/gofakes3 | v0.0.0-20250106100439-5c39aecd6999 | MIT | Fake S3 server for testing. |
| github.com/judwhite/go-svc | v1.2.1 | MIT | Service management helpers. |
| github.com/kolesnikovae/go-winjob | v1.0.0 | MIT | Windows job object helpers. |
| github.com/mattn/go-ieproxy | v0.0.12 | MIT | Windows IE proxy settings. |
| github.com/mattn/go-isatty | v0.0.20 | MIT | TTY detection for Go. |
| github.com/mattn/go-runewidth | v0.0.16 | MIT | Rune width calculation for UI. |
| github.com/minio/sio | v0.4.1 | Apache-2.0 | Streaming encryption (SIO). |
| github.com/nats-io/nats.go | v1.38.0 | Apache-2.0 | NATS client library. |
| github.com/opencontainers/runtime-spec | v1.2.0 | Apache-2.0 | OCI runtime specification types. |
| github.com/ozanh/xio | v0.4.0 | MIT | Stream and IO utilities. |
| github.com/pdfcpu/pdfcpu | v0.8.0 | Apache-2.0 | PDF processing library. |
| github.com/pkg/sftp | v1.13.9 | BSD-2-Clause | SFTP client and server library. |
| github.com/prometheus/client_golang | v1.20.4 | Apache-2.0 | Prometheus metrics client. |
| github.com/rclone/ftp | v1.0.0-220913-160 | 0BSD | FTP backend for rclone. |
| github.com/schollz/progressbar/v3 | v3.14.2 | MIT | Terminal progress bar. |
| github.com/shirou/gopsutil/v3 | v3.24.5 | BSD-3-Clause | System and process information. |
| github.com/sirupsen/logrus | v1.9.3 | MIT | Structured logging for Go. |
| github.com/stretchr/testify | v1.11.1 | MIT | Test assertions and mocks. |
| github.com/urfave/cli/v2 | v2.27.5 | MIT | CLI framework for Go. |
| github.com/winlabs/gowin32 | v0.0.0-20240930213947-f504d7e14639 | Apache-2.0 | Windows API wrappers. |
| github.com/yusufpapurcu/wmi | v1.2.4 | MIT | WMI access for Go. |
| go.uber.org/goleak | v1.3.0 | MIT | Goroutine leak detector for tests. |
| go.uber.org/multierr | v1.11.0 | MIT | Error aggregation utilities. |
| go.uber.org/zap | v1.27.1 | MIT | High-performance logging. |
| golang.org/x/crypto | v0.33.0 | BSD-3-Clause | Cryptography extensions for Go. |
| golang.org/x/net | v0.35.0 | BSD-3-Clause | Networking extensions for Go. |
| golang.org/x/oauth2 | v0.21.0 | BSD-3-Clause | OAuth2 client library for Go. |
| golang.org/x/sync | v0.11.0 | BSD-3-Clause | Concurrency helpers for Go. |
| golang.org/x/sys | v0.30.0 | BSD-3-Clause | OS and syscall utilities. |
| golang.org/x/term | v0.29.0 | BSD-3-Clause | Terminal I/O utilities. |
| golang.org/x/text | v0.22.0 | BSD-3-Clause | Text processing and Unicode. |
| golang.org/x/time | v0.10.0 | BSD-3-Clause | Time utilities and rate limiting. |
| google.golang.org/api | v0.187.0 | BSD-3-Clause | Google APIs client library. |
| gopkg.in/natefinch/lumberjack.v2 | v2.2.1 | MIT | Log rolling file writer. |
| gopkg.in/yaml.v2 | v2.4.0 | Apache-2.0 | YAML parsing and emitting. |
| gopkg.in/yaml.v3 | v3.0.1 | Apache-2.0 | YAML parsing and emitting. |
| gorm.io/driver/sqlite | v1.5.3 | MIT | GORM SQLite driver. |
| gorm.io/gorm | v1.25.4 | MIT | GORM ORM for Go. |
| github.com/florianl/go-nfqueue | v1.3.1 | MIT | NFQUEUE bindings for Go. |
| github.com/josharian/native | v1.1.0 | MIT | Native byte-order helpers. |
| github.com/mdlayher/netlink | v1.6.0 | MIT | Netlink protocol library. |
| github.com/mdlayher/socket | v0.1.1 | MIT | Low-level socket helpers. |
| cloud.google.com/go | v0.115.0 | Apache-2.0 | Google Cloud Go client libraries. |
| cloud.google.com/go/auth | v0.6.1 | Apache-2.0 | Google Cloud authentication library. |
| cloud.google.com/go/auth/oauth2adapt | v0.2.2 | Apache-2.0 | OAuth2 adapter for GCP auth. |
| cloud.google.com/go/compute/metadata | v0.3.0 | Apache-2.0 | GCE metadata client. |
| cloud.google.com/go/iam | v1.1.8 | Apache-2.0 | Google Cloud IAM client. |
| github.com/VirusTotal/gyp | v0.9.0 | Apache-2.0 | YARA-related build utility. |
| github.com/aws/aws-sdk-go | v1.44.298 | Apache-2.0 | AWS SDK for Go v1. |
| github.com/aws/aws-sdk-go-v2/aws/protocol/eventstream | v1.6.2 | Apache-2.0 | AWS eventstream protocol support. |
| github.com/aws/aws-sdk-go-v2/feature/ec2/imds | v1.16.1 | Apache-2.0 | EC2 instance metadata client. |
| github.com/aws/aws-sdk-go-v2/internal/configsources | v1.3.7 | Apache-2.0 | AWS SDK internal config sources. |
| github.com/aws/aws-sdk-go-v2/internal/endpoints/v2 | v2.6.7 | Apache-2.0 | AWS SDK endpoint resolution. |
| github.com/aws/aws-sdk-go-v2/internal/ini | v1.8.0 | Apache-2.0 | AWS SDK INI parsing utilities. |
| github.com/aws/aws-sdk-go-v2/internal/v4a | v1.3.5 | Apache-2.0 | AWS SigV4a signing helpers. |
| github.com/aws/aws-sdk-go-v2/service/internal/accept-encoding | v1.11.2 | Apache-2.0 | AWS SDK internal encoding helper. |
| github.com/aws/aws-sdk-go-v2/service/internal/checksum | v1.3.7 | Apache-2.0 | AWS SDK checksum helpers. |
| github.com/aws/aws-sdk-go-v2/service/internal/presigned-url | v1.11.7 | Apache-2.0 | AWS SDK presigned URL helper. |
| github.com/aws/aws-sdk-go-v2/service/internal/s3shared | v1.17.5 | Apache-2.0 | AWS SDK S3 shared helpers. |
| github.com/aws/aws-sdk-go-v2/service/sso | v1.20.5 | Apache-2.0 | AWS SSO client. |
| github.com/aws/aws-sdk-go-v2/service/ssooidc | v1.23.4 | Apache-2.0 | AWS SSO OIDC client. |
| github.com/aws/aws-sdk-go-v2/service/sts | v1.28.6 | Apache-2.0 | AWS STS client. |
| github.com/beorn7/perks | v1.0.1 | MIT | Prometheus helper utilities. |
| github.com/cespare/xxhash/v2 | v2.3.0 | MIT | xxHash implementation. |
| github.com/cilium/ebpf | v0.11.0 | MIT | eBPF loading and management. |
| github.com/cpuguy83/go-md2man/v2 | v2.0.5 | MIT | Markdown to manpage converter. |
| github.com/docker/go-units | v0.5.0 | Apache-2.0 | Human-readable unit helpers. |
| github.com/elastic/go-windows | v1.0.1 | Apache-2.0 | Windows helpers for Elastic. |
| github.com/felixge/httpsnoop | v1.0.4 | MIT | HTTP handler instrumentation. |
| github.com/geoffgarside/ber | v1.1.0 | BSD-3-Clause | BER encoding/decoding. |
| github.com/go-logr/logr | v1.4.1 | Apache-2.0 | Logging interface for Go. |
| github.com/go-logr/stdr | v1.2.2 | Apache-2.0 | Standard log adapter for logr. |
| github.com/go-ole/go-ole | v1.2.6 | MIT | OLE/COM bindings for Go. |
| github.com/gogo/protobuf | v1.3.2 | BSD-3-Clause | Protobuf implementation. |
| github.com/golang/groupcache | v0.0.0-20210331224755-41bb18bfe9da | Apache-2.0 | Caching library for Go. |
| github.com/golang/protobuf | v1.5.4 | BSD-3-Clause | Legacy Protobuf implementation. |
| github.com/google/s2a-go | v0.1.7 | Apache-2.0 | S2A authentication for gRPC. |
| github.com/googleapis/enterprise-certificate-proxy | v0.3.2 | Apache-2.0 | Enterprise certificate proxy. |
| github.com/googleapis/gax-go/v2 | v2.12.5 | BSD-3-Clause | Google API extensions for Go. |
| github.com/hashicorp/errwrap | v1.0.0 | MPL-2.0-no-copyleft-exception | Error wrapping utilities. |
| github.com/hashicorp/go-multierror | v1.1.1 | MPL-2.0-no-copyleft-exception | Aggregate multiple errors. |
| github.com/hashicorp/logutils | v1.0.0 | MPL-2.0 | Log level filtering helpers. |
| github.com/hhrutter/lzw | v1.0.0 | BSD-3-Clause | LZW compression utilities. |
| github.com/hhrutter/tiff | v1.0.1 | BSD-3-Clause | TIFF image parsing. |
| github.com/jinzhu/inflection | v1.0.0 | MIT | Pluralization and inflection helpers. |
| github.com/jinzhu/now | v1.1.5 | MIT | Time helpers for GORM. |
| github.com/jmespath/go-jmespath | v0.4.0 | Apache-2.0 | JMESPath query language. |
| github.com/joeshaw/multierror | v0.0.0-20140124173710-69b34d4ec901 | MIT | Aggregate multiple errors. |
| github.com/klauspost/compress | v1.17.9 | Apache-2.0 | Compression algorithms. |
| github.com/kr/fs | v0.1.0 | BSD-3-Clause | Filesystem helpers. |
| github.com/lufia/plan9stats | v0.0.0-20211012122336-39d0f177ccd0 | BSD-3-Clause | Plan9 statistics bindings. |
| github.com/mattn/go-colorable | v0.1.13 | MIT | ANSI color support on Windows. |
| github.com/mattn/go-sqlite3 | v1.14.18 | MIT | SQLite driver for Go. |
| github.com/minio/highwayhash | v1.0.3 | Apache-2.0 | HighwayHash implementation. |
| github.com/mitchellh/colorstring | v0.0.0-20190213212951-d06e56a500db | MIT | ANSI color formatting. |
| github.com/munnerz/goautoneg | v0.0.0-20191010083416-a7dc8b61c822 | BSD-3-Clause | HTTP content negotiation helper. |
| github.com/nats-io/jwt/v2 | v2.5.8 | Apache-2.0 | JWT utilities for NATS. |
| github.com/nats-io/nkeys | v0.4.9 | Apache-2.0 | NATS key management. |
| github.com/nats-io/nuid | v1.0.1 | Apache-2.0 | Unique ID generator for NATS. |
| github.com/pkg/errors | v0.9.1 | BSD-2-Clause | Error wrapping utilities. |
| github.com/pmezard/go-difflib | v1.0.0 | BSD-3-Clause | Diff utilities for Go. |
| github.com/power-devops/perfstat | v0.0.0-20221212215047-62379fc7944b | MIT | Performance statistics on AIX. |
| github.com/prometheus/client_model | v0.6.1 | Apache-2.0 | Prometheus data model types. |
| github.com/prometheus/common | v0.55.0 | Apache-2.0 | Prometheus common utilities. |
| github.com/prometheus/procfs | v0.15.1 | Apache-2.0 | /proc filesystem parsing. |
| github.com/rickb777/plural | v1.2.2 | BSD-3-Clause | Pluralization utilities. |
| github.com/rivo/uniseg | v0.4.7 | MIT | Unicode grapheme cluster support. |
| github.com/russross/blackfriday/v2 | v2.1.0 | BSD-2-Clause | Markdown parser. |
| github.com/ryszard/goskiplist | v0.0.0-20150312221310-2dfbae5fcf46 | Apache-2.0 | Skip list implementation. |
| github.com/shoenig/go-m1cpu | v0.1.7 | MPL-2.0-no-copyleft-exception | Apple M1 CPU information. |
| github.com/stretchr/objx | v0.5.2 | MIT | Object mapping for tests. |
| github.com/tklauser/go-sysconf | v0.3.12 | BSD-3-Clause | Sysconf system parameters. |
| github.com/tklauser/numcpus | v0.6.1 | Apache-2.0 | CPU count utility. |
| github.com/xrash/smetrics | v0.0.0-20240521201337-686a1a2994c1 | MIT | String similarity metrics. |
| go.opencensus.io | v0.24.0 | Apache-2.0 | Observability and tracing. |
| go.opentelemetry.io/contrib/instrumentation/google.golang.org/grpc/otelgrpc | v0.49.0 | Apache-2.0 | OpenTelemetry instrumentation for gRPC. |
| go.opentelemetry.io/contrib/instrumentation/net/http/otelhttp | v0.49.0 | Apache-2.0 | OpenTelemetry instrumentation for HTTP. |
| go.opentelemetry.io/otel | v1.24.0 | Apache-2.0 | OpenTelemetry APIs and SDK. |
| go.opentelemetry.io/otel/metric | v1.24.0 | Apache-2.0 | OpenTelemetry metrics API. |
| go.opentelemetry.io/otel/trace | v1.24.0 | Apache-2.0 | OpenTelemetry tracing API. |
| go.shabbyrobe.org/gocovmerge | v0.0.0-20230507111327-fa4f82cfbf4d | BSD-2-Clause | Coverage profile merger. |
| golang.org/x/image | v0.18.0 | BSD-3-Clause | Image processing for Go. |
| golang.org/x/tools | v0.23.0 | BSD-3-Clause | Go tools and analysis. |
| google.golang.org/genproto | v0.0.0-20240624140628-dc46fd24d27d | Apache-2.0 | Generated Protobuf definitions. |
| google.golang.org/genproto/googleapis/api | v0.0.0-20240617180043-68d350f18fd4 | Apache-2.0 | Google APIs Protobuf definitions. |
| google.golang.org/genproto/googleapis/rpc | v0.0.0-20240624140628-dc46fd24d27d | Apache-2.0 | Google RPC Protobuf definitions. |
| google.golang.org/grpc | v1.64.0 | Apache-2.0 | gRPC framework for Go. |
| google.golang.org/protobuf | v1.34.2 | BSD-3-Clause | Protocol Buffers runtime. |
| howett.net/plist | v0.0.0-20181124034731-591f970eefbb | BSD-2-Clause-Views | Property list (plist) parsing. |
| github.com/binalyze/go-sqlite3 | v1.14.18 | MIT | Binalyze fork of SQLite driver. |
| github.com/binalyze/gosigar | v0.0.0-20240318094158-298adf8177d2 | Apache-2.0 | Binalyze fork of gosigar metrics. |
| github.com/curl/curl | 8.7.1 | curl | cURL data transfer library. |
| github.com/osquery/osquery | 5.8.2 | Apache-2.0 | osquery host instrumentation. |
| github.com/VirusTotal/yara | v4.5.1 | BSD-3-Clause | YARA rule engine. |
| github.com/Velocidex/ordereddict | v0.0.0-20250821063524-02dc06e46238 | Apache-2.0 | Ordered dictionary utility. |
| github.com/agnivade/levenshtein | v1.1.1 | MIT | Levenshtein distance implementation. |
| github.com/bube054/validatorgo | v0.3.1 | MIT | Validation helpers for Go. |
| github.com/coreos/go-iptables | v0.6.0 | Apache-2.0 | Go bindings for iptables. |
| github.com/creack/pty | v1.1.20 | MIT | Pseudo-terminal support. |
| github.com/docker/docker | v24.0.9+incompatible | Apache-2.0 | Docker engine and API client. |
| github.com/docker/go-connections | v0.4.0 | Apache-2.0 | Docker connection helpers. |
| github.com/fatih/color | v1.15.0 | MIT | Colored terminal output. |
| github.com/fatih/structs | v1.1.0 | MIT | Struct-to-map conversion utilities. |
| github.com/google/uuid | v1.3.0 | BSD-3-Clause | UUID generation and parsing. |
| github.com/jeandeaual/go-locale | v0.0.0-20220711133428-7de61946b173 | MIT | Locale detection utilities. |
| github.com/jedib0t/go-pretty/v6 | v6.4.6 | MIT | Table and text rendering utilities. |
| github.com/magefile/mage | v1.15.0 | Apache-2.0 | Make-like build tool in Go. |
| github.com/mitchellh/mapstructure | v1.5.0 | MIT | Decode maps into Go structs. |
| github.com/osquery/osquery-go | v0.0.0-20220706183148-4e1f83012b42 | MIT | osquery Go bindings. |
| github.com/pierrec/lz4/v4 | v4.1.22 | BSD-3-Clause | LZ4 compression library. |
| github.com/richardlehane/mscfb | v1.0.5-0.20240914004617-473ed4156da5 | Apache-2.0 | Microsoft CFB parser. |
| github.com/shirou/gopsutil/v3 | v3.23.3 | BSD-3-Clause | System and process information. |
| github.com/sirupsen/logrus | v1.9.4-0.20230606125235-dd1b4c2e81af | MIT | Structured logging for Go. |
| github.com/stretchr/testify | v1.8.4 | MIT | Test assertions and mocks. |
| gopkg.in/ini.v1 | v1.67.0 | Apache-2.0 | INI file parsing. |
| gorm.io/driver/sqlite | v1.4.4 | MIT | GORM SQLite driver. |
| gorm.io/gorm | v1.25.0 | MIT | GORM ORM for Go. |
| www.velocidex.com/golang/evtx | v0.2.0 | Apache-2.0 | Windows EVTX parser. |
| www.velocidex.com/golang/go-ntfs | v0.2.1-0.20250322152626-3c09d909d740 | Apache-2.0 | NTFS filesystem parser. |
| github.com/alecthomas/repr | v0.4.0 | MIT | Go value pretty-printer. |
| github.com/sergi/go-diff | v1.3.1 | MIT | Text diff and patch library. |
| github.com/Velocidex/pkcs7 | v0.0.0-20210524015001-8d1eee94a157 | MIT | PKCS#7 parsing utilities. |
| github.com/hashicorp/golang-lru | v0.5.4 | MPL-2.0-no-copyleft-exception | LRU cache implementation. |
| github.com/richardlehane/msoleps | v1.0.3 | Apache-2.0 | OLE property set parser. |
| github.com/shoenig/go-m1cpu | v0.1.5 | MPL-2.0 | Apple M1 CPU information. |
| github.com/yusufpapurcu/wmi | v1.2.2 | MIT | WMI access for Go. |
| www.velocidex.com/golang/binparsergen | v0.1.1-0.20201101234514-bbdb29f9ee31 | Apache-2.0 | Binary parser generator. |
| www.velocidex.com/golang/go-pe | v0.1.1-0.20211006062218-8f6d1ad6b2d5 | Apache-2.0 | PE (Portable Executable) parser. |
| github.com/Azure/go-ansiterm | v0.0.0-20210617225240-d185dfc1b5a1 | MIT | ANSI terminal support on Windows. |
| github.com/DATA-DOG/go-sqlmock | v1.5.2 | BSD-2-Clause | SQL driver mock for tests. |
| github.com/Microsoft/go-winio | v0.6.1 | MIT | Windows IO utilities. |
| github.com/Velocidex/json | v0.0.0-20220224052537-92f3c0326e5a | BSD-3-Clause | JSON helpers for Velocidex libs. |
| github.com/Velocidex/yaml/v2 | v2.2.8 | Apache-2.0 | YAML helpers for Velocidex libs. |
| github.com/apache/thrift | v0.18.1 | Apache-2.0 | Apache Thrift framework. |
| github.com/araddon/dateparse | v0.0.0-20210429162001-6b43995a97de | MIT | Date/time parsing library. |
| github.com/bmatcuk/doublestar/v4 | v4.6.0 | MIT | Glob matching with doublestar patterns. |
| github.com/brianvoe/gofakeit/v6 | v6.23.1 | MIT | Fake data generator for testing and demos. |
| github.com/davecgh/go-spew | v1.1.2-0.20180830191138-d8f796af33cc | ISC | Deep pretty printing for Go values. |
| github.com/docker/distribution | v2.8.2+incompatible | Apache-2.0 | Docker registry distribution library. |
| github.com/golang/snappy | v0.0.0-20180518054509-2e65f85255db | BSD-3-Clause | Snappy compression library. |
| github.com/lufia/plan9stats | v0.0.0-20230326075908-cb1d2100619a | BSD-3-Clause | Plan9 statistics bindings. |
| github.com/mattn/go-runewidth | v0.0.15 | MIT | Rune width calculation for UI. |
| github.com/olekukonko/tablewriter | v0.0.5 | MIT | ASCII table rendering. |
| github.com/opencontainers/go-digest | v1.0.0 | Apache-2.0 | OCI digest utilities. |
| github.com/opencontainers/image-spec | v1.1.0-rc2 | Apache-2.0 | OCI image specification types. |
| github.com/opencontainers/runtime-spec | v1.1.0-rc.2 | Apache-2.0 | OCI runtime specification types. |
| github.com/rogpeppe/go-internal | v1.11.0 | BSD-3-Clause | Internal Go tooling helpers. |
| github.com/stretchr/objx | v0.5.0 | MIT | Object mapping for tests. |
| github.com/tklauser/go-sysconf | v0.3.11 | BSD-3-Clause | Sysconf system parameters. |
| github.com/tklauser/numcpus | v0.6.0 | Apache-2.0 | CPU count utility. |
| github.com/winlabs/gowin32 | v0.0.0-20221003142512-0d265587d3c9 | Apache-2.0 | Windows API wrappers. |
| golang.org/x/mod | v0.17.0 | BSD-3-Clause | Go module mechanics and parsing. |
| golang.org/x/tools | v0.21.1-0.20240508182429-e35e4ccd0d2d | BSD-3-Clause | Go tools and analysis. |
| github.com/StackExchange/wmi | v1.2.1 | MIT | WMI access for Go. |
| github.com/danielpaulus/go-ios | v1.0.115 | MIT | iOS device communication. |
| github.com/elastic/beats | v7.6.2+incompatible | Elastic | Elastic Beats framework. |
| github.com/prometheus/procfs | v0.11.1 | Apache-2.0 | /proc filesystem parsing. |
| github.com/syndtr/goleveldb | v1.0.0 | BSD-2-Clause | LevelDB key-value store. |
| howett.net/plist | v1.0.0 | BSD-2-Clause-Views | Property list (plist) parsing. |
| github.com/elastic/sarama | v1.19.1-0.20200629123429-0e7b69039eec | MIT | Kafka client library. |
| github.com/andrewkroh/goja | v0.0.0-20190128172624-dd2ac4456e20 | MIT | JavaScript VM in Go. |
| https://github.com/microsoft/avml | 0.13.0 | MIT | Acquire Volatile Memory for Linux. |
| dario.cat/mergo | v1.0.0 | BSD-3-Clause | Merge maps and structs. |
| github.com/RackSec/srslog | v0.0.0-20180709174129-a4725f04ec91 | BSD-3-Clause | Syslog client library. |
| github.com/Velocidex/ordereddict | v0.0.0-20230909174157-2aa49cc5d11d | Apache-2.0 | Ordered dictionary utility. |
| github.com/alecthomas/kong | v0.8.0 | MIT | CLI parser and framework. |
| github.com/beevik/guid | v1.0.0 | BSD-2-Clause | GUID generation and parsing. |
| github.com/creack/pty | v1.1.21 | MIT | Pseudo-terminal support. |
| github.com/elastic/beats/v7 | v7.17.18 | Elastic | Elastic Beats framework. |
| github.com/elastic/go-libaudit/v2 | v2.3.1 | Apache-2.0 | Linux audit framework library. |
| github.com/go-playground/validator/v10 | v10.11.2 | MIT | Struct and field validation. |
| github.com/gobwas/glob | v0.2.3 | MIT | Glob matching utilities. |
| github.com/hillu/go-yara/v4 | v4.3.3-0.20240506134513-4f5cd55ec92e | BSD-2-Clause | Go bindings for YARA. |
| github.com/jackc/pgx/v5 | v5.5.4 | MIT | PostgreSQL driver and toolkit. |
| github.com/jessevdk/go-flags | v1.4.0 | BSD-3-Clause | CLI flag parser. |
| github.com/mxschmitt/golang-combinations | v1.1.0 | MIT | Combinatorics helpers. |
| github.com/ozanh/ugo | v0.5.0 | MIT | Embedded scripting engine. |
| github.com/stretchr/testify | v1.10.0 | MIT | Test assertions and mocks. |
| gorm.io/driver/postgres | v1.5.4 | MIT | GORM PostgreSQL driver. |
| gorm.io/driver/sqlite | v1.5.0 | MIT | GORM SQLite driver. |
| gorm.io/gorm | v1.25.5 | MIT | GORM ORM for Go. |
| github.com/jackc/pgpassfile | v1.0.0 | MIT | PostgreSQL password file parser. |
| github.com/jackc/pgservicefile | v0.0.0-20221227161230-091c0ba34f0a | MIT | PostgreSQL service file parser. |
| github.com/jackc/puddle/v2 | v2.2.1 | MIT | Connection pool implementation. |
| github.com/opencontainers/runtime-spec | v1.0.2 | Apache-2.0 | OCI runtime specification types. |
| google.golang.org/genproto/googleapis/rpc | v0.0.0-20230711160842-782d3b101e98 | Apache-2.0 | Google RPC Protobuf definitions. |
| github.com/Microsoft/go-winio | v0.6.0 | MIT | Windows IO utilities. |
| github.com/apache/thrift | v0.16.0 | Apache-2.0 | Apache Thrift framework. |
| github.com/armon/go-radix | v1.0.0 | MIT | Radix tree implementation. |
| github.com/dlclark/regexp2 | v1.1.7-0.20171009020623-7632a260cbaf | MIT | Regex engine compatible with .NET. |
| github.com/dop251/goja | v0.0.0-20200831102558-9af81ddcf0e1 | MIT | JavaScript VM in Go. |
| github.com/dop251/goja_nodejs | v0.0.0-20171011081505-adff31b136e6 | MIT | Node.js compatibility for Goja. |
| github.com/elastic/ecs | v1.12.0 | Apache-2.0 | Elastic Common Schema definitions. |
| github.com/elastic/elastic-agent-client/v7 | v7.0.0-20210727140539-f0905d9377f6 | Elastic | Elastic agent client library. |
| github.com/elastic/go-concert | v0.2.0 | Apache-2.0 | Config parsing helpers. |
| github.com/elastic/go-structform | v0.0.9 | Apache-2.0 | Struct-based data transformations. |
| github.com/elastic/go-sysinfo | v1.10.1 | Apache-2.0 | System and host information for Go. |
| github.com/elastic/go-ucfg | v0.8.6 | Apache-2.0 | Configuration library. |
| github.com/go-playground/locales | v0.14.1 | MIT | Locale data for validation. |
| github.com/go-playground/universal-translator | v0.18.1 | MIT | Translation utilities for validation. |
| github.com/go-sourcemap/sourcemap | v2.1.2+incompatible | BSD-2-Clause | Source map parsing. |
| github.com/gofrs/uuid | v4.4.0+incompatible | MIT | UUID generation for Go. |
| github.com/golang/protobuf | v1.5.3 | BSD-3-Clause | Legacy Protobuf implementation. |
| github.com/h2non/filetype | v1.1.1 | MIT | File type detection. |
| github.com/hashicorp/errwrap | v1.1.0 | MPL-2.0 | Error wrapping utilities. |
| github.com/leodido/go-urn | v1.2.1 | MIT | URN parsing and validation. |
| github.com/magefile/mage | v1.14.0 | Apache-2.0 | Make-like build tool in Go. |
| github.com/mattn/go-isatty | v0.0.18 | MIT | TTY detection for Go. |
| github.com/mitchellh/hashstructure | v1.1.0 | MIT | Hashing for Go structures. |
| github.com/pmezard/go-difflib | v1.0.1-0.20181226105442-5d4384ee4fb2 | BSD-3-Clause | Diff utilities for Go. |
| github.com/prometheus/procfs | v0.9.0 | Apache-2.0 | /proc filesystem parsing. |
| github.com/rcrowley/go-metrics | v0.0.0-20201227073835-cf1acfcdf475 | BSD-2-Clause-Views | Metrics collection library. |
| github.com/santhosh-tekuri/jsonschema | v1.2.4 | BSD-3-Clause | JSON Schema validation. |
| github.com/shoenig/go-m1cpu | v0.1.6 | MPL-2.0 | Apple M1 CPU information. |
| github.com/urso/diag | v0.0.0-20200210123136-21b3cc8eb797 | Apache-2.0 | Diagnostics helpers. |
| github.com/urso/sderr | v0.0.0-20210525210834-52b04e8f5c71 | Apache-2.0 | Structured error helpers. |
| go.elastic.co/apm | v1.11.0 | Apache-2.0 | Elastic APM agent. |
| go.elastic.co/ecszap | v1.0.1 | Apache-2.0 | ECS logging encoder for zap. |
| go.elastic.co/fastjson | v1.1.0 | Apache-2.0 | Fast JSON parser. |
| go.uber.org/atomic | v1.10.0 | MIT | Atomic primitives for Go. |
| go.uber.org/multierr | v1.9.0 | MIT | Error aggregation utilities. |
| go.uber.org/zap | v1.24.0 | MIT | High-performance logging. |
| golang.org/x/net | v0.27.0 | BSD-3-Clause | Networking extensions for Go. |
| google.golang.org/grpc | v1.58.3 | Apache-2.0 | gRPC framework for Go. |
| google.golang.org/protobuf | v1.31.0 | BSD-3-Clause | Protocol Buffers runtime. |
| https://github.com/golang/go | 1.20.14 | BSD-3-Clause | Go programming language source. |
| https://sqlite.org/index.html | 3.39.2 | blessing | SQLite embedded database. |
| https://github.com/libyal/libyal | 0 | Apache-2.0 | Digital forensics file format libs. |
| https://github.com/log2timeline/plaso | 20260119 | Apache-2.0 | Super timeline generation for digital forensics. |
| https://github.com/madler/zlib | 1.3.1 | Zlib | zlib compression library. |
| Binalyze.DFIR.Lab.Rules | $LATEST | DRL-1.1 | Binalyze DFIR Lab rule set. |
| https://github.com/reversinglabs/reversinglabs-yara-rules | 4f4f96735d4687c6ed9505ef7486eac52c7d9ec9 | MIT | ReversingLabs YARA rules. |
| https://github.com/SigmaHQ/sigma | a61da2863af985615da8f2873445b712c362b944 | DRL-1.1 | Sigma detection rule collection. |
| https://github.com/Yamato-Security/hayabusa-rules | d92bfadf31158c8f0e2e3dba9e9c7d824a2afaba | DRL-1.1 | Hayabusa rule collection. |
| https://github.com/FasterXML/jackson - com.fasterxml.jackson.core:jackson-annotations | 2.20 | Apache-2.0 | Jackson JSON annotations module. |
| https://github.com/FasterXML/jackson-core - com.fasterxml.jackson.core:jackson-core | 2.20.0 | Apache-2.0 | Jackson core JSON processor. |
| https://github.com/FasterXML/jackson - com.fasterxml.jackson.core:jackson-databind | 2.20.0 | Apache-2.0 | Jackson data binding module. |
| https://github.com/FasterXML/jackson-dataformats-text - com.fasterxml.jackson.dataformat:jackson-dataformat-csv | 2.20.0 | Apache-2.0 | Jackson CSV data format. |
| https://github.com/FasterXML/jackson-dataformats-text - com.fasterxml.jackson.dataformat:jackson-dataformat-yaml | 2.20.0 | Apache-2.0 | Jackson YAML data format. |
| https://github.com/FasterXML/jackson-modules-java8/jackson-datatype-jsr310 - com.fasterxml.jackson.datatype:jackson-datatype-jsr310 | 2.20.0 | Apache-2.0 | Jackson Java time module. |
| https://github.com/oshi/oshi/oshi-core - com.github.oshi:oshi-core | 6.8.1 | MIT | OS and hardware info library. |
| http://github.com/google/re2j - com.google.re2j:re2j | 1.8 | BSD-3-Clause | RE2 regular expression engine for Java. |
| https://commons.apache.org/proper/commons-cli/ - commons-cli:commons-cli | 1.9.0 | Apache-2.0 | Command-line parsing for Java. |
| https://commons.apache.org/proper/commons-io/ - commons-io:commons-io | 2.20.0 | Apache-2.0 | IO utilities for Java. |
| https://picocli.info - info.picocli:picocli | 4.7.7 | Apache-2.0 | CLI framework for Java. |
| https://picocli.info - info.picocli:picocli-shell-jline3 | 4.7.7 | Apache-2.0 | Picocli shell integration. |
| http://tess4j.sourceforge.net - net.sourceforge.tess4j:tess4j | 5.15.0 | Apache-2.0 | Tesseract OCR wrapper for Java. |
| https://commons.apache.org/proper/commons-text - org.apache.commons:commons-text | 1.13.0 | Apache-2.0 | Text processing for Java. |
| https://logging.apache.org/log4j/2.x/ - org.apache.logging.log4j:log4j-api | 2.25.3 | Apache-2.0 | Log4j API for Java. |
| https://logging.apache.org/log4j/2.x/ - org.apache.logging.log4j:log4j-core | 2.25.3 | Apache-2.0 | Log4j core implementation. |
| https://logging.apache.org/log4j/2.x/ - org.apache.logging.log4j:log4j-slf4j2-impl | 2.25.3 | Apache-2.0 | Log4j SLF4J binding. |
| https://tika.apache.org/ - org.apache.tika:tika-core | 3.2.3 | Apache-2.0 | Apache Tika core library. |
| https://tika.apache.org/tika-parsers/tika-parsers-standard/tika-parsers-standard-package/ - org.apache.tika:tika-parsers-standard-package | 3.2.3 | Apache-2.0 | Apache Tika standard parsers. |
| http://www.slf4j.org - org.slf4j:jcl-over-slf4j | 2.0.17 | MIT | Jakarta Commons Logging bridge. |
| http://www.slf4j.org - org.slf4j:jul-to-slf4j | 2.0.17 | MIT | java.util.logging bridge. |
| http://www.slf4j.org - org.slf4j:slf4j-api | 2.0.17 | MIT | SLF4J logging API. |
| vue-router | 3.1.3 | MIT | Vue.js routing library. |
| @fortawesome/free-solid-svg-icons | 6.2.1 | CC-BY-4.0 | Font Awesome solid icon set. |
| devextreme-vue | 21.2.4 | MIT | Vue wrappers for DevExtreme UI. |
| vue-i18n | 8.15.0 | MIT | Internationalization for Vue 2. |
| vue-multiselect | 2.1.6 | MIT | Multi-select dropdown for Vue 2. |
| devextreme | 21.2.4 | Apache-2.0 | DevExtreme UI component library. |
| papaparse | 5.3.2 | MIT | CSV parsing library for JS. |
| v-tooltip | 2.0.3 | MIT | Tooltip directives for Vue 2. |
| vue2-perfect-scrollbar | 1.5.56 | MIT | Perfect Scrollbar wrapper for Vue 2. |
| vue | 2.6.10 | MIT | Vue.js UI framework (v2). |
| canvas | 2.10.2 | MIT | Canvas API implementation for Node. |
| check-ip | 1.1.1 | MIT | IP address validation. |
| diff2html | 3.4.22 | MIT | Side-by-side diffs for the web. |
| jspdf | 2.5.1 | MIT | PDF generation in JavaScript. |
| jspdf-autotable | 3.5.28 | MIT | Table plugin for jsPDF. |
| bytes | 3.1.2 | MIT | Byte size parsing and formatting. |
| vue-json-viewer | 2.2.22 | MIT | JSON viewer for Vue. |
| vue-shortkey | 3.1.7 | MIT | Keyboard shortcuts for Vue. |
| vue-clipboard2 | 0.3.3 | MIT | Clipboard integration for Vue. |
| vue-ellipse-progress | 1.3.1 | MIT | Circular progress component for Vue. |
| vue-outside-events | 1.1.3 | MIT | Detect clicks outside components. |
| vuex | 3.1.2 | MIT | State management for Vue 2. |
| @fortawesome/vue-fontawesome | 2.0.9 | MIT | Font Awesome Vue components. |
| axios | 1.2.1 | MIT | Promise-based HTTP client. |
| dayjs | 1.11.7 | MIT | Lightweight date/time library. |
| lodash | 4.17.21 | CC0-1.0 | Utility functions for JavaScript. |
| vue-debounce | 3.0.2 | MIT | Debounce helpers for Vue. |
| @fortawesome/fontawesome-svg-core | 6.2.1 | CC-BY-4.0 | Font Awesome SVG core. |
| @fortawesome/free-brands-svg-icons | 6.2.1 | CC-BY-4.0 | Font Awesome brands icon set. |
| humanize-duration | 3.27.3 | Unlicense | Human-readable duration formatting. |
| js-search | 2.0.0 | MIT | Client-side search indexing. |
| https://github.com/nodejs/node/tree/main | 20.16 | ISC | Node.js JavaScript runtime. |
| cookie-parser | 1.4.6 | MIT | Cookie parsing for Express. |
| ldapjs | 3.0.4 | MIT | LDAP client and server for Node. |
| qrcode | 1.5.4 | MIT | QR code generation. |
| @aws-sdk/lib-storage | 3.957.0 | Apache-2.0 | AWS SDK v3 S3 upload helpers. |
| ajv | 8.17.1 | MIT | JSON Schema validator. |
| sift | 17.1.3 | MIT | MongoDB-style object filtering. |
| @nestjs/core | 11.1.10 | MIT | NestJS core framework. |
| cli-color | 2.0.4 | ISC | Terminal color formatting. |
| @nestjs/serve-static | 5.0.4 | MIT | Static asset support for NestJS. |
| combined-stream2 | 1.1.2 | WTFPL | Combined stream utility. |
| tinycolor2 | 1.6.0 | MIT | Color manipulation library. |
| winston | 3.19.0 | MIT | Logging library for Node.js. |
| @amplitude/analytics-node | 1.5.28 | MIT | Amplitude analytics for Node. |
| @nestjs/platform-express | 11.1.10 | MIT | Express platform adapter for NestJS. |
| fast-csv | 5.0.5 | MIT | CSV parsing and formatting. |
| @aws-sdk/client-ec2 | 3.957.0 | Apache-2.0 | AWS EC2 client (SDK v3). |
| @nestjs/websockets | 11.1.10 | MIT | WebSocket support for NestJS. |
| cron-parser | 5.4.0 | MIT | Cron expression parser. |
| node-stream-zip | 1.15.0 | MIT | ZIP reading library for Node. |
| syslog-client | 1.1.1 | MIT | Syslog client for Node.js. |
| @google-cloud/storage | 7.18.0 | Apache-2.0 | Google Cloud Storage client for Node. |
| @nestjs/passport | 11.0.5 | MIT | Passport integration for NestJS. |
| @swc/helpers | 0.5.17 | Apache-2.0 | SWC runtime helpers. |
| archiver-zip-encrypted | 2.0.0 | MIT | Encrypted ZIP support for archiver. |
| ftp | 0.3.10 | MIT | FTP client for Node.js. |
| http-proxy-middleware | 3.0.5 | MIT | Proxy middleware for Node.js. |
| @slack/web-api | 7.13.0 | MIT | Slack Web API client. |
| class-validator | 0.14.1 | MIT | Decorator-based validation for TS. |
| glob | 11.0.3 | ISC | Glob matching for Node.js. |
| countries-and-timezones | 3.8.0 | MIT | Country/timezone dataset. |
| dt-sql-parser | 4.0.0-beta.3.2 | MIT | SQL parser utility. |
| path-to-regexp | 8.2.0 | MIT | Express-style path matching. |
| @nestjs/bull | 11.0.4 | MIT | Bull queue integration for NestJS. |
| @nestjs/typeorm | 11.0.0 | MIT | TypeORM integration for NestJS. |
| archiver | 7.0.1 | MIT | Archive creation for Node.js. |
| dompurify | 3.3.1 | Apache-2.0 | HTML sanitization library. |
| range_check | 2.0.4 | BSD-1-Clause | IP range checking. |
| systeminformation | 5.27.16 | MIT | System info for Node.js. |
| @aws-sdk/client-s3 | 3.957.0 | Apache-2.0 | AWS S3 client (SDK v3). |
| bson | 4.7.0 | Apache-2.0 | BSON parser/serializer. |
| ioredis | 5.8.2 | MIT | Redis client for Node.js. |
| @aws-sdk/client-sts | 3.957.0 | Apache-2.0 | AWS STS client (SDK v3). |
| @sentry/node | 10.32.1 | MIT | Sentry SDK for Node.js. |
| inquirer | 12.9.6 | MIT | Interactive CLI prompts. |
| nodemailer | 7.0.12 | MIT-0 | Email sending for Node.js. |
| rxjs | 7.8.2 | Apache-2.0 | Reactive programming library. |
| @google-cloud/os-config | 4.3.1 | Apache-2.0 | GCP OS Config client. |
| @nestjs/jwt | 11.0.2 | MIT | JWT support for NestJS. |
| class-transformer | 0.5.1 | MIT | Object transformation for TS. |
| fluentvalidation-ts | 5.0.0 | Apache-2.0 | Validation library for TypeScript. |
| memfs | 4.48.1 | Apache-2.0 | In-memory filesystem. |
| node-forge | 1.3.3 | BSD-3-Clause | Cryptography tools for JavaScript. |
| @nestjs/cqrs | 11.0.3 | MIT | CQRS helpers for NestJS. |
| @nestjs/terminus | 11.0.0 | MIT | Health checks for NestJS. |
| async-mutex | 0.5.0 | MIT | Mutex and semaphore primitives. |
| nestjs-cls | 6.1.0 | MIT | CLS/ALS context for NestJS. |
| passport | 0.7.0 | MIT | Authentication middleware. |
| @aws-sdk/client-sns | 3.957.0 | Apache-2.0 | AWS SNS client (SDK v3). |
| @google-cloud/resource-manager | 6.2.1 | Apache-2.0 | GCP Resource Manager client. |
| bcrypt | 6.0.0 | MIT | Password hashing library. |
| launchdarkly-node-client-sdk | 3.3.1 | Apache-2.0 | LaunchDarkly SDK for Node. |
| nestjs-i18n | 10.6.0 | MIT | i18n support for NestJS. |
| pst-extractor | 1.11.0 | MIT | PST email archive extraction. |
| @aws-sdk/client-secrets-manager | 3.957.0 | Apache-2.0 | AWS Secrets Manager client. |
| bull | 4.16.3 | MIT | Redis-backed job queue. |
| class-validator-jsonschema | 5.0.2 | MIT | JSON Schema from validators. |
| json-logic-js | 2.0.5 | MIT | JSON logic rule engine. |
| pg-query-stream | 4.10.3 | MIT | Streamed PostgreSQL queries. |
| @azure/arm-compute | 22.4.0 | MIT | Azure Compute management SDK. |
| ua-parser-js | 1.0.38 | MIT | User-agent parsing. |
| @grpc/grpc-js | 1.14.3 | Apache-2.0 | gRPC implementation for Node. |
| @nestjs/platform-ws | 11.1.10 | MIT | WebSocket platform for NestJS. |
| axios | 1.13.2 | MIT | Promise-based HTTP client. |
| crypto-js | 4.2.0 | MIT | Crypto utilities for JavaScript. |
| pg | 8.16.3 | MIT | PostgreSQL client for Node.js. |
| tunnel | 0.0.6 | MIT | HTTP/HTTPS tunneling. |
| cookie | 1.1.1 | MIT | Cookie parsing and serialization. |
| puppeteer | 24.34.0 | Apache-2.0 | Headless Chrome automation. |
| @aws-sdk/util-stream-node | 3.374.0 | Apache-2.0 | AWS SDK stream utilities. |
| @azure/arm-network | 34.0.0 | MIT | Azure Network management SDK. |
| base64-stream | 1.0.0 | MIT | Base64 encode/decode streams. |
| mongodb | 4.13.0 | Apache-2.0 | MongoDB driver for Node.js. |
| nats | 2.29.3 | Apache-2.0 | NATS client for Node.js. |
| pg-connection-string | 2.9.1 | MIT | PostgreSQL connection string parser. |
| typeorm | 0.3.14 | MIT | TypeORM for Node/TypeScript. |
| @aws-sdk/client-ssm | 3.957.0 | Apache-2.0 | AWS SSM client (SDK v3). |
| @aws-sdk/client-device-farm | 3.957.0 | Apache-2.0 | AWS Device Farm client. |
| @azure/arm-subscriptions | 5.1.0 | MIT | Azure Subscriptions management SDK. |
| jsdom | 26.1.0 | MIT | DOM implementation for Node.js. |
| @nestjs/common | 11.1.10 | MIT | NestJS common utilities. |
| @nestjs/swagger | 11.2.3 | MIT | OpenAPI/Swagger for NestJS. |
| @node-saml/passport-saml | 5.1.0 | MIT | SAML strategy for Passport. |
| redis-semaphore | 5.6.2 | MIT | Redis-backed semaphores. |
| reflect-metadata | 0.2.2 | Apache-2.0 | Metadata reflection API. |
| argparse | 2.0.1 | PSF-2.0 | Command-line argument parser. |
| passport-jwt | 4.0.1 | MIT | JWT strategy for Passport. |
| speakeasy | 2.0.0 | MIT | TOTP/HOTP two-factor tokens. |
| uuid | 13.0.0 | MIT | UUID generation for JS. |
| openid-client | 5.6.5 | MIT | OpenID Connect client. |
| @google-cloud/compute | 6.6.0 | Apache-2.0 | GCP Compute Engine client. |
| better-sqlite3 | 12.5.0 | MIT | SQLite bindings for Node.js. |
| body-parser | 2.2.1 | MIT | HTTP body parsing middleware. |
| dayjs | 1.11.19 | MIT | Lightweight date/time library. |
| dotenv | 16.5.0 | BSD-2-Clause | Load environment variables from .env. |
| helmet | 8.0.0 | MIT | HTTP security headers middleware. |
| typeorm-naming-strategies | 4.1.0 | MIT | Naming strategies for TypeORM. |
| ajv-errors | 3.0.0 | MIT | Custom AJV error messages. |
| handlebars | 4.7.8 | MIT | Handlebars templating engine. |
| ipaddr.js | 2.2.0 | MIT | IP address manipulation. |
| ssh2-sftp-client | 12.0.1 | Apache-2.0 | SFTP client for Node.js. |
| @azure/identity | 4.13.0 | MIT | Azure identity and auth SDK. |
| knex | 3.0.1 | MIT | SQL query builder for Node. |
| pg-cursor | 2.15.3 | MIT | PostgreSQL cursor support. |
| https://www.postgresql.org/ | 15 | PostgreSQL License | PostgreSQL database server. |
| https://redis.io/ | 7.4.6 | SSPL-1.0 | Redis in-memory datastore. |
| https://nats.io/ | 2.10.14 | Apache-2.0 | NATS messaging system. |
| https://nginx.org/ | 1.23.3 | BSD-2-Clause | NGINX web server and reverse proxy. |
| https://github.com/nodejs/node | 22.19.0 | ISC | Node.js JavaScript runtime. |
| https://github.com/nestjs/nest | 11.0 | MIT | NestJS backend framework. |
| https://www.docker.com/ | 20.10.8 | Apache-2.0 | Docker container platform. |
| vue | 3.5.25 | MIT | Vue.js UI framework (v3). |
| vue3-snotify | 1.0.0 | MIT | Notification library for Vue 3. |
| vue-sonner | 2.0.9 | MIT | Toast notifications for Vue 3. |
| clipboard | 2.0.11 | MIT | Clipboard utilities for JS. |
| vue-echarts | 7.0.3 | MIT | ECharts wrapper for Vue. |
| vue-flatpickr-component | 11.0.3 | MIT | Flatpickr date picker for Vue. |
| shell-quote | 1.8.3 | MIT | Shell command parsing. |
| vue3-json-viewer | 2.3.0 | MIT | JSON viewer for Vue 3. |
| @fortawesome/fontawesome-svg-core | 6.6.0 | CC-BY-4.0 | Font Awesome SVG core. |
| cron-parser | 5.3.1 | MIT | Cron expression parser. |
| monaco-textmate | 3.0.1 | MIT | TextMate grammar support for Monaco. |
| path-browserify | 1.0.1 | MIT | Browser-friendly path utilities. |
| class-validator | 0.14.2 | MIT | Decorator-based validation for TS. |
| getopts | 2.3.0 | MIT | CLI argument parser. |
| jwt-decode | 4.0.0 | MIT | Decode JWTs in the browser. |
| lodash-es | 4.17.21 | CC0-1.0 | ES module build of Lodash. |
| @amplitude/analytics-browser | 2.32.0 | MIT | Amplitude analytics for web. |
| vue-advanced-cropper | 2.8.9 | MIT | Image cropping for Vue. |
| floating-vue | 5.2.2 | MIT | Tooltip/popover for Vue 3. |
| highlight.js | 11.11.1 | BSD-3-Clause | Syntax highlighting library. |
| pretty-bytes | 7.0.1 | MIT | Human-readable byte formatting. |
| re2js | 1.2.0 | MIT | RE2 regex engine for JS. |
| slugify | 1.6.6 | MIT | Slug generation for text. |
| tiny-emitter | 2.1.0 | MIT | Tiny event emitter. |
| @azure/storage-blob | 12.29.1 | MIT | Azure Blob Storage SDK. |
| devextreme | 24.1.5 | DevExpress | DevExtreme UI component library. |
| markdown-it | 14.0.0 | MIT | Markdown parser for JS. |
| monaco-editor | 0.52.2 | MIT | Monaco code editor. |
| vue3-shortkey | 4.0.0 | MIT | Keyboard shortcuts for Vue 3. |
| devextreme-vue | 24.1.5 | MIT | Vue wrappers for DevExtreme UI. |
| echarts | 5.6.0 | Apache-2.0 | Apache ECharts visualization. |
| onigasm | 2.2.5 | MIT | Oniguruma regex engine for JS. |
| monaco-editor-textmate | 4.0.0 | MIT | TextMate grammar for Monaco. |
| papaparse | 5.5.3 | MIT | CSV parsing library for JS. |
| vue-router | 4.5.1 | MIT | Vue.js routing library. |
| vue-wait | 1.5.3 | MIT | Loading state management for Vue. |
| @vue-flow/core | 1.48.0 | MIT | Vue Flow diagram components. |
| d3 | 7.8.5 | 0BSD | D3 data visualization library. |
| humanize-duration | 3.33.2 | Unlicense | Human-readable duration formatting. |
| js-logger | 1.6.1 | MIT | Logging for JavaScript. |
| @fortawesome/free-brands-svg-icons | 6.6.0 | CC-BY-4.0 | Font Awesome brands icon set. |
| @fortawesome/free-regular-svg-icons | 6.6.0 | CC-BY-4.0 | Font Awesome regular icon set. |
| js-cookie | 3.0.5 | MIT | Cookie helper library. |
| pako | 2.0.3 | MIT | zlib port for JavaScript. |
| vue-debounce | 5.0.1 | MIT | Debounce helpers for Vue. |
| vue-i18n | 11.1.11 | MIT | Internationalization for Vue 2. |
| @fortawesome/vue-fontawesome | 3.1.2 | MIT | Font Awesome Vue components. |
| @vuepic/vue-datepicker | 10.0.0 | MIT | Date picker for Vue. |
| compare-versions | 6.1.1 | MIT | Semantic version comparison. |
| vue-multiselect | 3.0.0 | MIT | Multi-select dropdown for Vue 2. |
| vuex | 4.1.0 | MIT | State management for Vue 2. |
| @vue/compiler-sfc | 3.5.25 | MIT | Vue single-file component compiler. |
| interactjs | 1.10.27 | MIT | Drag, resize, and gestures. |
| userflow.js | 2.13.0 | MIT | In-app user guidance and tours. |
| vuedraggable | 4.1.0 | MIT | Drag-and-drop for Vue. |
| @fortawesome/free-solid-svg-icons | 6.6.0 | CC-BY-4.0 | Font Awesome solid icon set. |
| @vueuse/components | 10.5.0 | MIT | VueUse component utilities. |
| eventemitter2 | 6.4.9 | MIT | Event emitter with wildcards. |
| range_check | 3.2.0 | BSD-1-Clause | IP range checking. |
| nprogress | 0.2.0 | MIT | Page load progress bar. |
| @pdanpdan/vue-keyboard-trap | 1.0.19 | MIT | Keyboard focus trap for Vue. |
| @vueuse/core | 12.3.0 | MIT | Vue composition utilities. |
| is-cidr | 5.1.1 | BSD-2-Clause | CIDR validation utilities. |
| perfect-scrollbar | 1.5.5 | MIT | Custom scrollbar library. |
| uuid | 11.0.5 | MIT | UUID generation for JS. |
| vue-virtual-scroller | 2.0.0-beta.8 | MIT | Virtualized list for Vue. |
| https://github.com/gildas-lormeau/zip.js | v2.7.48 | BSD-3-Clause | ZIP handling library. |
| https://github.com/ckeditor/ckeditor5 | v42.0.2 | MIT | CKEditor 5 rich text editor. |
| https://github.com/nodejs/node | 20.16 | ISC | Node.js JavaScript runtime. |
| https://github.com/anomalyco/opencode | N/A | MIT | OpenCode repository (see upstream for version). |
| https://github.com/DavidHDev/vue-bits | N/A | MIT | VueBits UI components repository (see upstream for version). |
| https://github.com/EricZimmerman | N/A | MIT | Eric Zimmerman's DFIR command-line tools, including MFTECmd, RECmd, EvtxECmd, and PECmd (see upstream repositories for versions). |
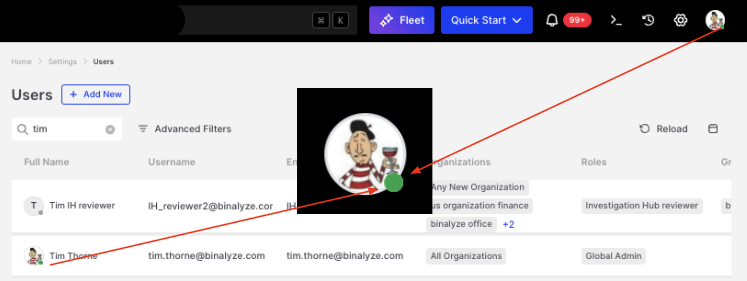
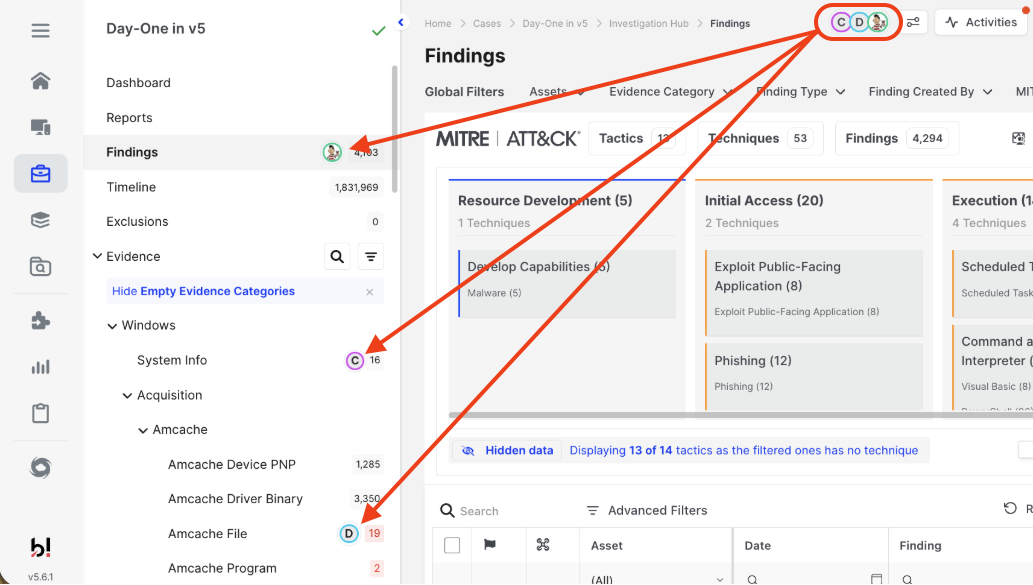
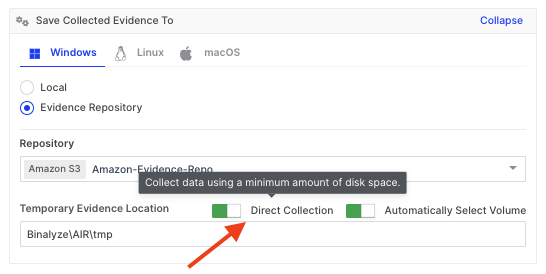
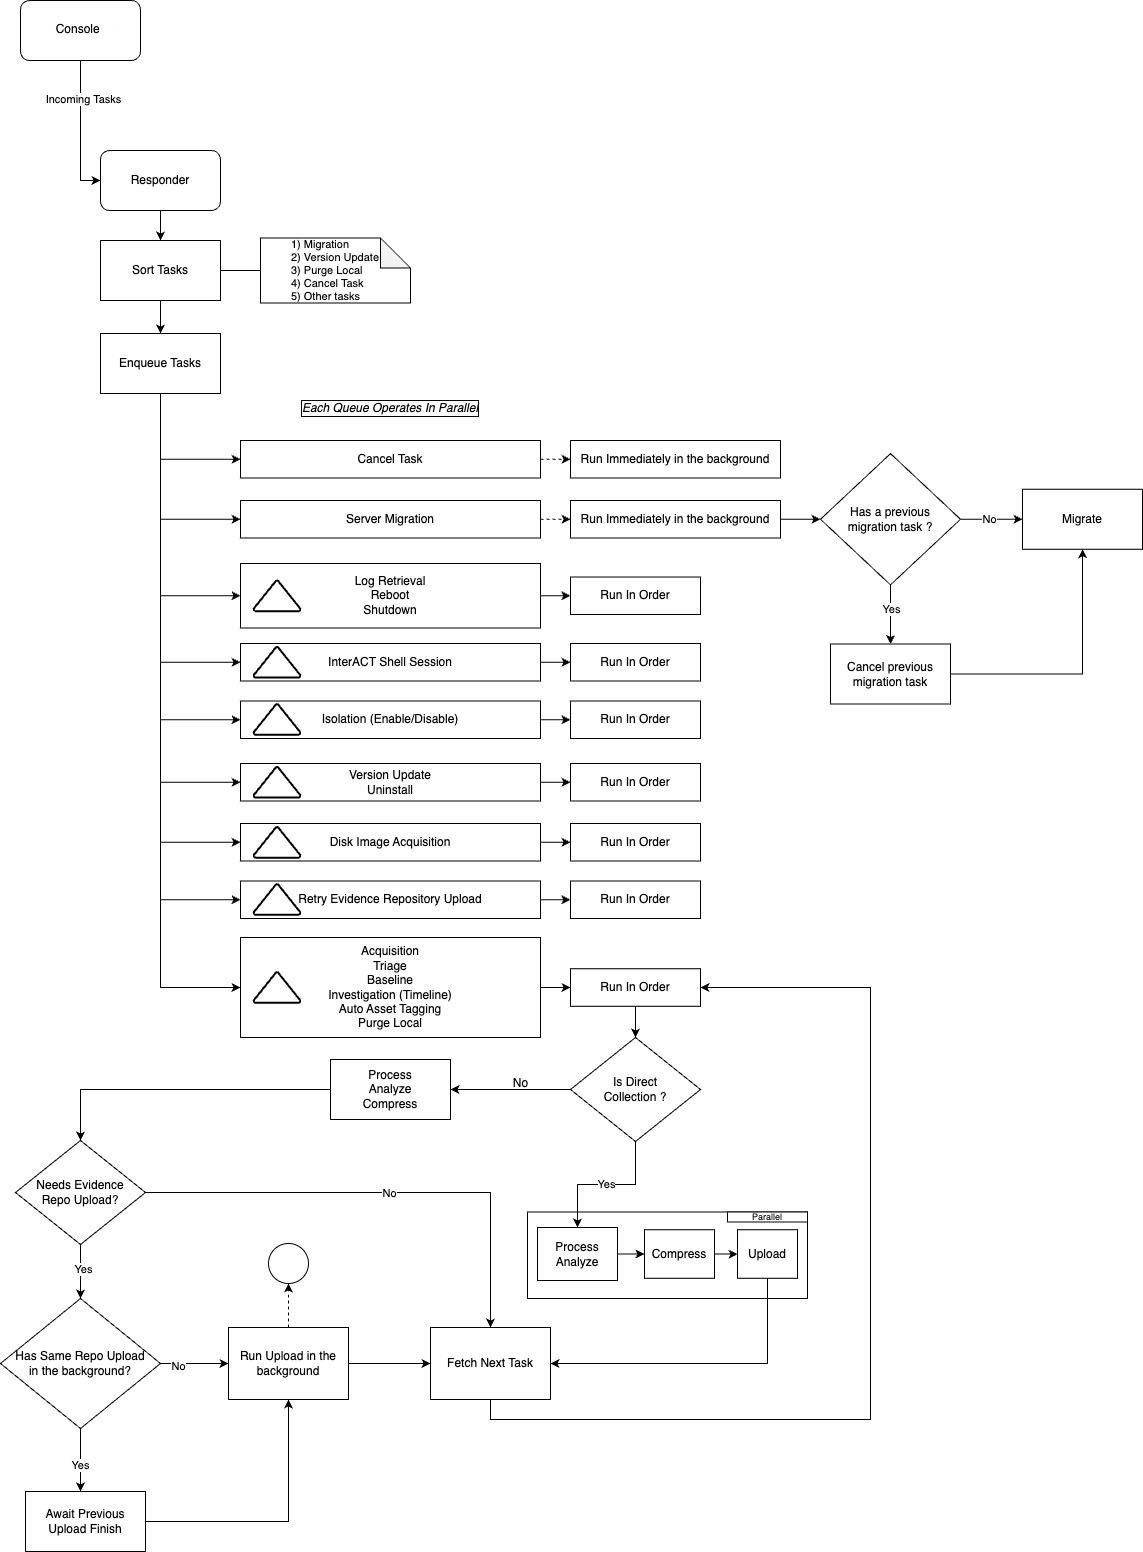
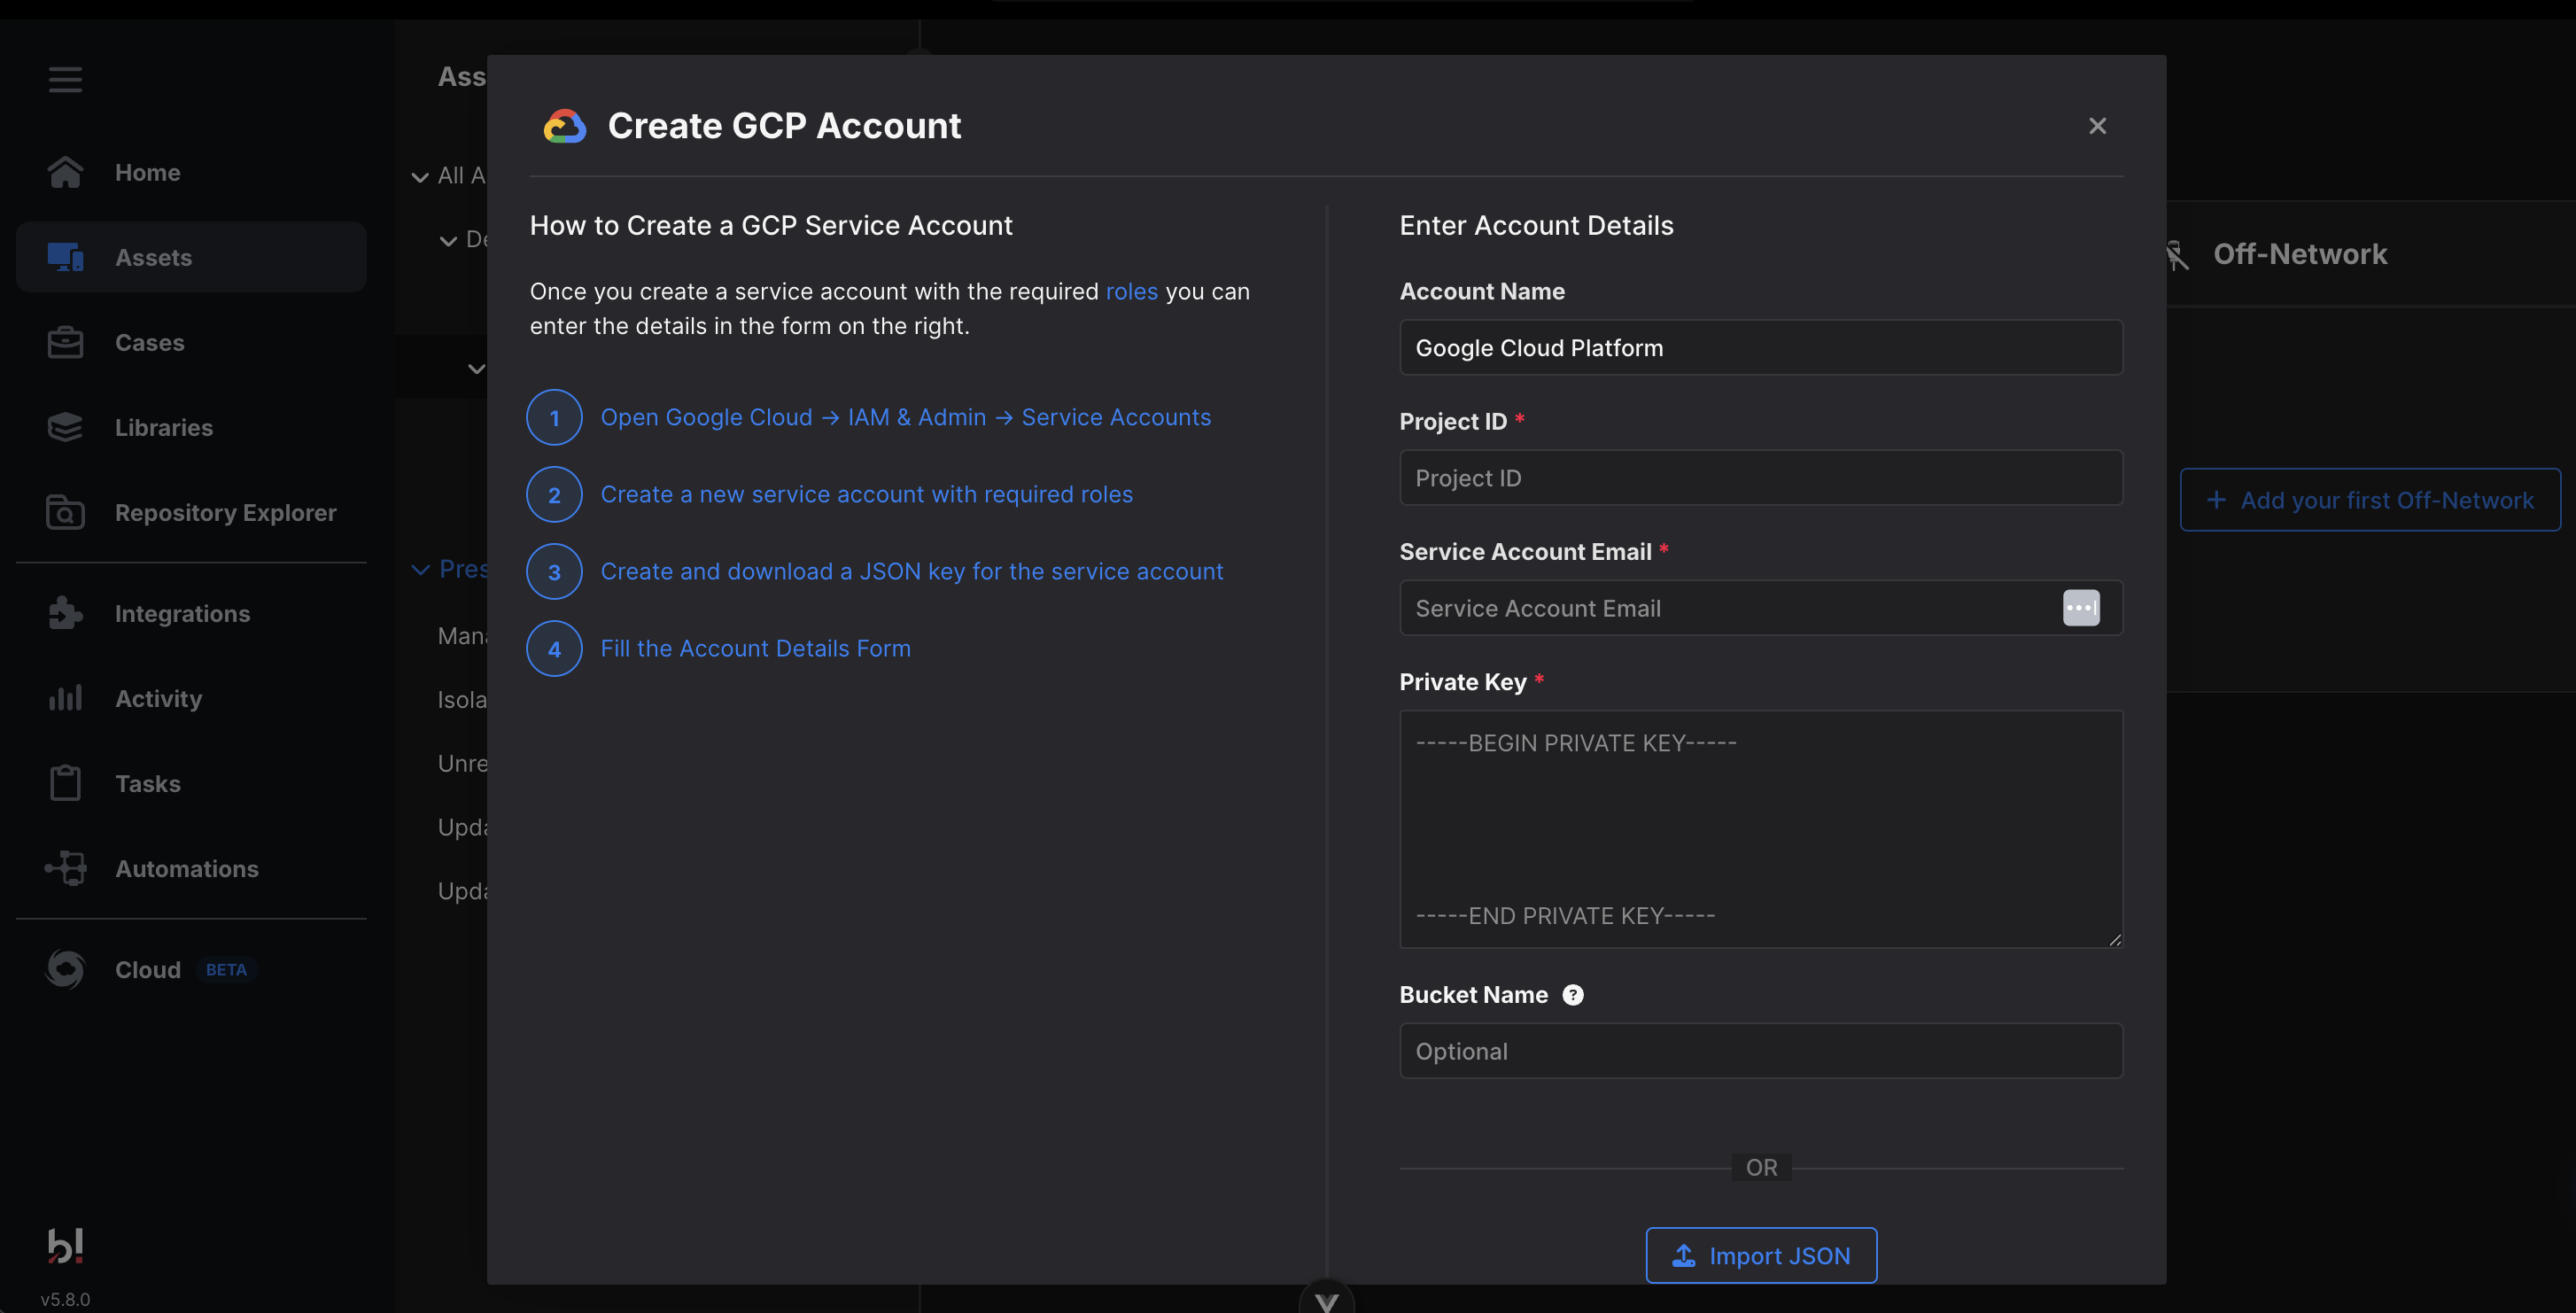
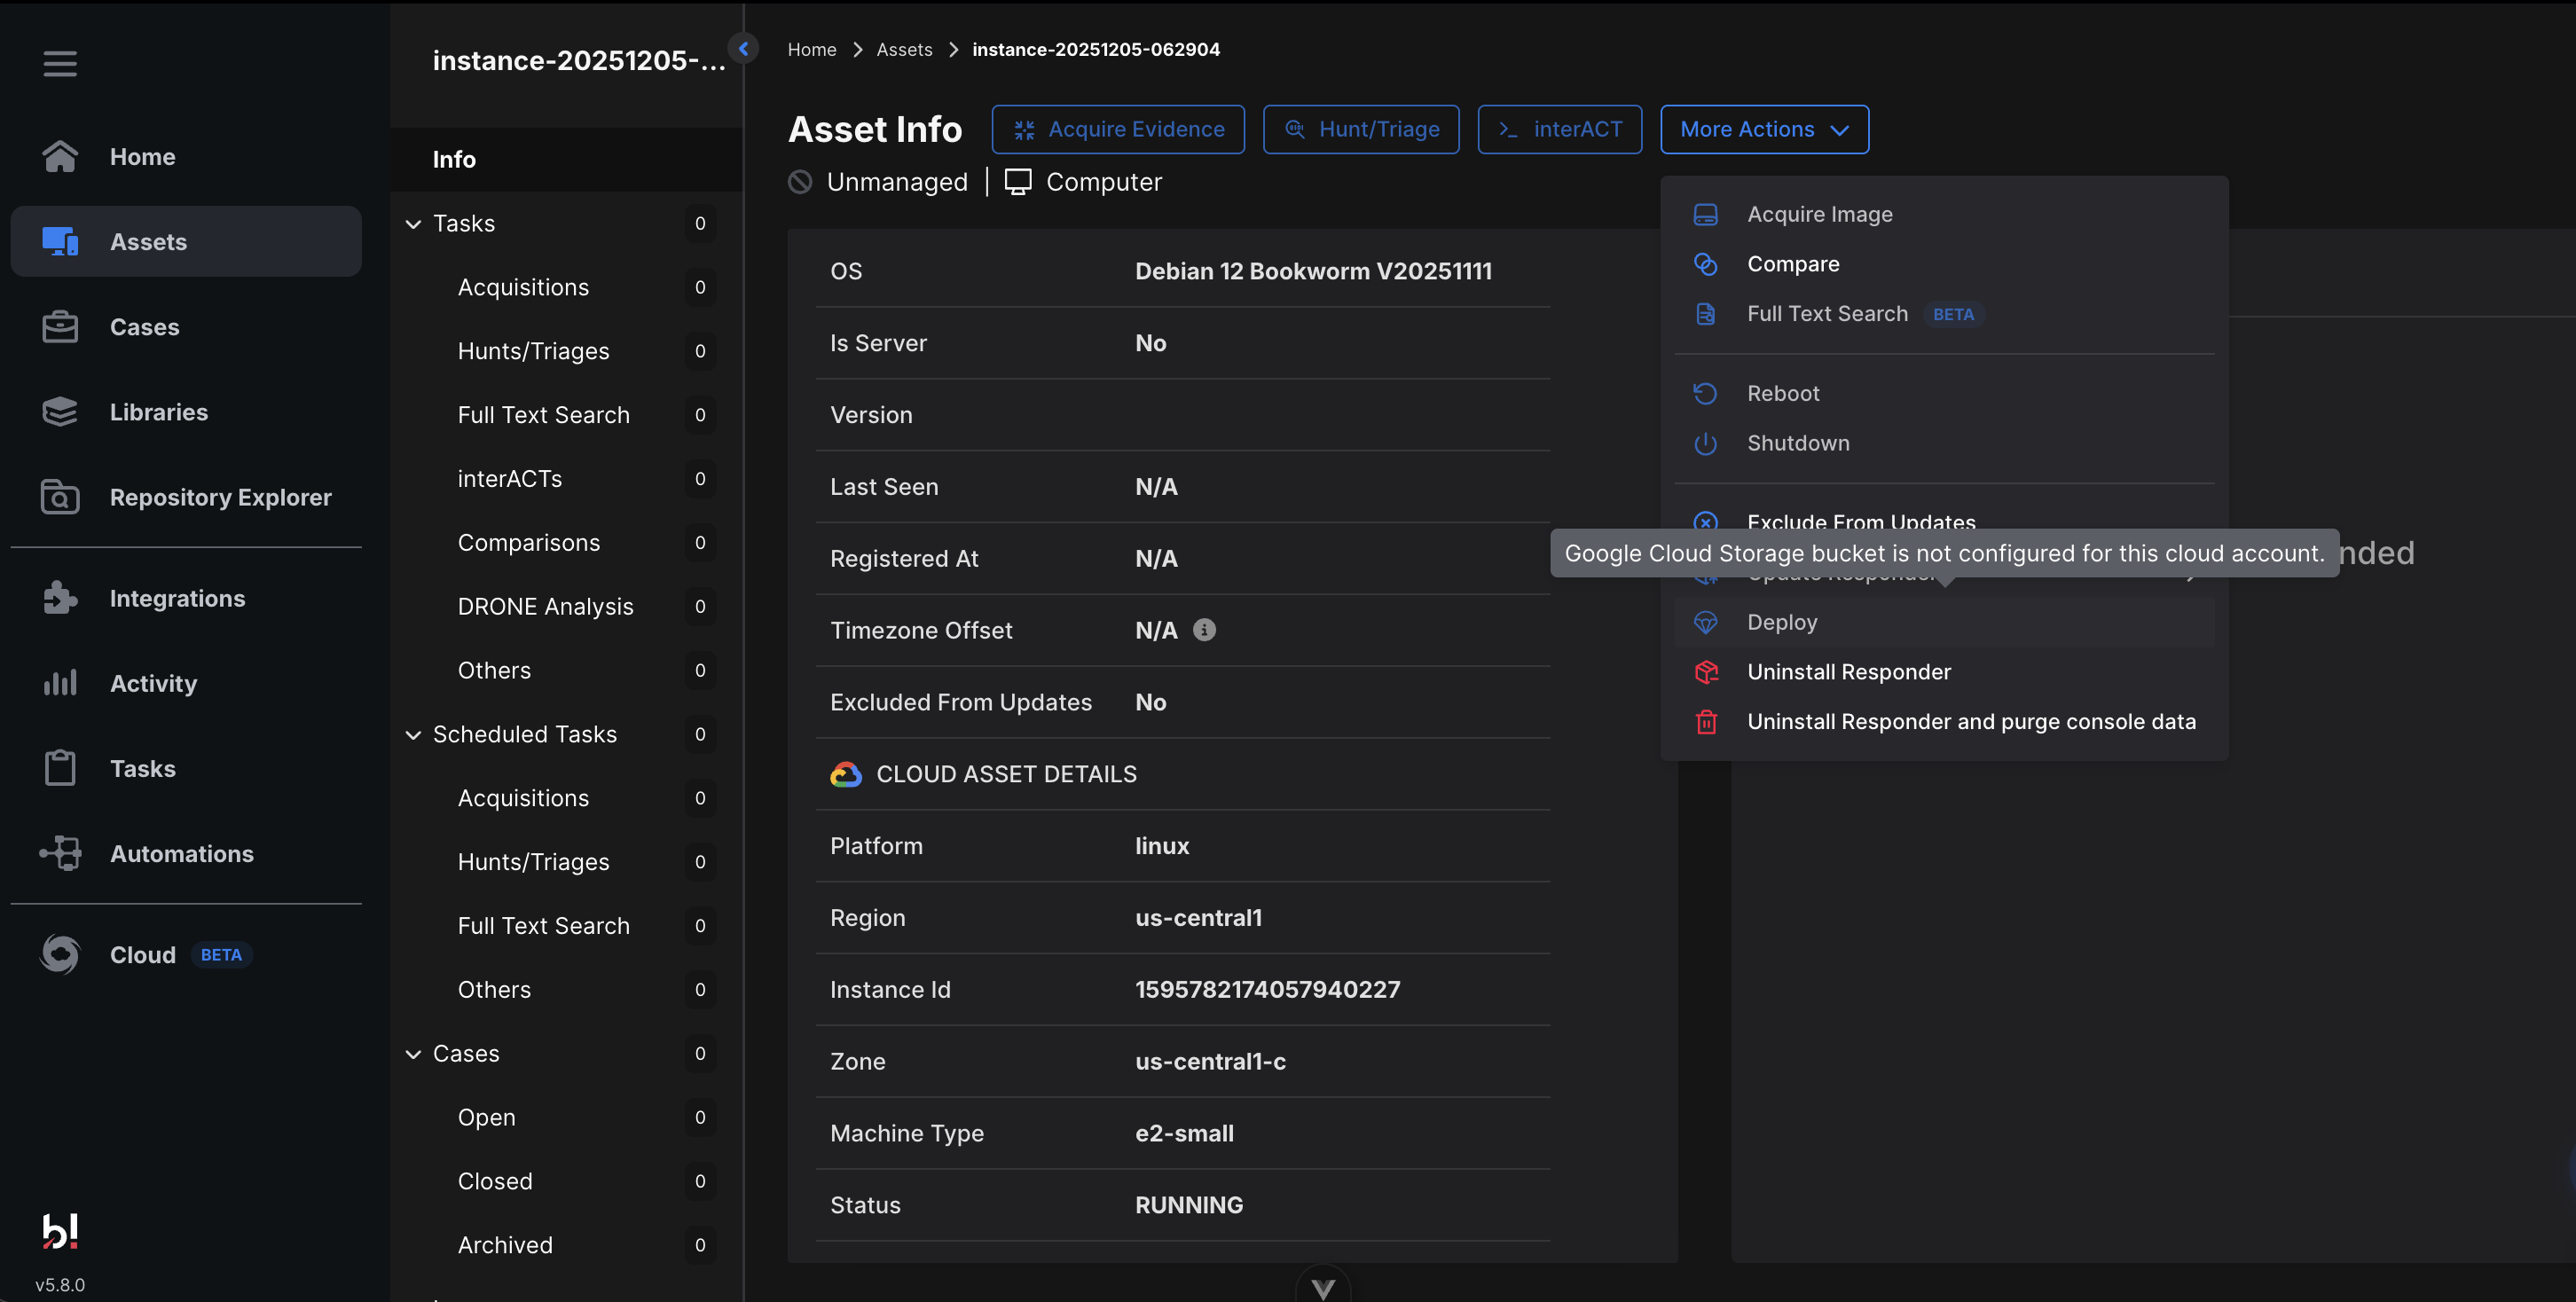
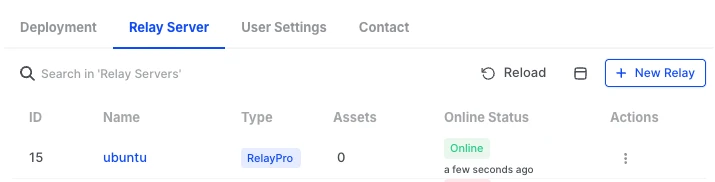
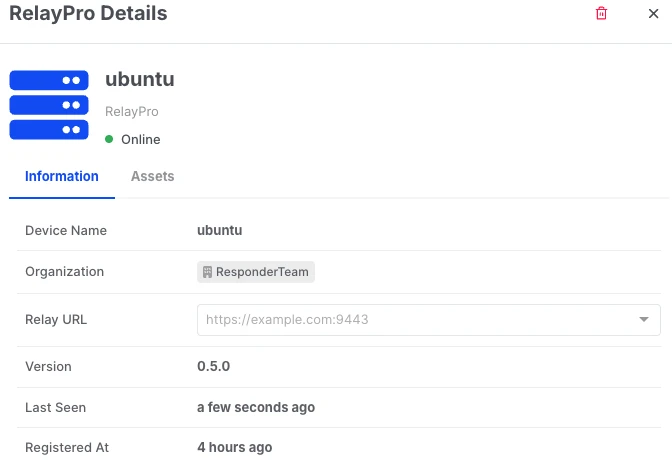


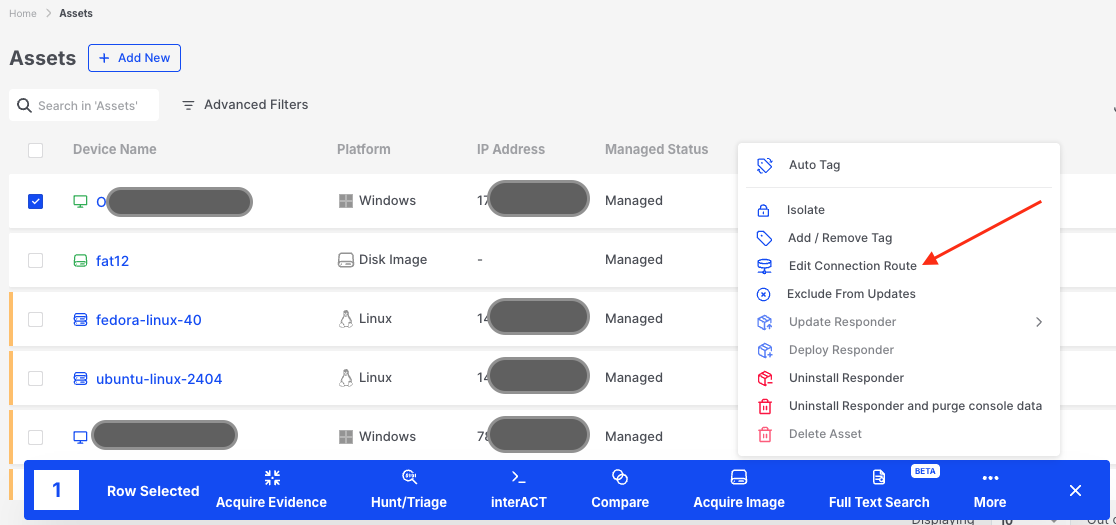
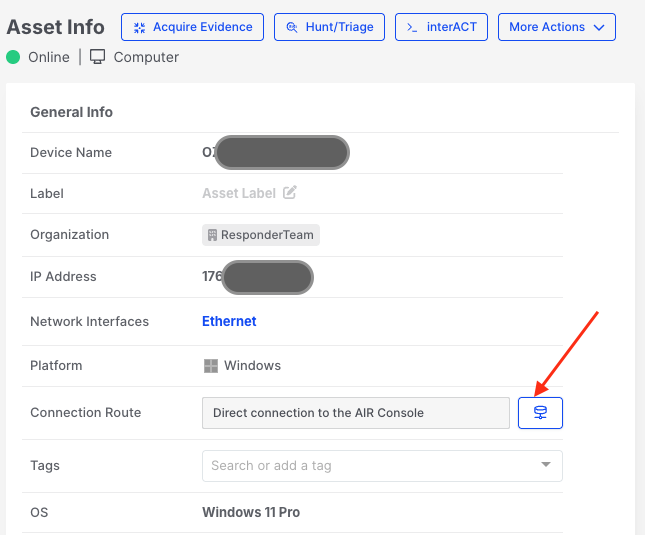
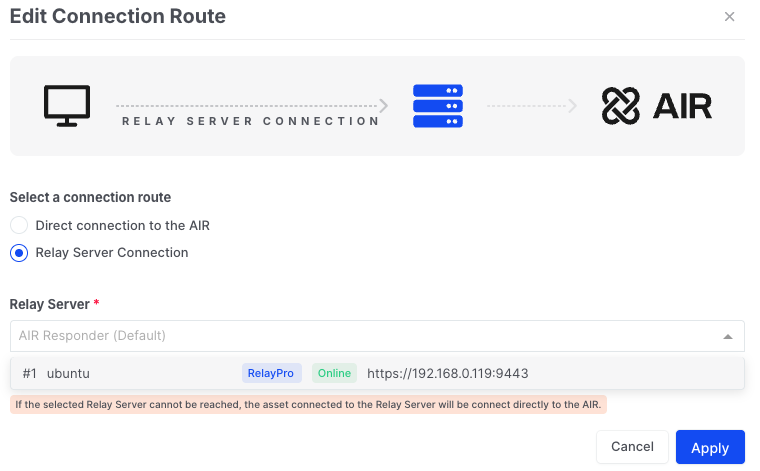

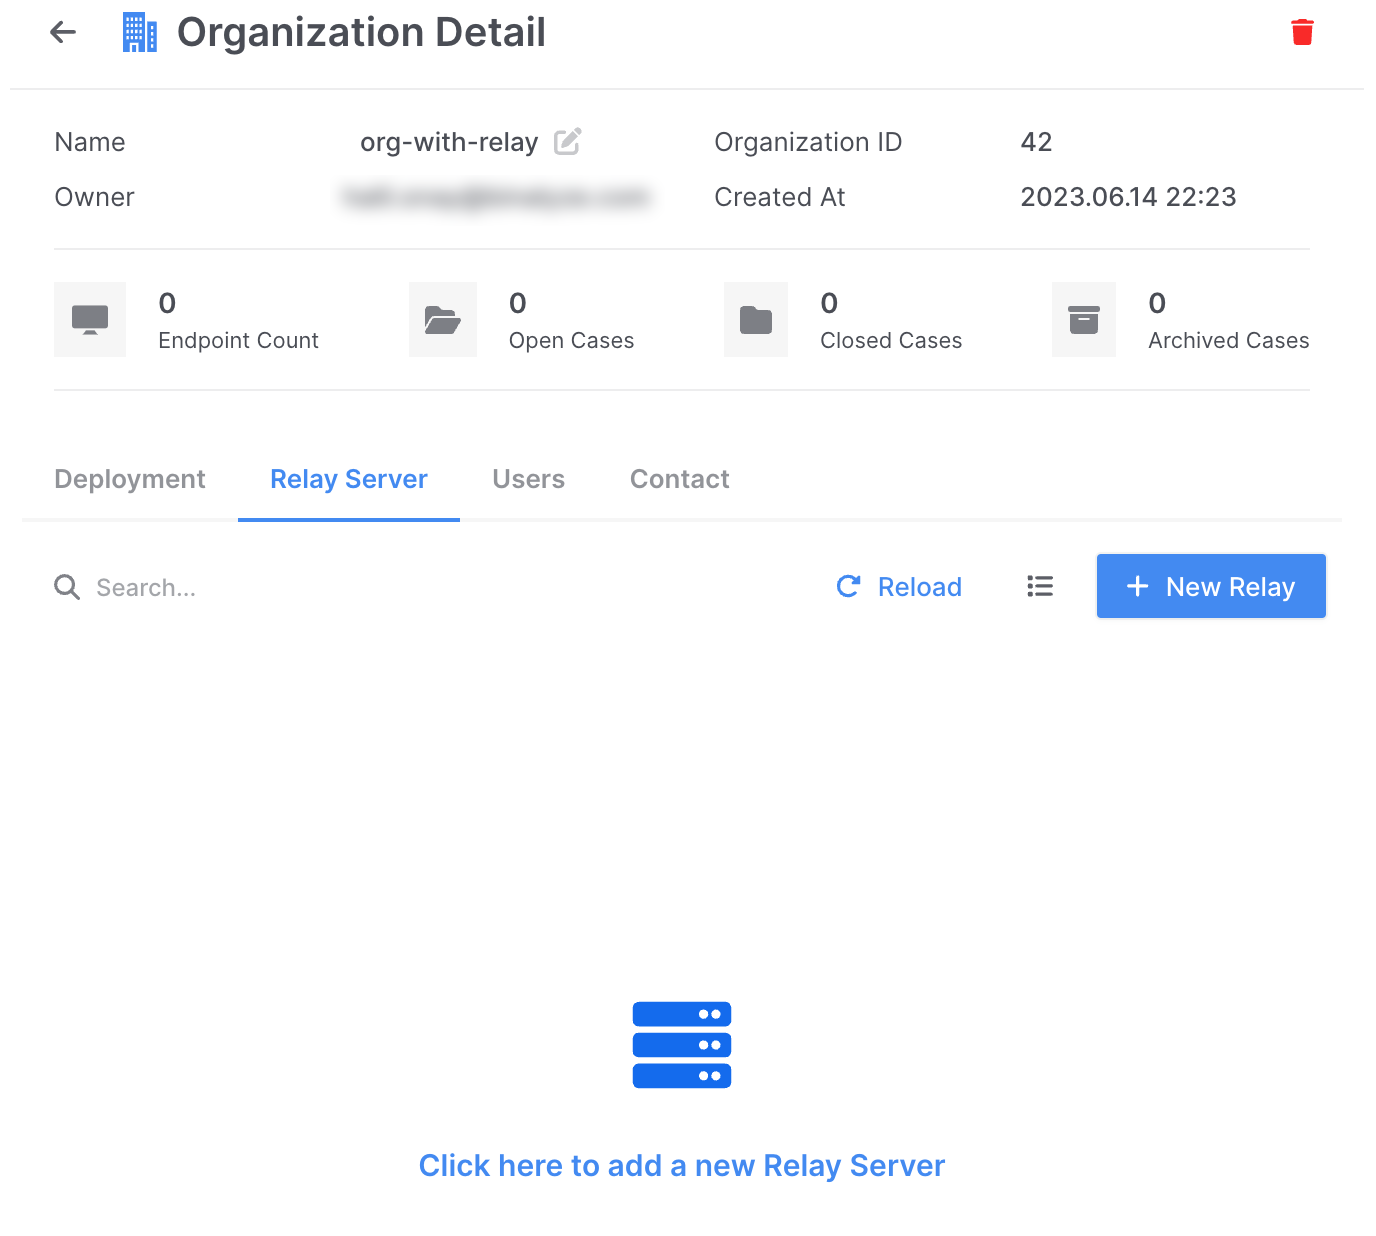
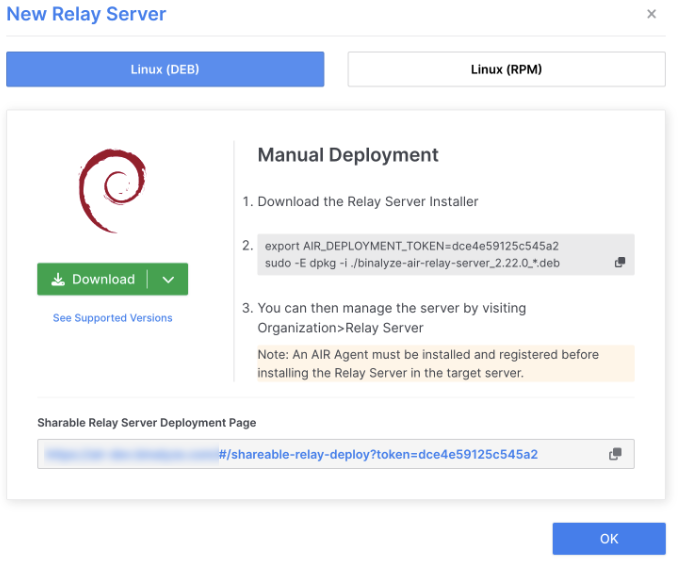
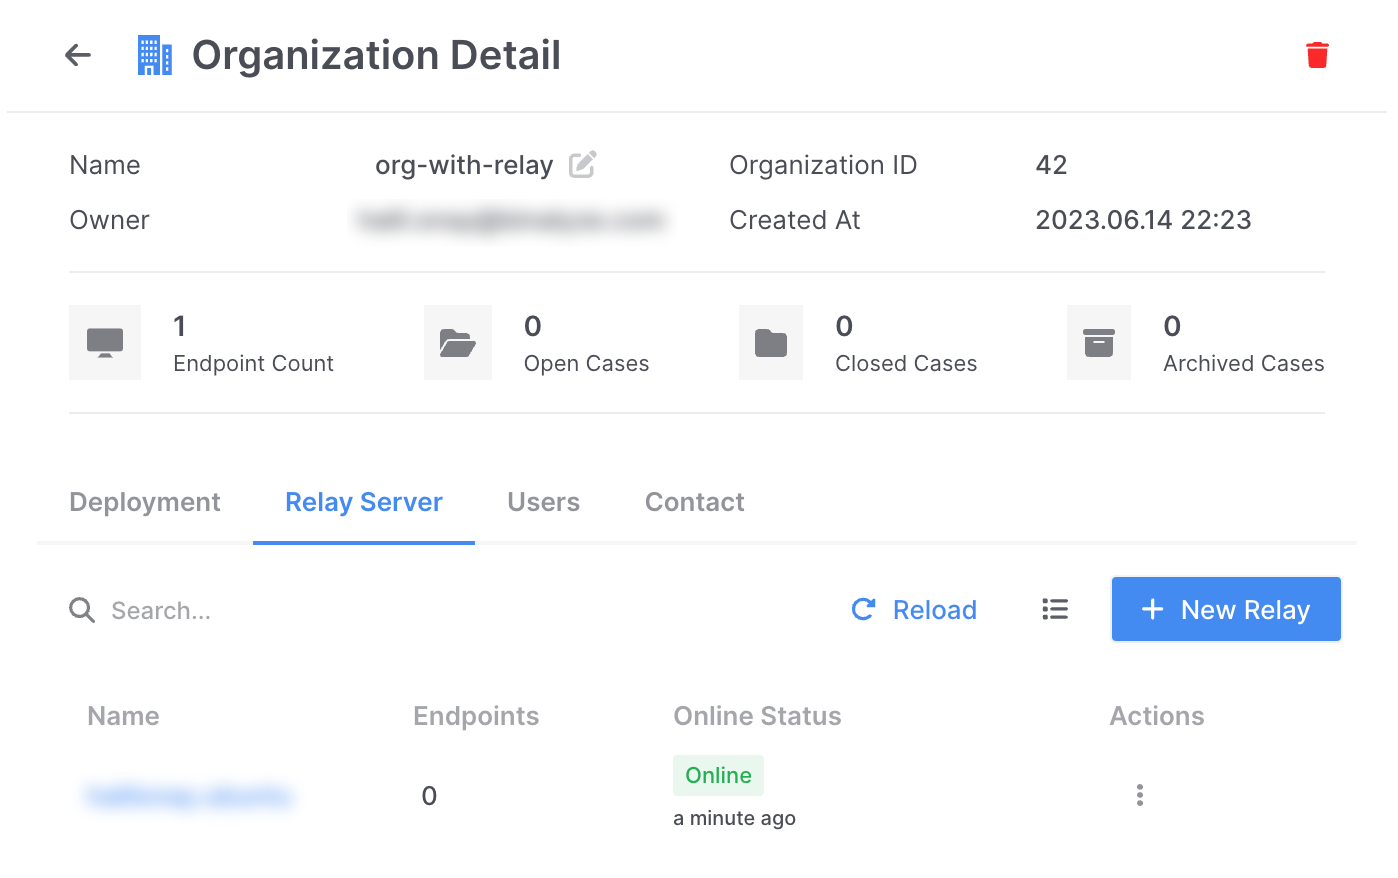
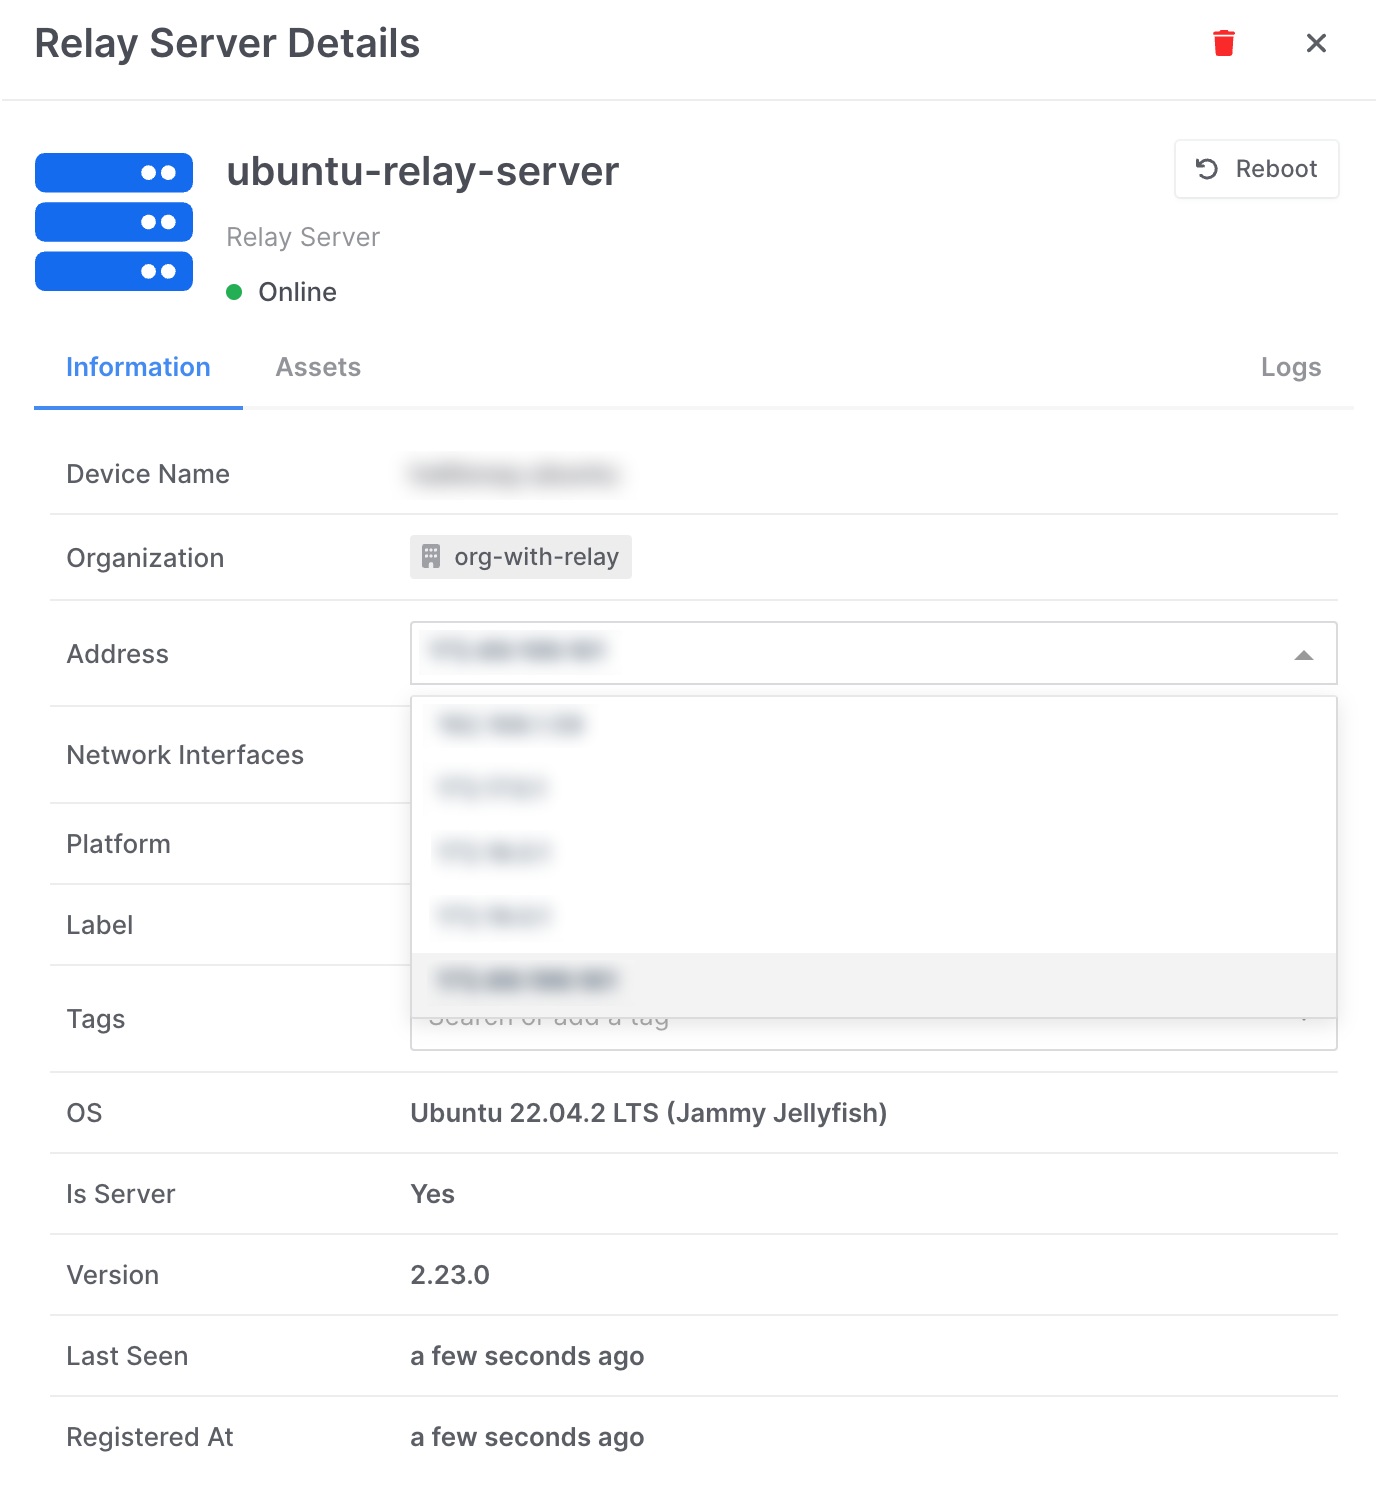
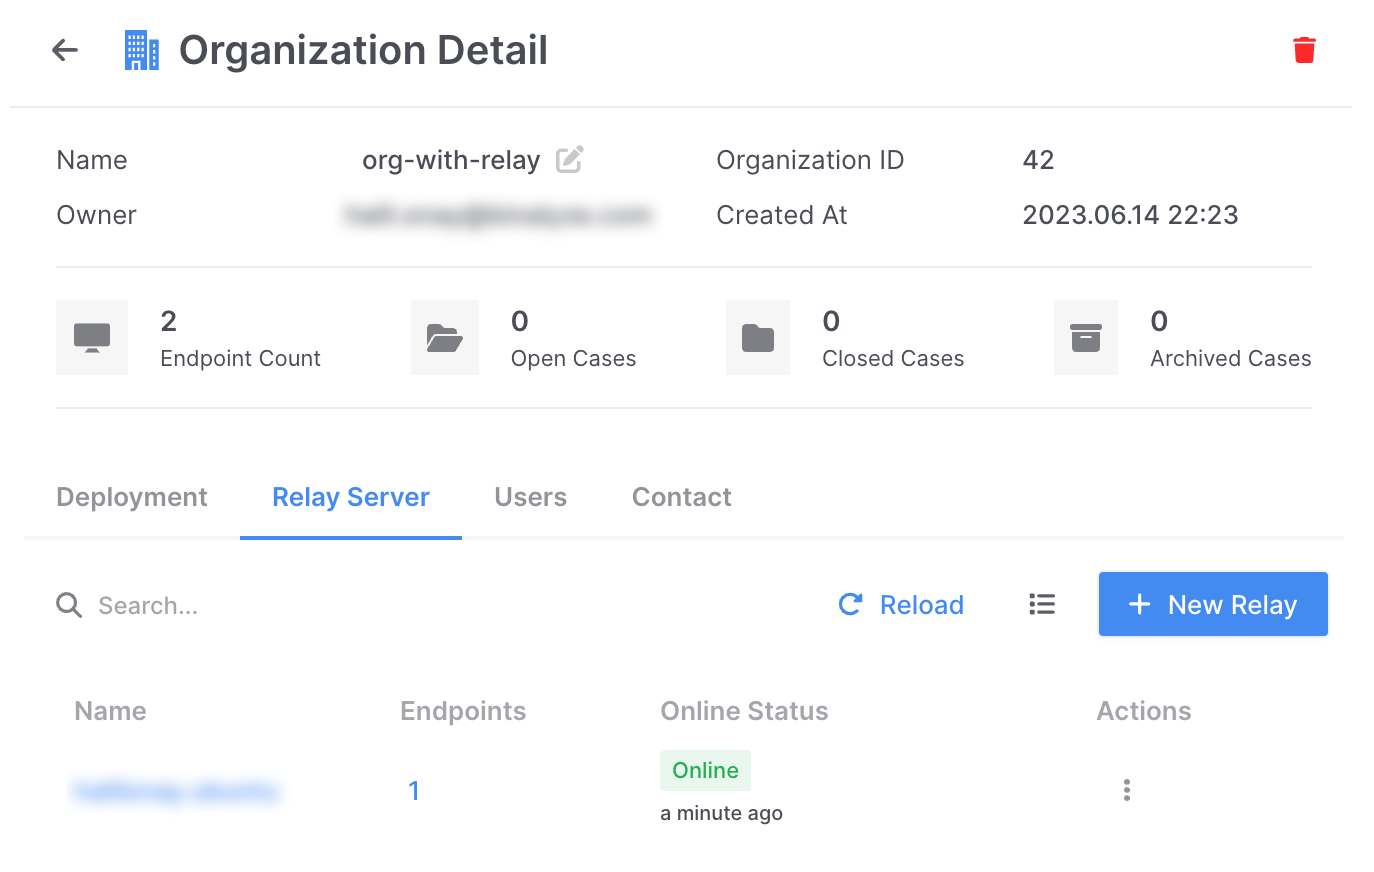
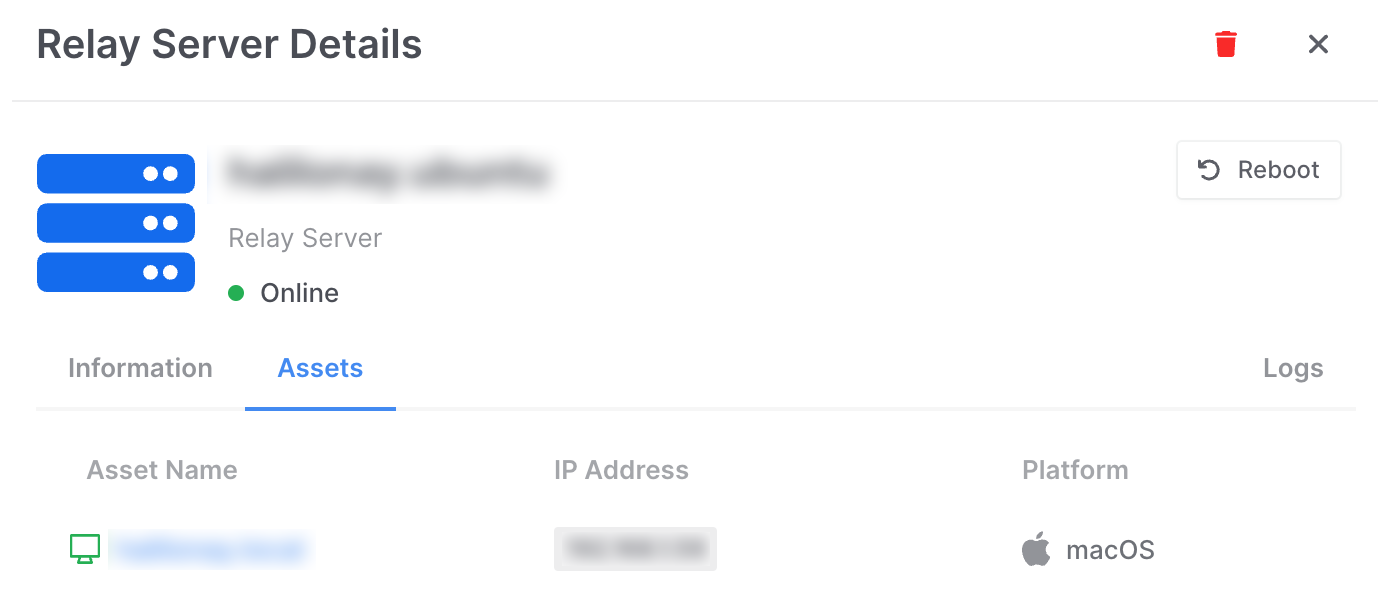
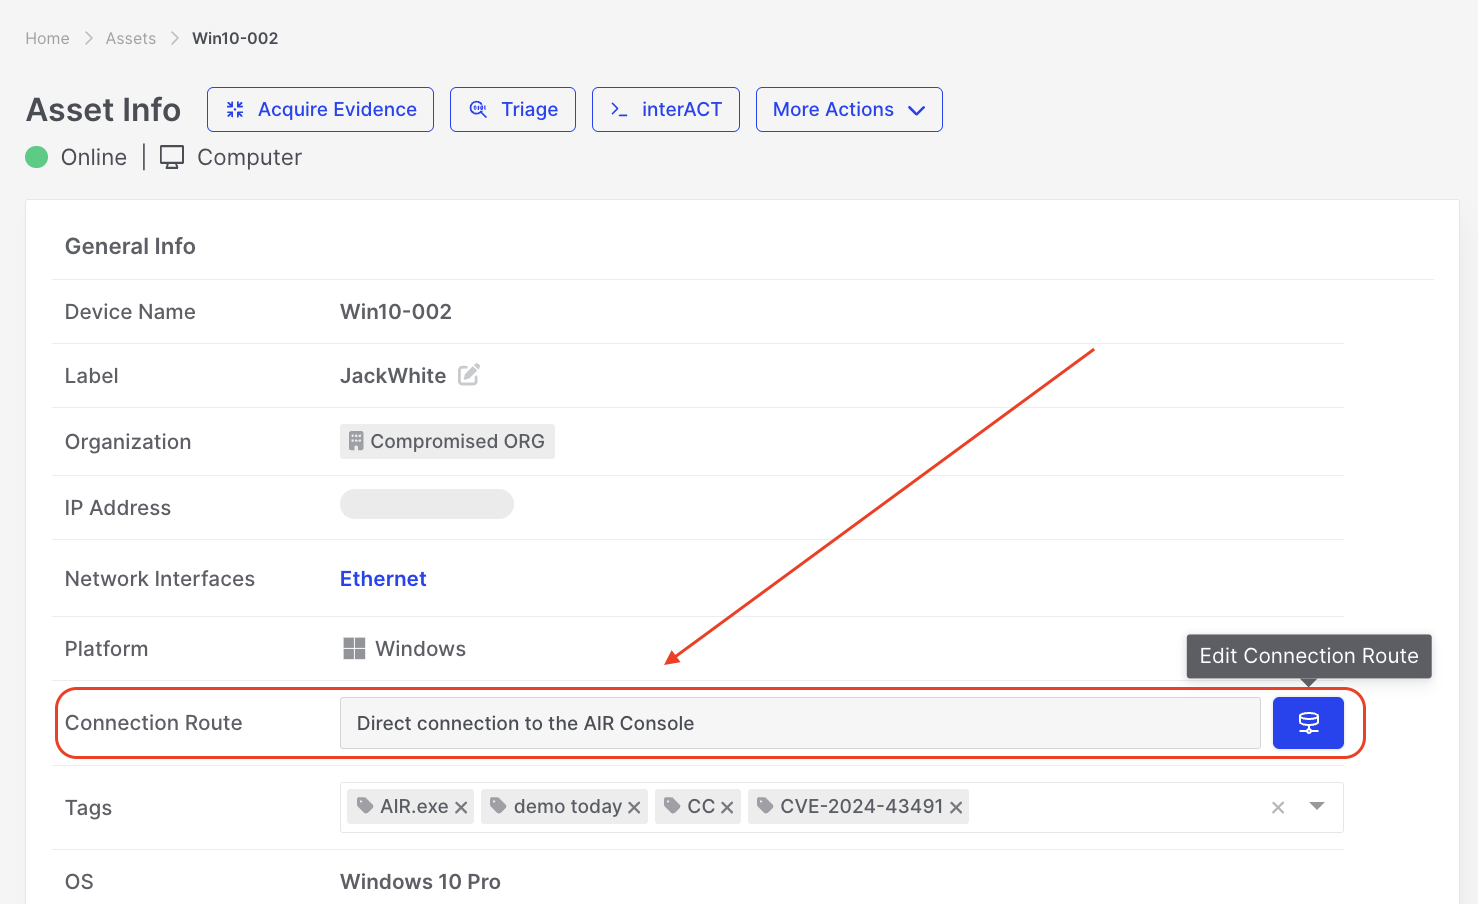
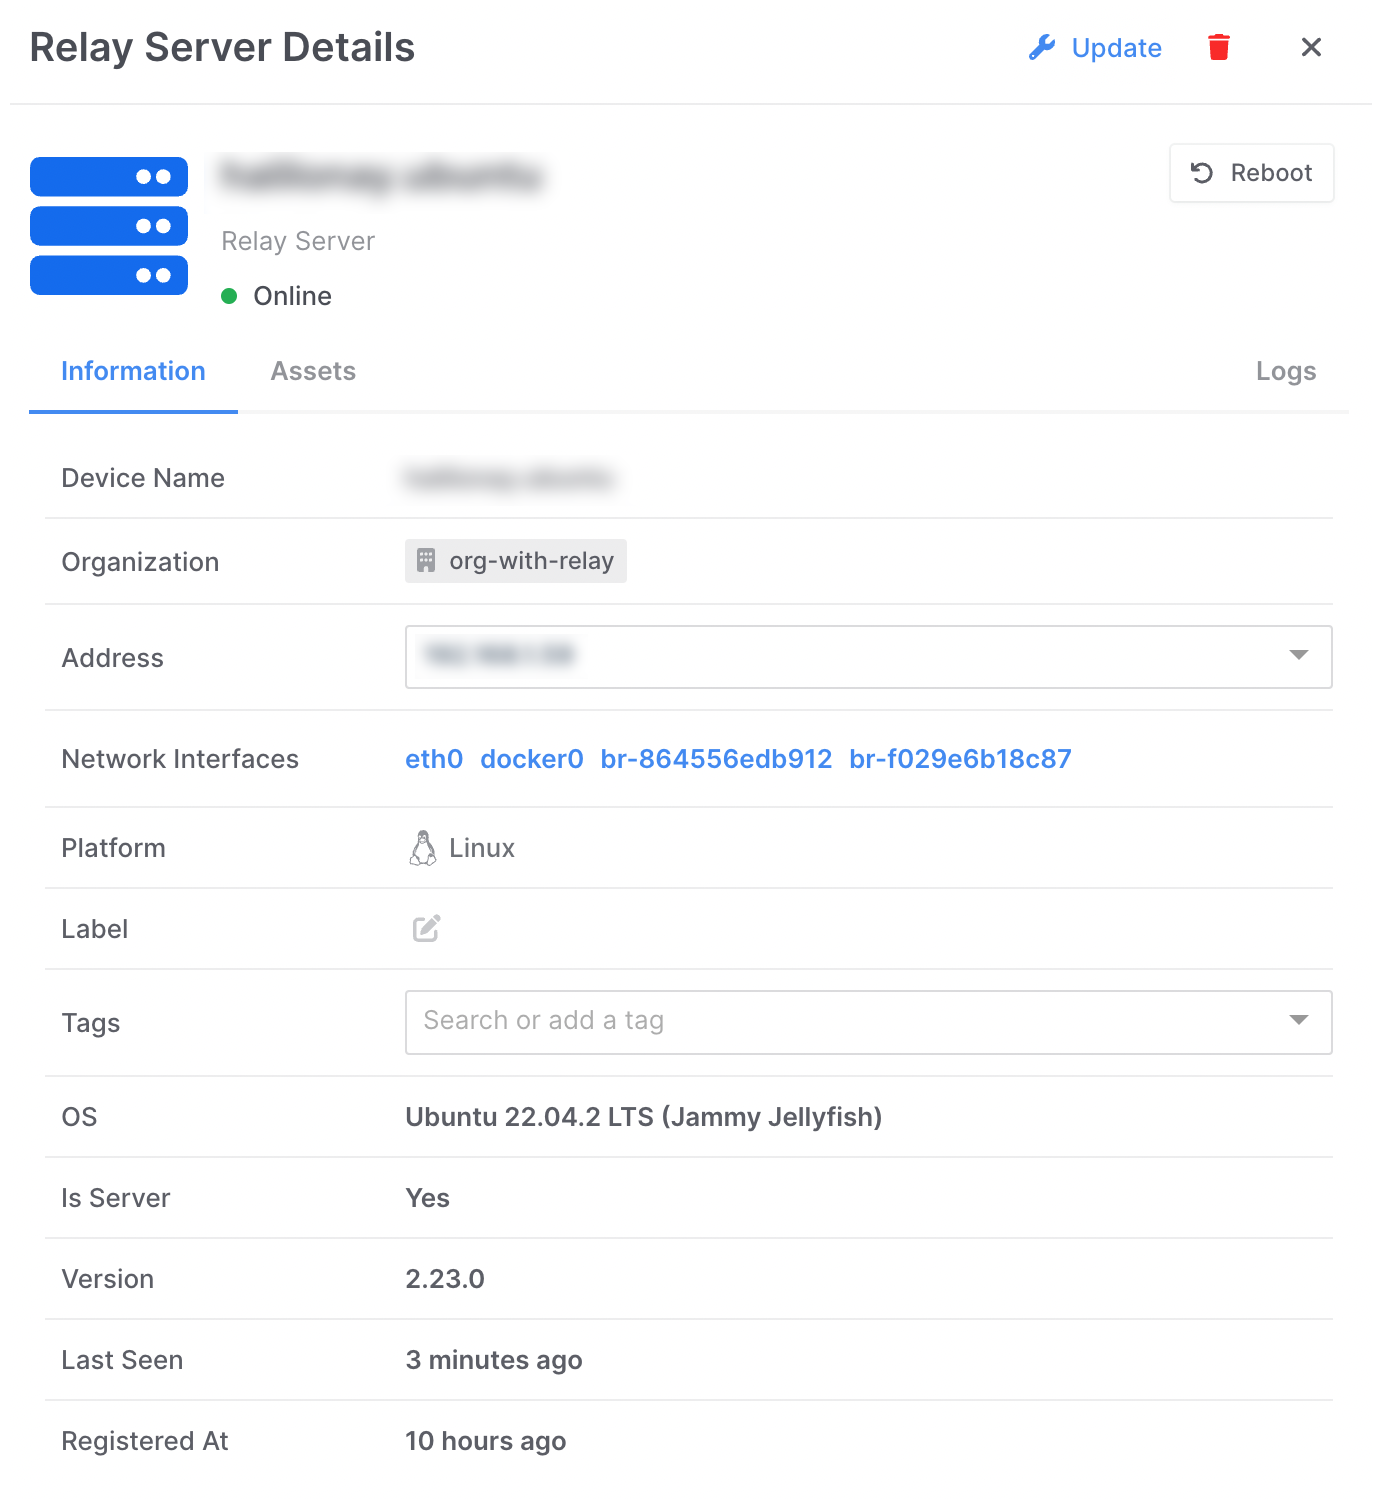
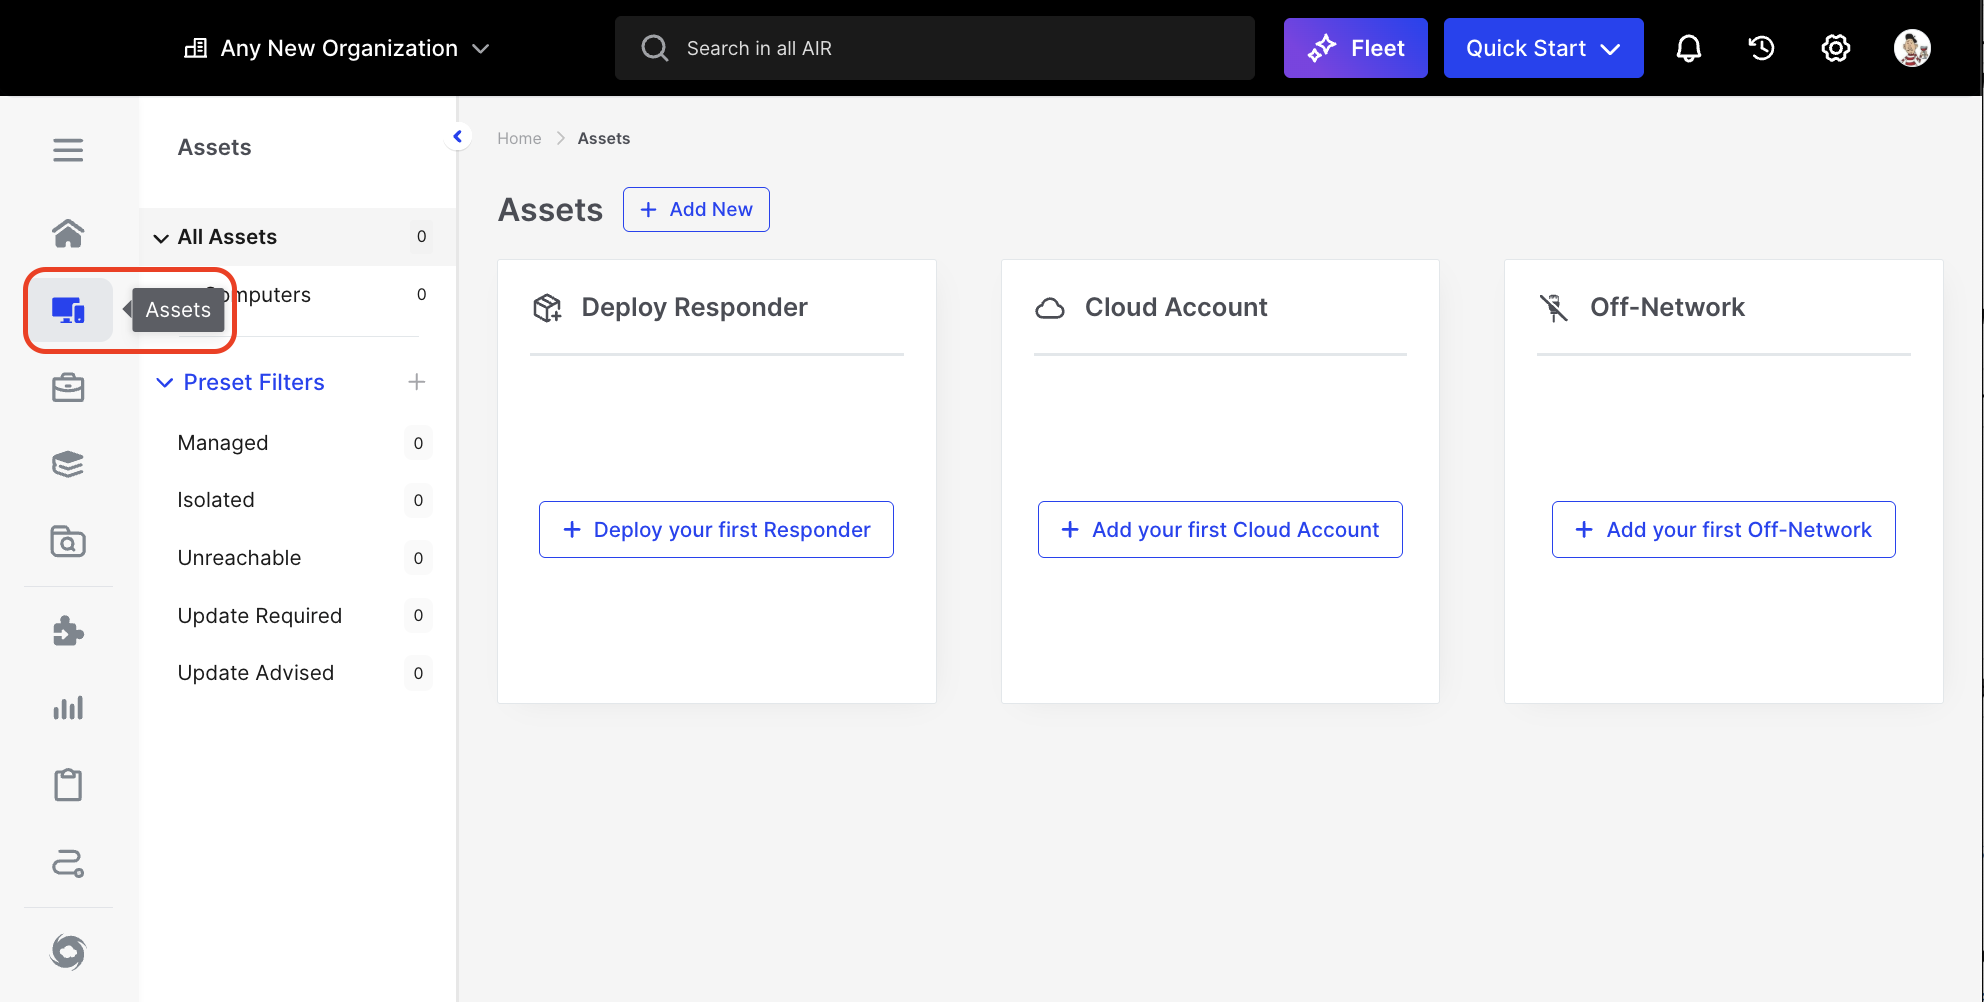
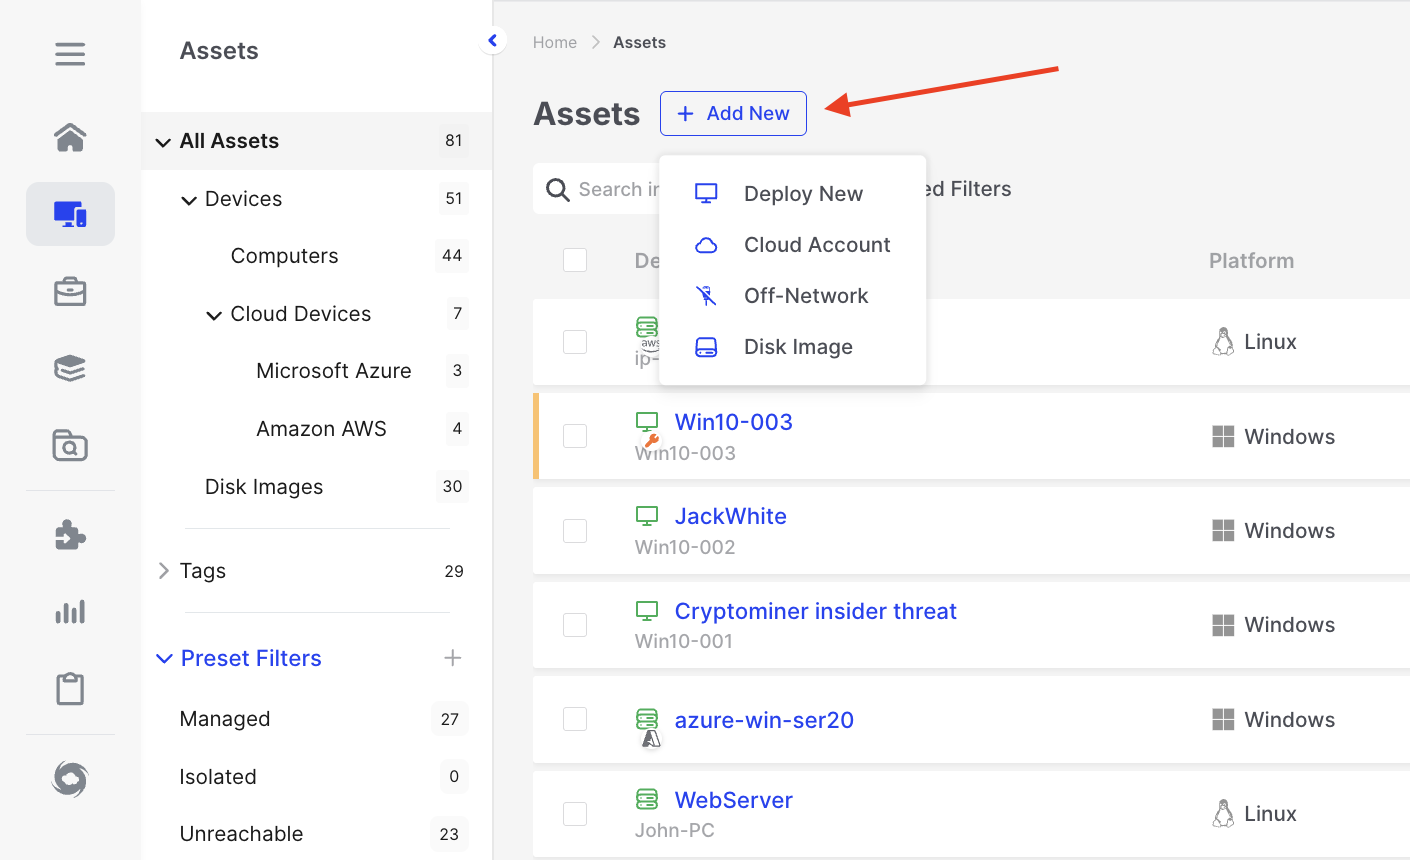
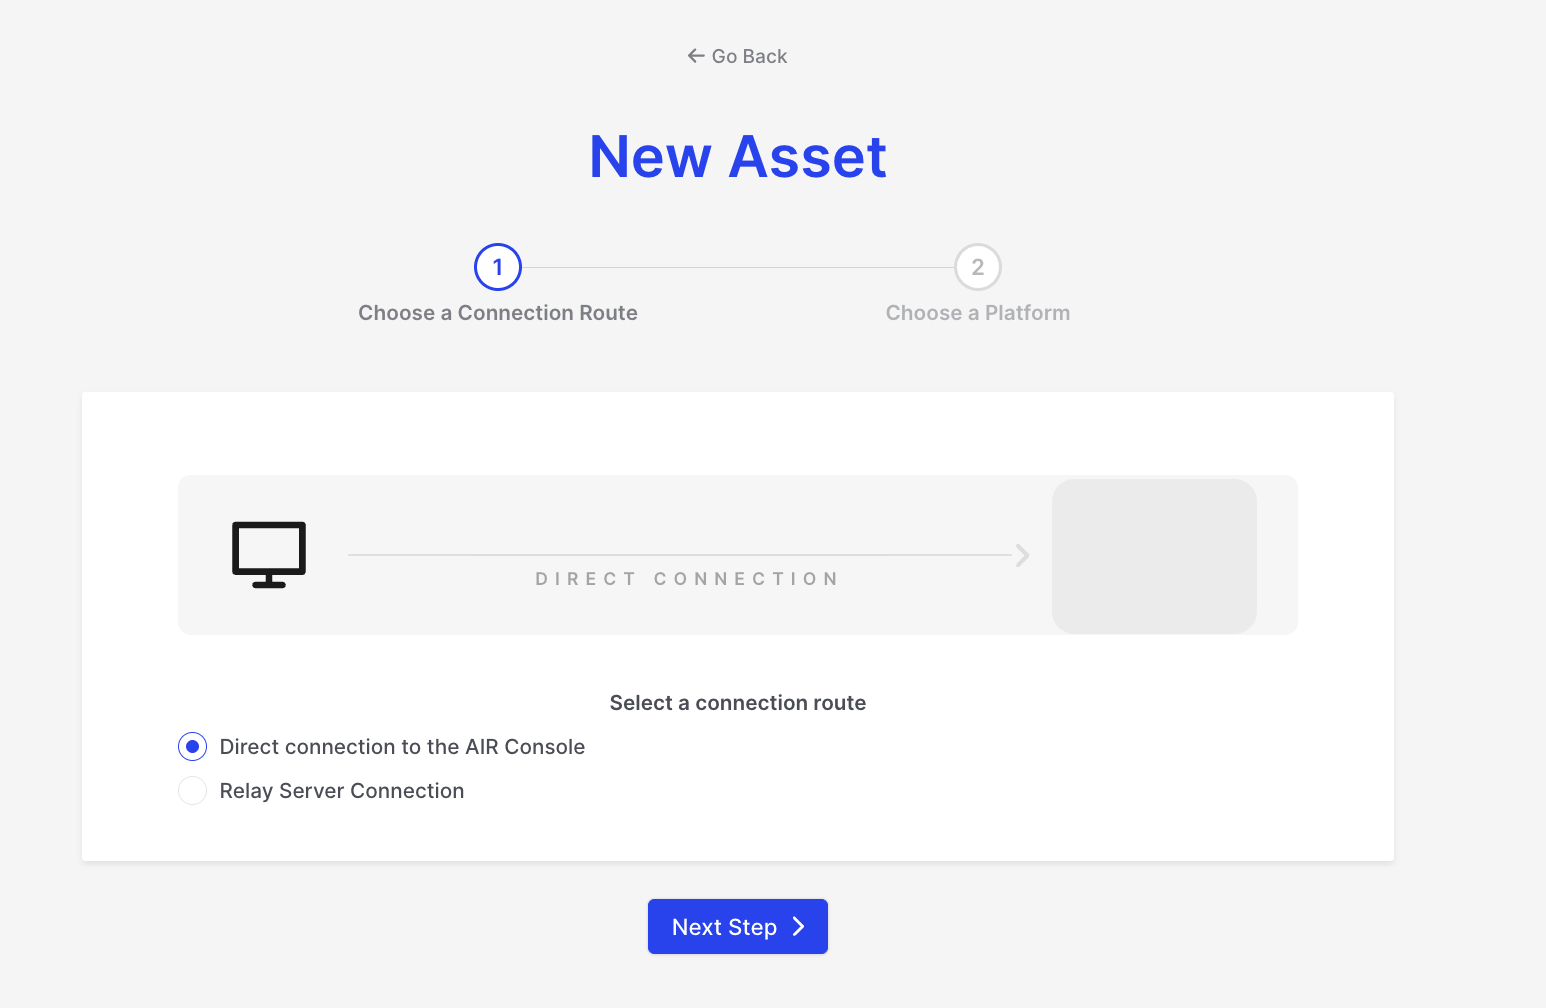
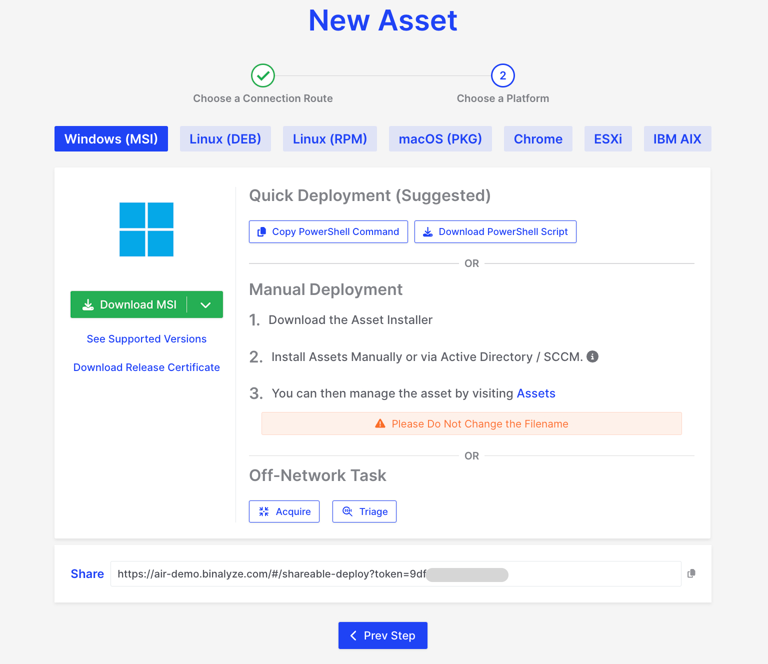
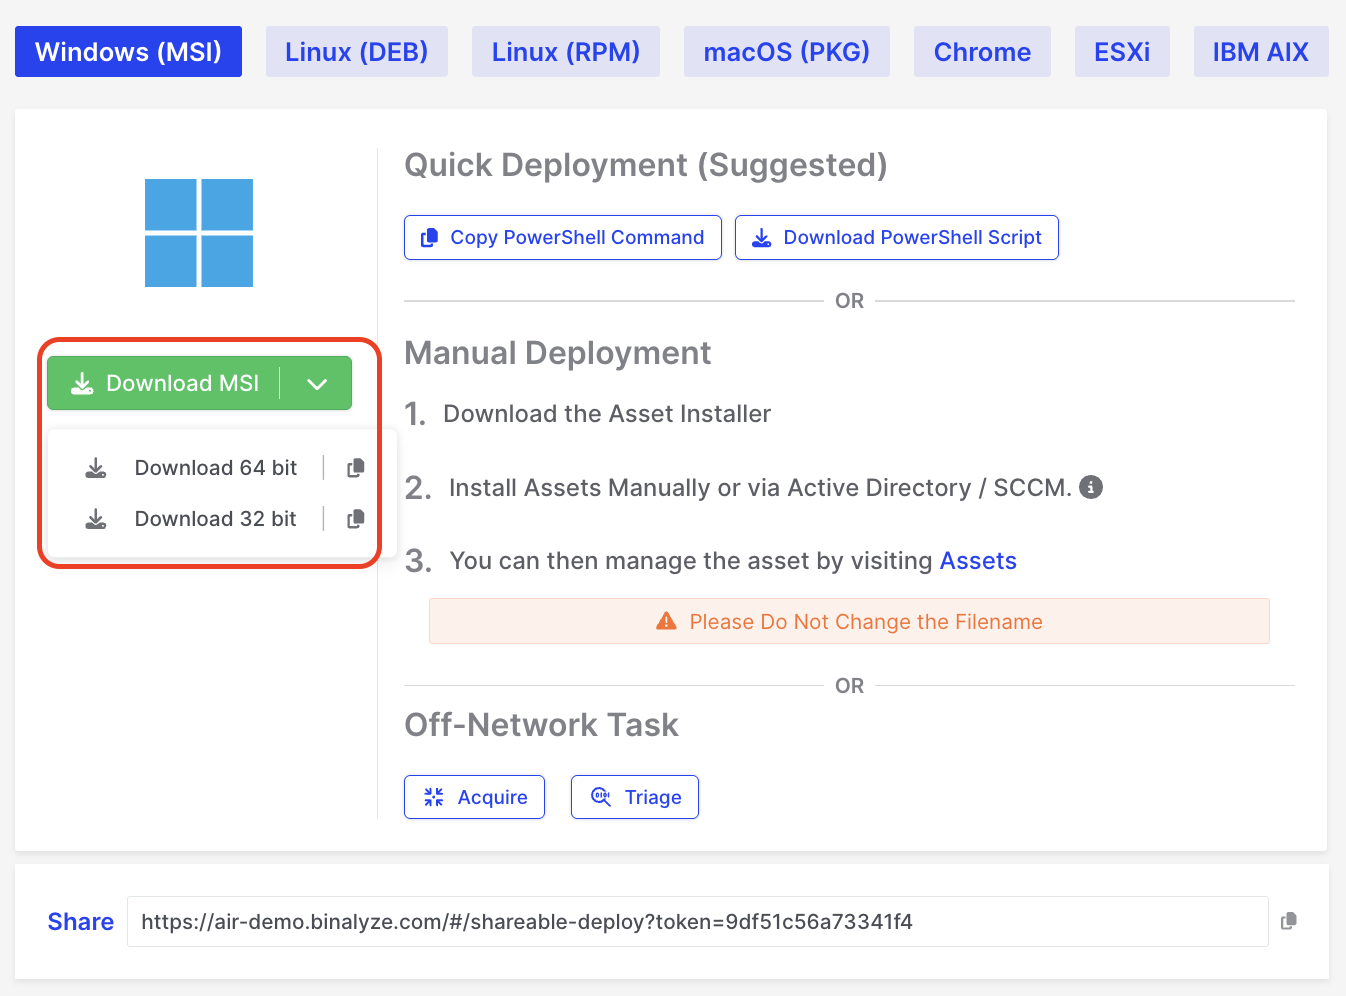

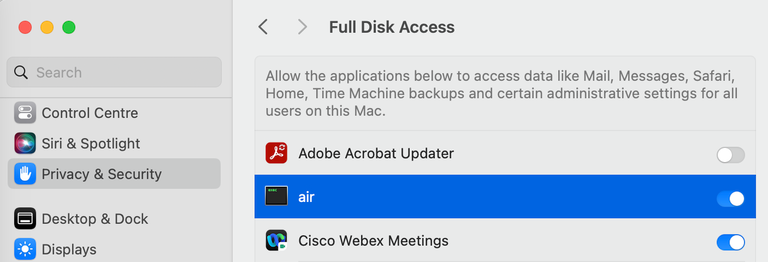
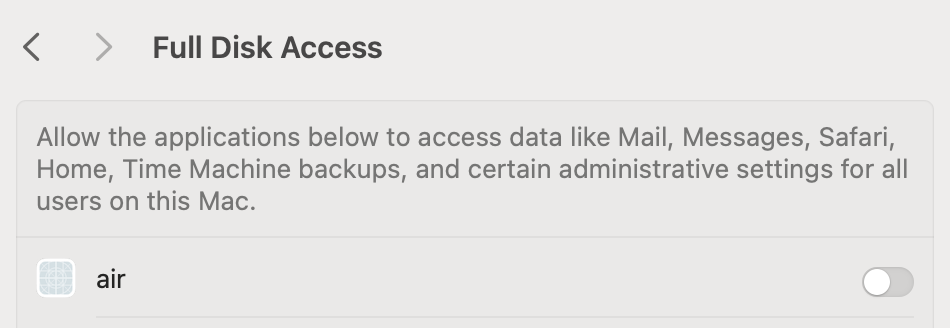
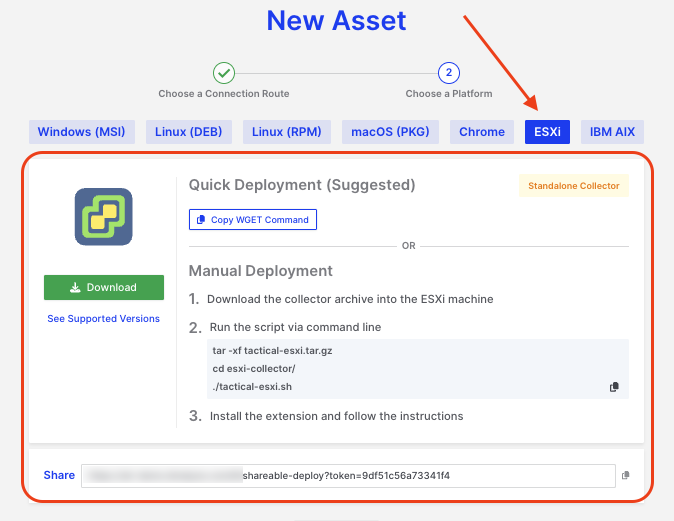
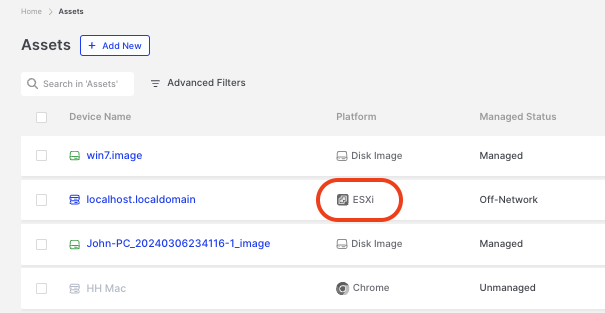
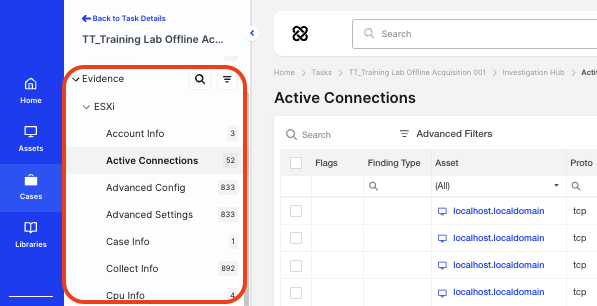
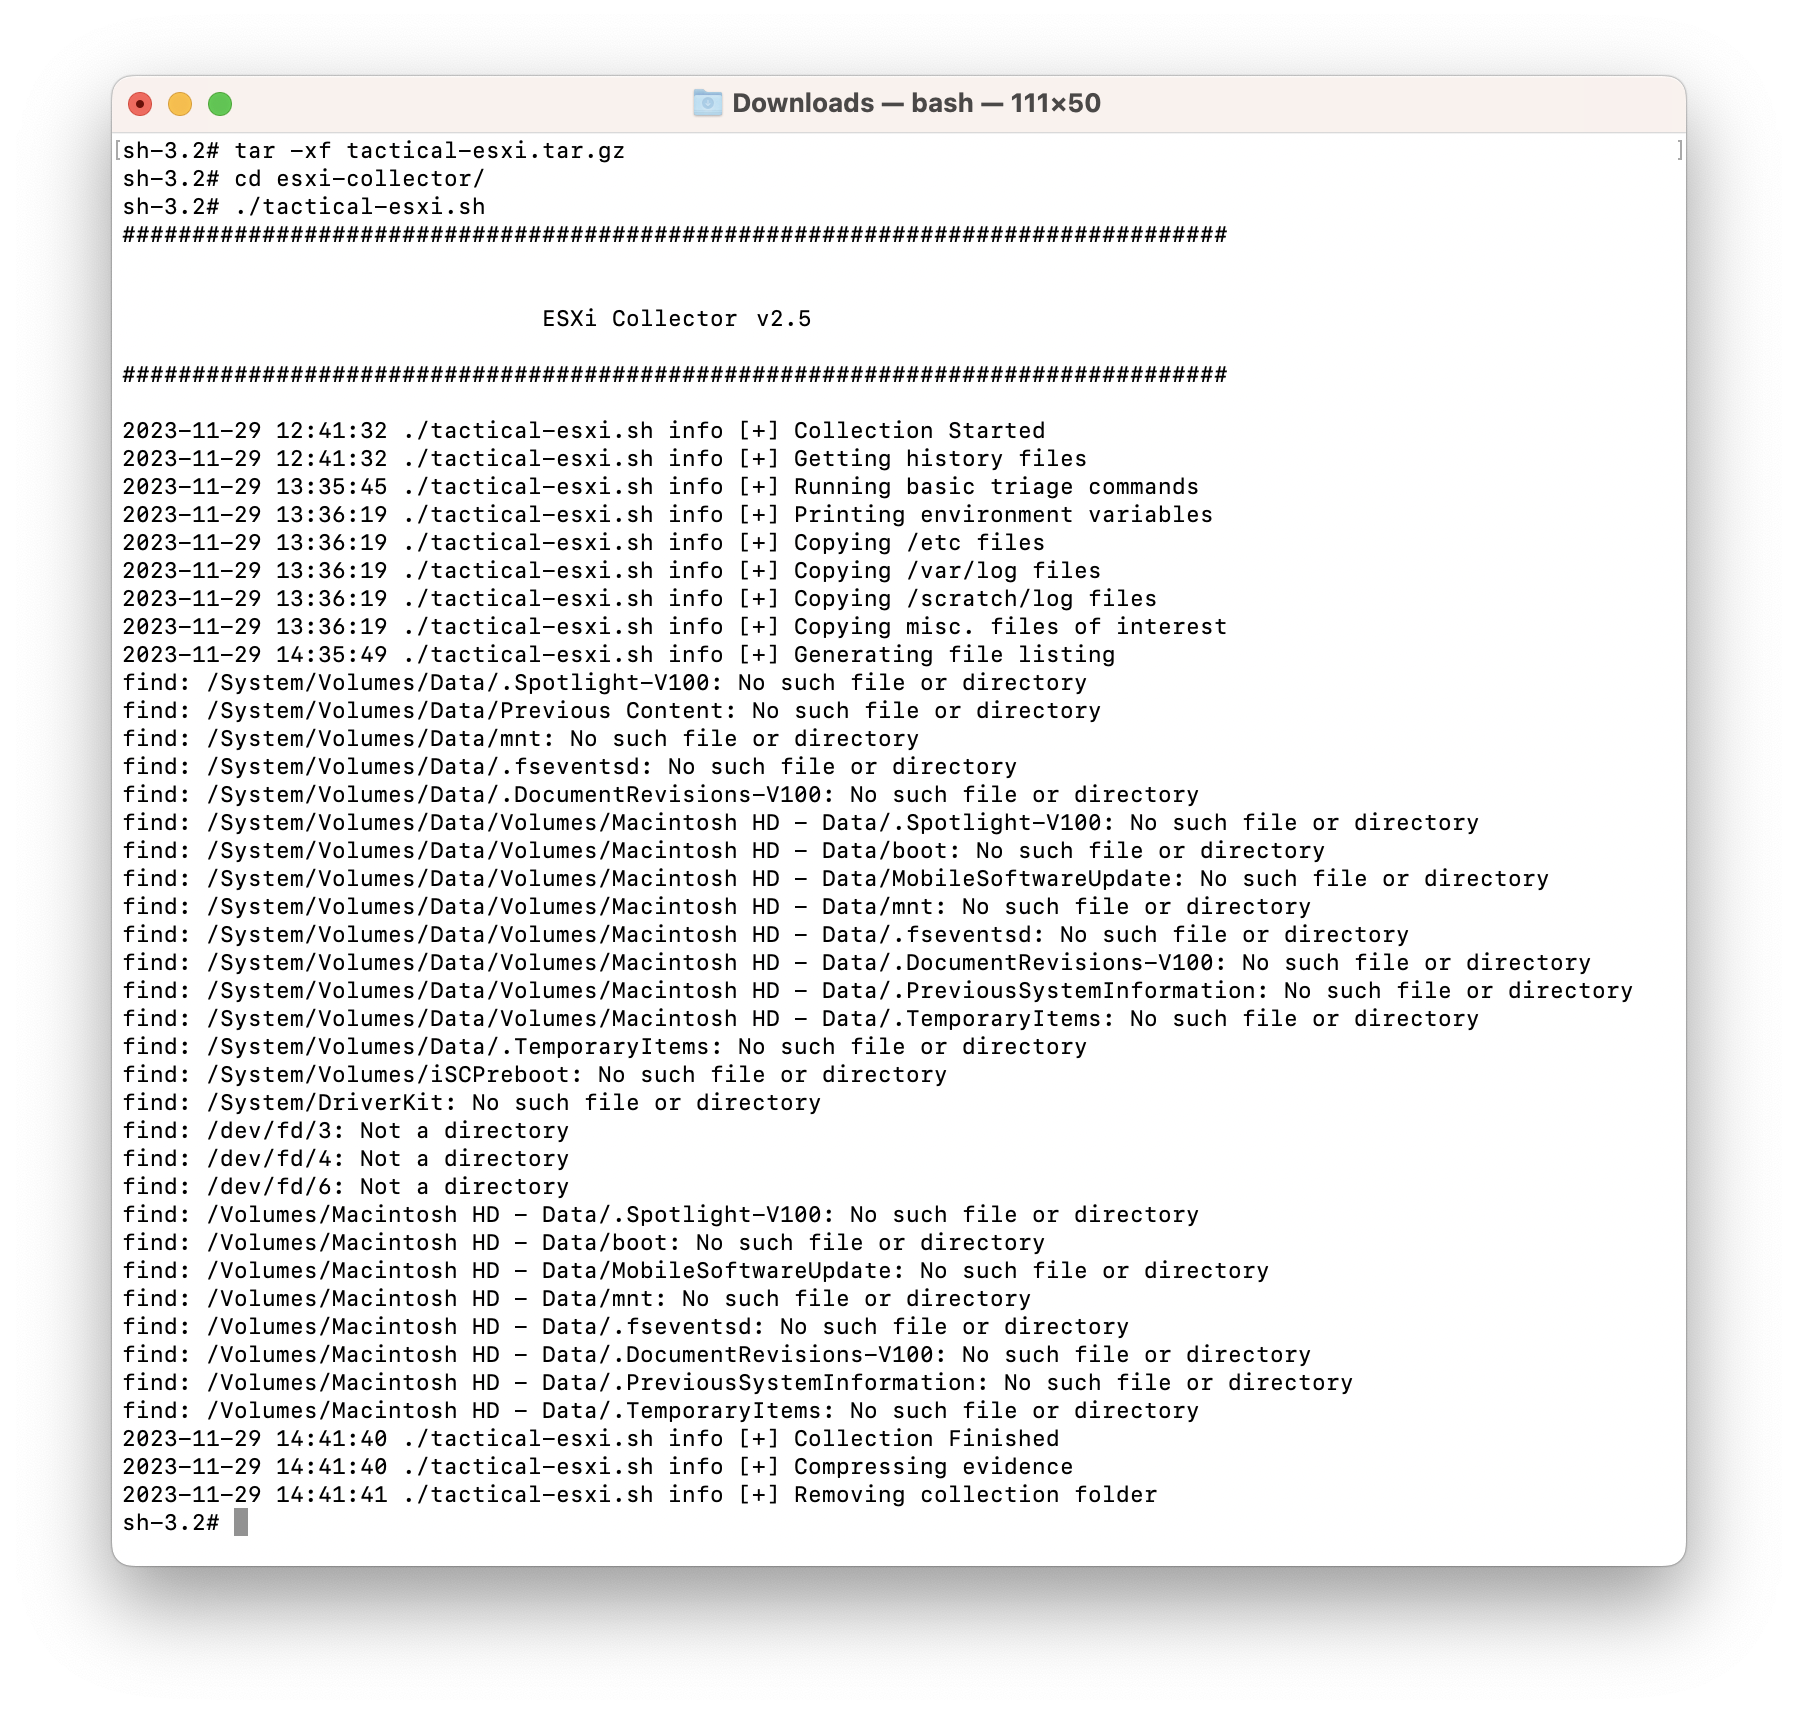
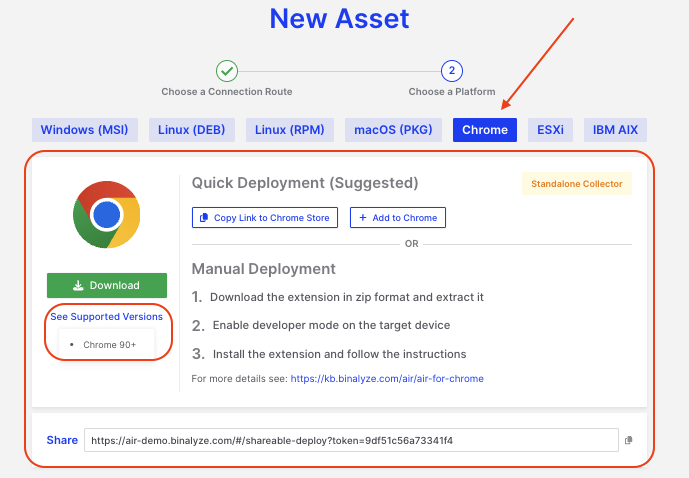




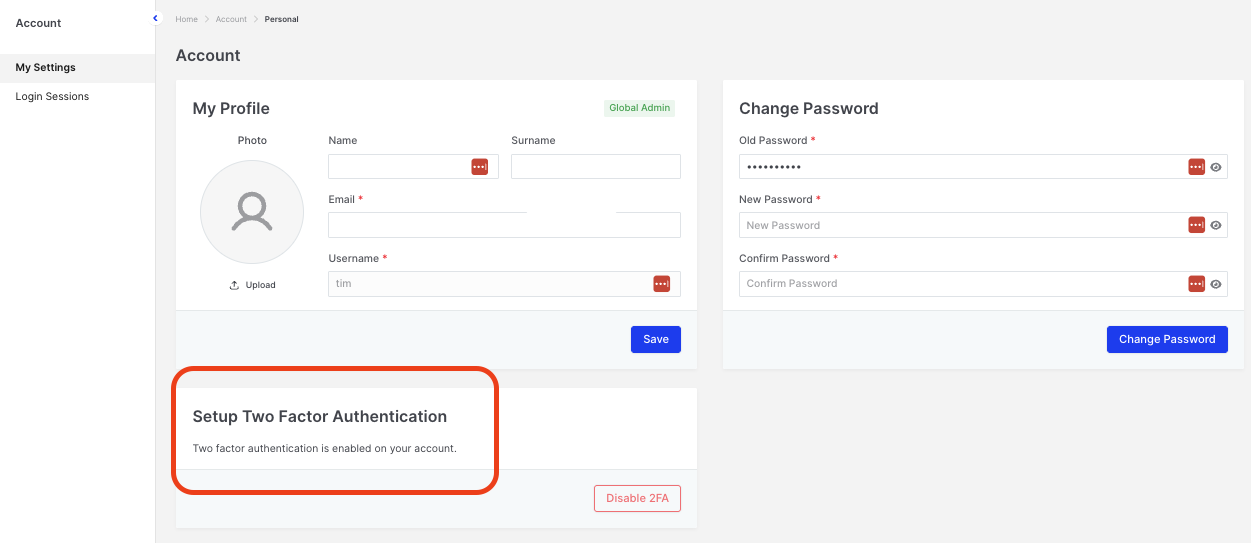
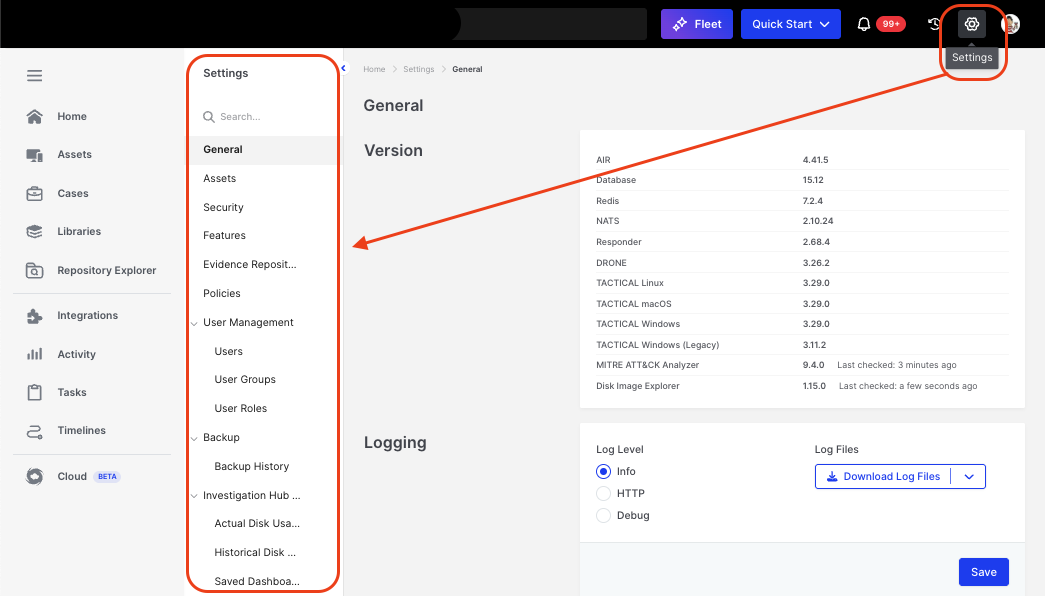
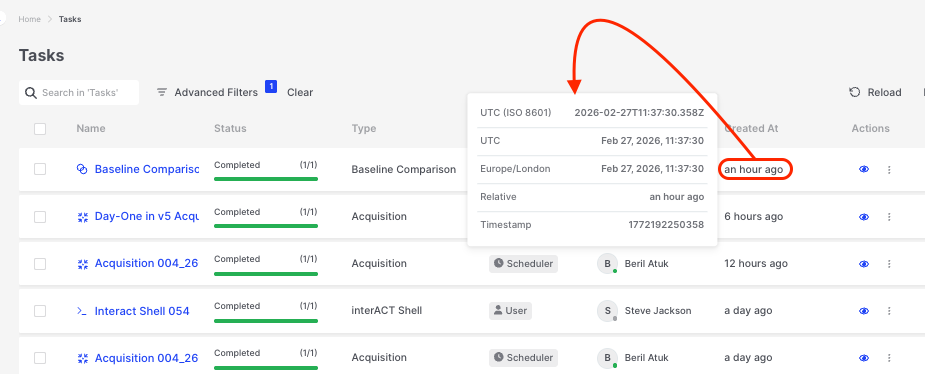
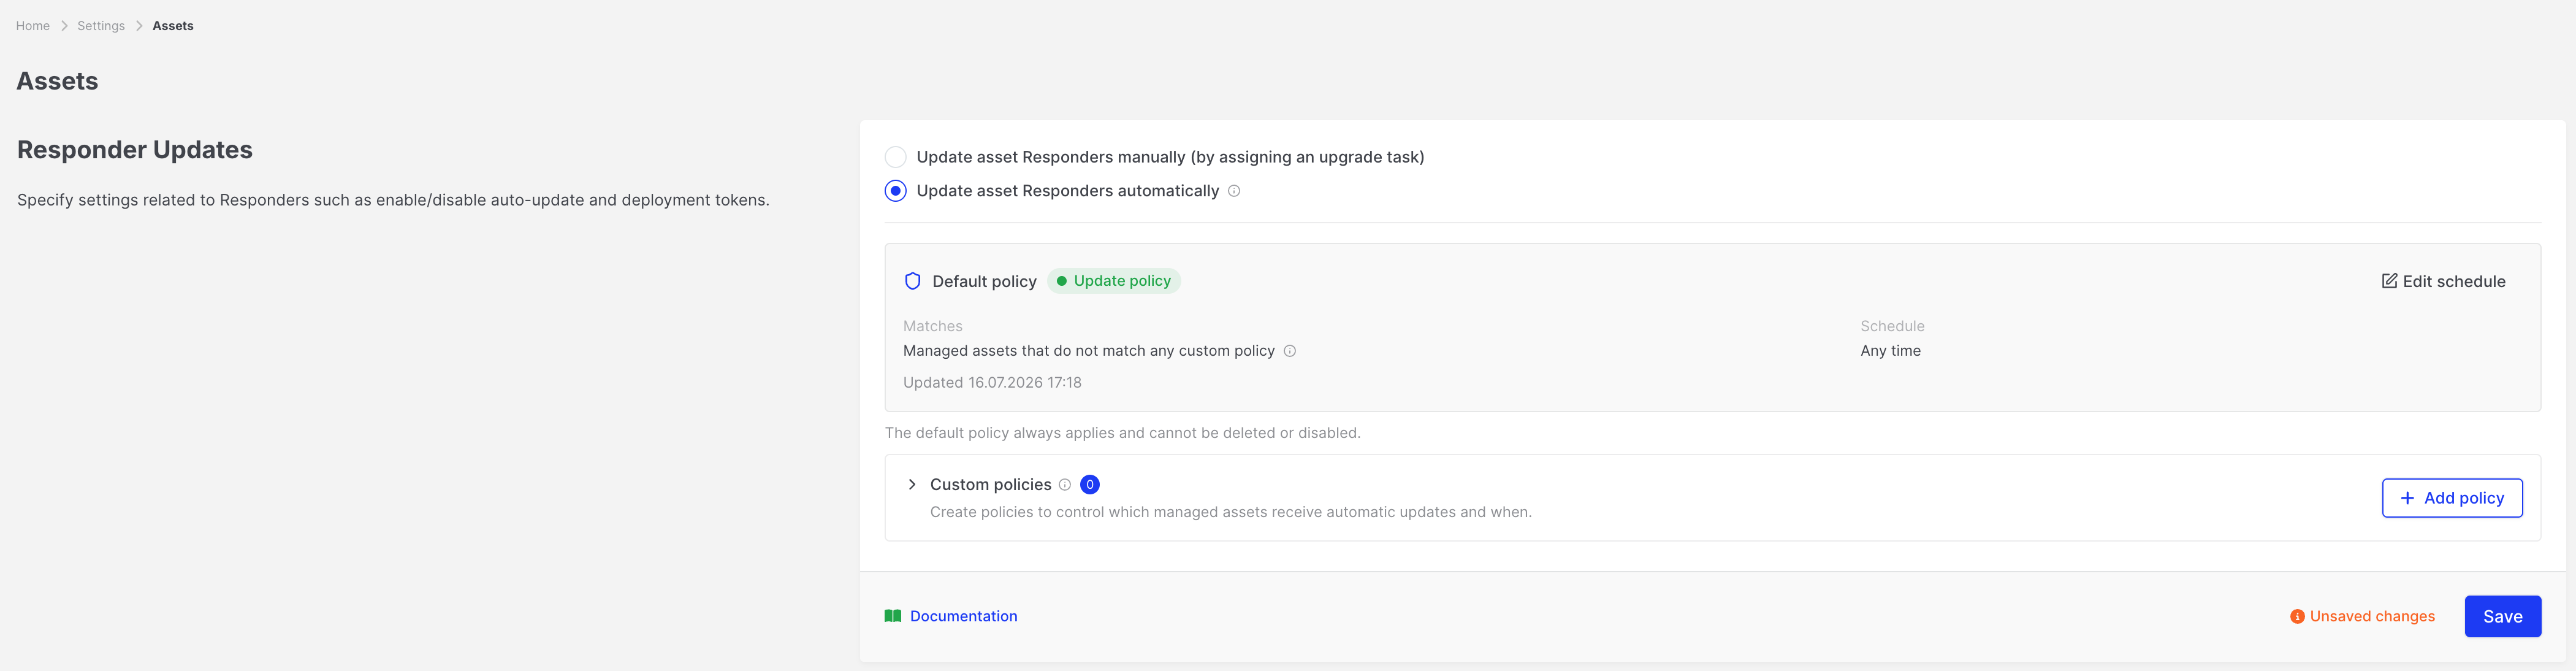 :::tip
You can keep custom policies configured while Manual Updates are selected. They become active again when you switch back to Automatic Updates and save.
:::
---
## Global Responder Update settings
### Open the settings
1. Open **Settings**.
2. Go to **Assets**.
3. Find the **Responder Updates** section.
Changes on this page are kept in a draft until you click **Save**. Leaving the page with unsaved changes shows a confirmation prompt.
:::tip
You can keep custom policies configured while Manual Updates are selected. They become active again when you switch back to Automatic Updates and save.
:::
---
## Global Responder Update settings
### Open the settings
1. Open **Settings**.
2. Go to **Assets**.
3. Find the **Responder Updates** section.
Changes on this page are kept in a draft until you click **Save**. Leaving the page with unsaved changes shows a confirmation prompt.
 ### Switch to Automatic Updates
1. Select **Update asset Responders automatically**.
2. Confirm when prompted (type **Enable** when asked).
3. Review the summary of enabled and disabled custom policies, and the Default policy schedule.
4. Click **Save**.
### Switch to Automatic Updates
1. Select **Update asset Responders automatically**.
2. Confirm when prompted (type **Enable** when asked).
3. Review the summary of enabled and disabled custom policies, and the Default policy schedule.
4. Click **Save**.
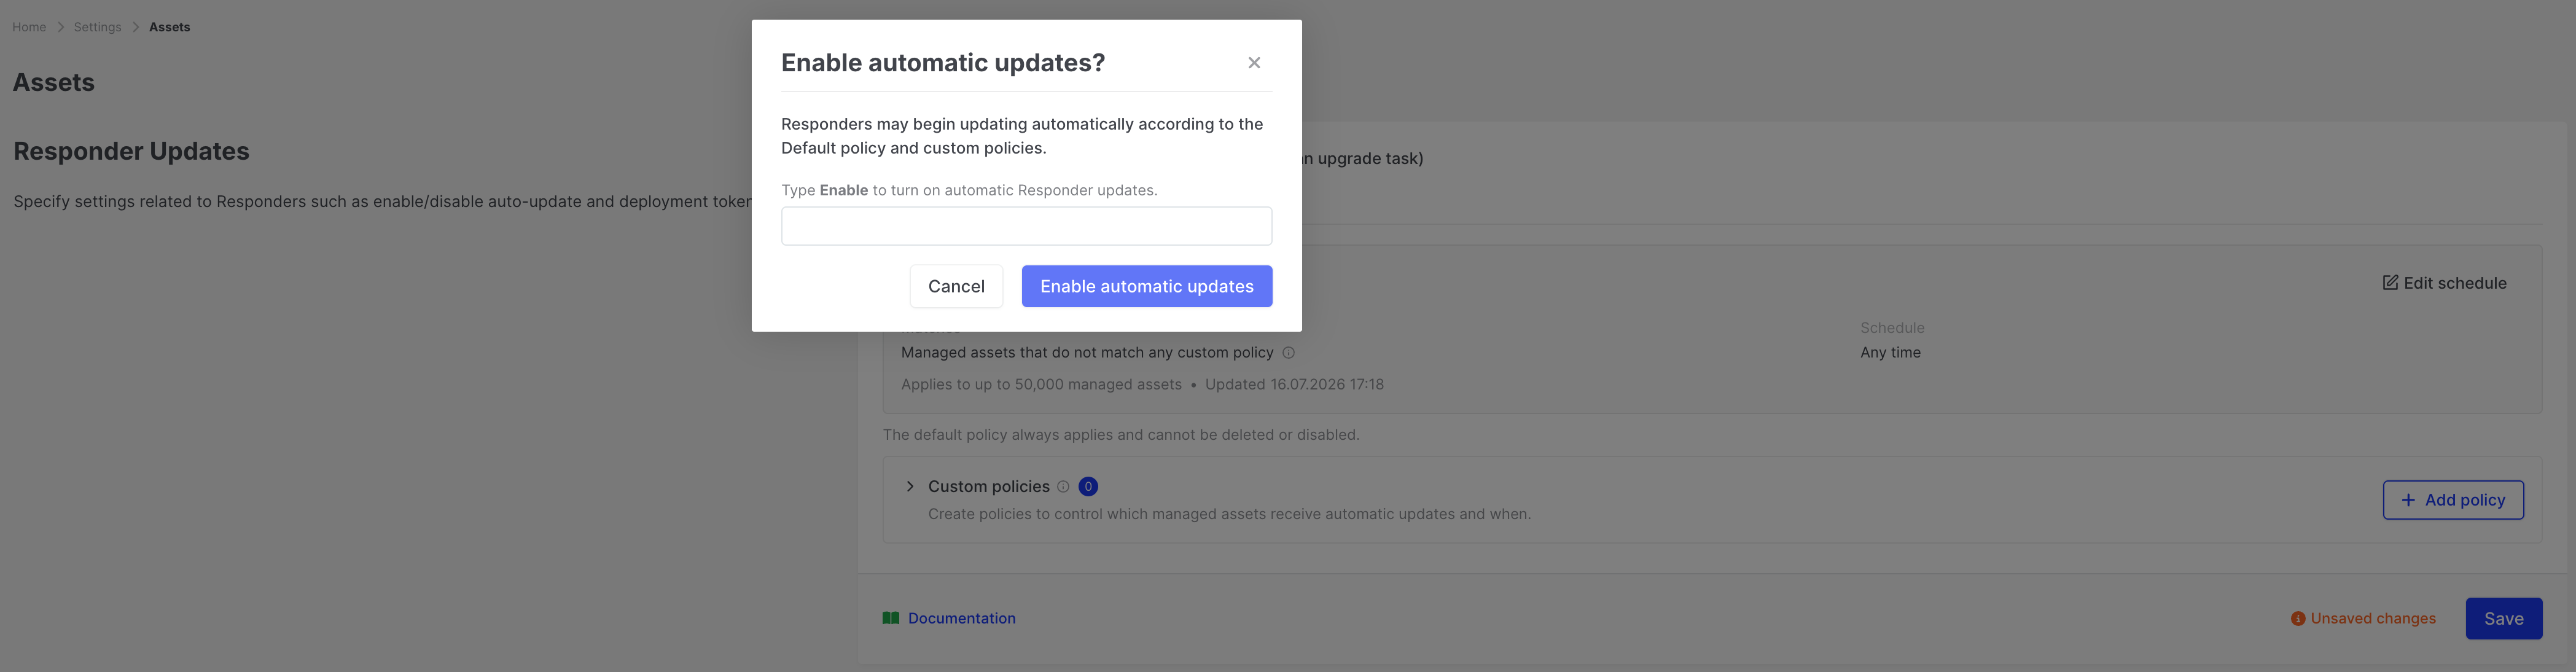 :::caution
Enabling Automatic Updates removes manually scheduled Responder update tasks that are still scheduled or assigned. Only proceed if you accept that impact.
:::
### Switch to Manual Updates
1. Select **Update asset Responders manually (by assigning an upgrade task)**.
2. Confirm when prompted (type **Manual** when asked).
3. Click **Save**.
Automatic configuration (Default policy and custom policies) remains stored but inactive.
:::caution
Enabling Automatic Updates removes manually scheduled Responder update tasks that are still scheduled or assigned. Only proceed if you accept that impact.
:::
### Switch to Manual Updates
1. Select **Update asset Responders manually (by assigning an upgrade task)**.
2. Confirm when prompted (type **Manual** when asked).
3. Click **Save**.
Automatic configuration (Default policy and custom policies) remains stored but inactive.
 ### Choose what happens when an update conflicts with running tasks
An update restarts the Responder, so it cannot run at the same time as an acquisition, Hunt/Triage, or other task. Under **When an update conflicts with running tasks**, choose which takes priority:
| Option | Behaviour |
| --- | --- |
| **Wait for running tasks to finish** | The update starts automatically once every running task completes, provided the update window is still open. Otherwise it moves to the next window. |
| **Stop running tasks and update immediately** | Running tasks are cancelled so the update can start. They must be started again manually. |
### Choose what happens when an update conflicts with running tasks
An update restarts the Responder, so it cannot run at the same time as an acquisition, Hunt/Triage, or other task. Under **When an update conflicts with running tasks**, choose which takes priority:
| Option | Behaviour |
| --- | --- |
| **Wait for running tasks to finish** | The update starts automatically once every running task completes, provided the update window is still open. Otherwise it moves to the next window. |
| **Stop running tasks and update immediately** | Running tasks are cancelled so the update can start. They must be started again manually. |
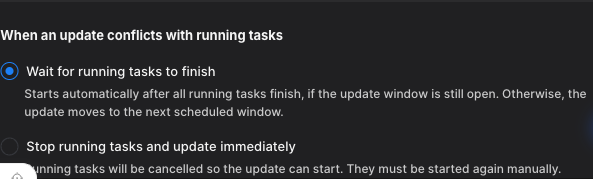
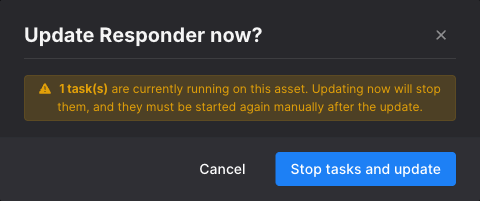
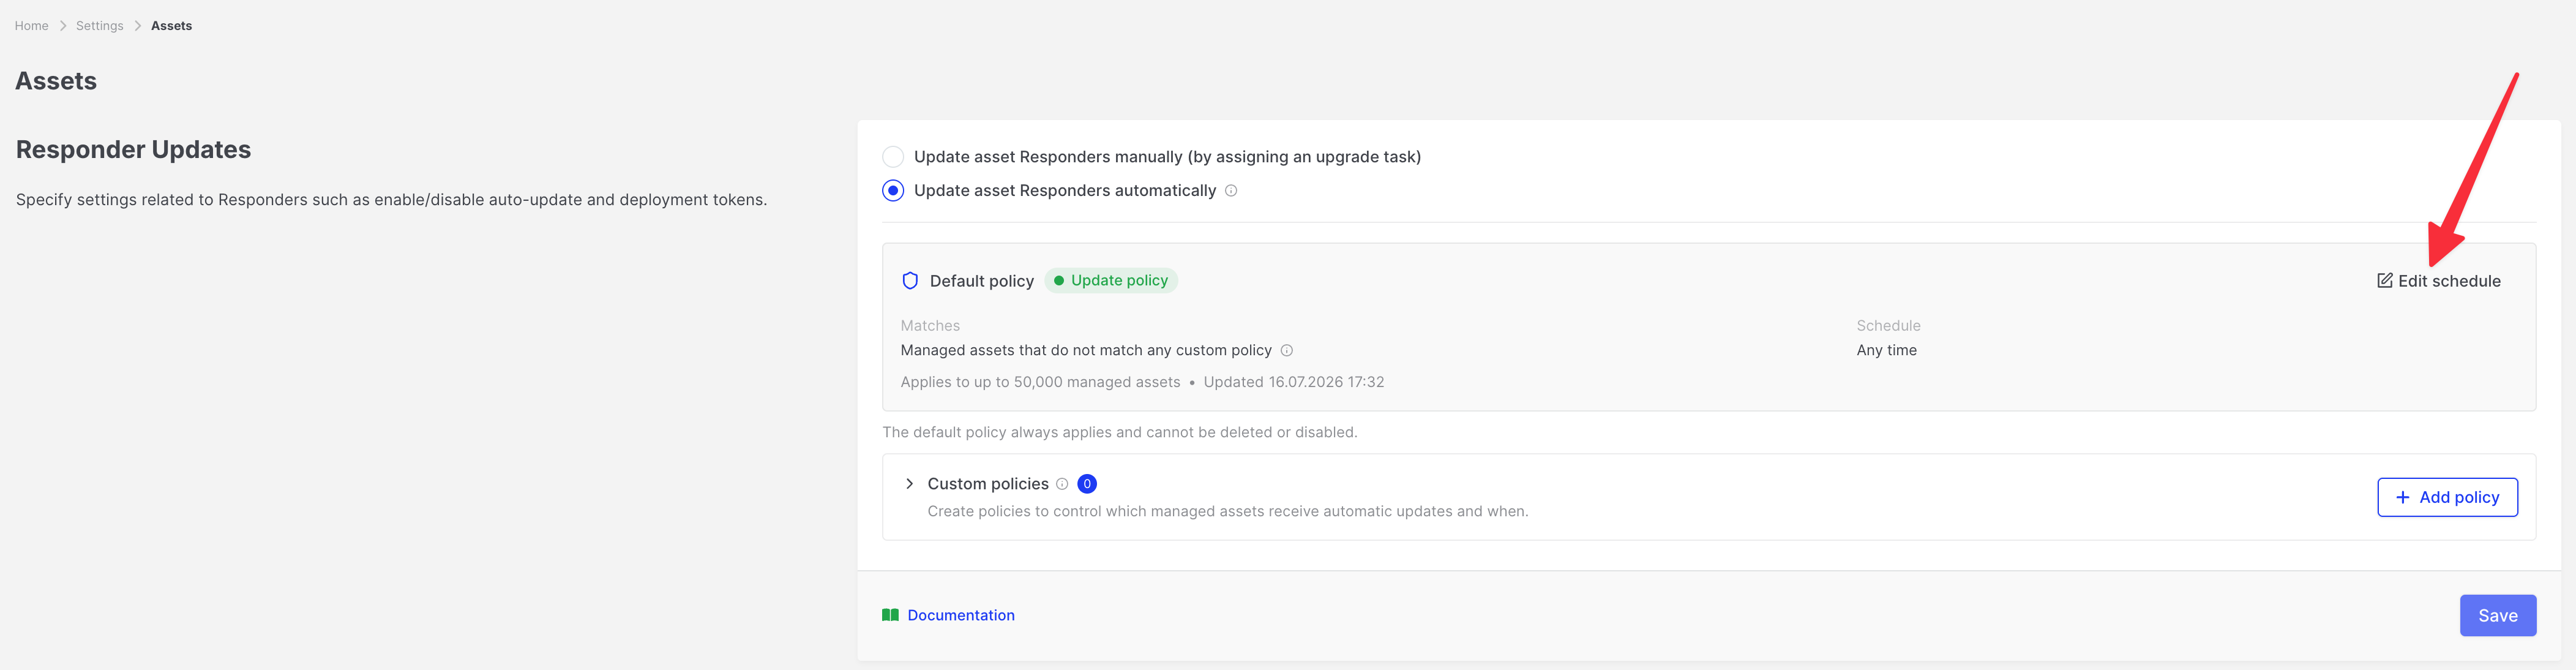 Timezone options:
- **Use each asset's local timezone**, or
- A **specific timezone** you select
Timezone options:
- **Use each asset's local timezone**, or
- A **specific timezone** you select
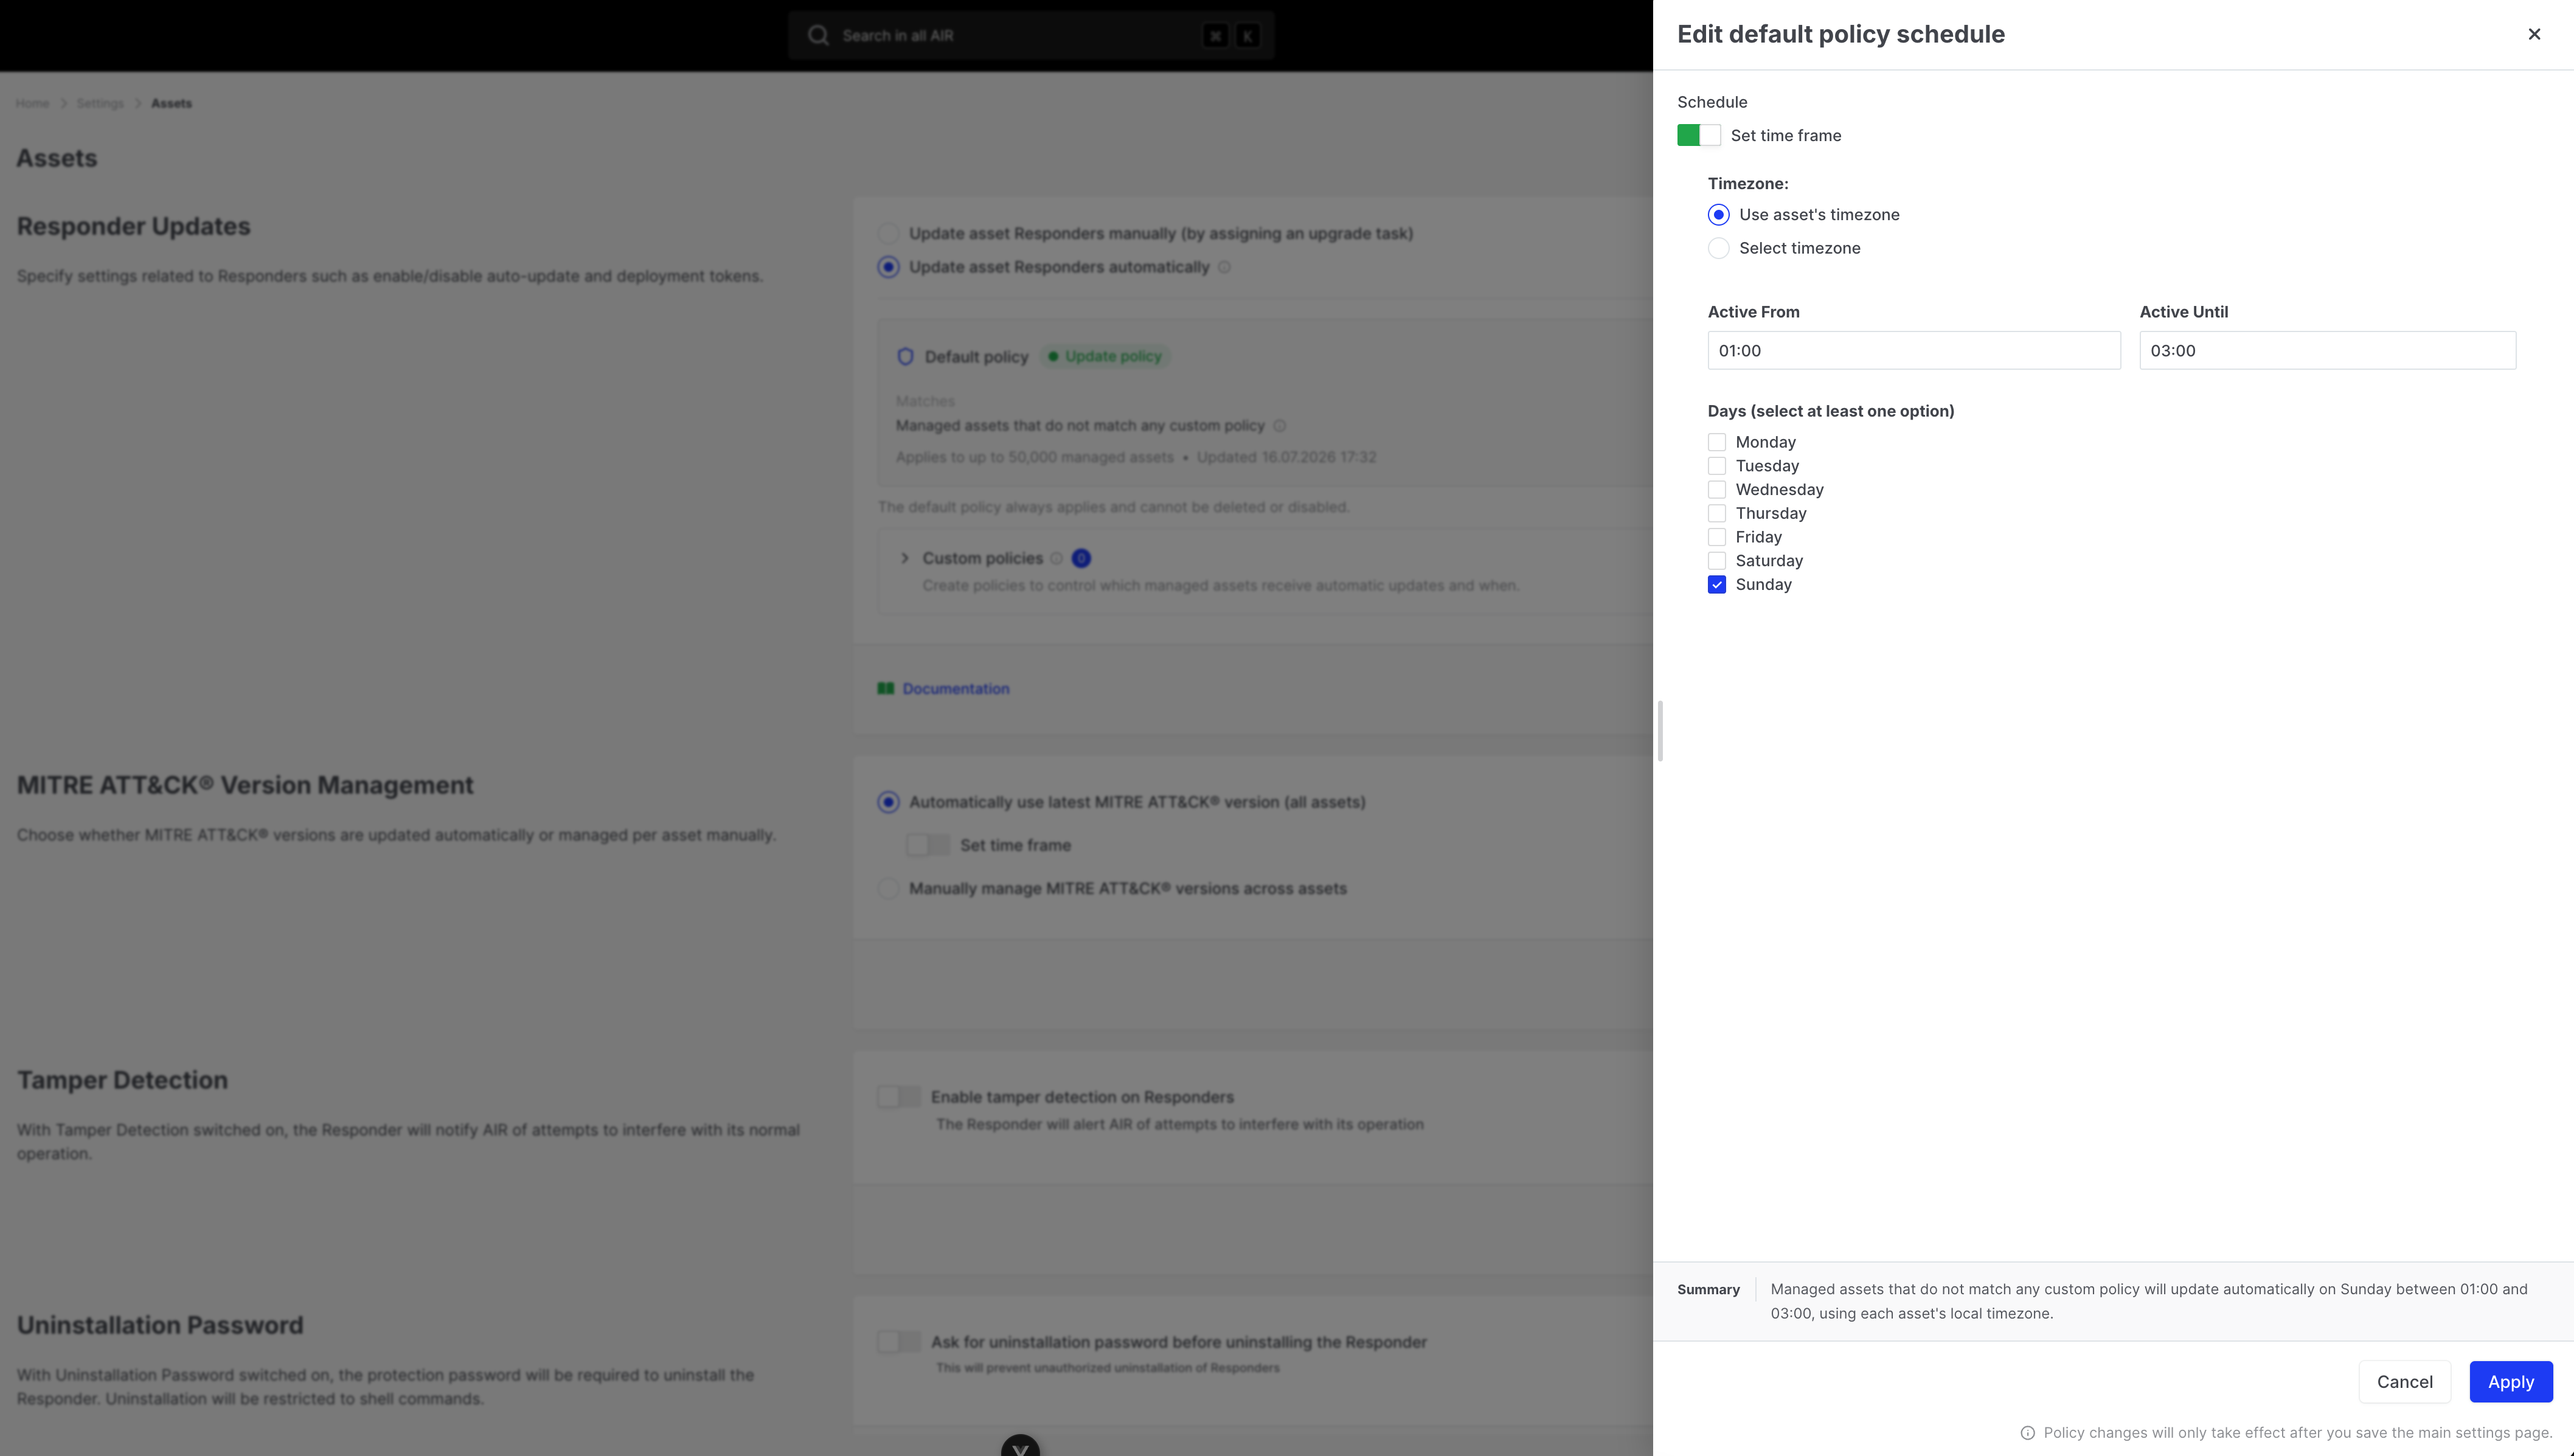 :::note
The "applies to up to N managed assets" count for the Default policy is an **approximate upper bound**. Assets that match a custom policy follow that policy instead.
:::
---
## Custom update policies
Custom **update policies** refine Automatic Updates for filtered groups of managed assets. Each update policy can use its own schedule and timezone.
Typical uses:
- Update Windows workstations only during a maintenance window
- Use a different schedule for a production organization or tag
- Roll updates for one platform earlier than another
### What an update policy controls
| Field | Description |
| --- | --- |
| **Policy name** | Unique name shown in Settings and on asset status |
| **Behaviour** | **Update automatically** |
| **Filter** | Asset conditions that must match |
| **Enabled** | Disabled policies are ignored |
| **Schedule** | Any time, or a day/time window with timezone |
Update policies do **not** set a specific Responder version. Matching eligible assets receive the Console's current Responder version.
:::note
The "applies to up to N managed assets" count for the Default policy is an **approximate upper bound**. Assets that match a custom policy follow that policy instead.
:::
---
## Custom update policies
Custom **update policies** refine Automatic Updates for filtered groups of managed assets. Each update policy can use its own schedule and timezone.
Typical uses:
- Update Windows workstations only during a maintenance window
- Use a different schedule for a production organization or tag
- Roll updates for one platform earlier than another
### What an update policy controls
| Field | Description |
| --- | --- |
| **Policy name** | Unique name shown in Settings and on asset status |
| **Behaviour** | **Update automatically** |
| **Filter** | Asset conditions that must match |
| **Enabled** | Disabled policies are ignored |
| **Schedule** | Any time, or a day/time window with timezone |
Update policies do **not** set a specific Responder version. Matching eligible assets receive the Console's current Responder version.
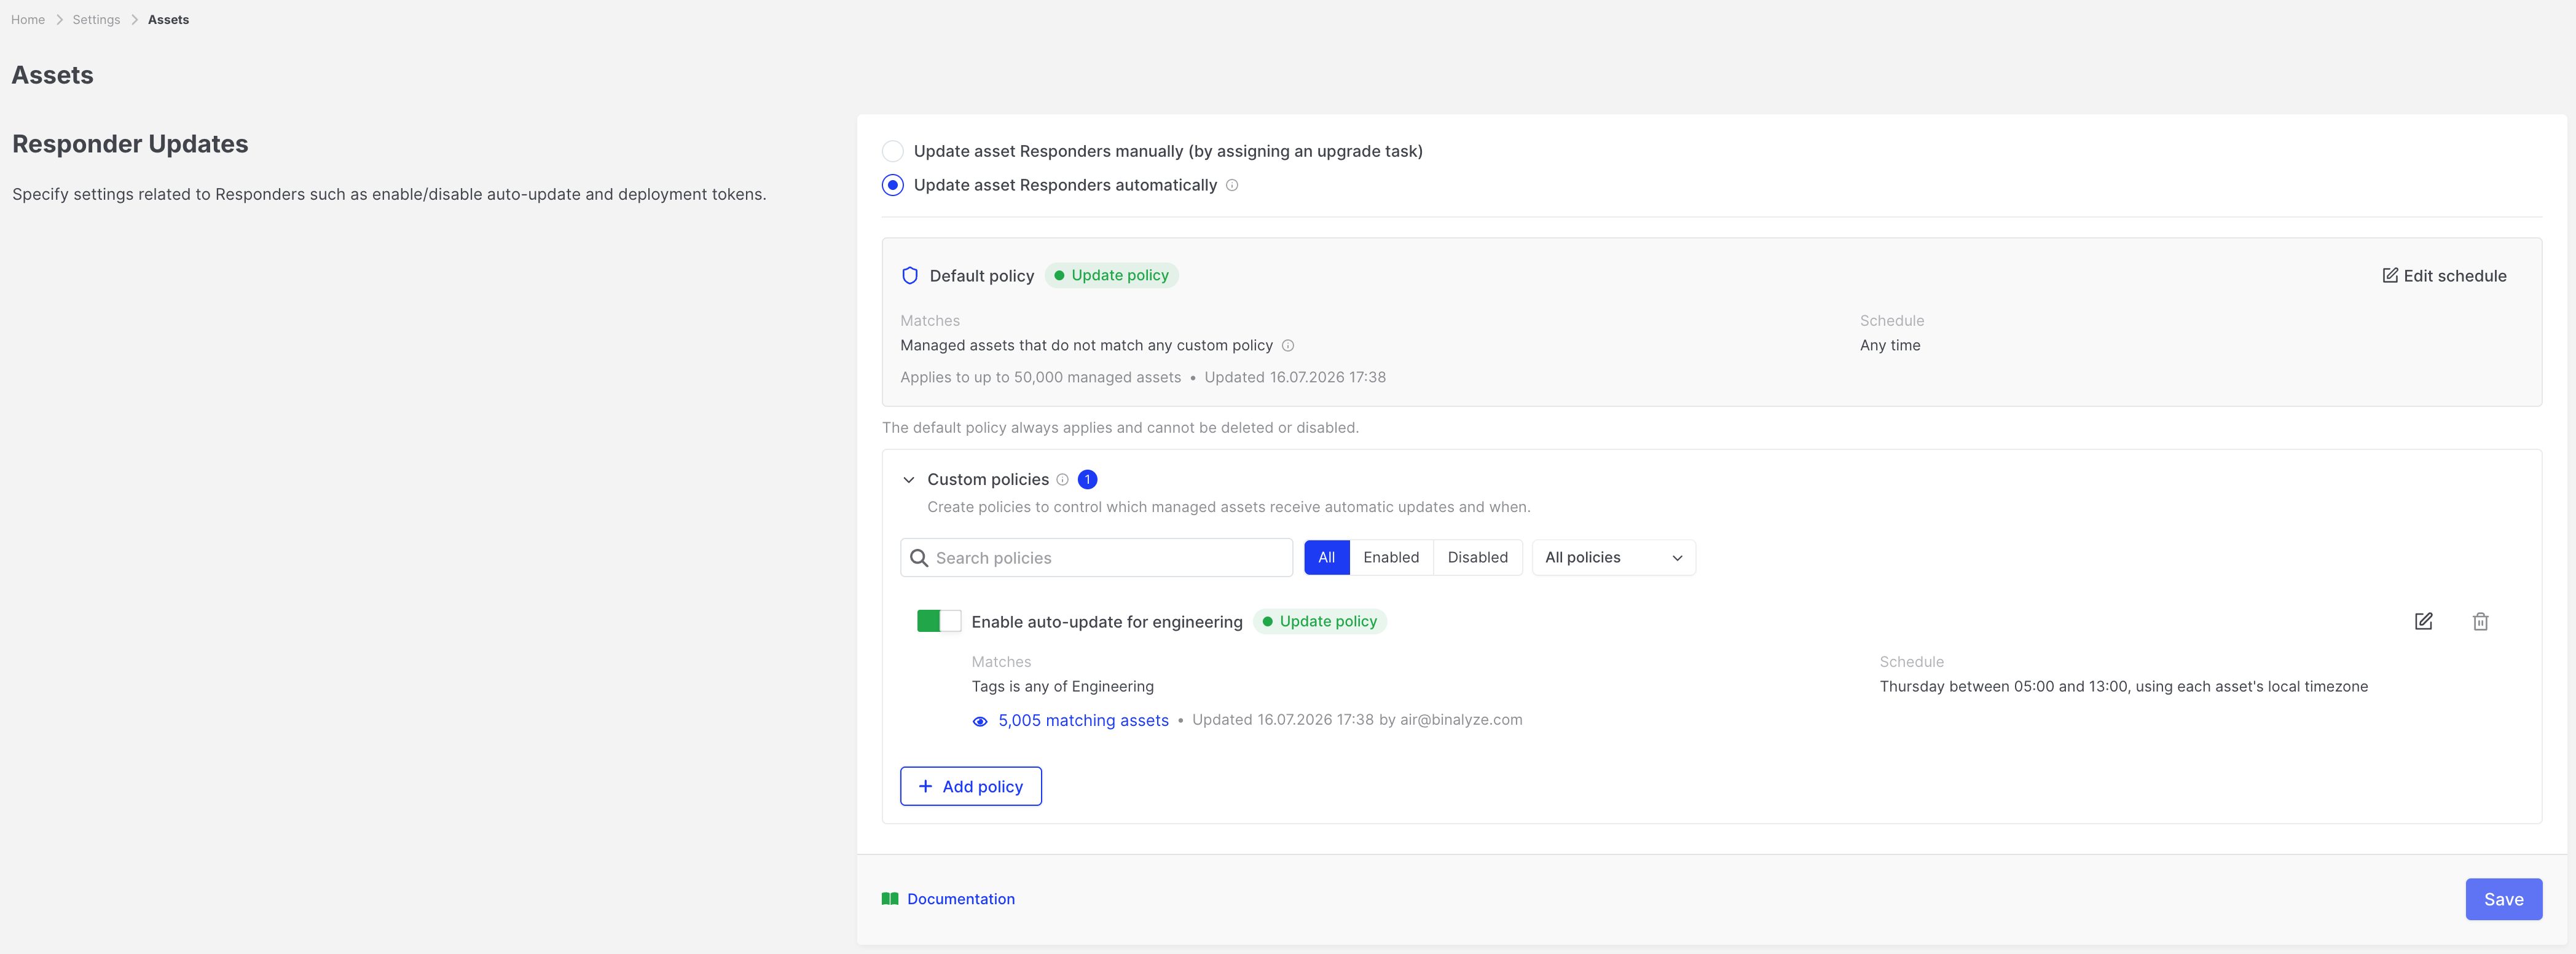 ---
## Exclusion policies
An **exclusion policy** uses the same filter model as an update policy, but its behaviour is **Exclude from automatic updates**.
Matching managed assets **never update automatically**, even when the Default policy would update them.
Exclusion policies:
- Do **not** use a schedule
- Do **not** block manually assigned **Update Responder Version** tasks
- Can be enabled or disabled like update policies
---
## Exclusion policies
An **exclusion policy** uses the same filter model as an update policy, but its behaviour is **Exclude from automatic updates**.
Matching managed assets **never update automatically**, even when the Default policy would update them.
Exclusion policies:
- Do **not** use a schedule
- Do **not** block manually assigned **Update Responder Version** tasks
- Can be enabled or disabled like update policies
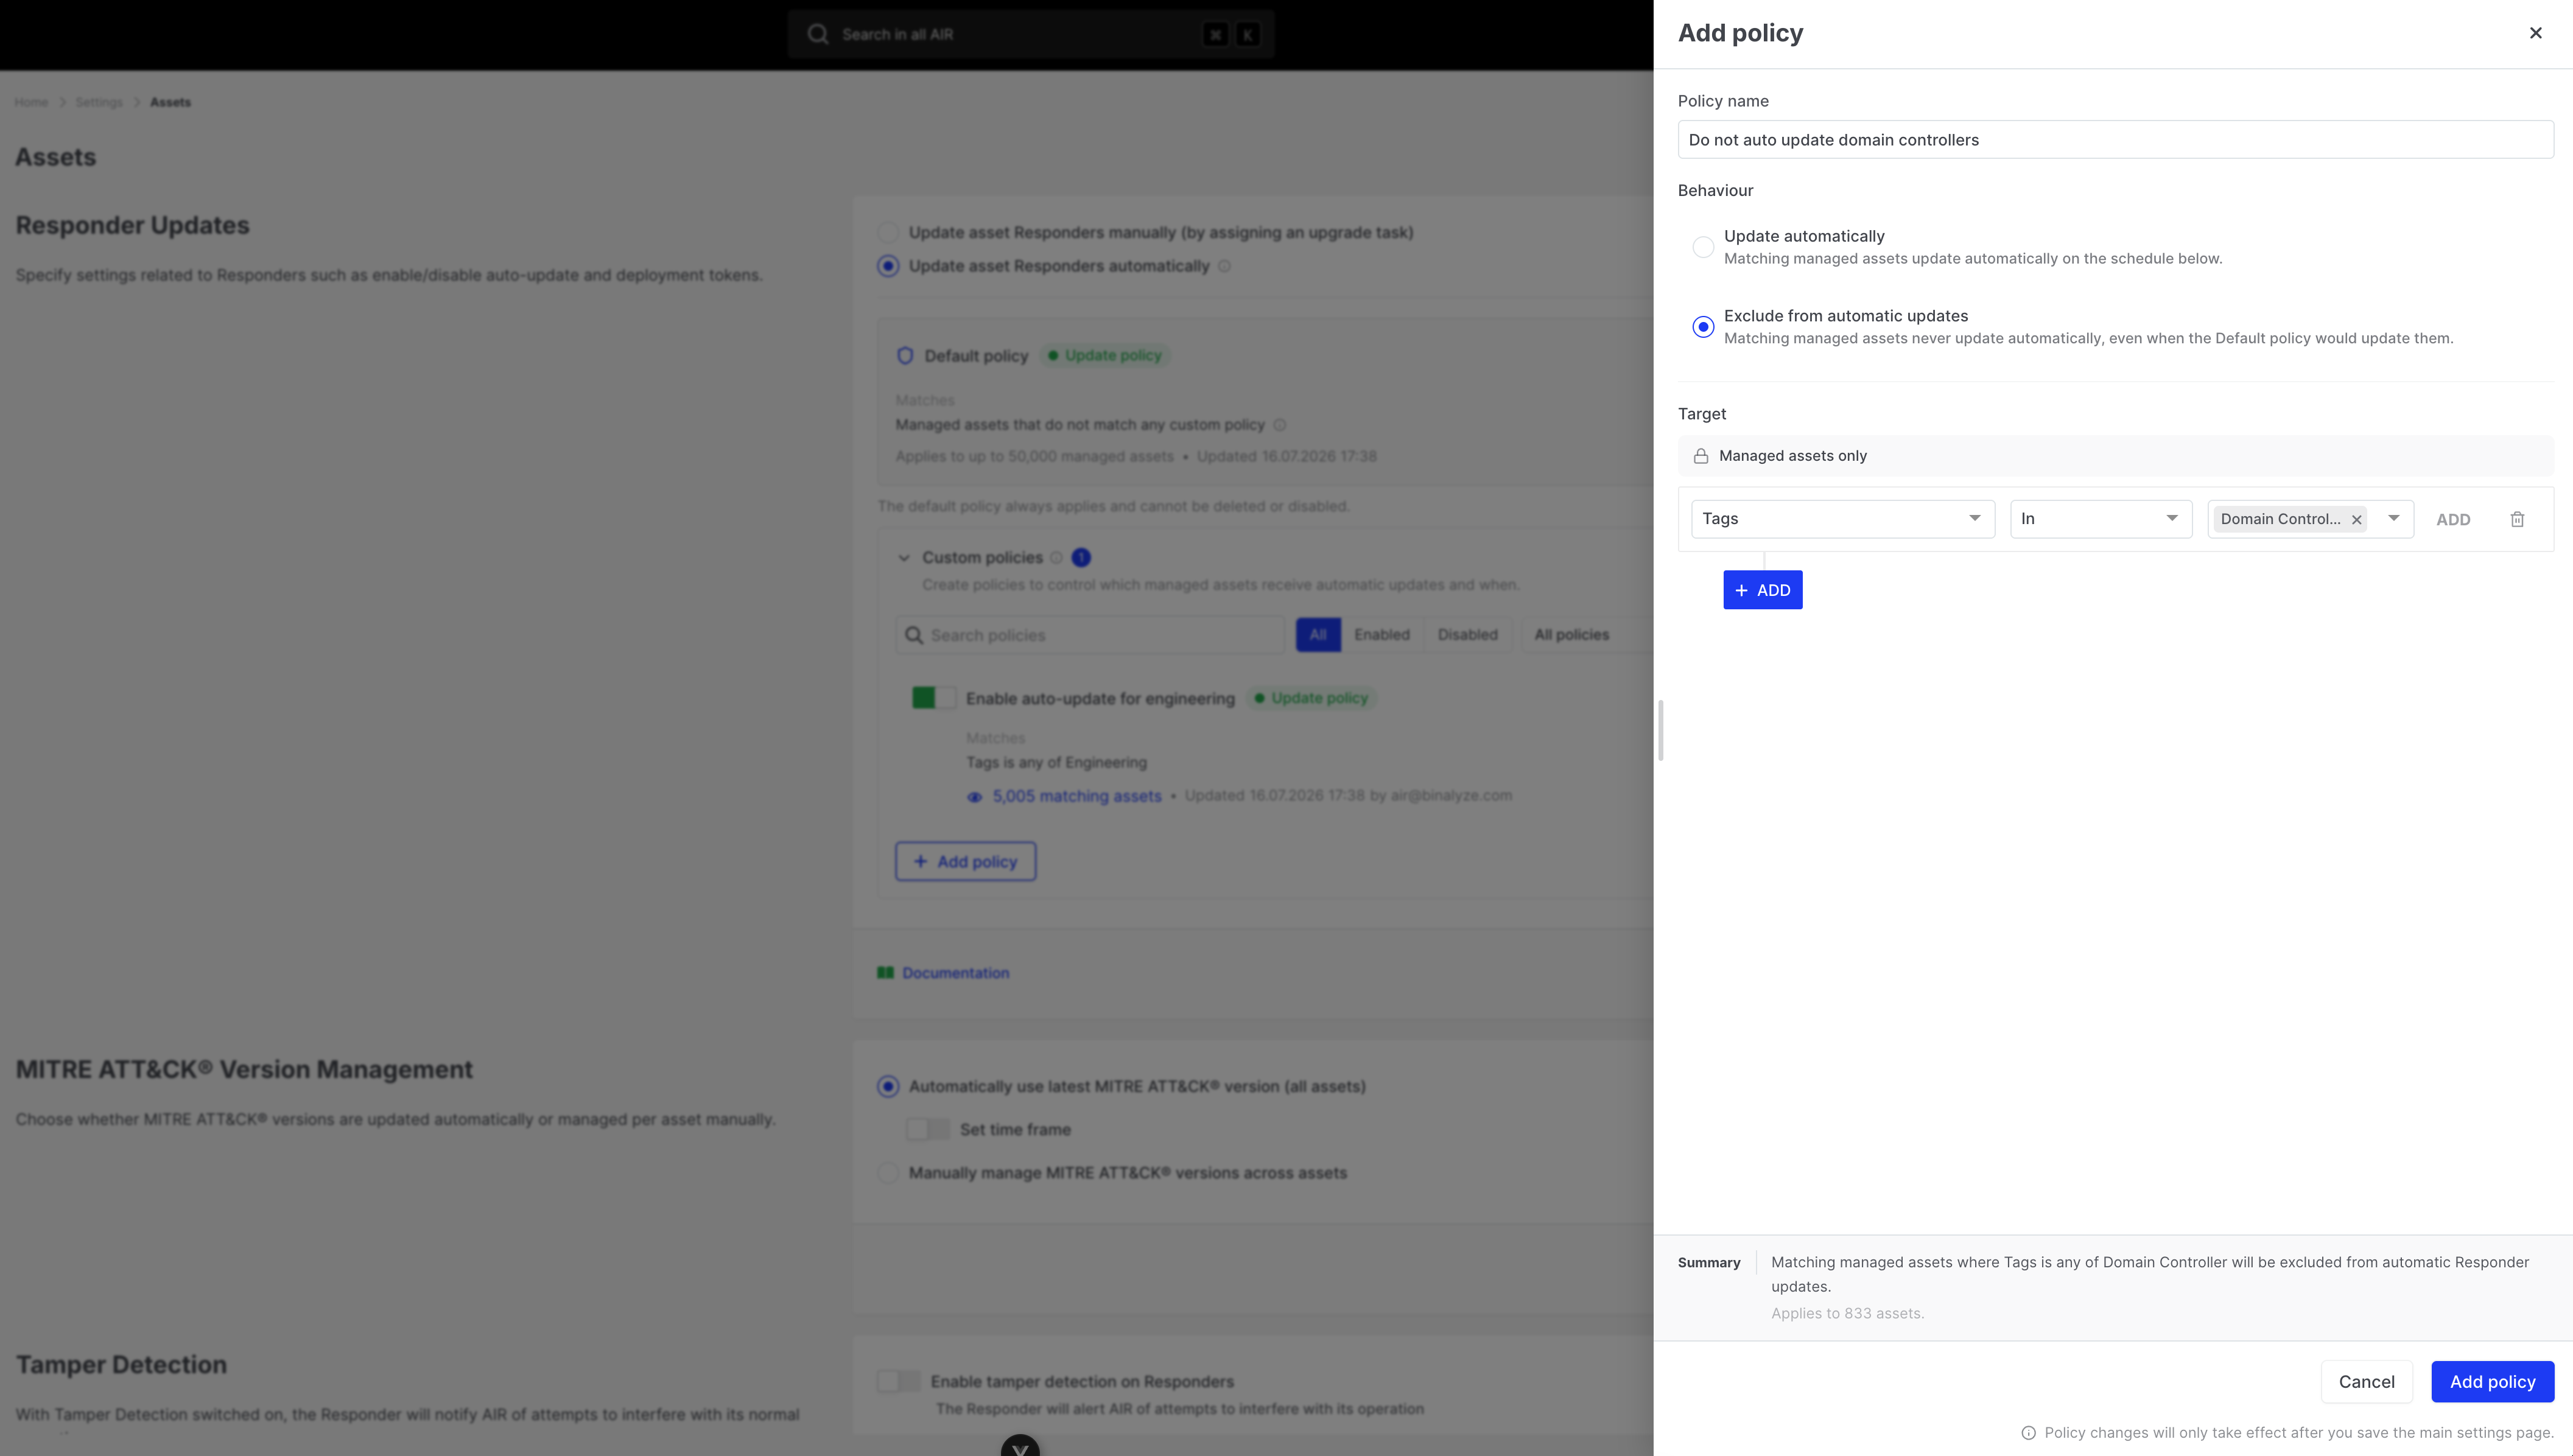 :::tip
Use exclusion policies for groups (for example, all Linux servers or a `no-auto-update` tag). Use **manual exclusion** for individual critical assets.
:::
---
## Manually excluded assets
You can exclude a specific asset from Responder updates without creating a policy.
### Exclude an asset
From the asset list (bulk actions) or asset actions, choose the exclude-from-updates action and confirm.
:::tip
Use exclusion policies for groups (for example, all Linux servers or a `no-auto-update` tag). Use **manual exclusion** for individual critical assets.
:::
---
## Manually excluded assets
You can exclude a specific asset from Responder updates without creating a policy.
### Exclude an asset
From the asset list (bulk actions) or asset actions, choose the exclude-from-updates action and confirm.
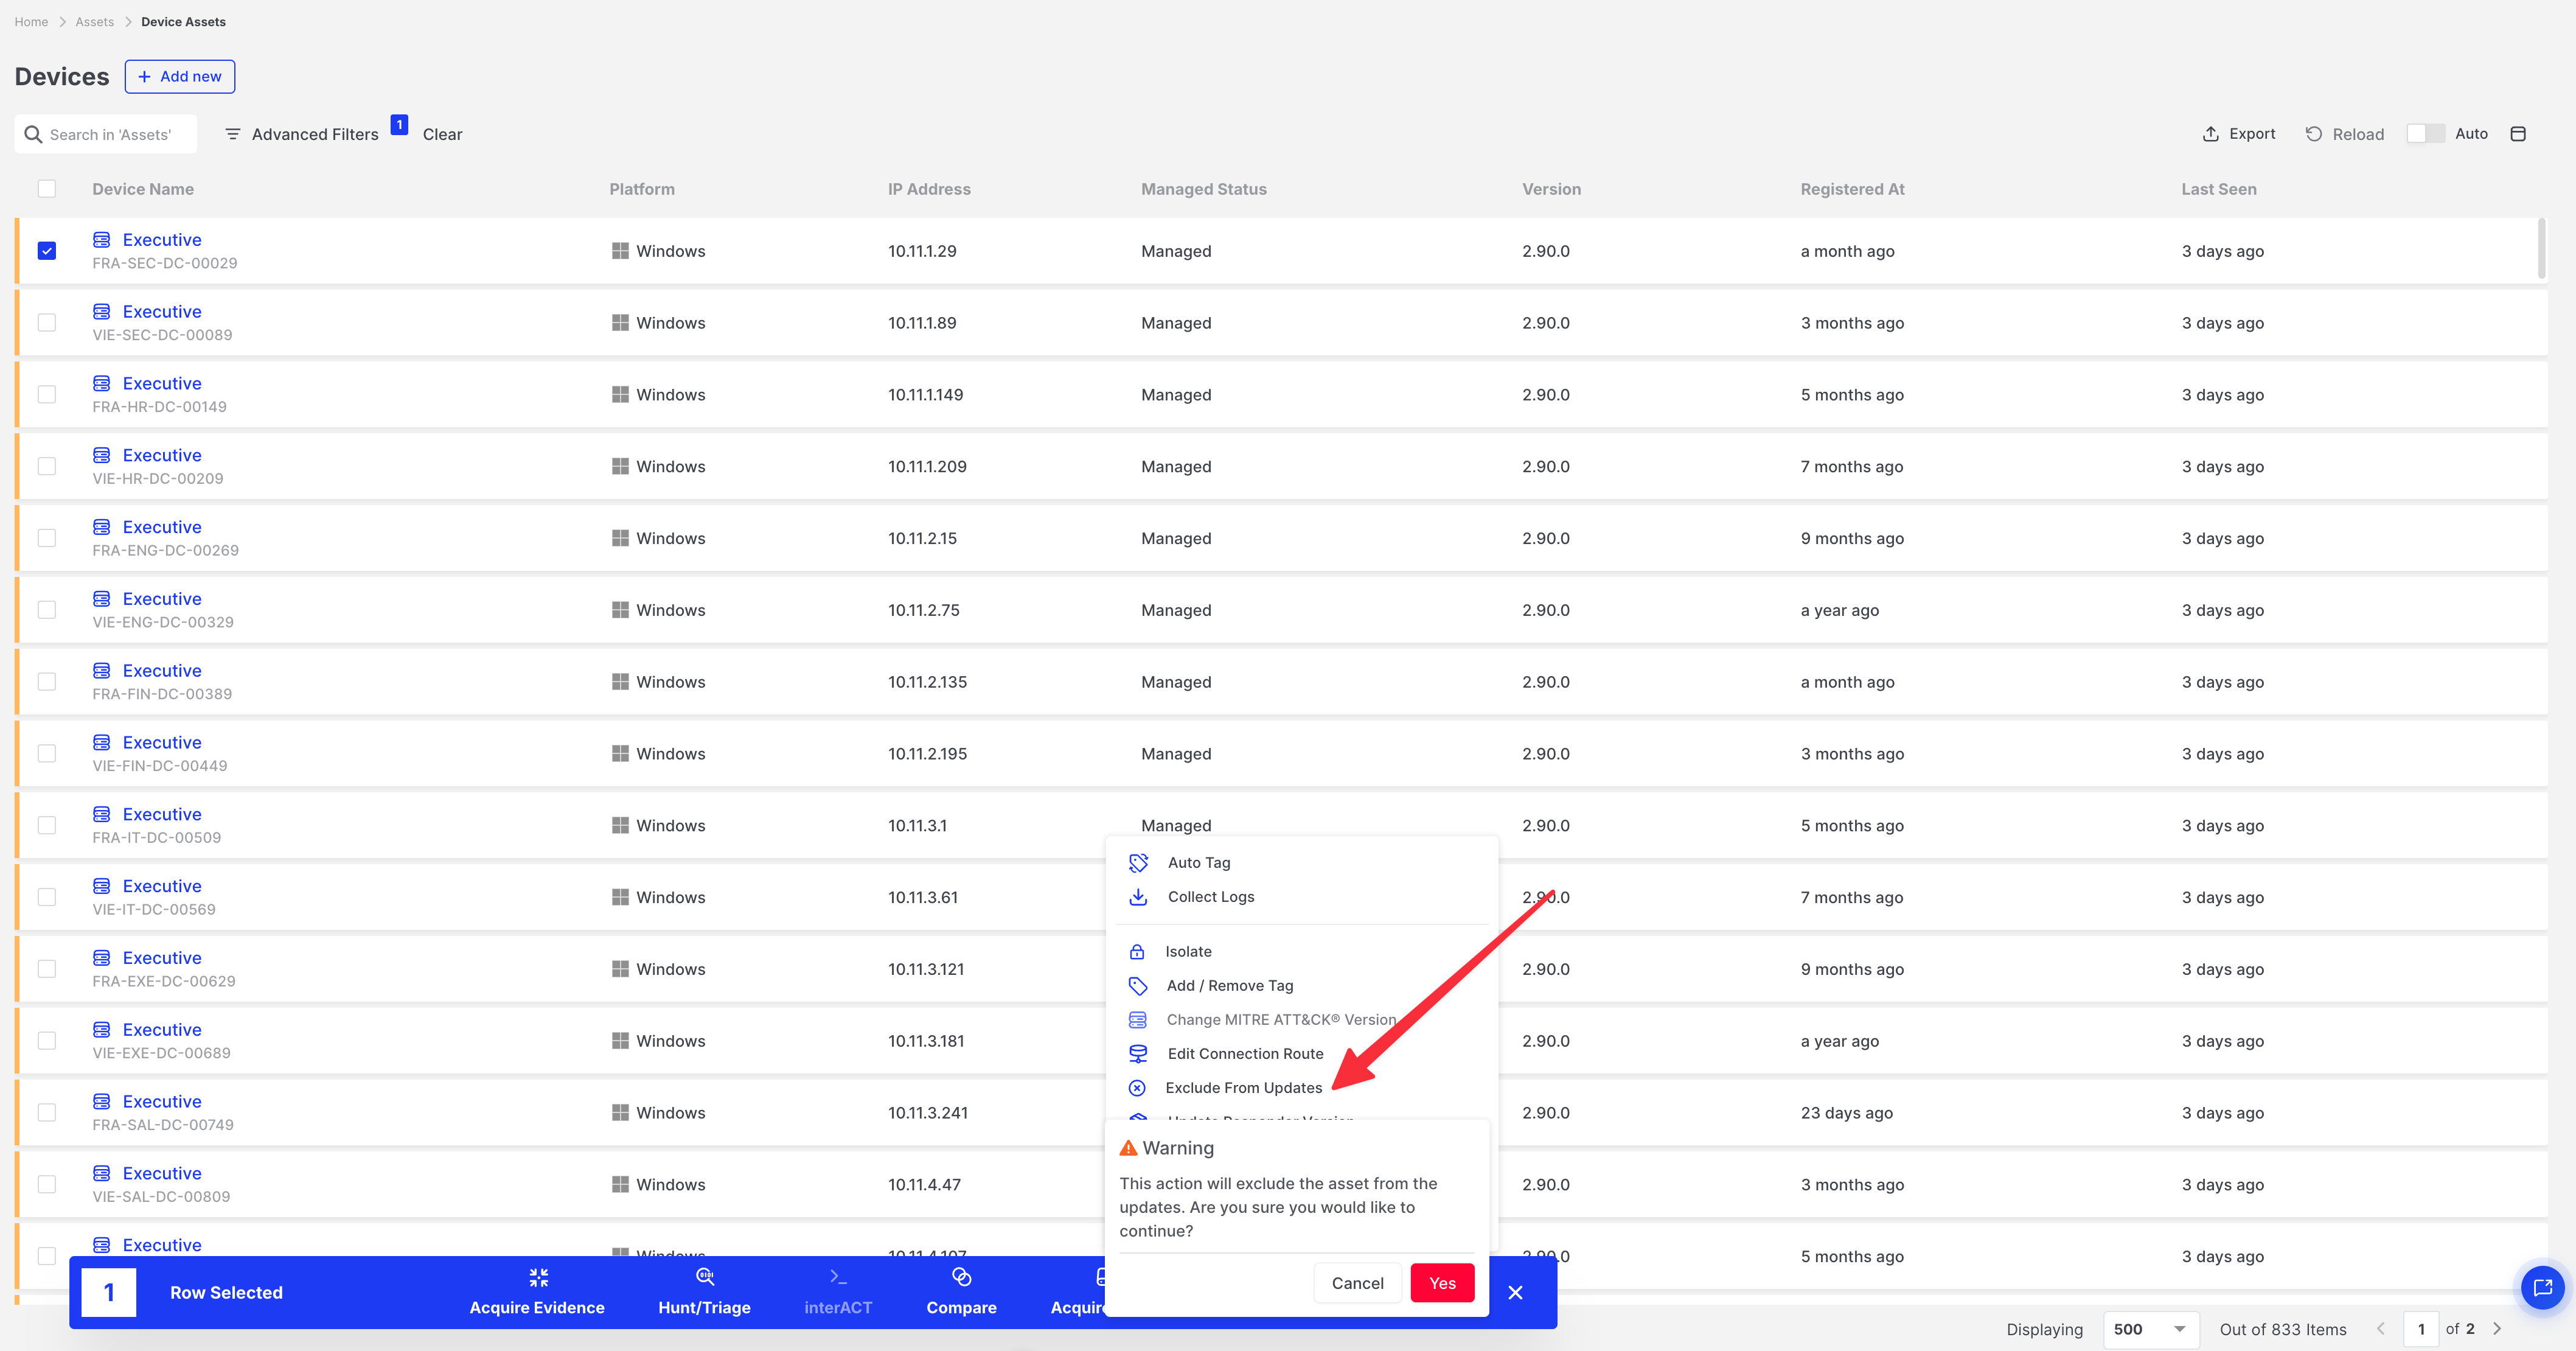 While an asset is manually excluded:
- It does **not** receive automatic Responder updates
- Queued update tasks are **not delivered** until the asset is included again
- The asset detail **Responder Update Status** shows **Manually excluded from updates**
### Include an asset again
Use **Include in updates** from the asset detail status card, asset actions, or bulk actions, then confirm.
:::caution
If an asset is manually excluded, include it again before you expect an assigned update task to run on that asset.
:::
While an asset is manually excluded:
- It does **not** receive automatic Responder updates
- Queued update tasks are **not delivered** until the asset is included again
- The asset detail **Responder Update Status** shows **Manually excluded from updates**
### Include an asset again
Use **Include in updates** from the asset detail status card, asset actions, or bulk actions, then confirm.
:::caution
If an asset is manually excluded, include it again before you expect an assigned update task to run on that asset.
:::
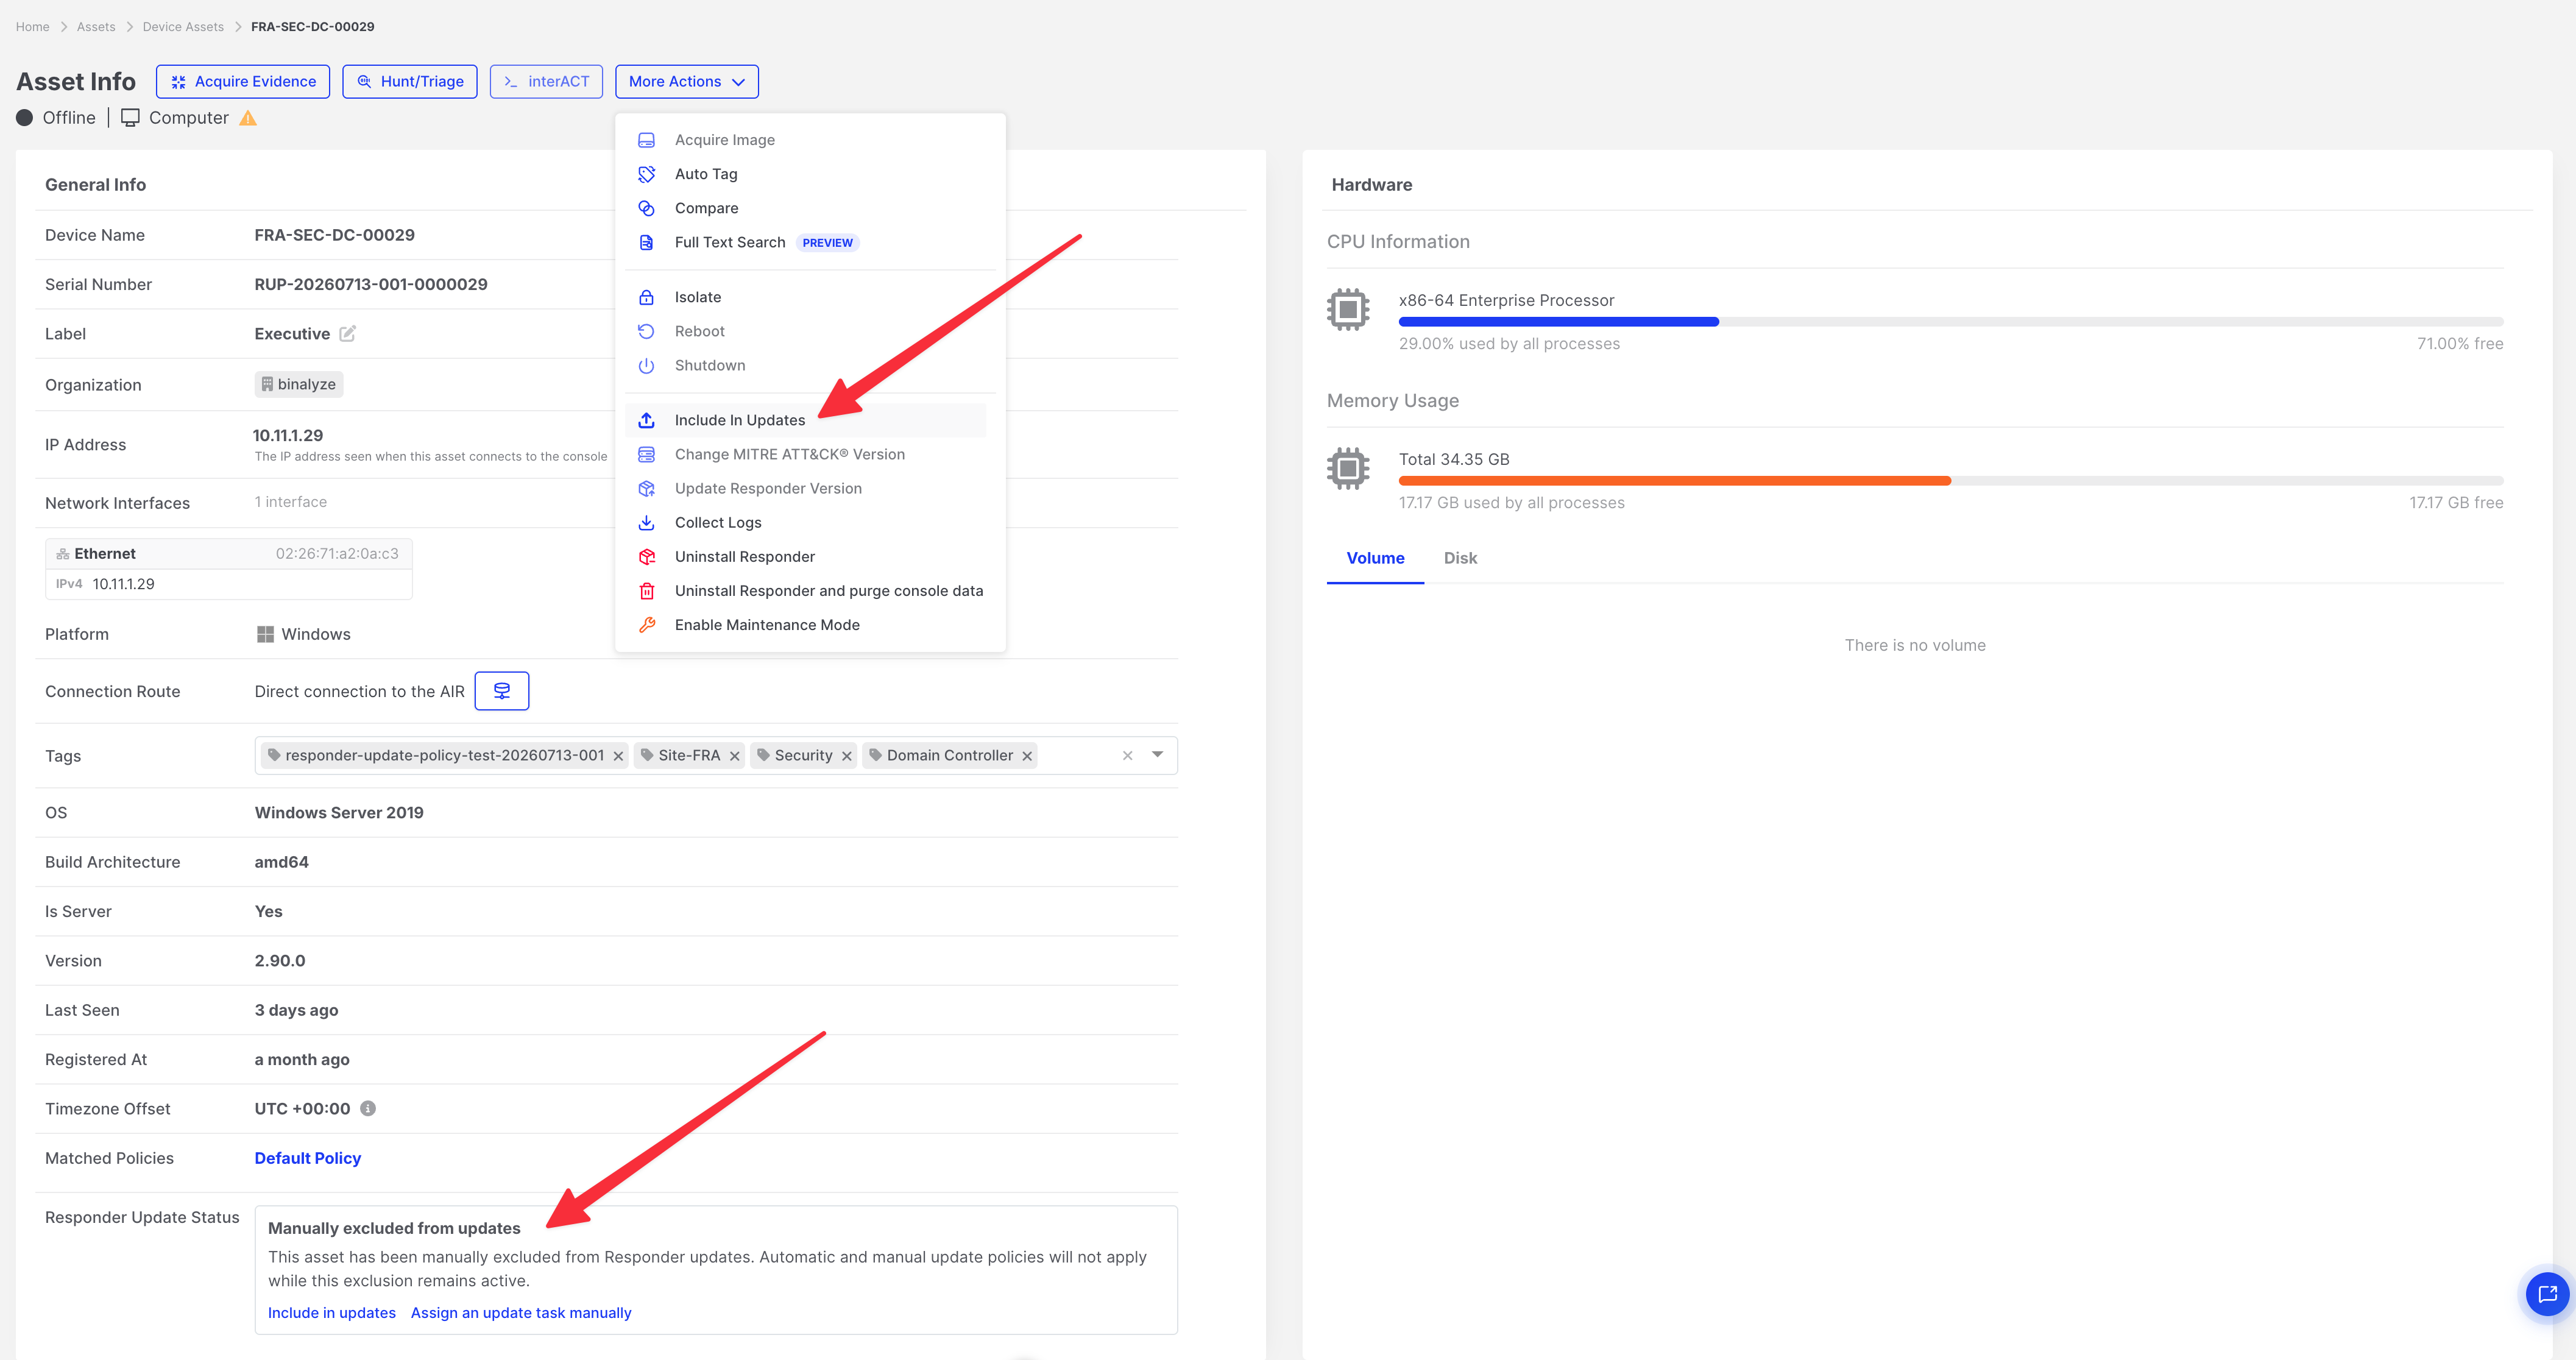 ---
## Policy matching and precedence
Custom policies have **no priority order**. AIR evaluates matching as follows when Automatic Updates are enabled:
```text
1. Is the asset manually excluded?
→ Yes: do not update automatically (and do not deliver update tasks until included)
2. Is global mode Manual Updates?
→ Yes: policies are inactive; update only via assigned tasks
3. Does any enabled exclusion policy match?
→ Yes: do not update automatically
4. Does any enabled update policy match?
→ Yes: update only if at least one matching update policy's schedule window is open
(if all matching update windows are closed, the Default policy is NOT used)
5. No custom policy matches?
→ Use the Default policy schedule
```
Disabled policies are ignored.
### Decision examples
| Situation | Result |
| --- | --- |
| Global Manual Updates | No automatic updates; assign tasks manually |
| Manually excluded, matches an update policy | Remains excluded until included again |
| Matches an exclusion policy and an update policy | **Excluded** (exclusion wins) |
| Matches two update policies; either window is open | Eligible during an open matching window |
| Matches an update policy; all matching windows are closed | **Not** eligible; Default schedule does not apply |
| Matches no custom policy | Follows the Default policy |
| Policy disabled | Treated as if the policy does not exist |
:::note
If several exclusion or update policies match, the status card may show one of the matching policy names. The effective outcome still follows the rules above (any exclusion blocks; any open update window can allow).
:::
---
## Create, edit, enable, disable, and delete policies
### Create a custom policy
1. Under **Custom policies**, click **Add policy**.
2. Enter a unique **Policy name**.
3. Choose **Behaviour**:
- **Update automatically**, or
- **Exclude from automatic updates**
4. Add at least one **filter** condition.
5. For update policies, configure the **schedule** if needed.
6. Click **Apply changes** in the drawer.
7. Click **Save** on the settings page.
:::note[Important]
Drawer changes are applied to your draft only. They take effect after you save the main settings page.
:::
---
## Policy matching and precedence
Custom policies have **no priority order**. AIR evaluates matching as follows when Automatic Updates are enabled:
```text
1. Is the asset manually excluded?
→ Yes: do not update automatically (and do not deliver update tasks until included)
2. Is global mode Manual Updates?
→ Yes: policies are inactive; update only via assigned tasks
3. Does any enabled exclusion policy match?
→ Yes: do not update automatically
4. Does any enabled update policy match?
→ Yes: update only if at least one matching update policy's schedule window is open
(if all matching update windows are closed, the Default policy is NOT used)
5. No custom policy matches?
→ Use the Default policy schedule
```
Disabled policies are ignored.
### Decision examples
| Situation | Result |
| --- | --- |
| Global Manual Updates | No automatic updates; assign tasks manually |
| Manually excluded, matches an update policy | Remains excluded until included again |
| Matches an exclusion policy and an update policy | **Excluded** (exclusion wins) |
| Matches two update policies; either window is open | Eligible during an open matching window |
| Matches an update policy; all matching windows are closed | **Not** eligible; Default schedule does not apply |
| Matches no custom policy | Follows the Default policy |
| Policy disabled | Treated as if the policy does not exist |
:::note
If several exclusion or update policies match, the status card may show one of the matching policy names. The effective outcome still follows the rules above (any exclusion blocks; any open update window can allow).
:::
---
## Create, edit, enable, disable, and delete policies
### Create a custom policy
1. Under **Custom policies**, click **Add policy**.
2. Enter a unique **Policy name**.
3. Choose **Behaviour**:
- **Update automatically**, or
- **Exclude from automatic updates**
4. Add at least one **filter** condition.
5. For update policies, configure the **schedule** if needed.
6. Click **Apply changes** in the drawer.
7. Click **Save** on the settings page.
:::note[Important]
Drawer changes are applied to your draft only. They take effect after you save the main settings page.
:::
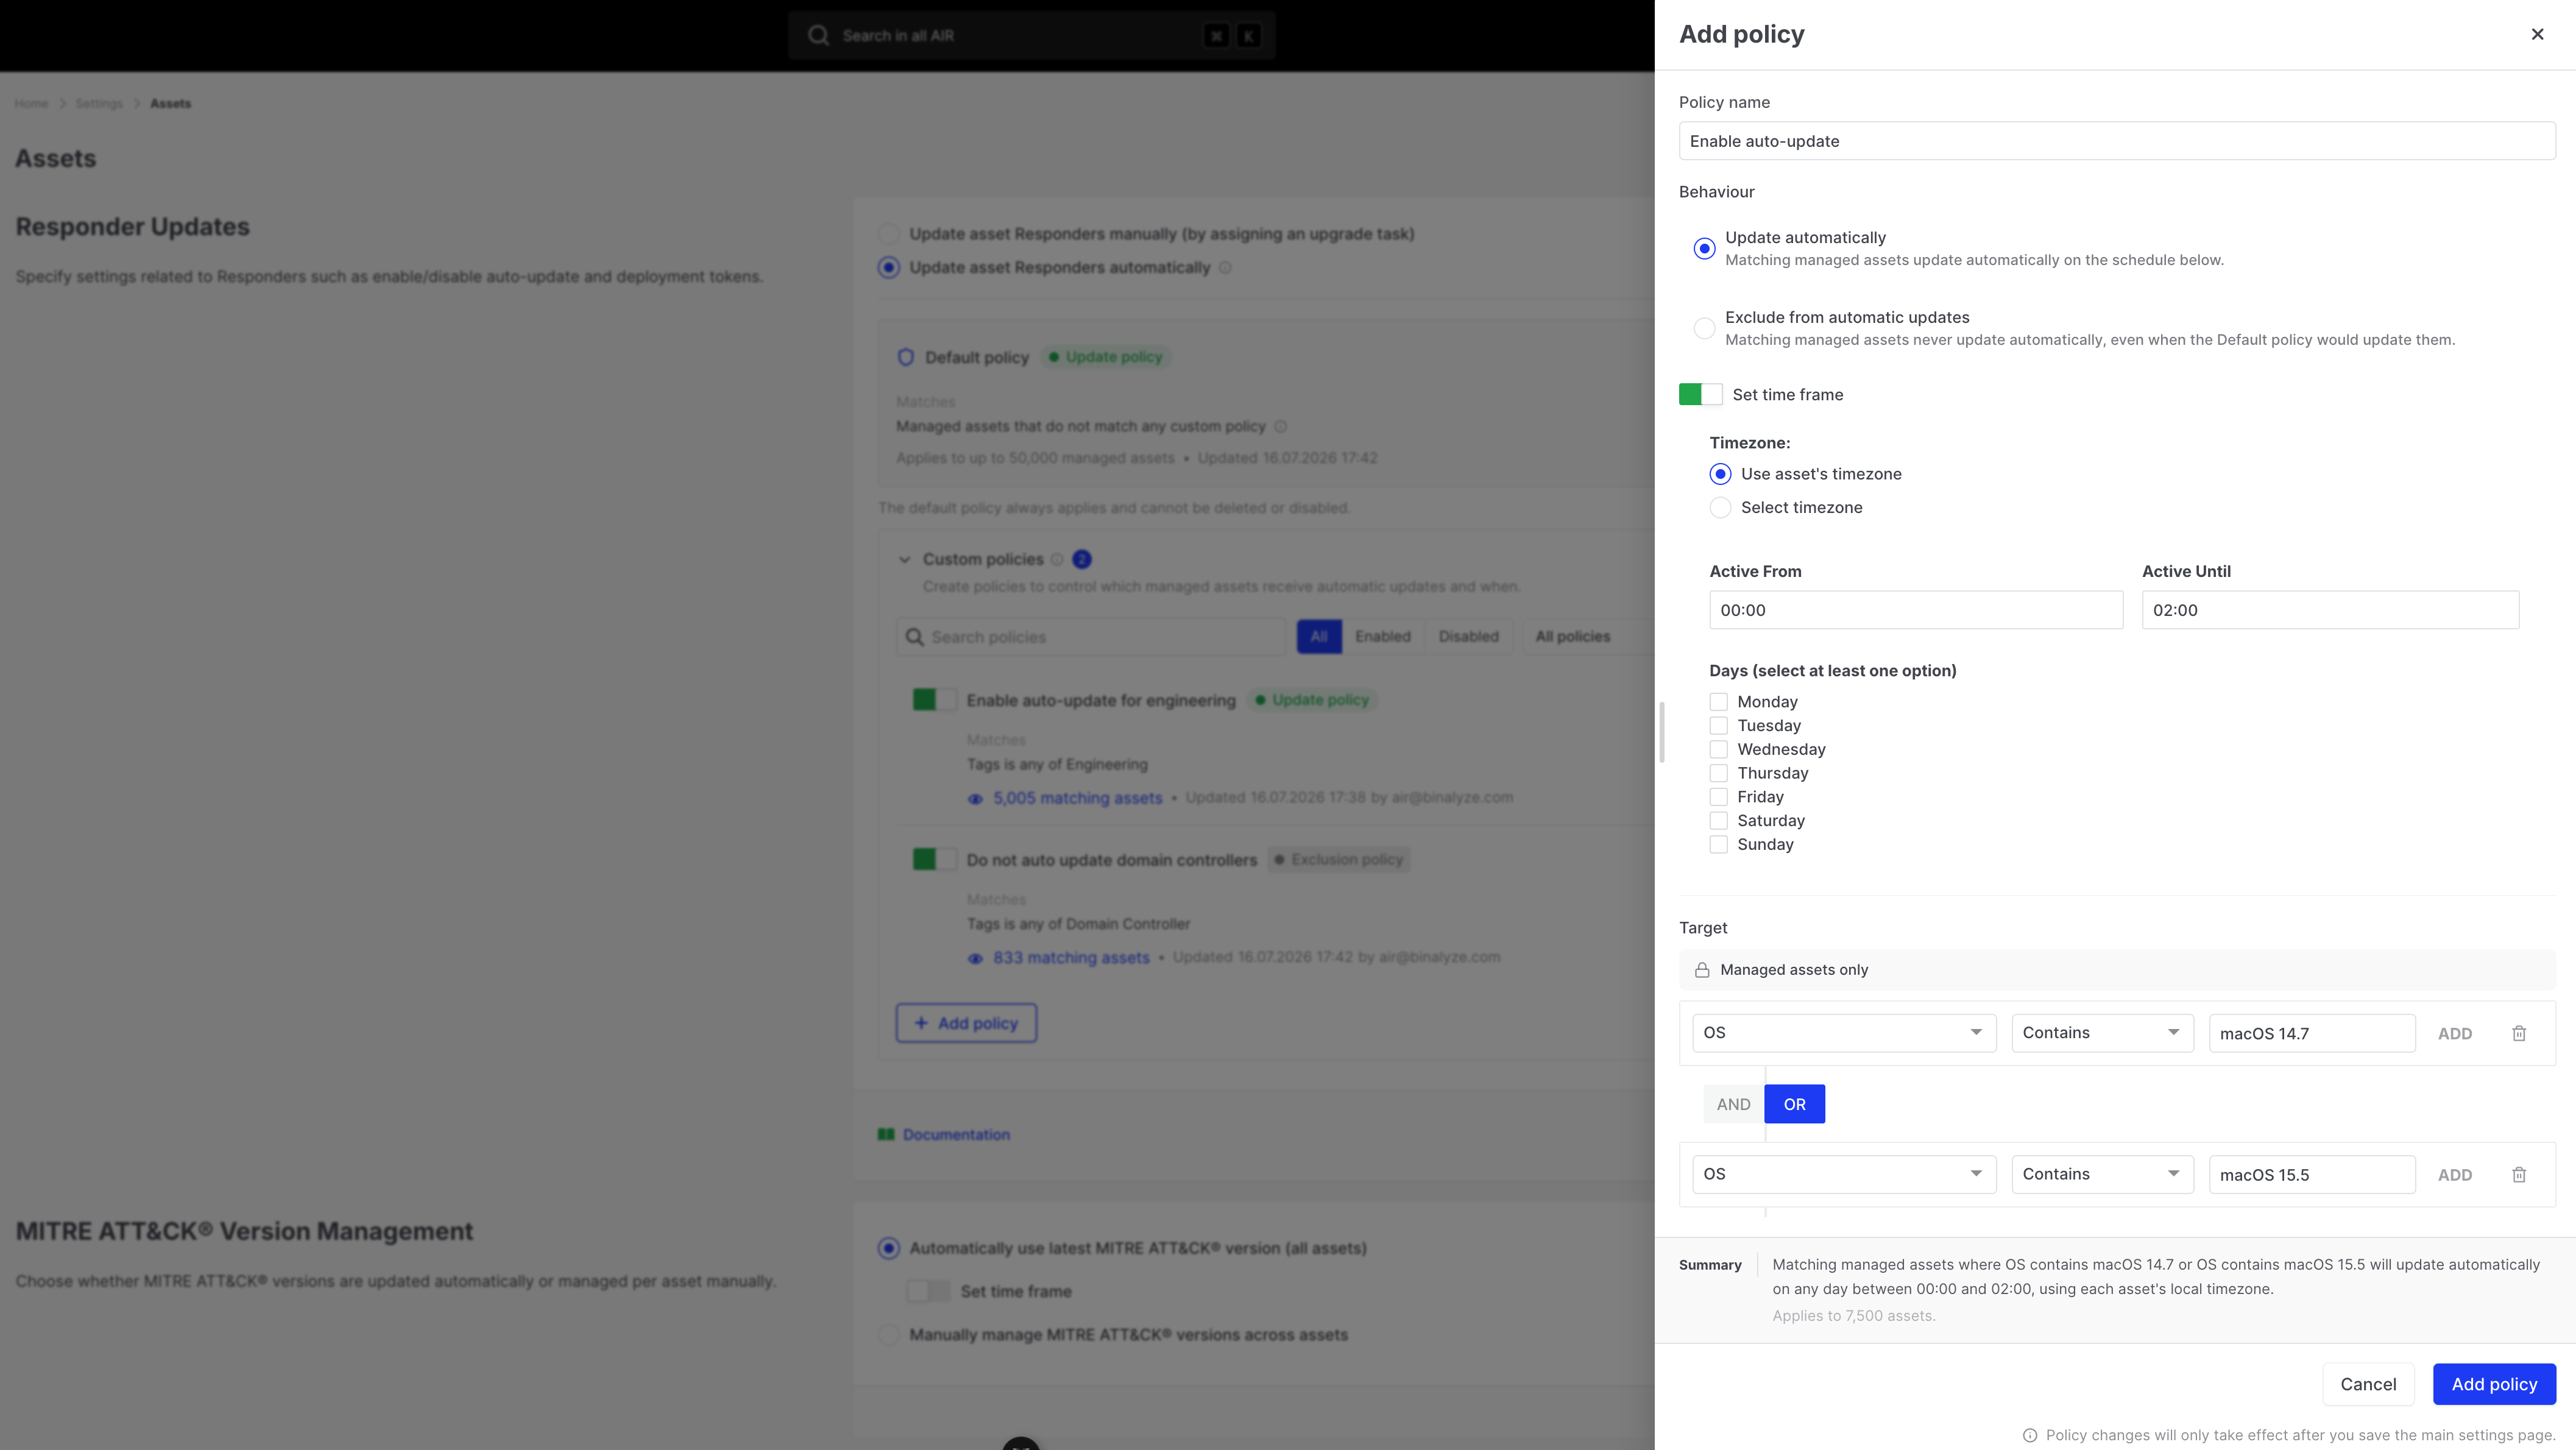 ### Edit a policy
Open the policy from the custom policy list, change fields, apply drawer changes, then **Save**.
### Enable or disable a policy
Use the enable/disable control on the policy card, then **Save**.
- **Active:** Automatic Updates are on and the policy is enabled
- **Inactive:** Manual Updates are on (policy stored but not enforced), or the policy itself is disabled
### Edit a policy
Open the policy from the custom policy list, change fields, apply drawer changes, then **Save**.
### Enable or disable a policy
Use the enable/disable control on the policy card, then **Save**.
- **Active:** Automatic Updates are on and the policy is enabled
- **Inactive:** Manual Updates are on (policy stored but not enforced), or the policy itself is disabled
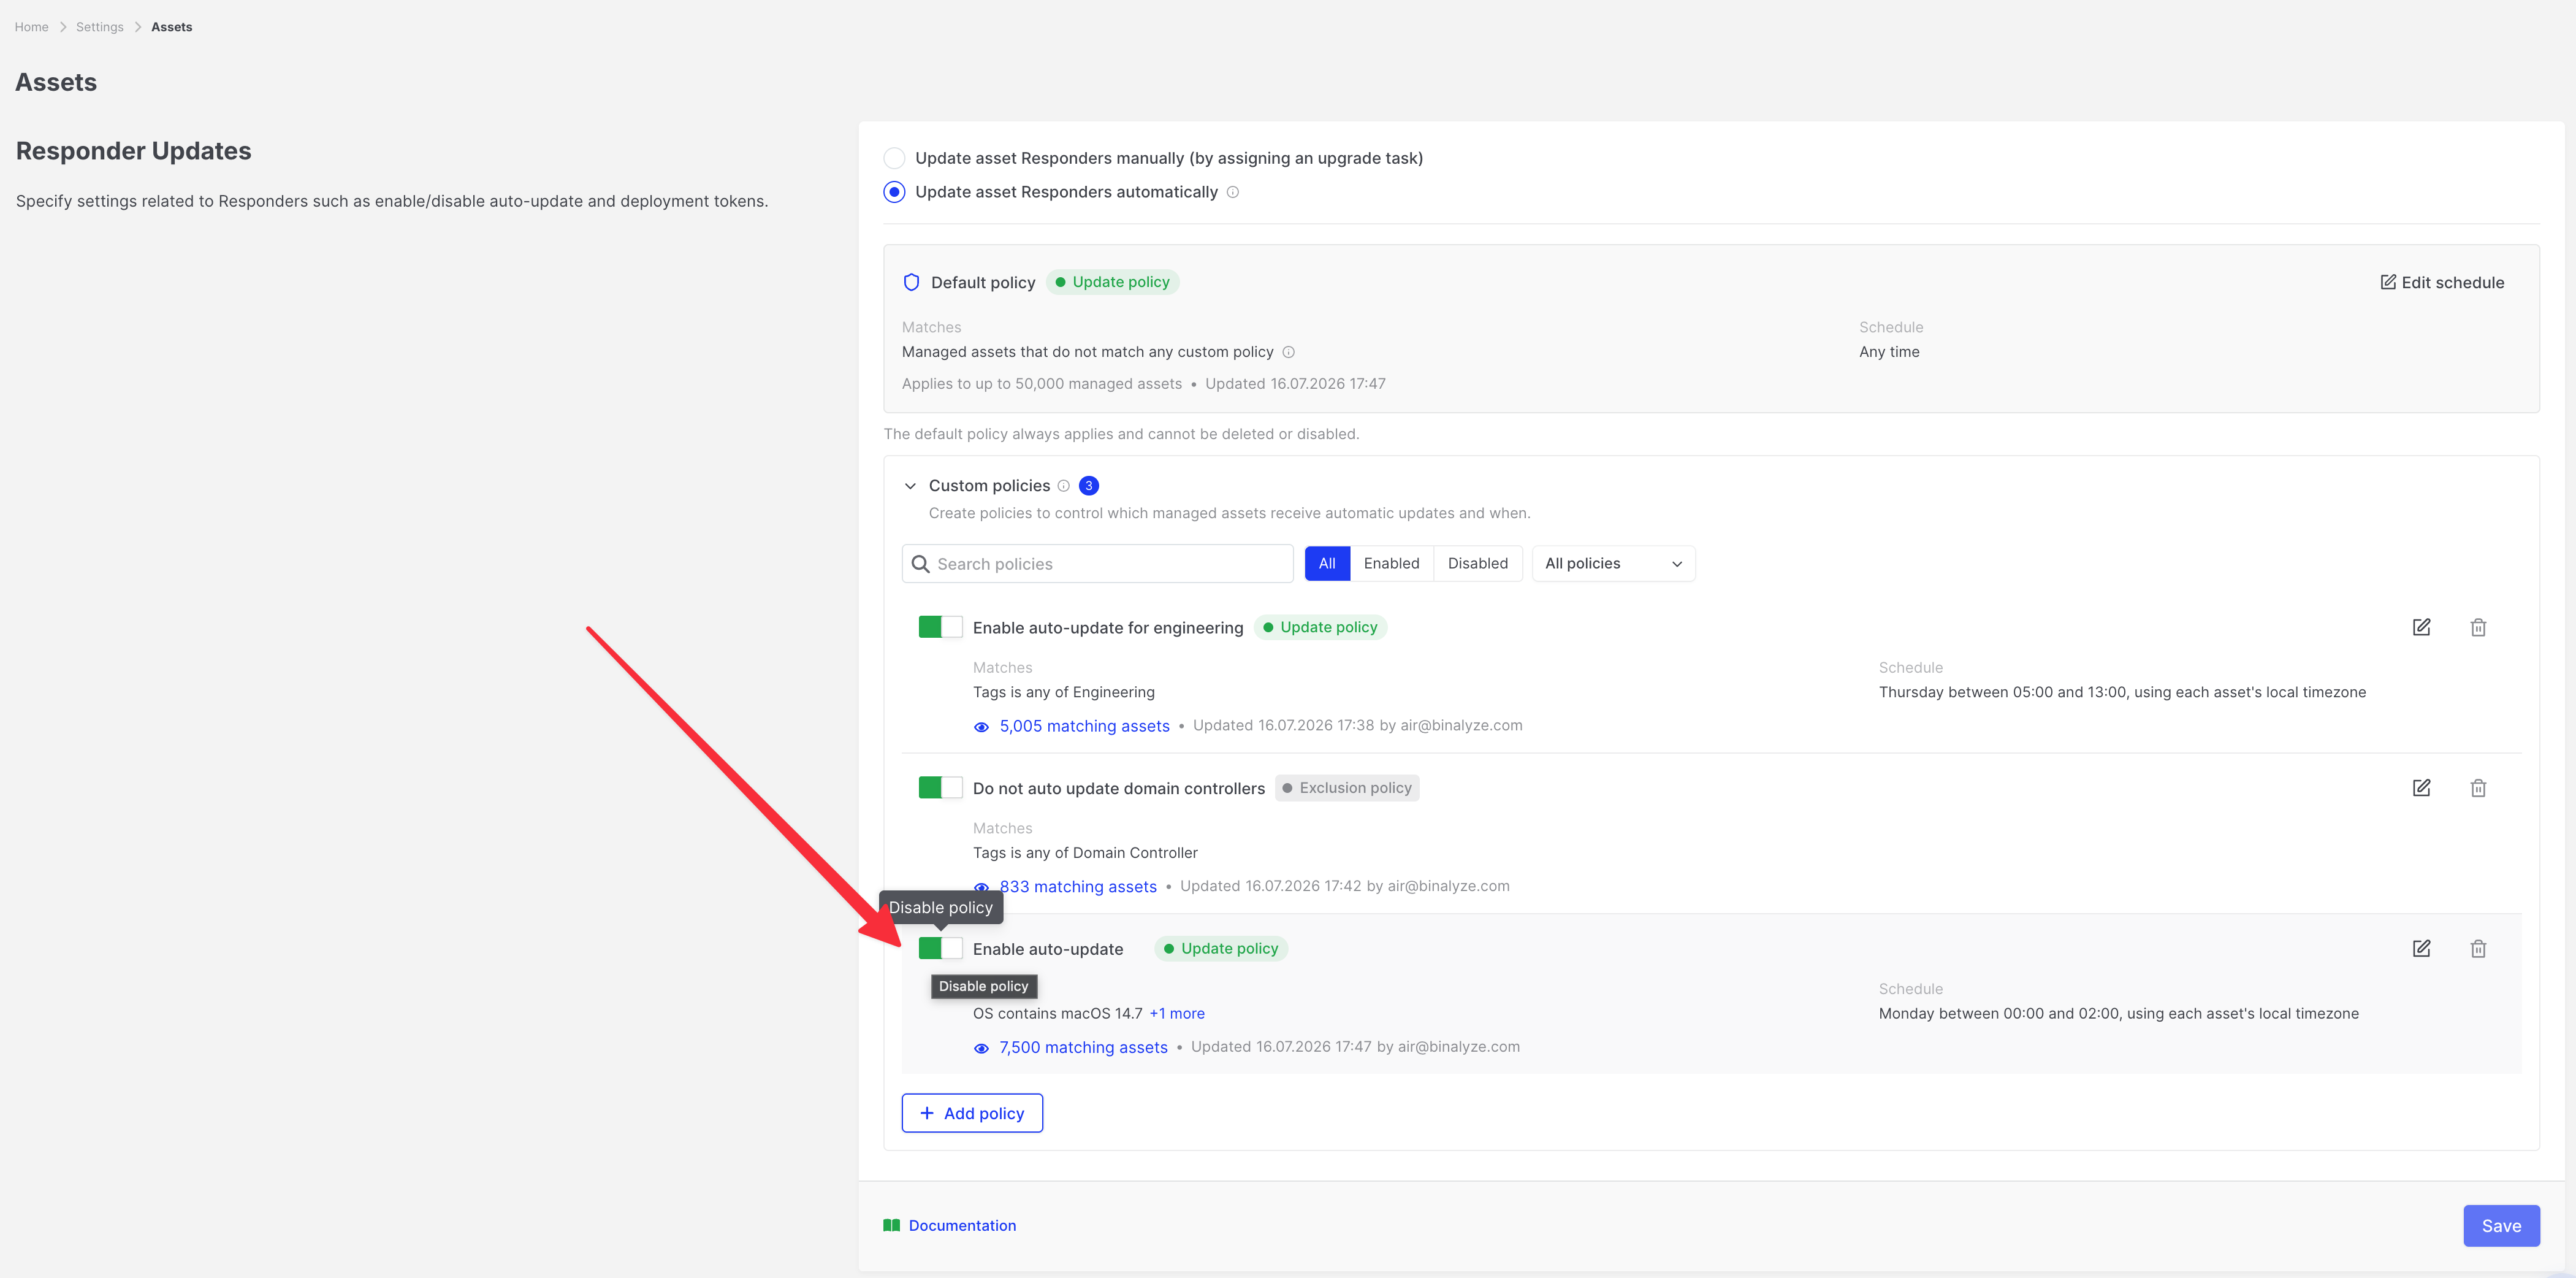 ### Delete a policy
1. Delete the policy and confirm.
2. **Save** the settings page.
Deleting an update policy may cause matching assets to follow another matching policy or the Default policy.
Deleting an exclusion policy may make matching assets eligible for automatic updates again.
---
## Configure asset filters
Filters select which **managed** assets a custom policy applies to. The UI always scopes policies to managed assets.
Supported filter fields include:
| Field | Typical use |
| --- | --- |
| Organization | Limit to one or more organizations |
| IP address | Match management or interface addresses |
| Device name | Hostname patterns |
| Label | Asset label text |
| Group path | Asset group location |
| Operating system | OS string (for example, Windows, Ubuntu) |
| Responder version | Current Responder version on the asset |
| Tags | One or more tags |
| Platform | Windows, Linux, macOS, and other supported platforms |
| Server | Whether the asset is classified as a server |
Combine conditions with the filter builder (AND/OR groups) using operators such as equals, contains, matches, in, and all/not-all for tags.
:::note
Matching asset counts and the Matching Responders view include **managed** assets only.
:::
---
## Preview matching assets
On a policy card:
- Review the **matching asset** count
- Click **View matches** to open **Matching Responders**
- Search by device name and page through results
### Delete a policy
1. Delete the policy and confirm.
2. **Save** the settings page.
Deleting an update policy may cause matching assets to follow another matching policy or the Default policy.
Deleting an exclusion policy may make matching assets eligible for automatic updates again.
---
## Configure asset filters
Filters select which **managed** assets a custom policy applies to. The UI always scopes policies to managed assets.
Supported filter fields include:
| Field | Typical use |
| --- | --- |
| Organization | Limit to one or more organizations |
| IP address | Match management or interface addresses |
| Device name | Hostname patterns |
| Label | Asset label text |
| Group path | Asset group location |
| Operating system | OS string (for example, Windows, Ubuntu) |
| Responder version | Current Responder version on the asset |
| Tags | One or more tags |
| Platform | Windows, Linux, macOS, and other supported platforms |
| Server | Whether the asset is classified as a server |
Combine conditions with the filter builder (AND/OR groups) using operators such as equals, contains, matches, in, and all/not-all for tags.
:::note
Matching asset counts and the Matching Responders view include **managed** assets only.
:::
---
## Preview matching assets
On a policy card:
- Review the **matching asset** count
- Click **View matches** to open **Matching Responders**
- Search by device name and page through results
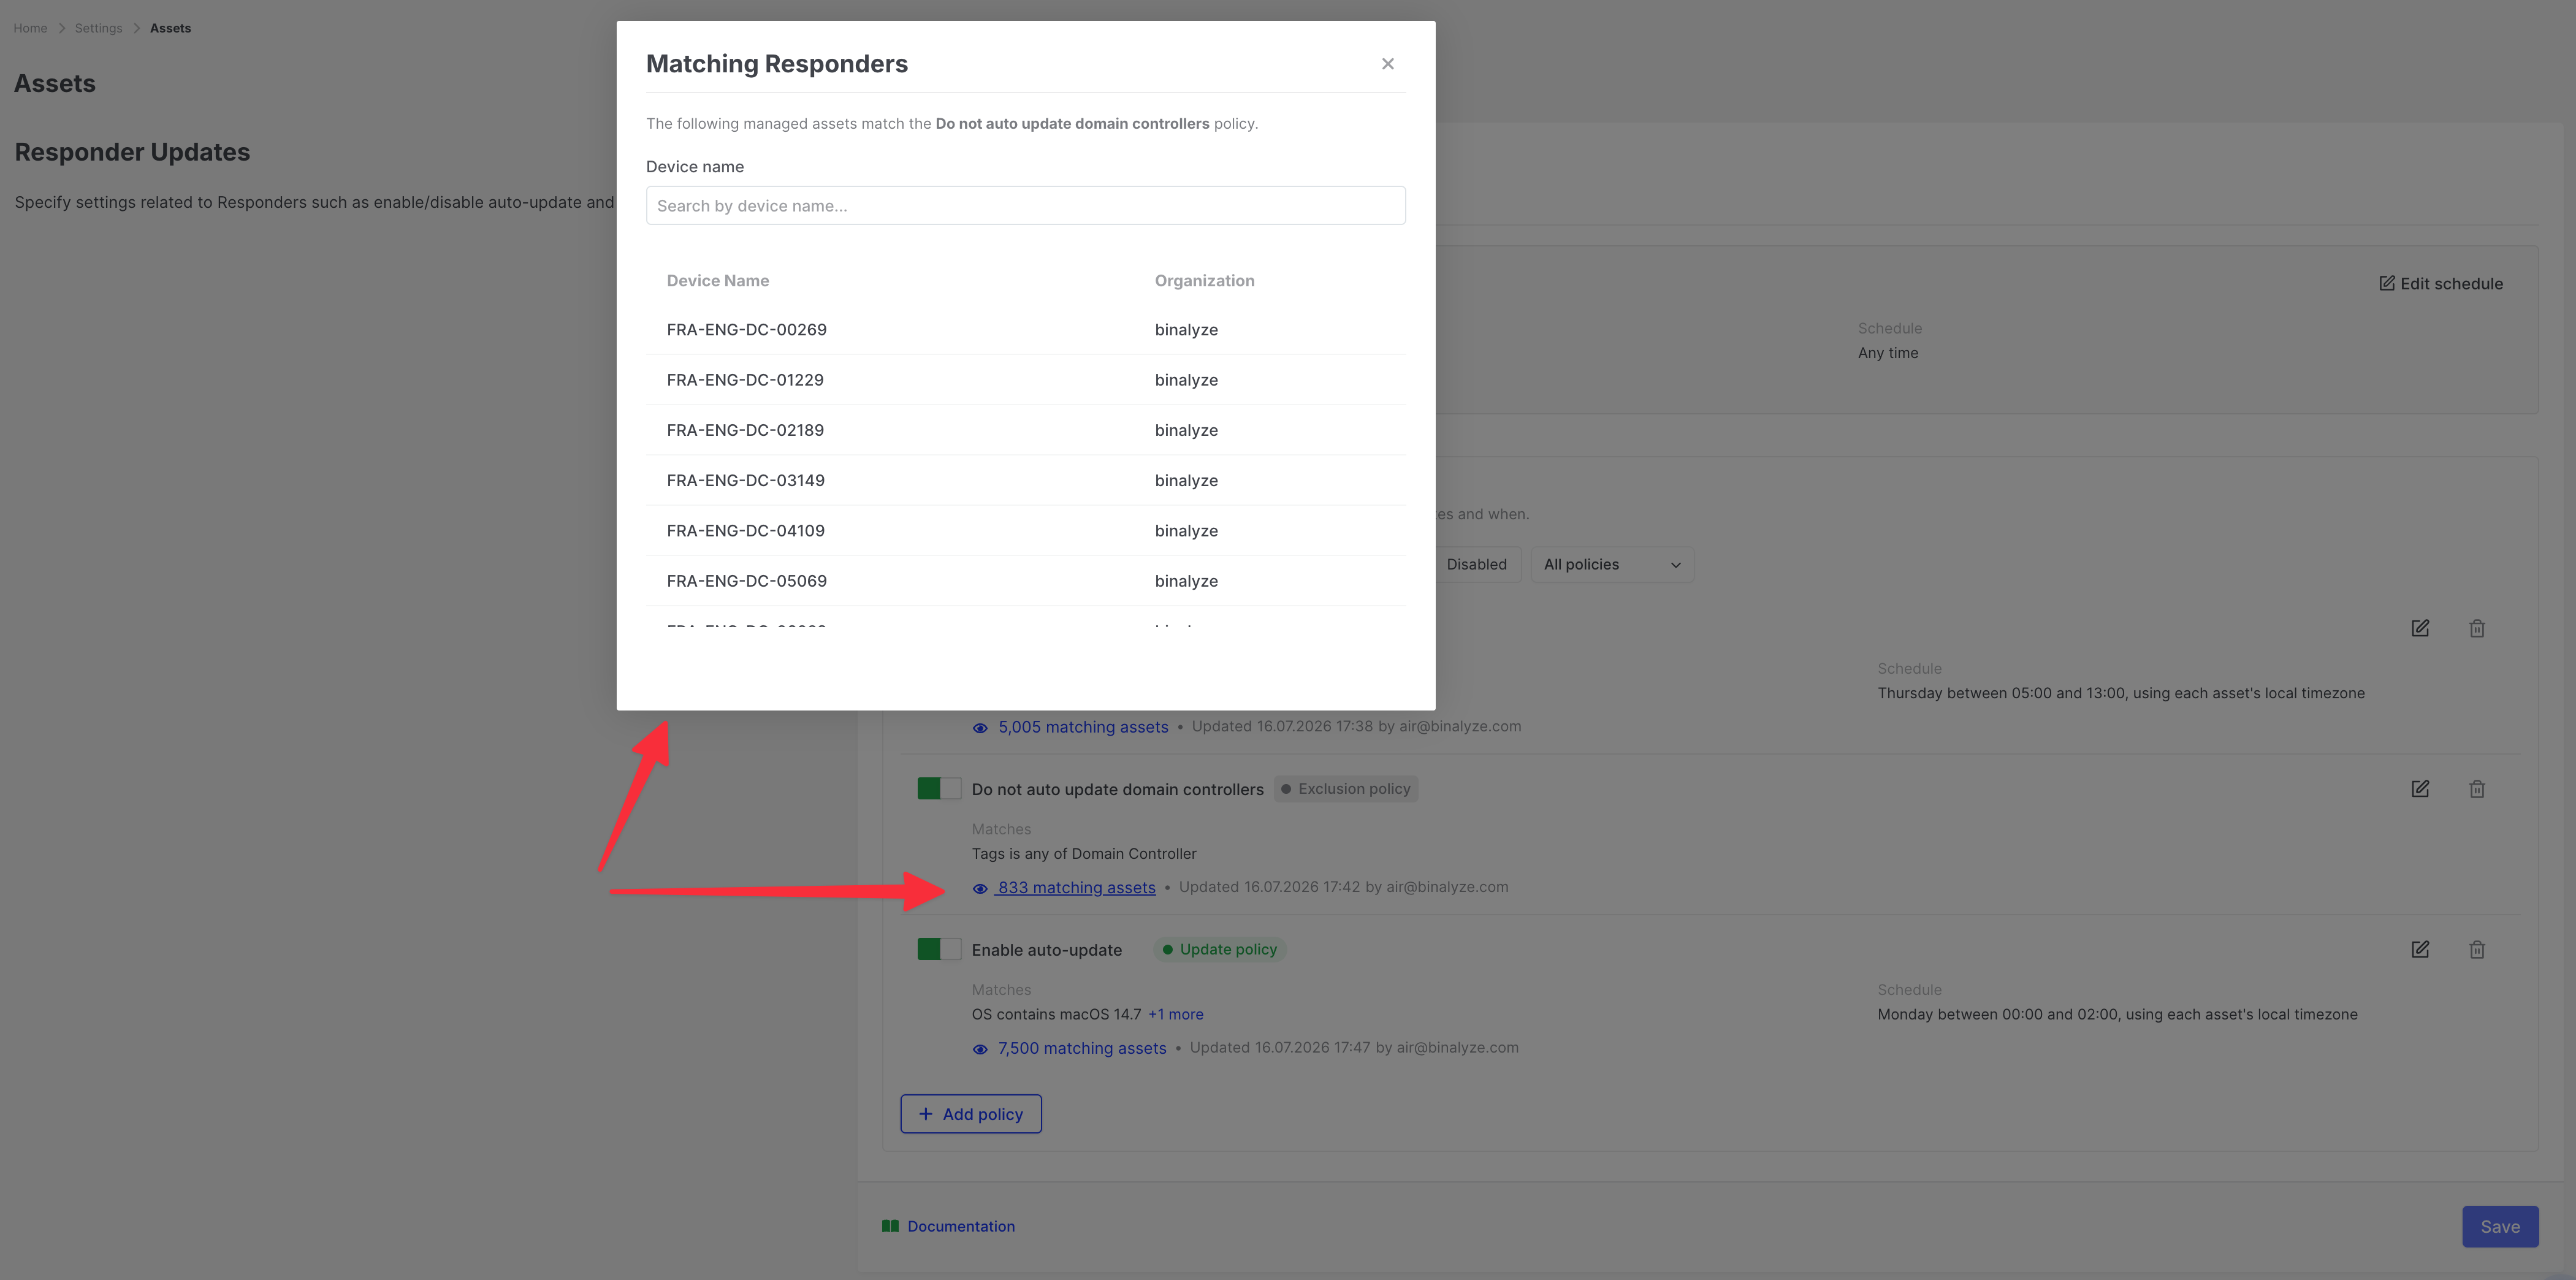 Counts reflect filter matches for managed assets. They do not by themselves prove that an asset is currently inside an update window or free of manual exclusion.
---
## Identify why an asset is or is not updating
The asset detail page answers this in two places.
### Responder Update Status
Open the asset → **General** (or asset overview) and find **Responder Update Status**. It summarises the asset's eligibility under your policies.
| Status | Meaning |
| --- | --- |
| **Manually excluded from updates** | Asset-level exclusion is active |
| **Automatic updates are disabled** | Global Manual Updates mode |
| **Excluded from automatic updates** | An exclusion policy matches |
| **Automatic updates enabled** | Eligible via a matching update policy or the Default policy |
It may also show:
- The matching **policy** name (when applicable)
- The effective **schedule** summary
- Shortcuts to **Include in updates**, **Assign an update task manually**, or **Manage Responder update settings**
Counts reflect filter matches for managed assets. They do not by themselves prove that an asset is currently inside an update window or free of manual exclusion.
---
## Identify why an asset is or is not updating
The asset detail page answers this in two places.
### Responder Update Status
Open the asset → **General** (or asset overview) and find **Responder Update Status**. It summarises the asset's eligibility under your policies.
| Status | Meaning |
| --- | --- |
| **Manually excluded from updates** | Asset-level exclusion is active |
| **Automatic updates are disabled** | Global Manual Updates mode |
| **Excluded from automatic updates** | An exclusion policy matches |
| **Automatic updates enabled** | Eligible via a matching update policy or the Default policy |
It may also show:
- The matching **policy** name (when applicable)
- The effective **schedule** summary
- Shortcuts to **Include in updates**, **Assign an update task manually**, or **Manage Responder update settings**
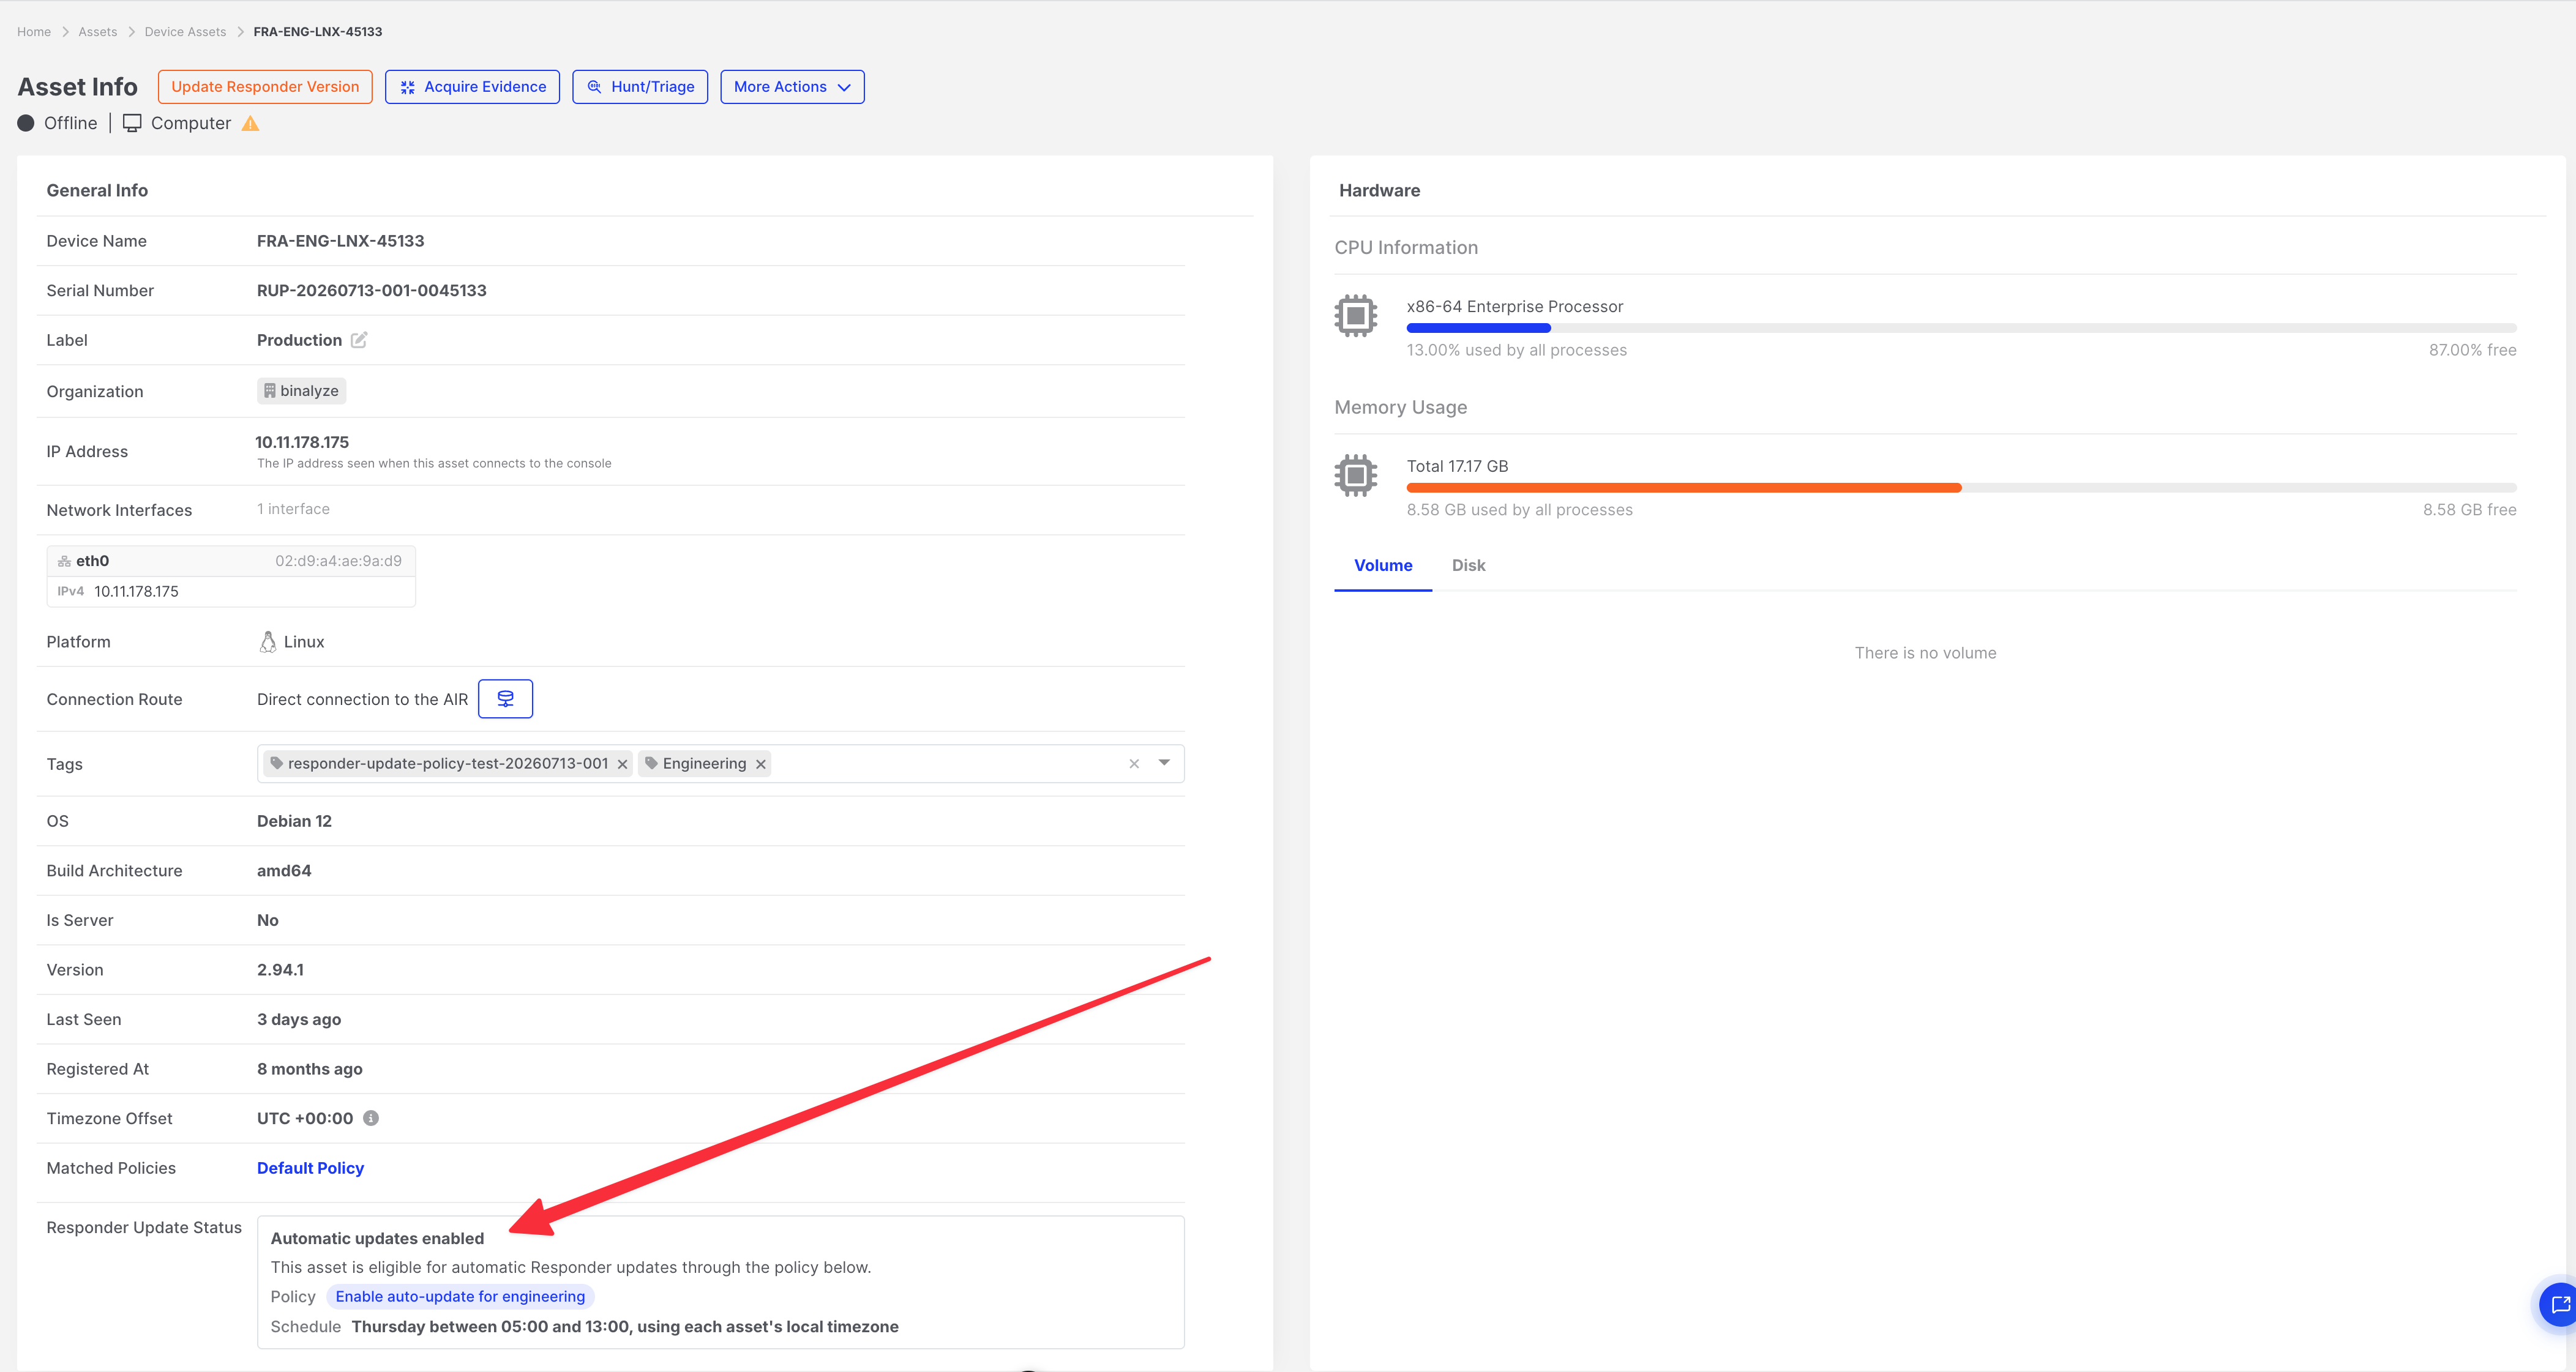 ### Version update card
Higher up the same page, the **Version update** card reports what is happening right now rather than what your configuration allows. It shows the current and target versions, the lifecycle status, and the specific reason an update is waiting, scheduled, or failed — plus **Update now** and **View update history**.
Use **Responder Update Status** to check whether your policies make an asset eligible, and the **Version update** card to find out why an eligible asset has not updated yet.
For the full status reference — the nine statuses, the distinct waiting reasons, retry timing, and the at-a-glance view in the Assets list — see [Responder Update Status](responder-update-status).
---
## Manually update one asset
Use this when you need an immediate or scheduled update outside (or in addition to) automatic policy behaviour.
High-level steps:
1. Open the asset.
2. For an immediate install, expand **Version update** and choose **Update now**.
3. To schedule, or to use the full drawer, start **Update Responder Version** (from asset actions or **Responder Update Status → Assign an update task manually**).
4. Configure the task in the drawer (now or later), then assign it.
For detailed drawer steps and screenshots, see [How do I update Responders on assets?](../../../faqs/how-do-i-update-endpoints).
:::note
Only assets that need a Responder update can be selected for the update task. Assets already on the current Console Responder version are not eligible for selection.
:::
---
## Manually update multiple assets
1. In the asset list, select the assets (or use a filter and bulk selection).
2. From the bulk actions bar, choose **Update Responder Version**.
3. Complete the **Update Responder Version** drawer.
If some selected assets are already current, the drawer limits selection to assets that require an update.
See the FAQ for the full drawer workflow.
---
## Immediate and scheduled update tasks
The **Update Responder Version** drawer supports:
| Option | Behaviour |
| --- | --- |
| **Now** | Assign the update task immediately |
| **Schedule for later** | Choose timezone (asset timezone or a selected timezone) and start time |
Scheduling a new update for an asset **replaces** any previously scheduled Responder update for that asset.
:::tip
When Automatic Updates are enabled, prefer policies for recurring updates across your assets. Use scheduled manual tasks for one-off maintenance windows or exceptions.
:::
Full steps: [How do I update Responders on assets?](../../../faqs/how-do-i-update-endpoints)
---
## Version update statuses vs Assets Summary labels
Two Console surfaces use similar wording for different jobs. Do not treat them as the same label set.
### Version update card and Assets list Version column
These report the live Responder update lifecycle. Common idle or behind-target states include:
| Status | Meaning |
| --- | --- |
| **Update required** | The Responder is older than a release Binalyze has marked as mandatory and must be updated (for example, to accept tasks) |
| **Update available** | A newer Responder version can be installed; automatic updating is not applying it for this asset (for example, global Manual Updates) |
| **Up to date** | The asset runs the target version; automatic update is not issued and manual update selection is unavailable |
The full set of nine statuses, waiting reasons, and retry rules is in [Responder Update Status](responder-update-status).
### Assets Summary (Home)
The Assets Summary widget still uses endpoint **issue** labels for fleet counts and filters:
| Label | Meaning |
| --- | --- |
| **Update Required** | Same urgency class as the Version update **Update required** status — the Responder must be updated for compatibility |
| **Update Advised** | The Responder is on an older version and an update is recommended (`OldVersion` issue). This Home label is not the Version update card's **Update available** status |
Automatic updates run when the asset checks in, is eligible under precedence and schedule rules, and is behind the Console Responder version. AIR also limits how many Responder updates run at the same time across the environment; see [Concurrent update limit](responder-update-status#concurrent-update-limit).
---
## Recommended practices
1. Start in **Manual Updates** while you design filters and schedules, then switch to Automatic after reviewing Matching Responders.
2. Keep the **Default policy** conservative (for example, a maintenance window) if most assets should wait for off-hours updates.
3. Use **update policies** for clear cohorts (platform, organization, tags).
4. Use **exclusion policies** for groups that must never auto-update.
5. Use **manual exclusion** for individual critical servers.
6. After changing policies, open a representative asset's **Responder Update Status** and **Version update** card to verify eligibility and live state.
7. Remember that enabling Automatic Updates clears outstanding scheduled/assigned manual update tasks.
---
## Examples
### Automatically update Windows assets during a maintenance window
1. Enable **Automatic Updates** and save.
2. Add an **update policy** named for example `Windows maintenance`.
3. Filter: Platform is Windows (add other conditions as needed).
4. Schedule: your maintenance days and hours; choose asset timezone or a fixed timezone.
5. Apply and **Save**.
6. Use **View matches** to confirm the cohort.
Assets that match this policy follow its window. They do **not** fall back to the Default policy if that window is closed.
### Exclude Linux servers from automatic updates
1. Add an **exclusion policy**.
2. Filter: Platform is Linux (optionally Server is true).
3. Apply and **Save**.
Matching Linux servers skip automatic updates. You can still assign **Update Responder Version** tasks to them when needed.
### Different policies by tag or organization
1. Create an update policy filtered by Tag (for example `tier-1`) with an earlier window.
2. Create another update policy filtered by Organization or Tag `tier-2` with a later window.
3. Leave remaining assets on the Default policy.
If an asset matches both an exclusion policy and an update policy, it is excluded.
### Manually exclude a critical server that matches an update policy
1. Open the critical asset.
2. Exclude it from updates and confirm.
3. Confirm **Responder Update Status** shows **Manually excluded from updates**.
The asset stays excluded even if it still matches an update policy. Include it again when you are ready to update.
### Determine why an asset is not receiving automatic updates
Start on the asset detail page, then fall back to policy checks:
1. Open the **Version update** card — the status badge and explanation name the current blocker (window, maintenance, running tasks, capacity, failure, and so on). See [Responder Update Status](responder-update-status).
2. Open **View update history** (or the **Version Updates** tab) if the card shows **Failed** or repeated retries. See [Responder Update History](responder-update-history).
3. Check **Responder Update Status** for eligibility: **manually excluded**, global **Manual Updates**, or an **exclusion policy**.
4. If an **update policy** matches with a **closed** window, the Default schedule does not apply for that asset.
5. Confirm the asset is not already **Up to date**, and that it is managed and checking in.
---
## Troubleshooting
| Problem | What to check |
| --- | --- |
| No assets update automatically | Confirm Automatic Updates is selected and saved; confirm assets are managed and online/checking in |
| Asset matches my update policy but never updates | Open the **Version update** card first; then check manual exclusion, exclusion policies, and whether the policy schedule window is open — closed grant windows do not use Default |
| Asset still follows Default after I created a policy | Confirm the policy is enabled, saved, and that the asset appears under Matching Responders |
| I assigned an update but nothing happens | If the asset is manually excluded, include it first; confirm the asset needs an update; confirm the task was not cleared by enabling Automatic Updates; check history for a failed or cancelled attempt |
| Enabling Automatic cleared my scheduled updates | Expected behaviour — scheduled/assigned Version Update tasks are removed when Automatic Updates is enabled |
| Unexpected policy name on the status card | Multiple policies may match; verify all matching update and exclusion policies, not only the displayed name |
| Changes in the policy drawer did not apply | Click **Save** on the main settings page after applying drawer changes |
---
## Permissions
| Action | Typical privilege requirement |
| --- | --- |
| Change Responder Updates settings and policies | Settings save permission |
| Exclude or include assets; assign Update Responder Version | Assign version update task permission |
| View asset Responder Update Status | Endpoint / asset view permission |
Exact role names depend on your configured roles.
---
## Related articles
- [Responder Update Status](responder-update-status) — status reference, the Version update card, retry timing, and the Assets list view
- [Responder Update History](responder-update-history) — past attempts and failure diagnosis
- [How do I update Responders on assets?](../../../faqs/how-do-i-update-endpoints) — assign immediate or scheduled update tasks
- [Assets (Console Settings)](../assets) — Asset Settings overview, including Tamper Detection and related controls
- [Post-Deployment Configuration Guide](../../../self-hosted/setup/post-deployment-configuration-guide/) — self-hosted setup checklist
---
# Responder Update Status
> Source: https://kb.binalyze.ai/air/settings/console-settings/assets/responder-update-status.html
[Responder Updates](responder-updates) explains how you configure automatic updating. This page explains how to read the result: what AIR decided for a given asset, and why.
Two surfaces answer that question. The **Version update** card on the asset detail page gives the full explanation for one asset, and the **Version** column in the Assets list gives an at-a-glance view across all your assets.
:::note
The asset page also has a **Responder Update Status** field that summarises whether your policies make the asset eligible for automatic updating. That is a question about configuration; this page is about what is happening right now. See [Responder Updates](responder-updates#responder-update-status).
:::
:::note
Detailed update status is available from AIR v5.24 onwards. Earlier versions report eligibility only, without lifecycle statuses, wait reasons, attempt counts, or update history.
:::
## The Version update card
Open an asset and expand **Version update**. The card shows the fields relevant to the current state:
| Field | What it tells you |
|-------|-------------------|
| **Current version** | The Responder version installed on the asset |
| **Target version** | The version AIR wants the asset to reach |
| **Automatic updates** | Whether automatic updating is enabled globally, plus a shortcut to the settings page |
| **Update policy** | The policy governing this asset. If more than one policy matches, a `+n` badge lists the others. |
| **Running-task policy** | Whether an update waits for running tasks or stops them |
| **Next attempt** | When the next automatic attempt becomes possible |
| **Attempts** | The attempt count against the automatic attempt limit, for example *Attempt 3 of 5* |
Beneath the fields, a short explanation names the current blocker, and the **Update now** and **View update history** actions let you act on it.
Selecting the policy name opens a preview of that policy, so you can check its schedule and reach without leaving the asset.
### Version update card
Higher up the same page, the **Version update** card reports what is happening right now rather than what your configuration allows. It shows the current and target versions, the lifecycle status, and the specific reason an update is waiting, scheduled, or failed — plus **Update now** and **View update history**.
Use **Responder Update Status** to check whether your policies make an asset eligible, and the **Version update** card to find out why an eligible asset has not updated yet.
For the full status reference — the nine statuses, the distinct waiting reasons, retry timing, and the at-a-glance view in the Assets list — see [Responder Update Status](responder-update-status).
---
## Manually update one asset
Use this when you need an immediate or scheduled update outside (or in addition to) automatic policy behaviour.
High-level steps:
1. Open the asset.
2. For an immediate install, expand **Version update** and choose **Update now**.
3. To schedule, or to use the full drawer, start **Update Responder Version** (from asset actions or **Responder Update Status → Assign an update task manually**).
4. Configure the task in the drawer (now or later), then assign it.
For detailed drawer steps and screenshots, see [How do I update Responders on assets?](../../../faqs/how-do-i-update-endpoints).
:::note
Only assets that need a Responder update can be selected for the update task. Assets already on the current Console Responder version are not eligible for selection.
:::
---
## Manually update multiple assets
1. In the asset list, select the assets (or use a filter and bulk selection).
2. From the bulk actions bar, choose **Update Responder Version**.
3. Complete the **Update Responder Version** drawer.
If some selected assets are already current, the drawer limits selection to assets that require an update.
See the FAQ for the full drawer workflow.
---
## Immediate and scheduled update tasks
The **Update Responder Version** drawer supports:
| Option | Behaviour |
| --- | --- |
| **Now** | Assign the update task immediately |
| **Schedule for later** | Choose timezone (asset timezone or a selected timezone) and start time |
Scheduling a new update for an asset **replaces** any previously scheduled Responder update for that asset.
:::tip
When Automatic Updates are enabled, prefer policies for recurring updates across your assets. Use scheduled manual tasks for one-off maintenance windows or exceptions.
:::
Full steps: [How do I update Responders on assets?](../../../faqs/how-do-i-update-endpoints)
---
## Version update statuses vs Assets Summary labels
Two Console surfaces use similar wording for different jobs. Do not treat them as the same label set.
### Version update card and Assets list Version column
These report the live Responder update lifecycle. Common idle or behind-target states include:
| Status | Meaning |
| --- | --- |
| **Update required** | The Responder is older than a release Binalyze has marked as mandatory and must be updated (for example, to accept tasks) |
| **Update available** | A newer Responder version can be installed; automatic updating is not applying it for this asset (for example, global Manual Updates) |
| **Up to date** | The asset runs the target version; automatic update is not issued and manual update selection is unavailable |
The full set of nine statuses, waiting reasons, and retry rules is in [Responder Update Status](responder-update-status).
### Assets Summary (Home)
The Assets Summary widget still uses endpoint **issue** labels for fleet counts and filters:
| Label | Meaning |
| --- | --- |
| **Update Required** | Same urgency class as the Version update **Update required** status — the Responder must be updated for compatibility |
| **Update Advised** | The Responder is on an older version and an update is recommended (`OldVersion` issue). This Home label is not the Version update card's **Update available** status |
Automatic updates run when the asset checks in, is eligible under precedence and schedule rules, and is behind the Console Responder version. AIR also limits how many Responder updates run at the same time across the environment; see [Concurrent update limit](responder-update-status#concurrent-update-limit).
---
## Recommended practices
1. Start in **Manual Updates** while you design filters and schedules, then switch to Automatic after reviewing Matching Responders.
2. Keep the **Default policy** conservative (for example, a maintenance window) if most assets should wait for off-hours updates.
3. Use **update policies** for clear cohorts (platform, organization, tags).
4. Use **exclusion policies** for groups that must never auto-update.
5. Use **manual exclusion** for individual critical servers.
6. After changing policies, open a representative asset's **Responder Update Status** and **Version update** card to verify eligibility and live state.
7. Remember that enabling Automatic Updates clears outstanding scheduled/assigned manual update tasks.
---
## Examples
### Automatically update Windows assets during a maintenance window
1. Enable **Automatic Updates** and save.
2. Add an **update policy** named for example `Windows maintenance`.
3. Filter: Platform is Windows (add other conditions as needed).
4. Schedule: your maintenance days and hours; choose asset timezone or a fixed timezone.
5. Apply and **Save**.
6. Use **View matches** to confirm the cohort.
Assets that match this policy follow its window. They do **not** fall back to the Default policy if that window is closed.
### Exclude Linux servers from automatic updates
1. Add an **exclusion policy**.
2. Filter: Platform is Linux (optionally Server is true).
3. Apply and **Save**.
Matching Linux servers skip automatic updates. You can still assign **Update Responder Version** tasks to them when needed.
### Different policies by tag or organization
1. Create an update policy filtered by Tag (for example `tier-1`) with an earlier window.
2. Create another update policy filtered by Organization or Tag `tier-2` with a later window.
3. Leave remaining assets on the Default policy.
If an asset matches both an exclusion policy and an update policy, it is excluded.
### Manually exclude a critical server that matches an update policy
1. Open the critical asset.
2. Exclude it from updates and confirm.
3. Confirm **Responder Update Status** shows **Manually excluded from updates**.
The asset stays excluded even if it still matches an update policy. Include it again when you are ready to update.
### Determine why an asset is not receiving automatic updates
Start on the asset detail page, then fall back to policy checks:
1. Open the **Version update** card — the status badge and explanation name the current blocker (window, maintenance, running tasks, capacity, failure, and so on). See [Responder Update Status](responder-update-status).
2. Open **View update history** (or the **Version Updates** tab) if the card shows **Failed** or repeated retries. See [Responder Update History](responder-update-history).
3. Check **Responder Update Status** for eligibility: **manually excluded**, global **Manual Updates**, or an **exclusion policy**.
4. If an **update policy** matches with a **closed** window, the Default schedule does not apply for that asset.
5. Confirm the asset is not already **Up to date**, and that it is managed and checking in.
---
## Troubleshooting
| Problem | What to check |
| --- | --- |
| No assets update automatically | Confirm Automatic Updates is selected and saved; confirm assets are managed and online/checking in |
| Asset matches my update policy but never updates | Open the **Version update** card first; then check manual exclusion, exclusion policies, and whether the policy schedule window is open — closed grant windows do not use Default |
| Asset still follows Default after I created a policy | Confirm the policy is enabled, saved, and that the asset appears under Matching Responders |
| I assigned an update but nothing happens | If the asset is manually excluded, include it first; confirm the asset needs an update; confirm the task was not cleared by enabling Automatic Updates; check history for a failed or cancelled attempt |
| Enabling Automatic cleared my scheduled updates | Expected behaviour — scheduled/assigned Version Update tasks are removed when Automatic Updates is enabled |
| Unexpected policy name on the status card | Multiple policies may match; verify all matching update and exclusion policies, not only the displayed name |
| Changes in the policy drawer did not apply | Click **Save** on the main settings page after applying drawer changes |
---
## Permissions
| Action | Typical privilege requirement |
| --- | --- |
| Change Responder Updates settings and policies | Settings save permission |
| Exclude or include assets; assign Update Responder Version | Assign version update task permission |
| View asset Responder Update Status | Endpoint / asset view permission |
Exact role names depend on your configured roles.
---
## Related articles
- [Responder Update Status](responder-update-status) — status reference, the Version update card, retry timing, and the Assets list view
- [Responder Update History](responder-update-history) — past attempts and failure diagnosis
- [How do I update Responders on assets?](../../../faqs/how-do-i-update-endpoints) — assign immediate or scheduled update tasks
- [Assets (Console Settings)](../assets) — Asset Settings overview, including Tamper Detection and related controls
- [Post-Deployment Configuration Guide](../../../self-hosted/setup/post-deployment-configuration-guide/) — self-hosted setup checklist
---
# Responder Update Status
> Source: https://kb.binalyze.ai/air/settings/console-settings/assets/responder-update-status.html
[Responder Updates](responder-updates) explains how you configure automatic updating. This page explains how to read the result: what AIR decided for a given asset, and why.
Two surfaces answer that question. The **Version update** card on the asset detail page gives the full explanation for one asset, and the **Version** column in the Assets list gives an at-a-glance view across all your assets.
:::note
The asset page also has a **Responder Update Status** field that summarises whether your policies make the asset eligible for automatic updating. That is a question about configuration; this page is about what is happening right now. See [Responder Updates](responder-updates#responder-update-status).
:::
:::note
Detailed update status is available from AIR v5.24 onwards. Earlier versions report eligibility only, without lifecycle statuses, wait reasons, attempt counts, or update history.
:::
## The Version update card
Open an asset and expand **Version update**. The card shows the fields relevant to the current state:
| Field | What it tells you |
|-------|-------------------|
| **Current version** | The Responder version installed on the asset |
| **Target version** | The version AIR wants the asset to reach |
| **Automatic updates** | Whether automatic updating is enabled globally, plus a shortcut to the settings page |
| **Update policy** | The policy governing this asset. If more than one policy matches, a `+n` badge lists the others. |
| **Running-task policy** | Whether an update waits for running tasks or stops them |
| **Next attempt** | When the next automatic attempt becomes possible |
| **Attempts** | The attempt count against the automatic attempt limit, for example *Attempt 3 of 5* |
Beneath the fields, a short explanation names the current blocker, and the **Update now** and **View update history** actions let you act on it.
Selecting the policy name opens a preview of that policy, so you can check its schedule and reach without leaving the asset.
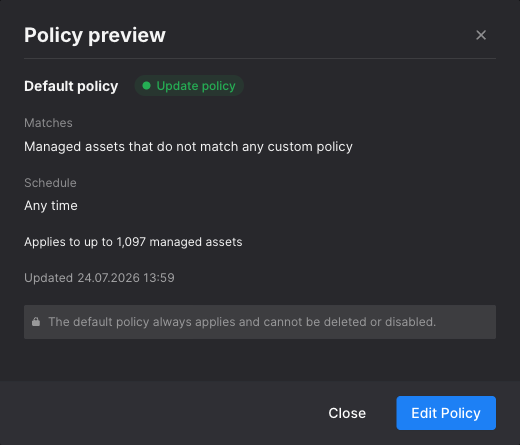
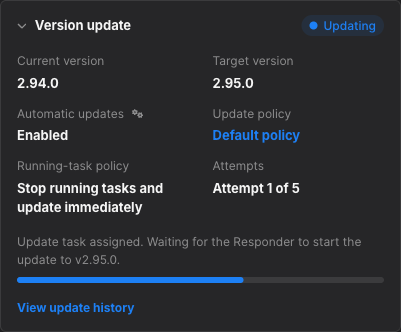

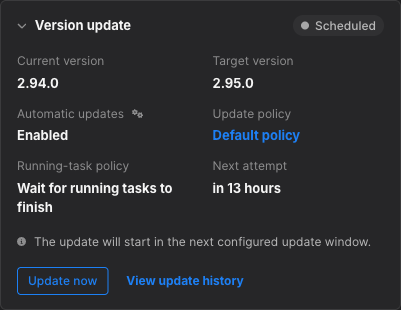
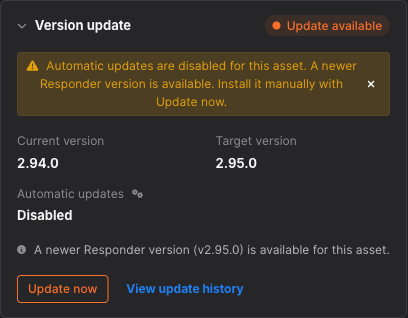
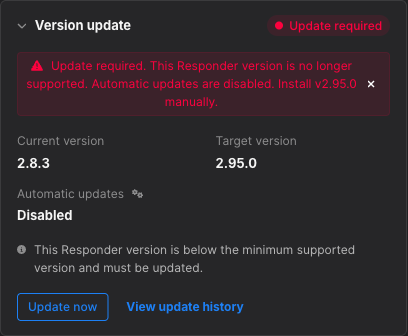
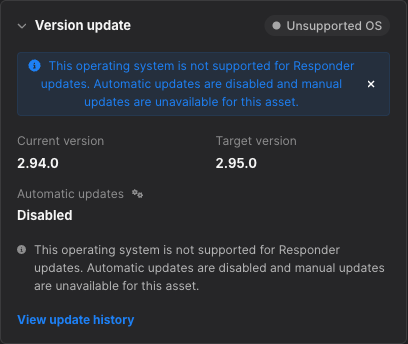
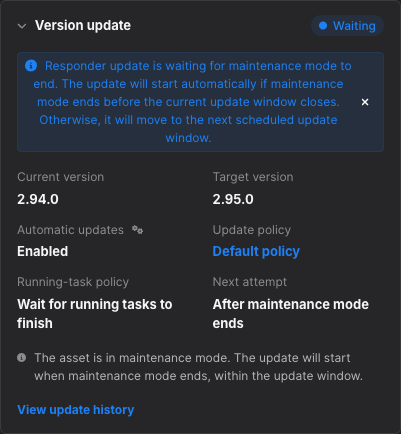
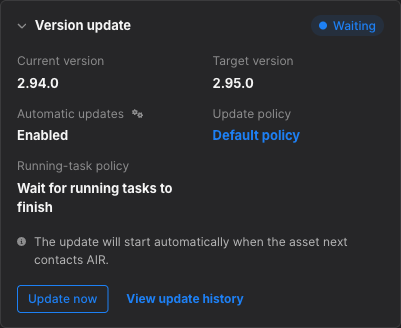
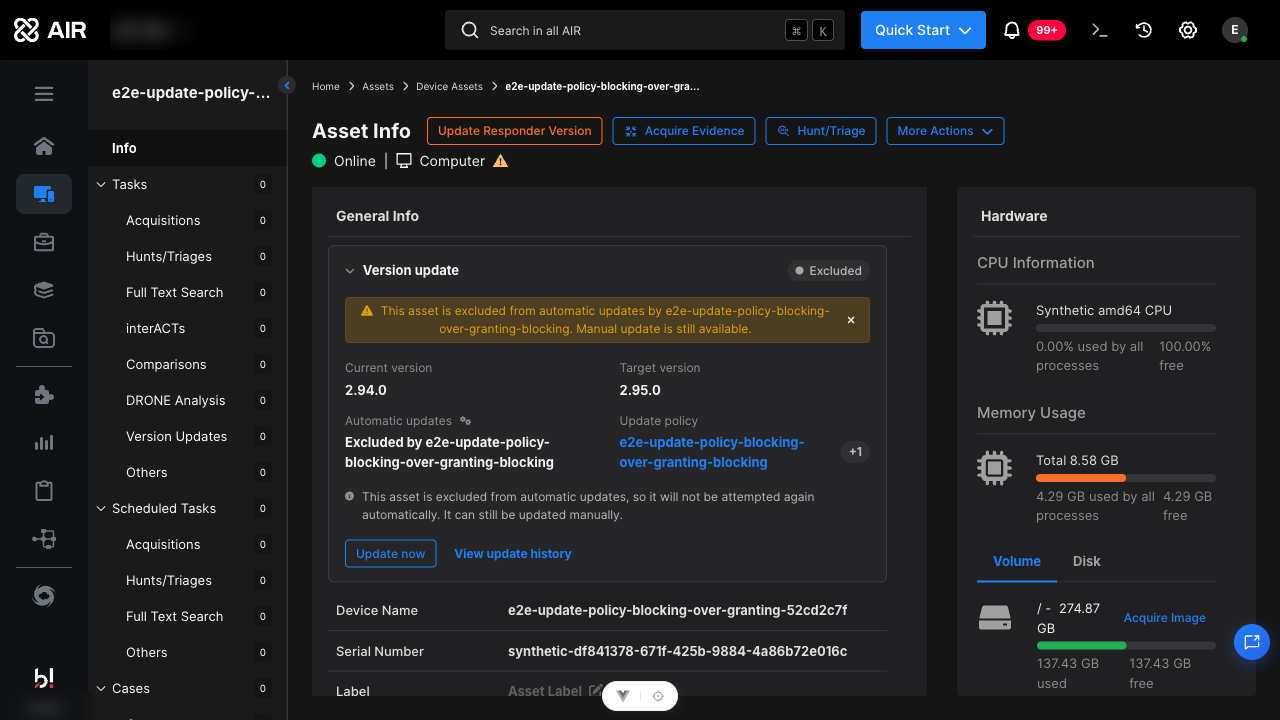
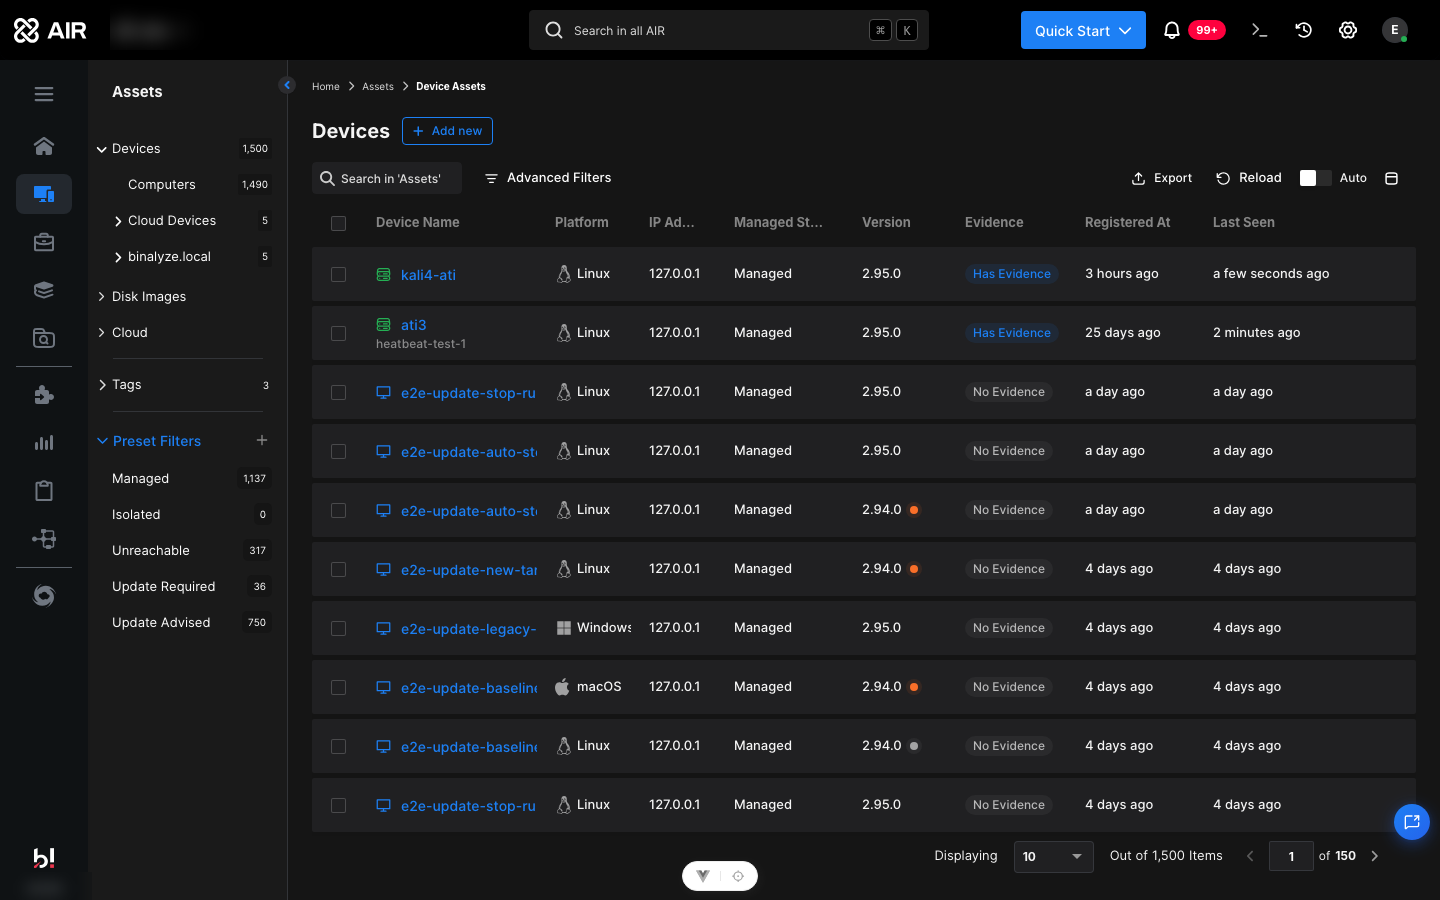
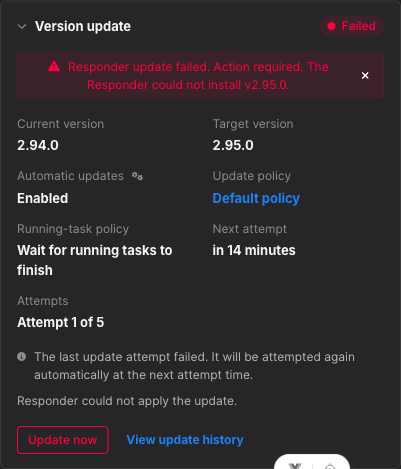
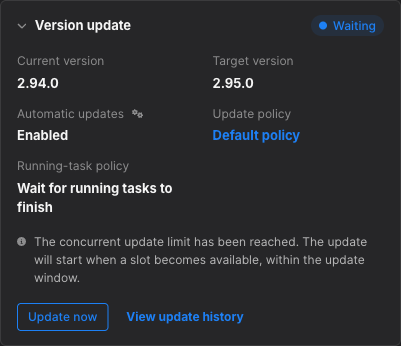
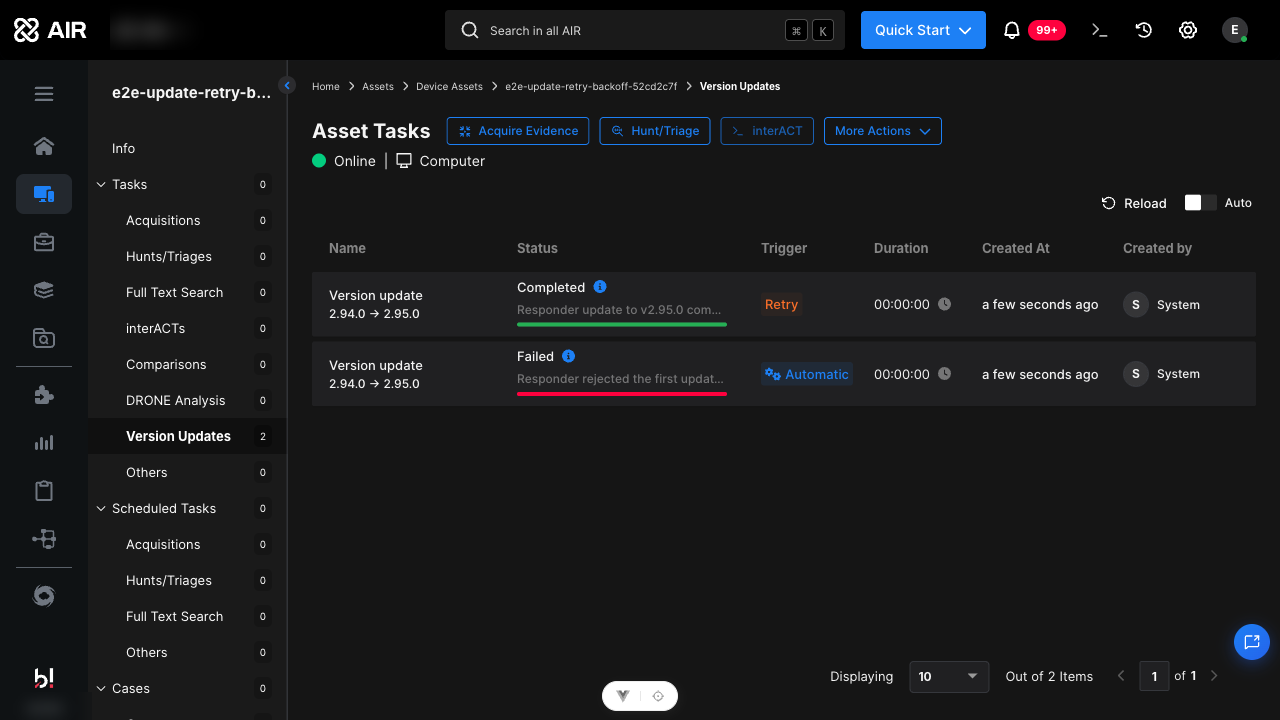
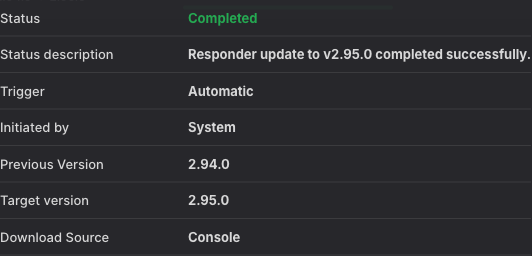
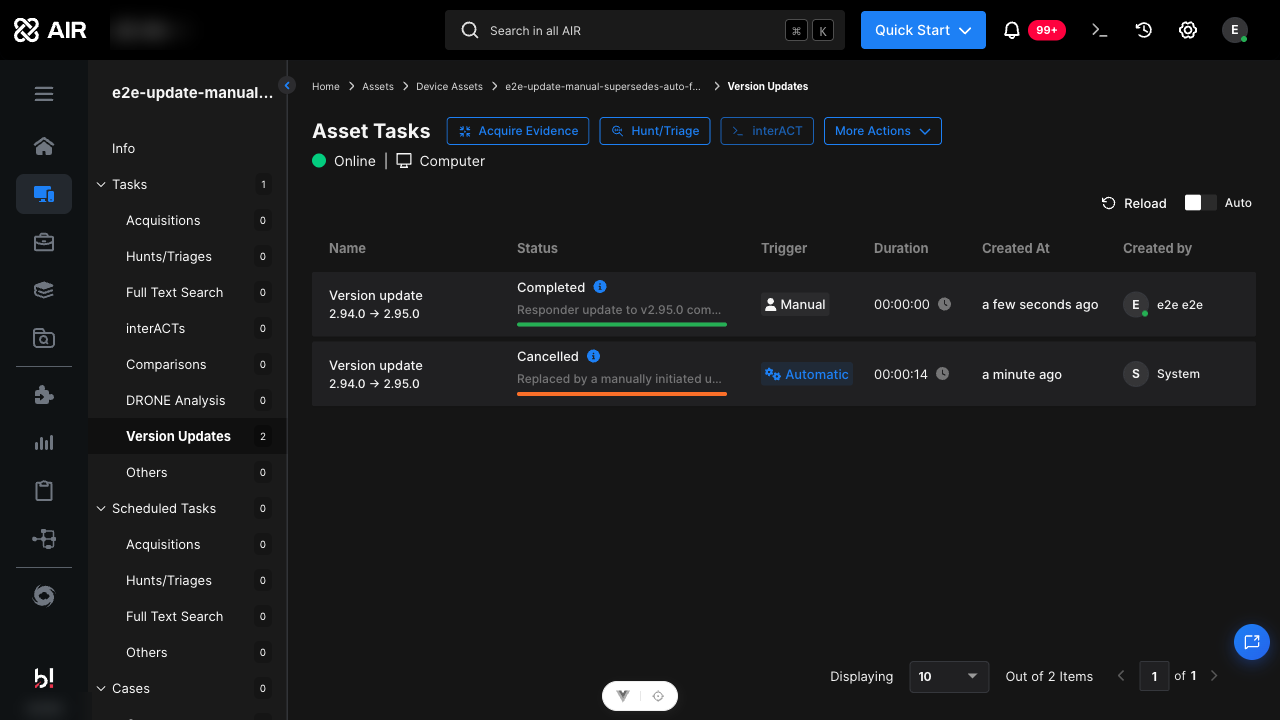
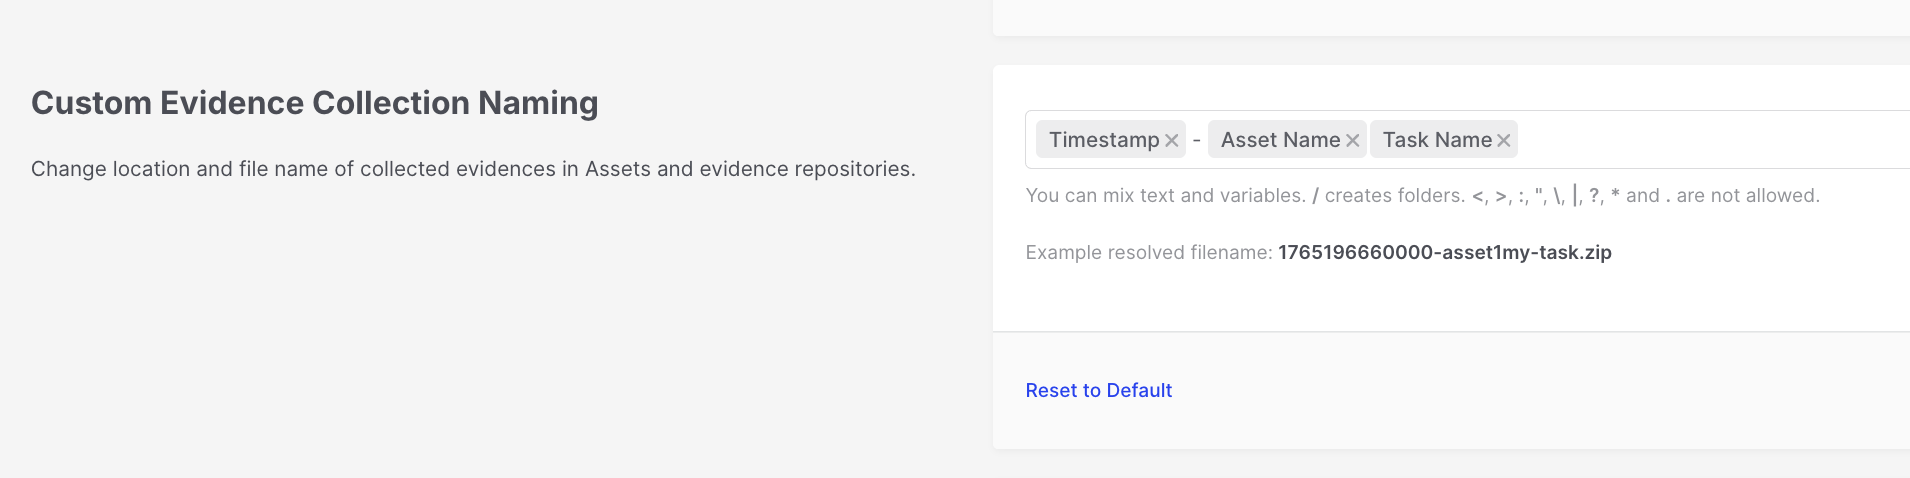

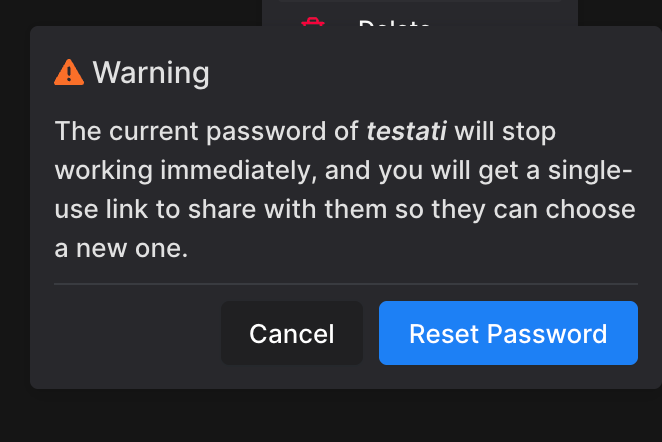
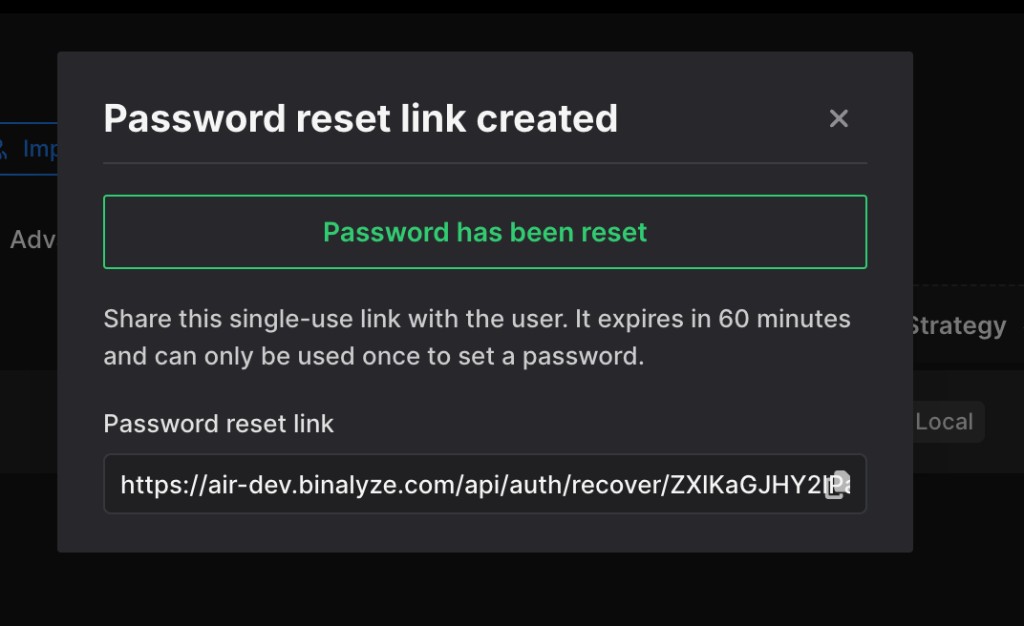
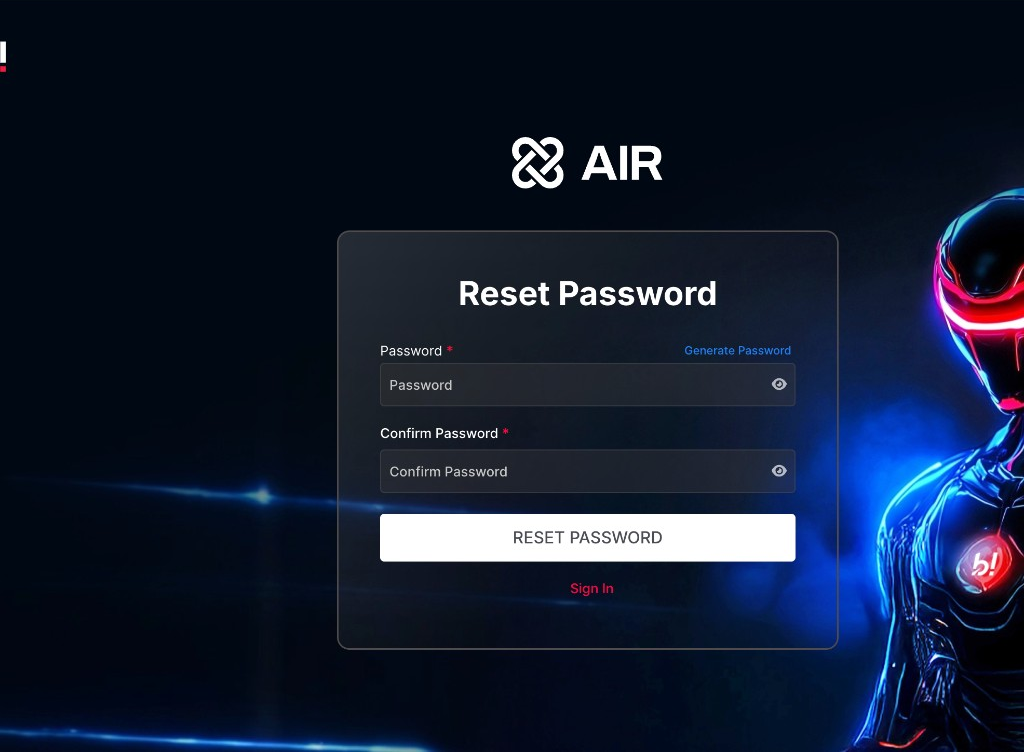
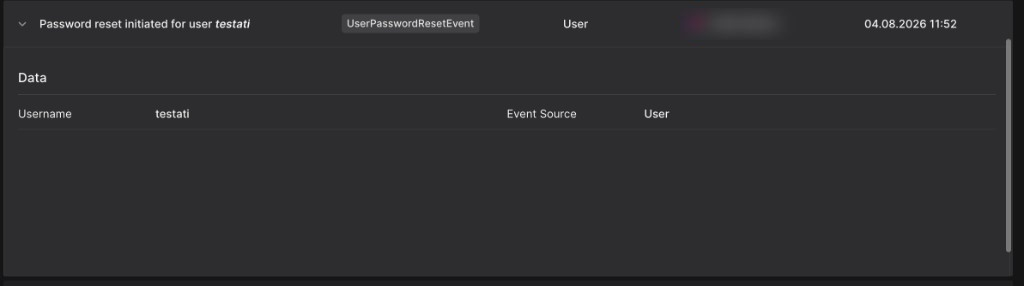
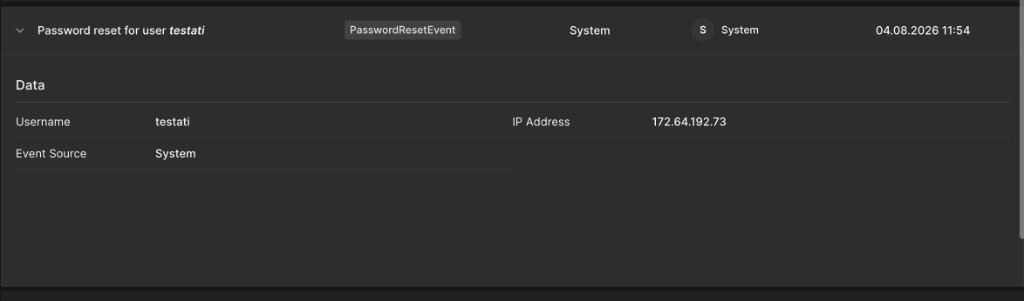
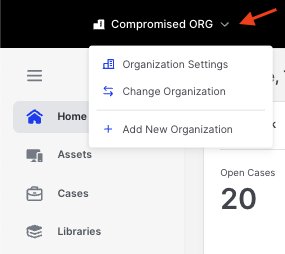
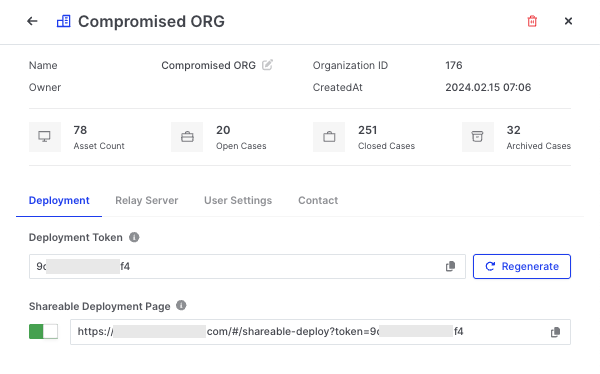
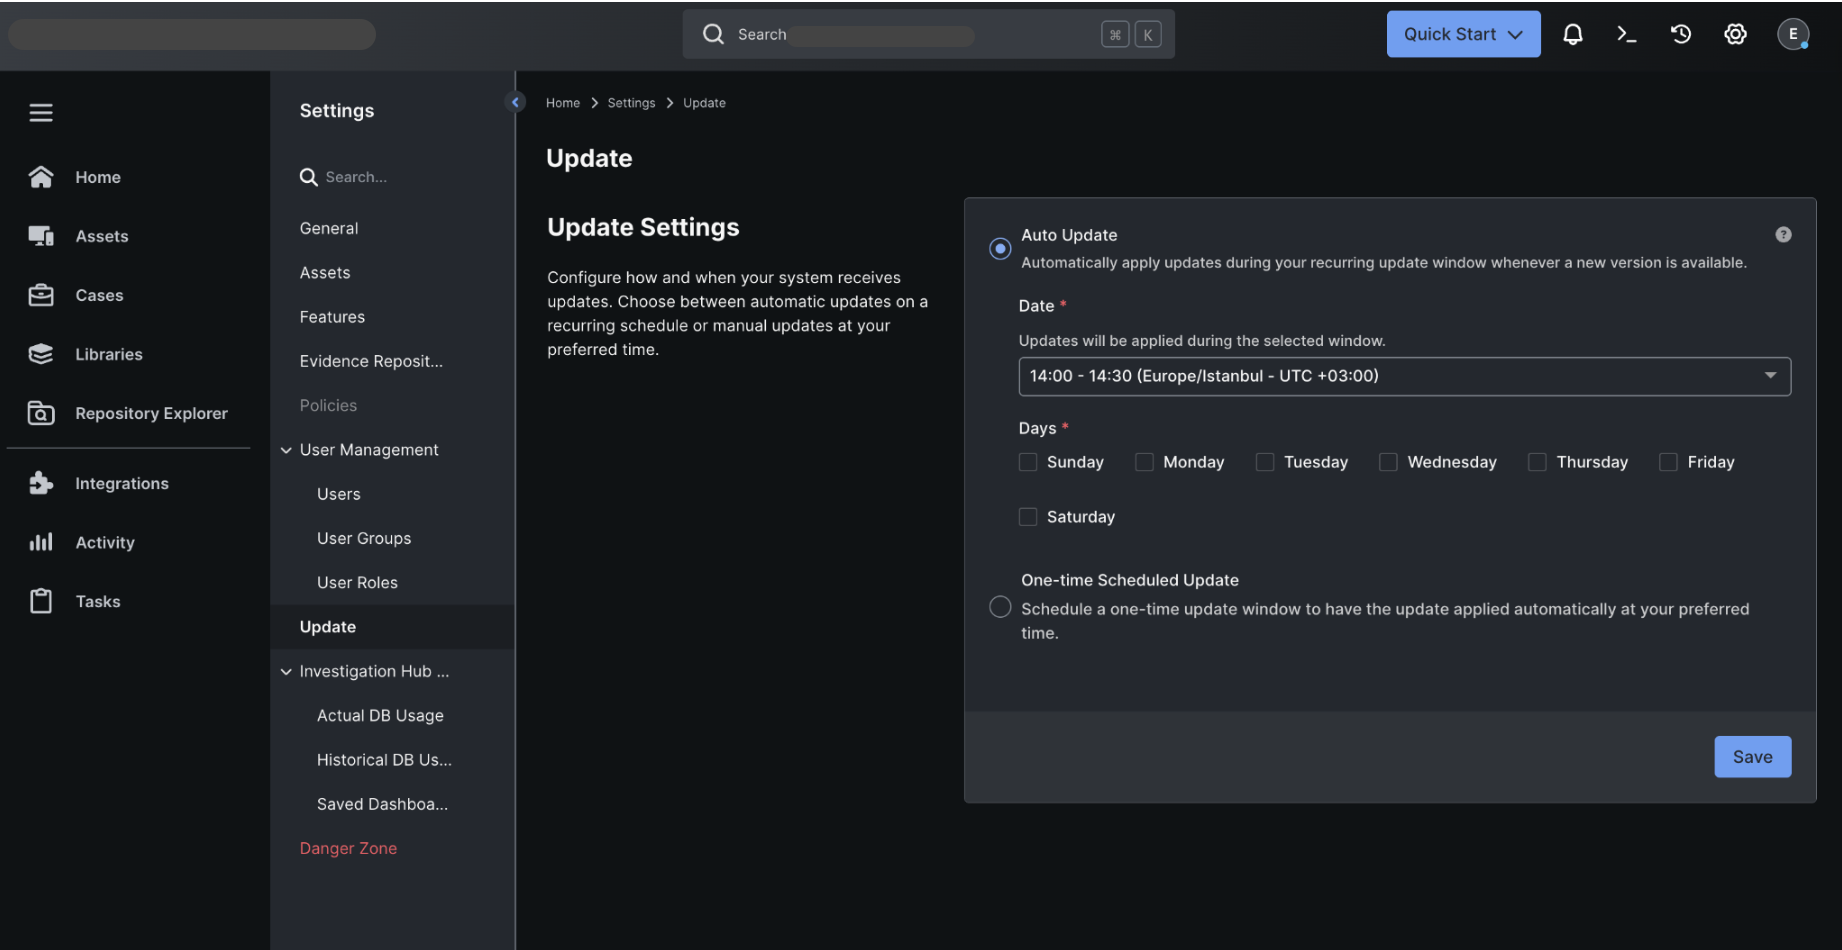
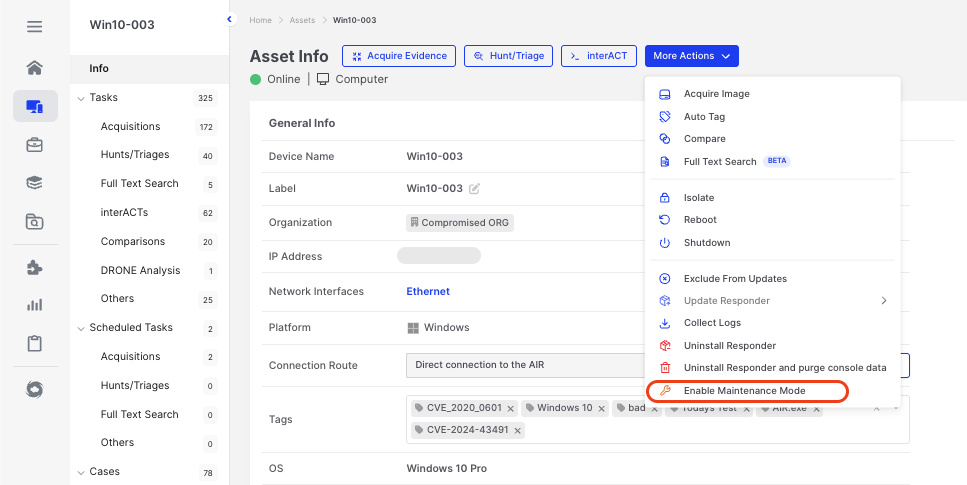
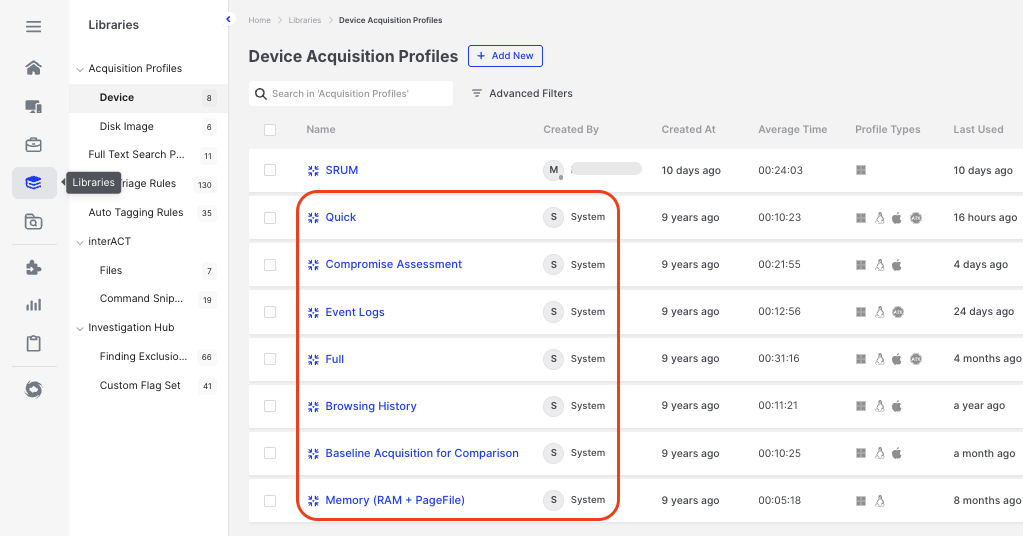
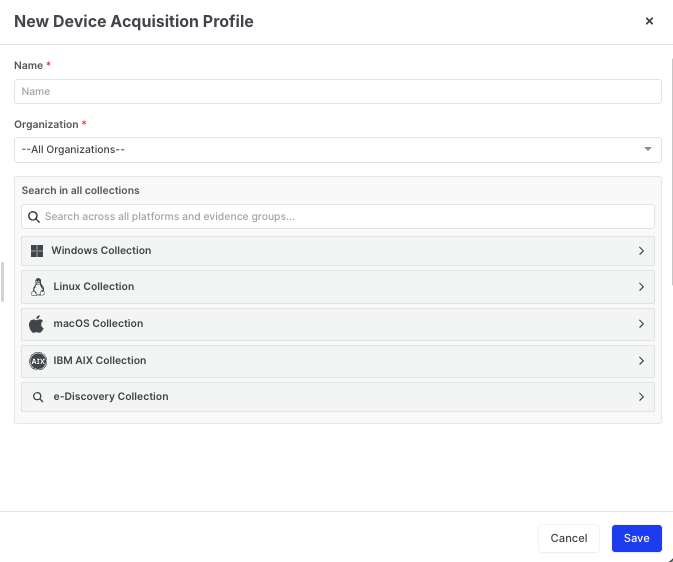
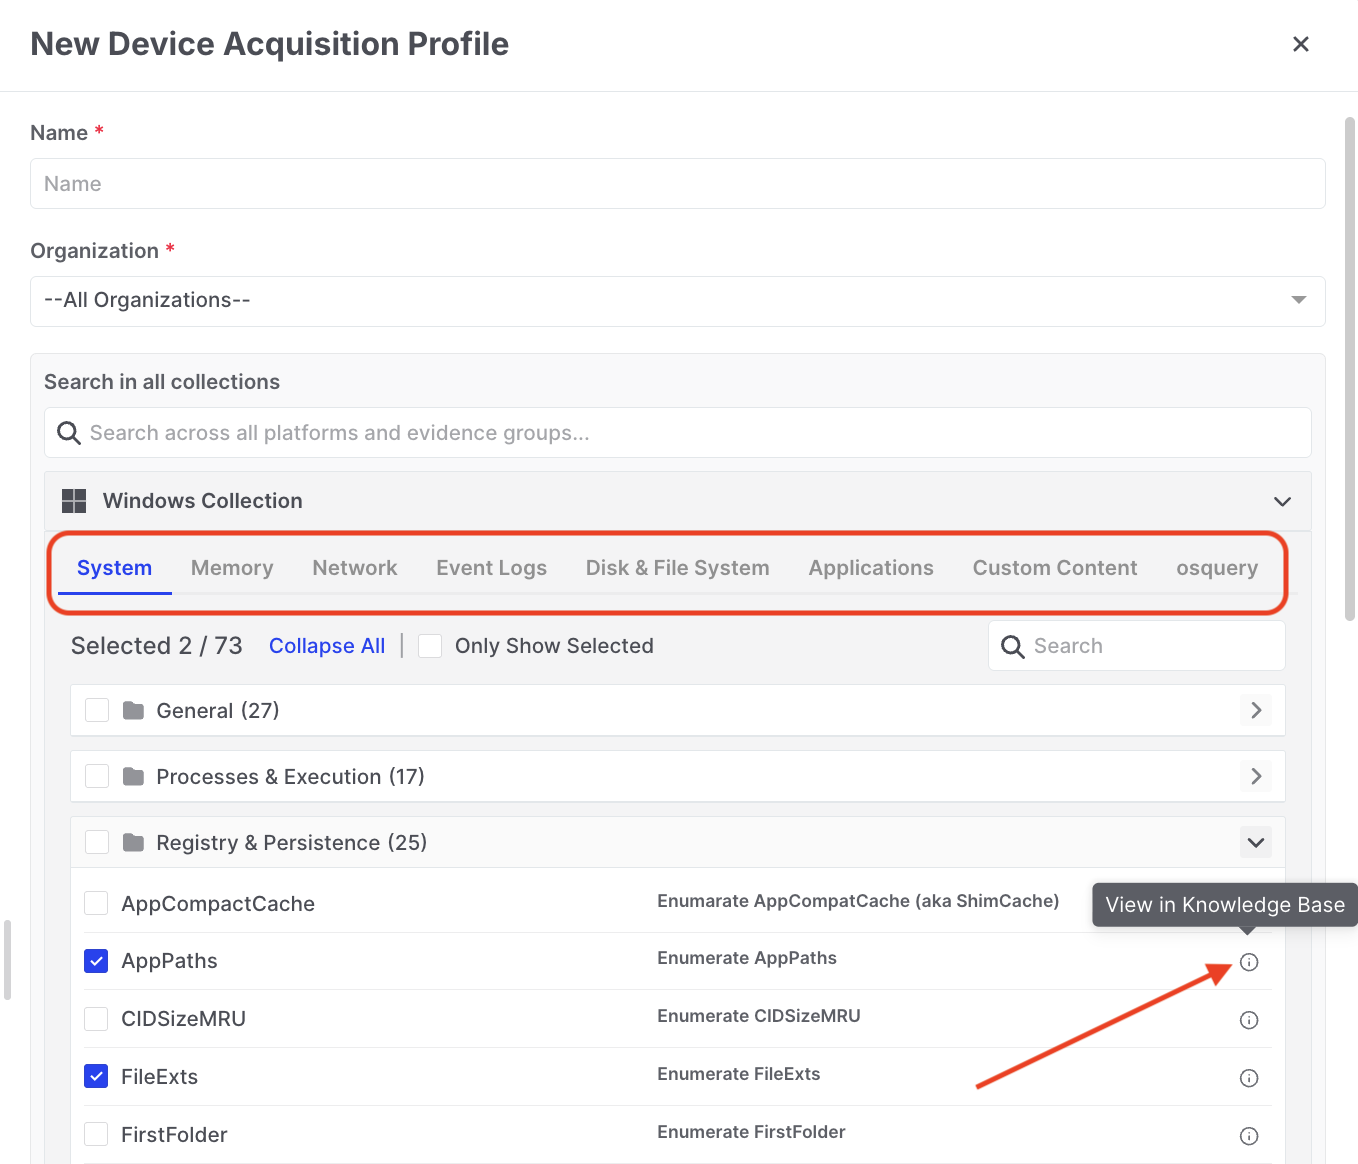
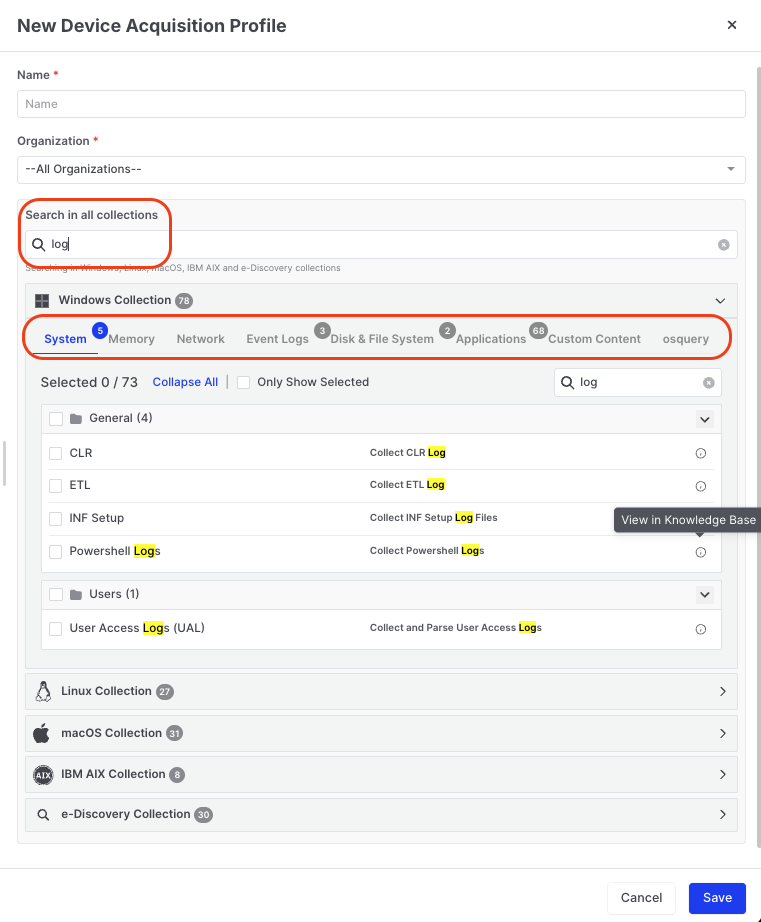
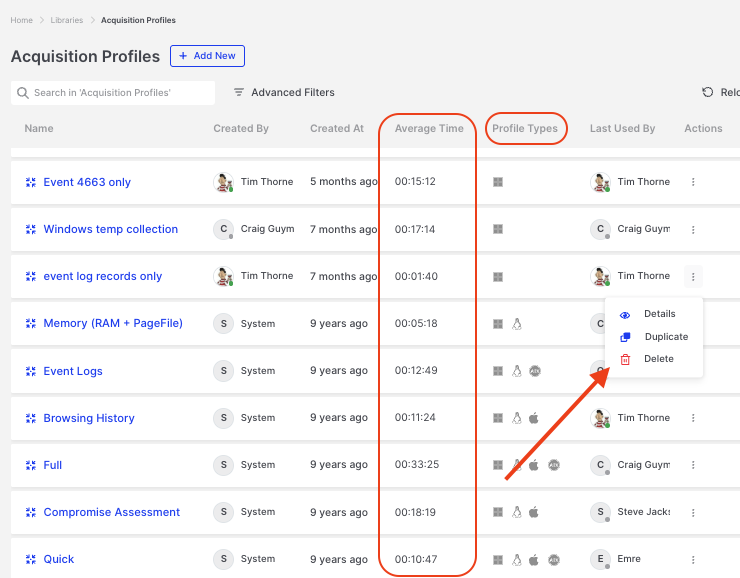
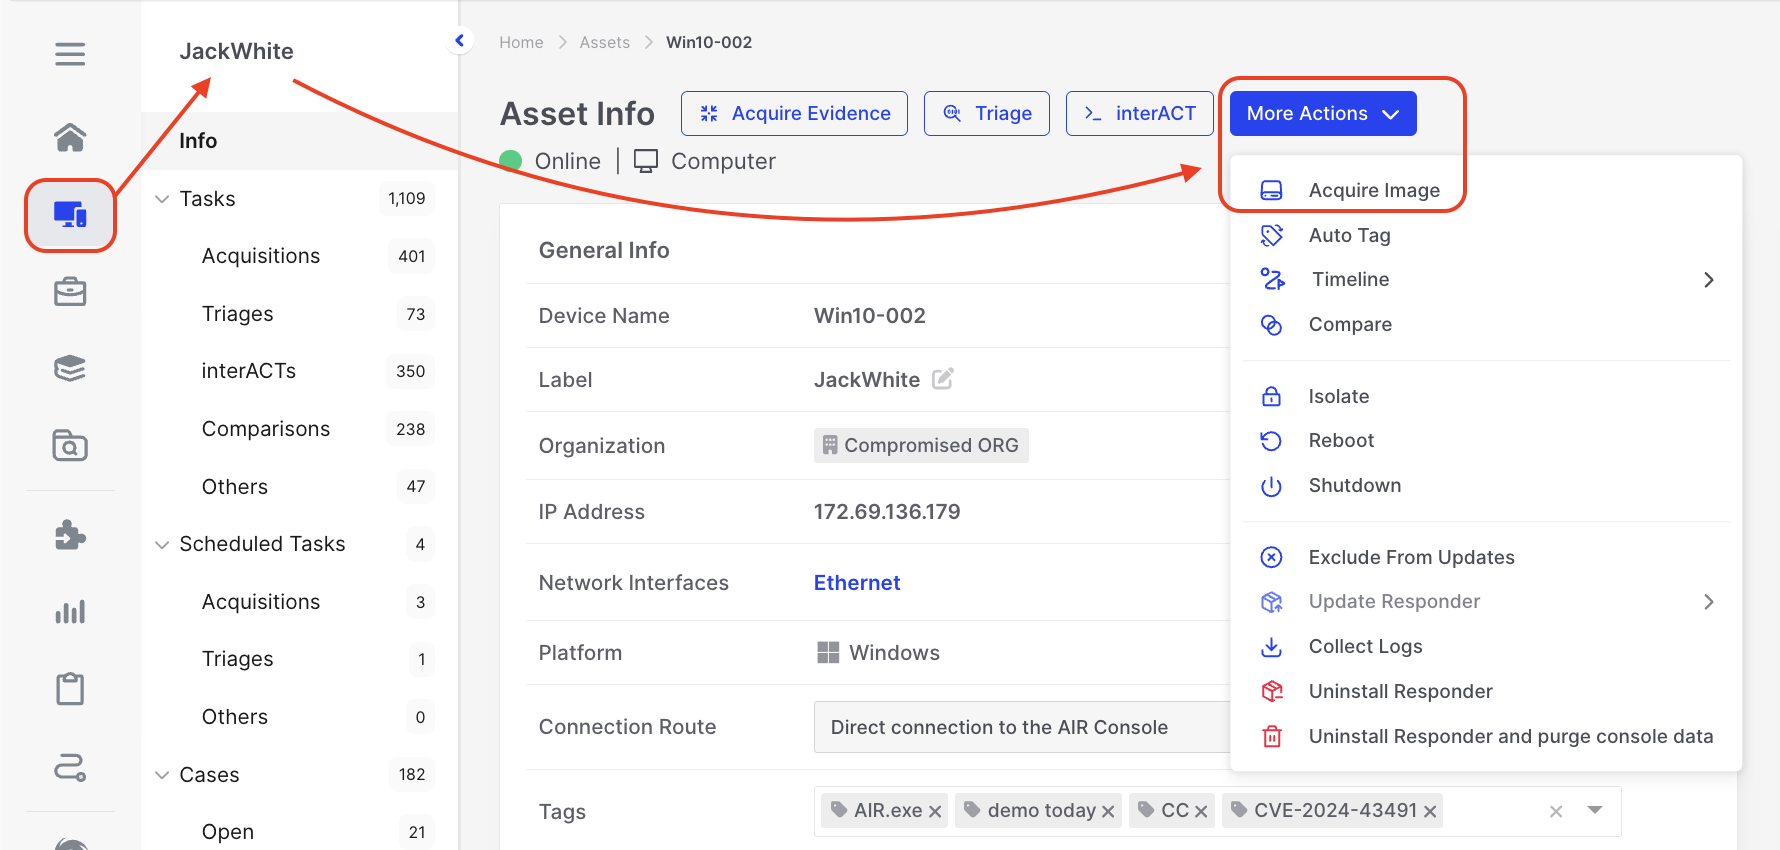
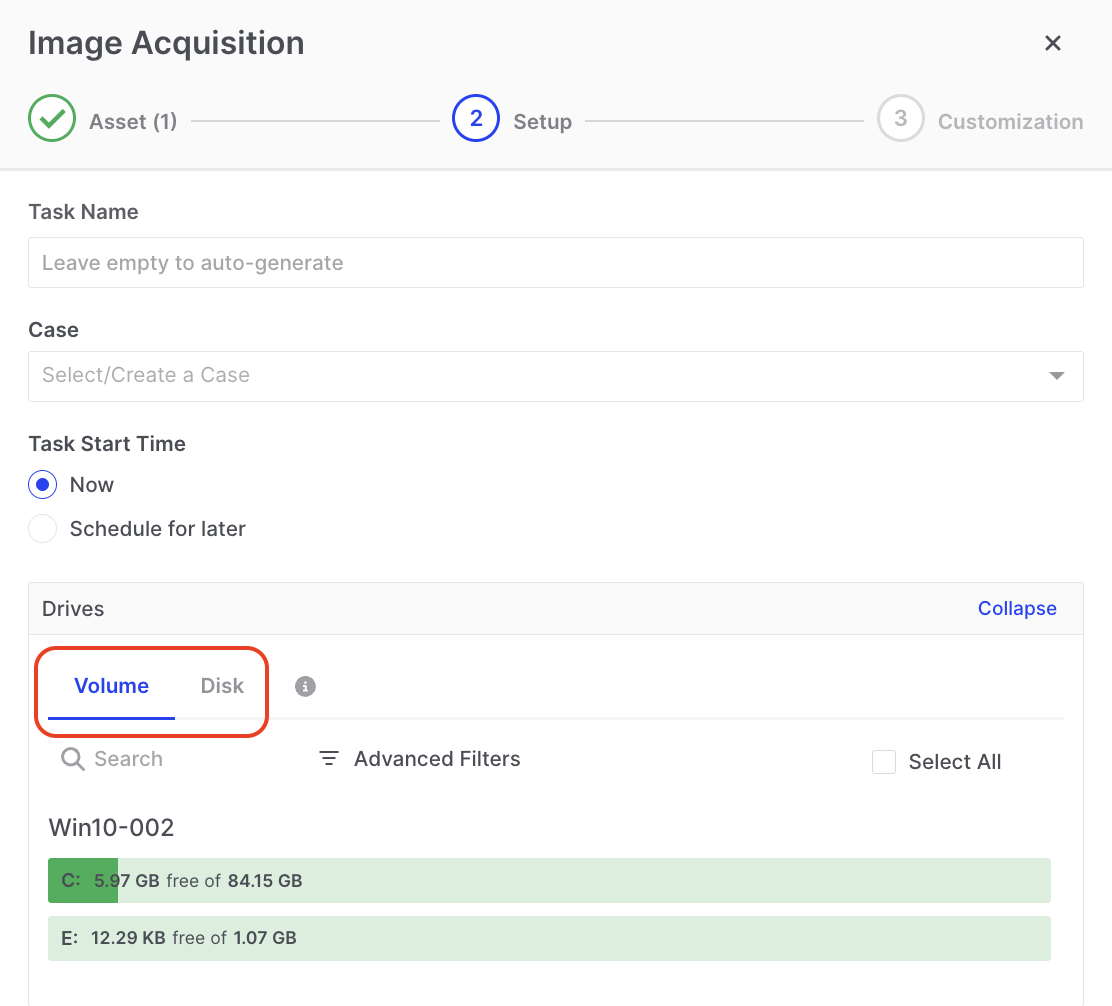
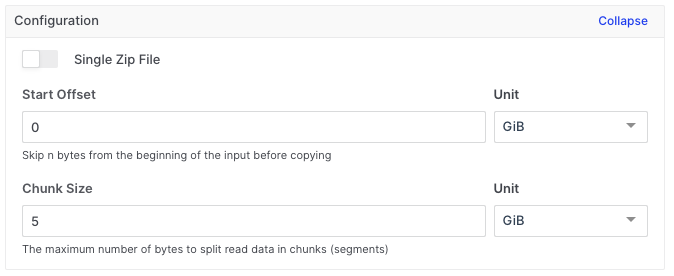
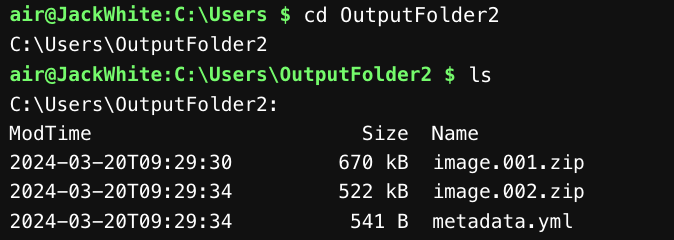
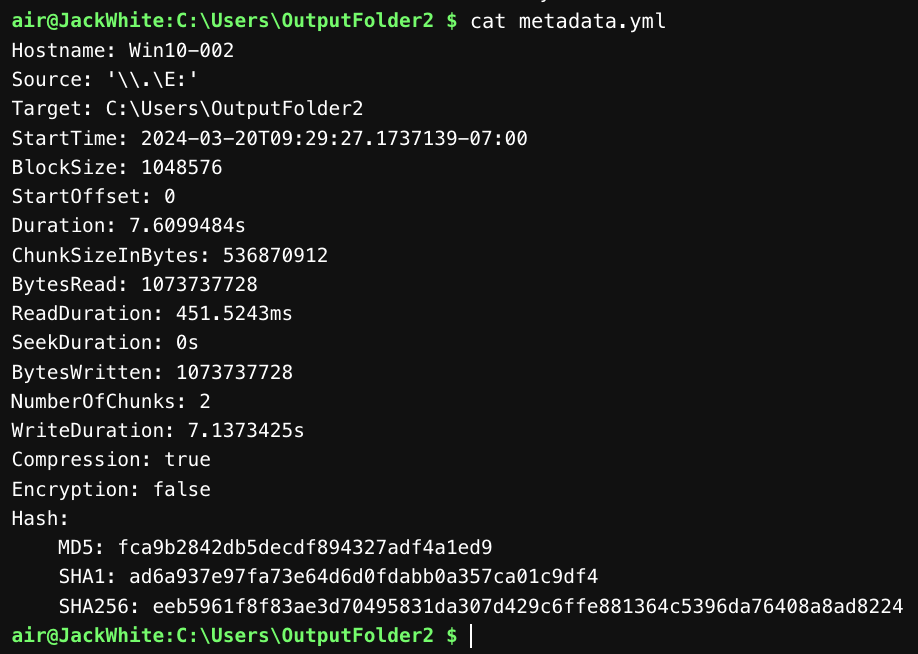
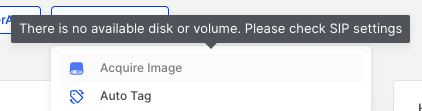
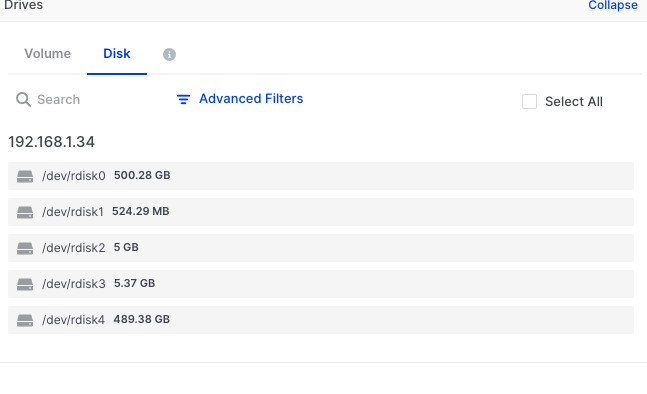
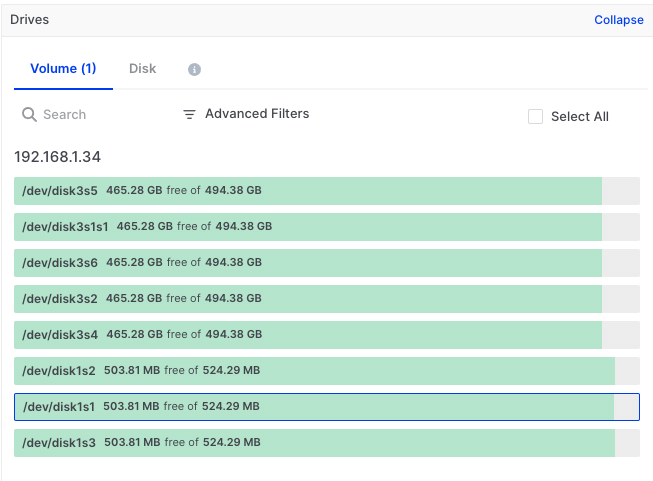
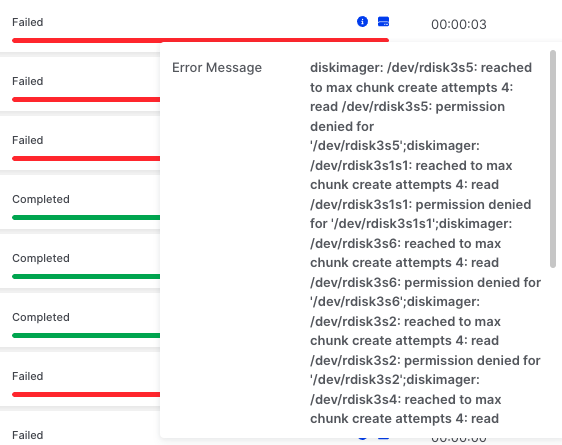
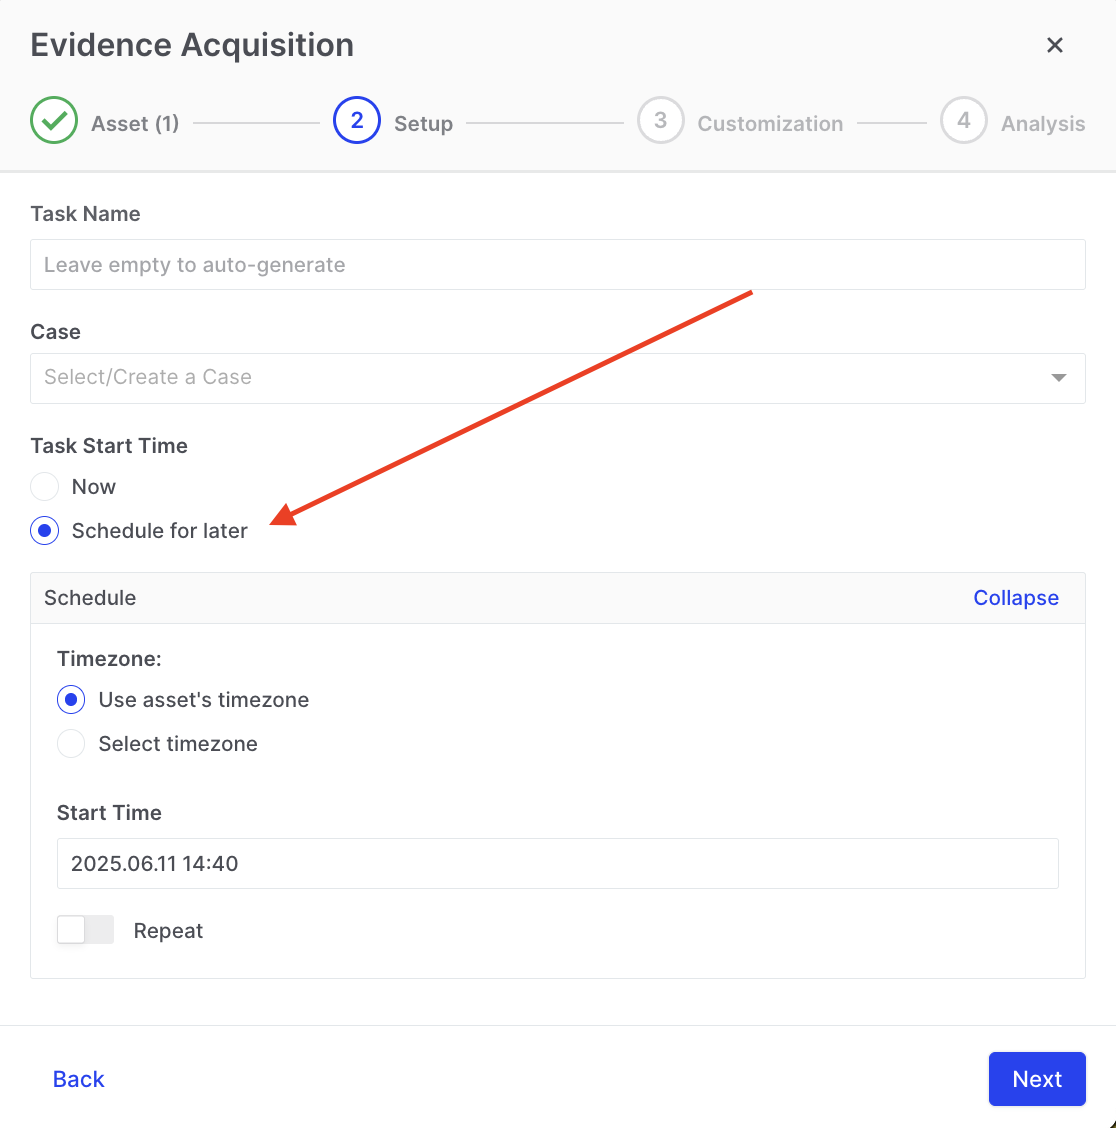
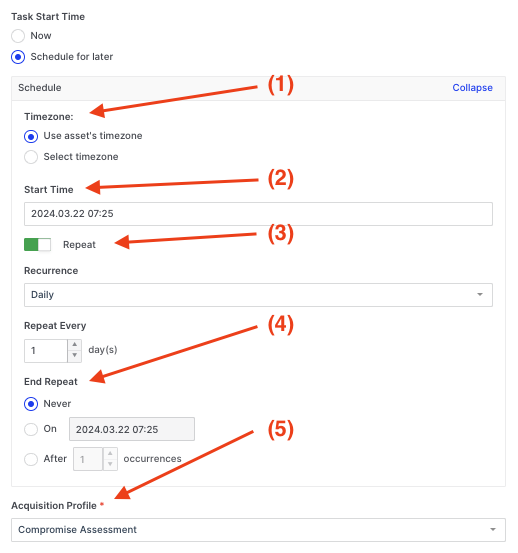
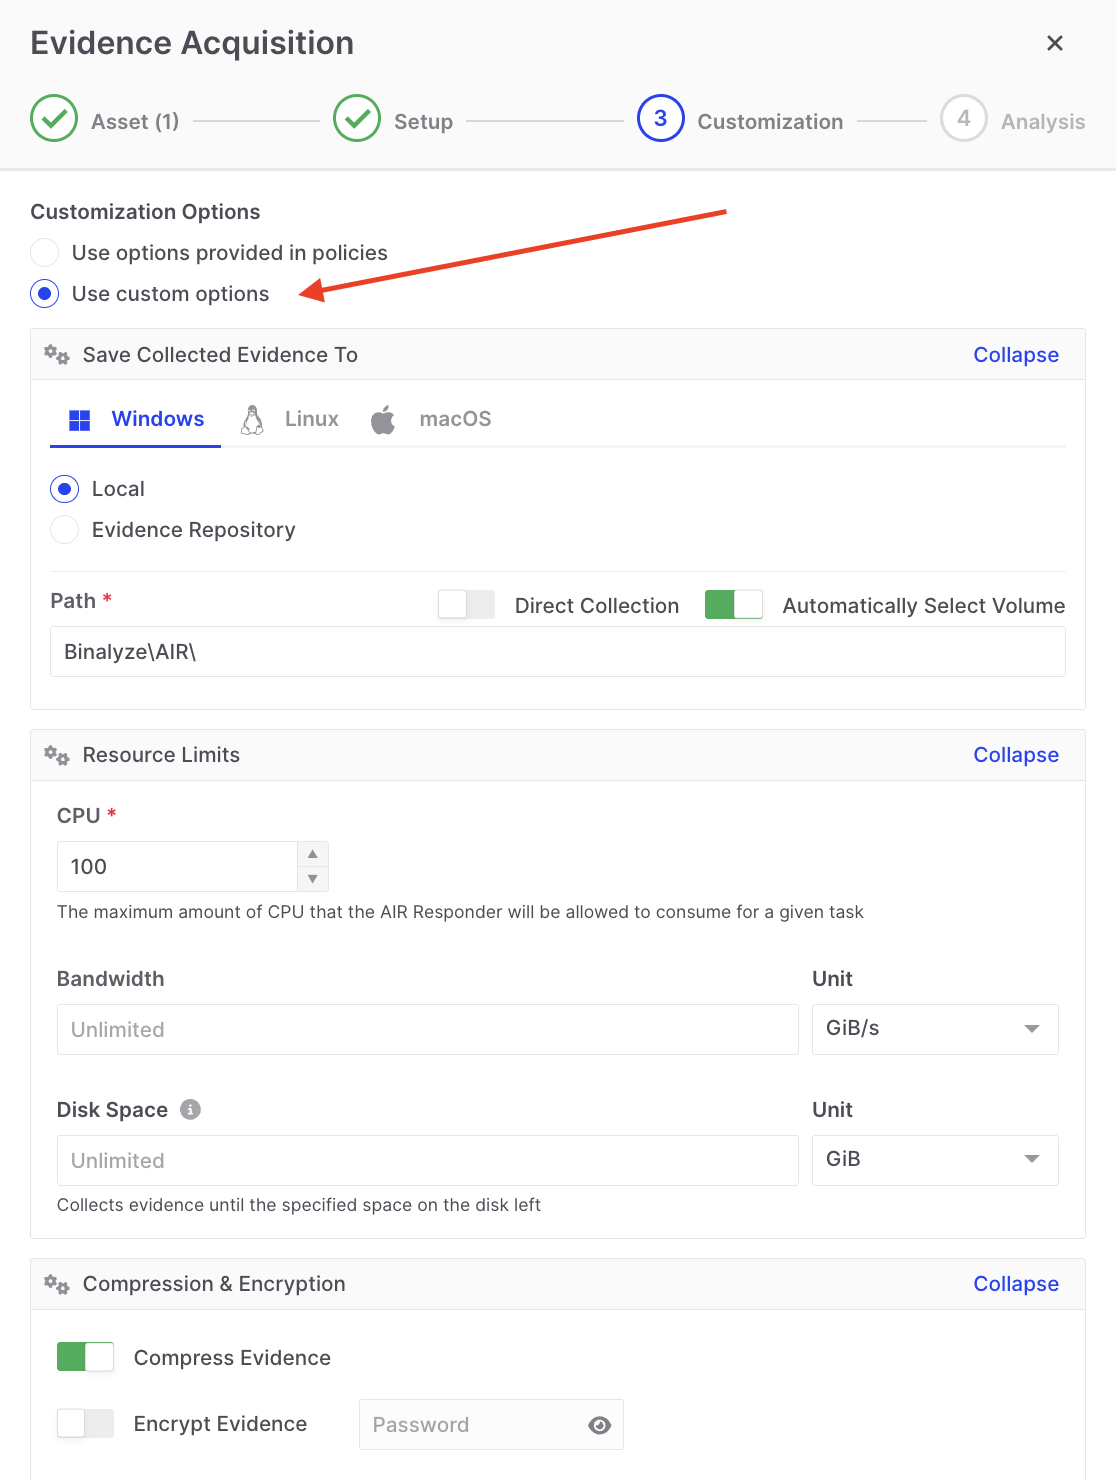
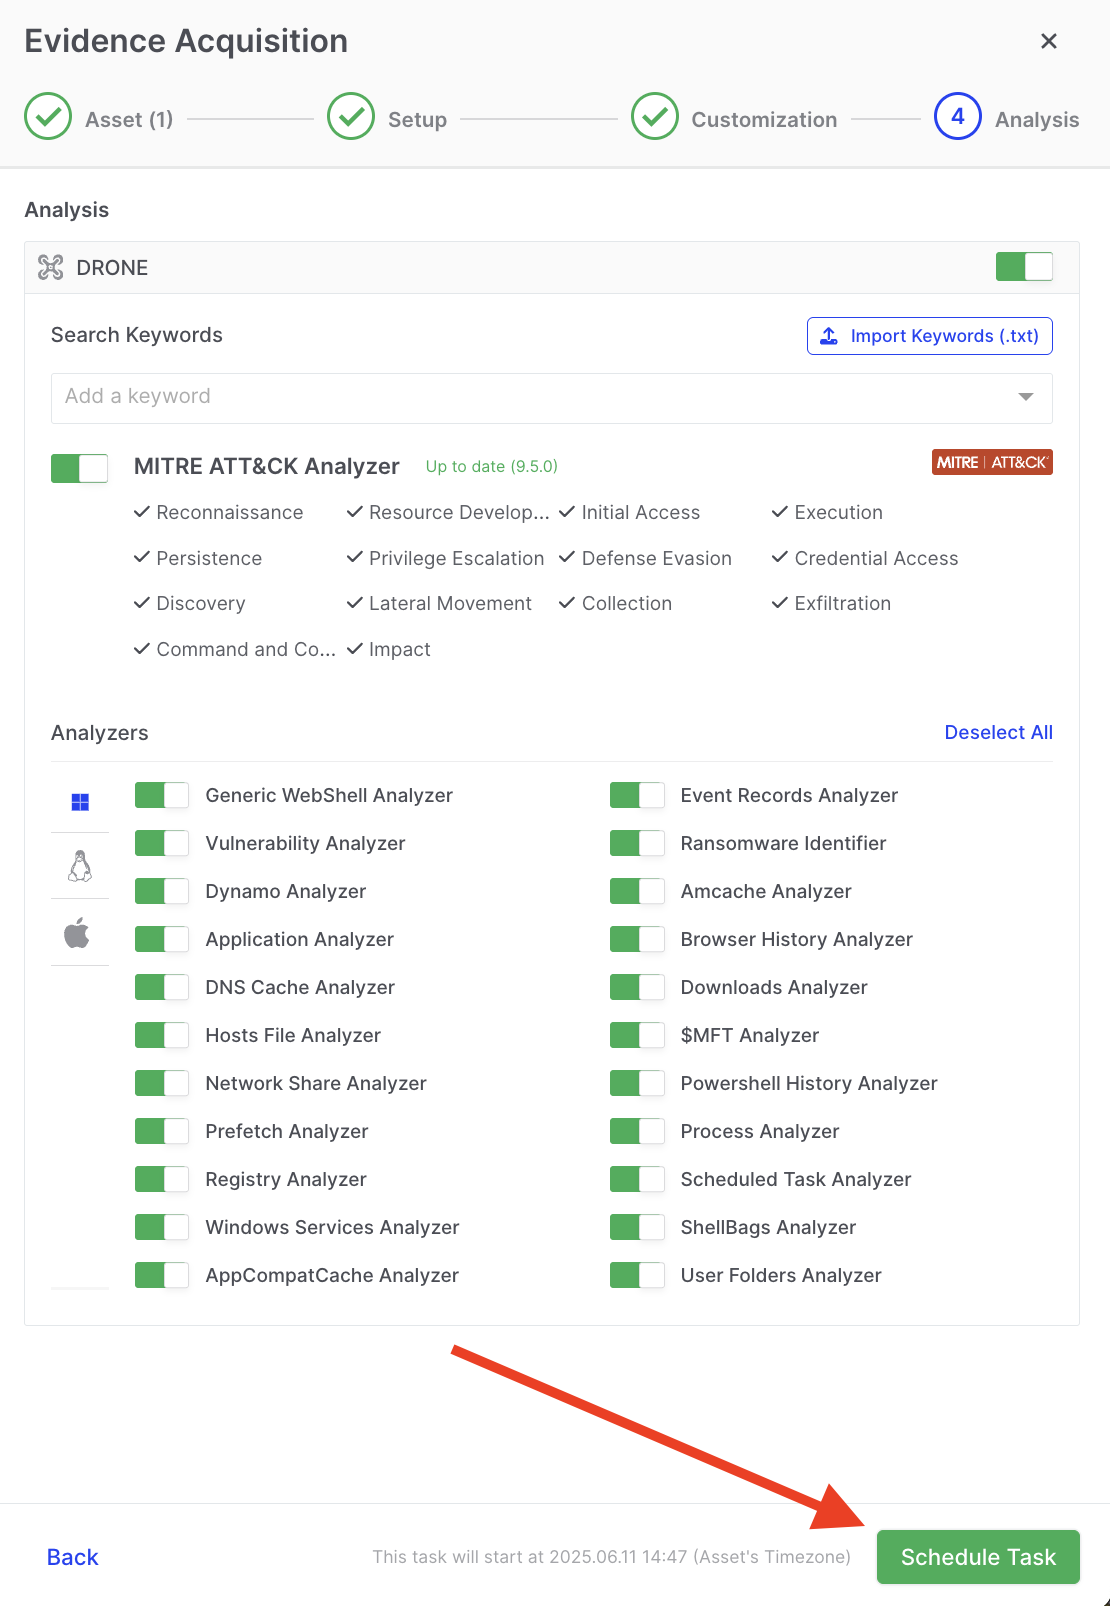
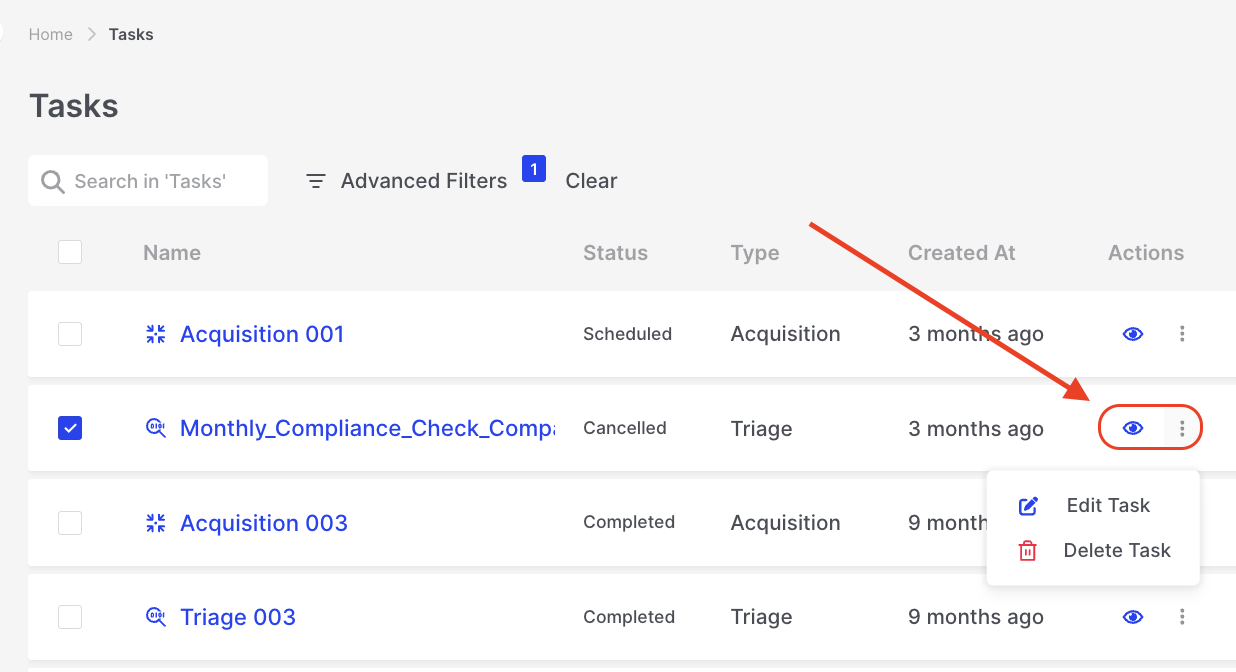
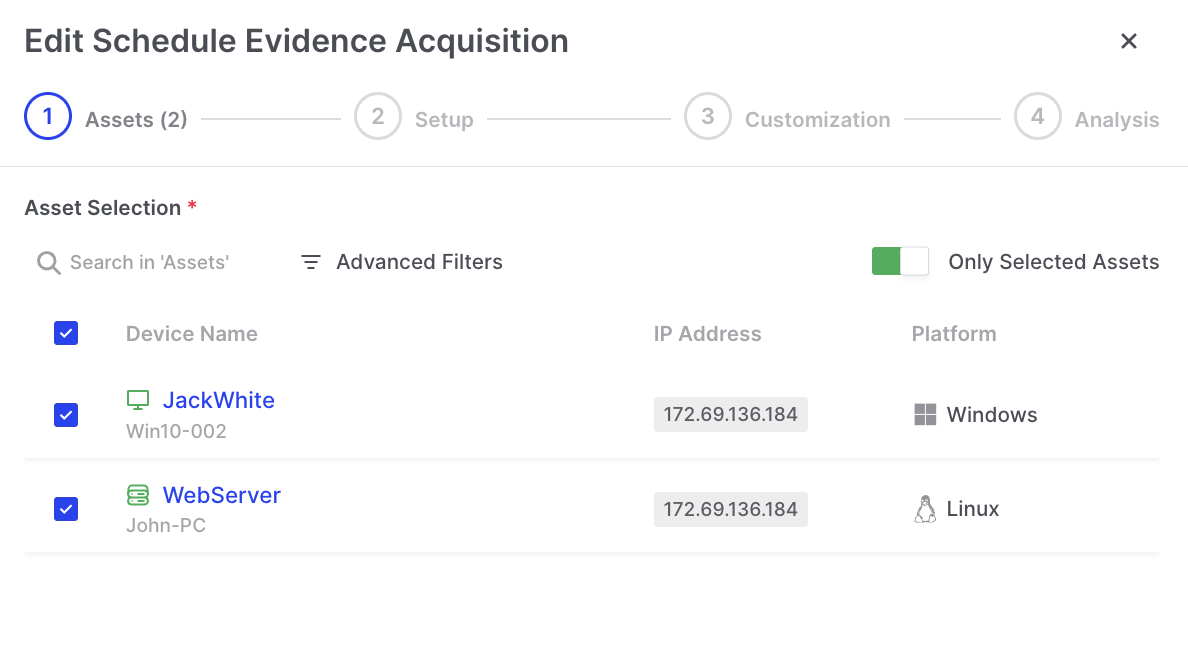
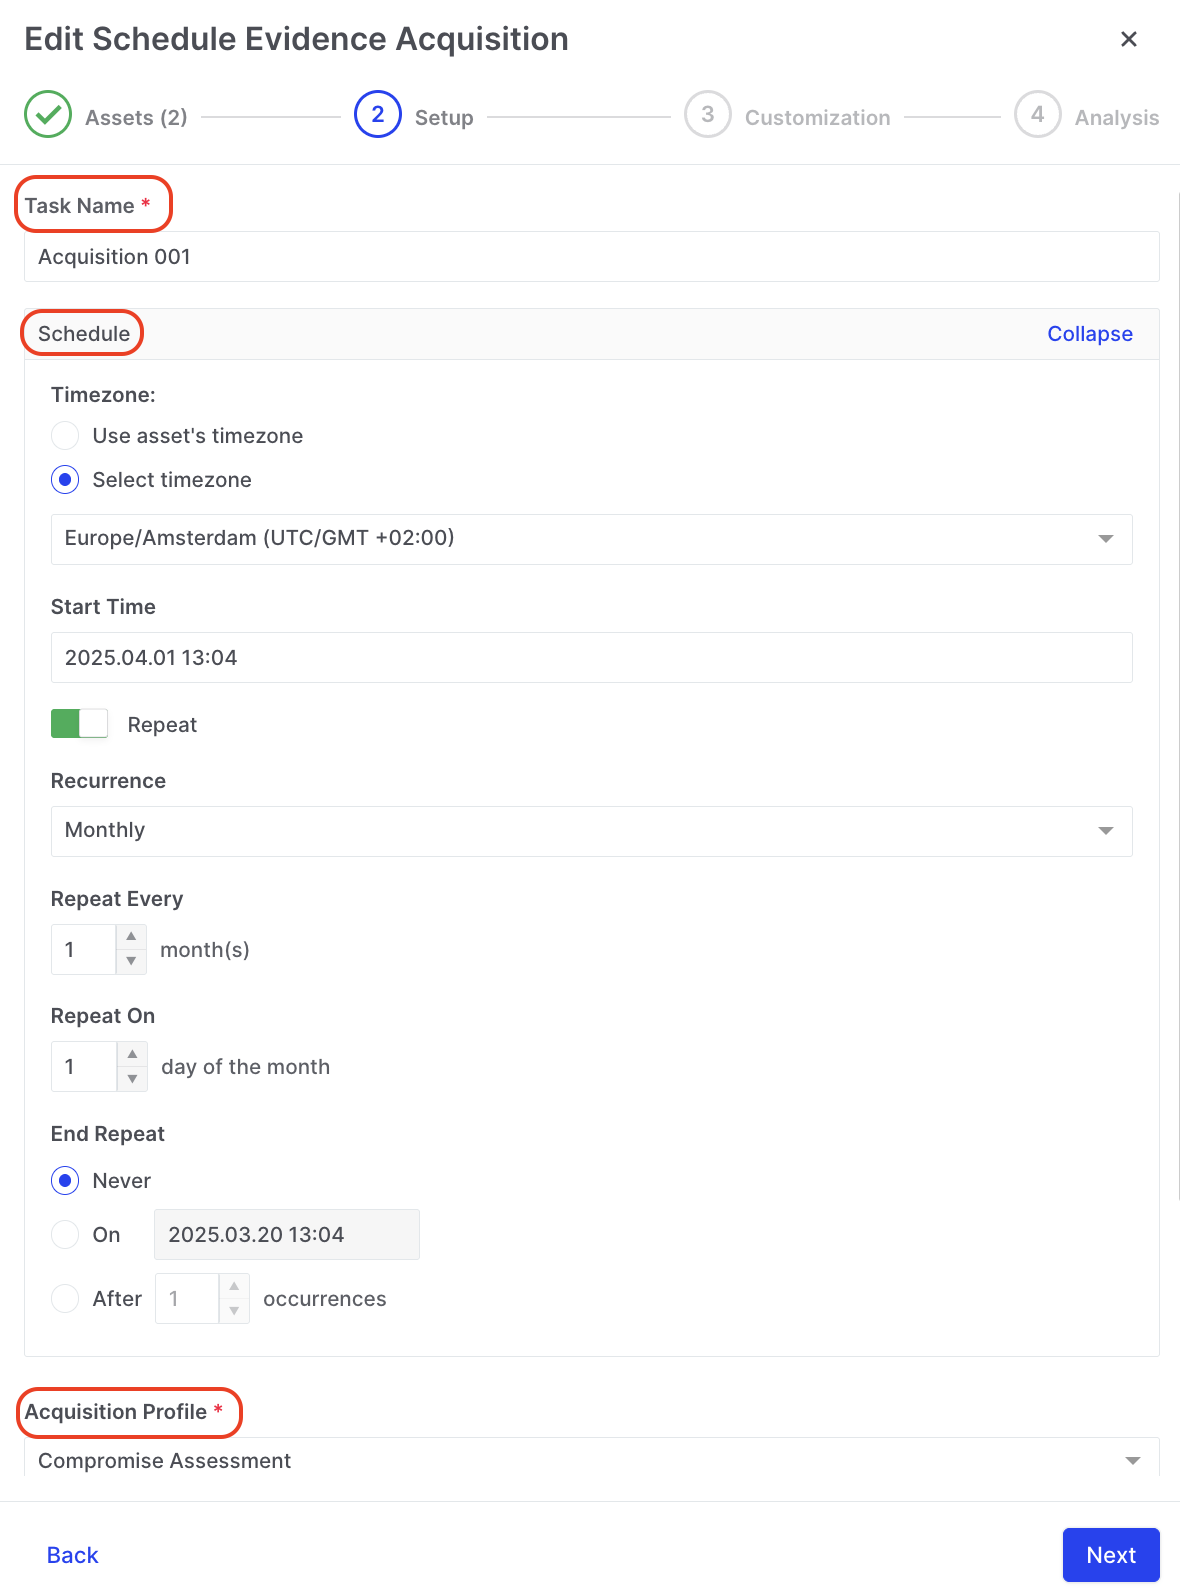
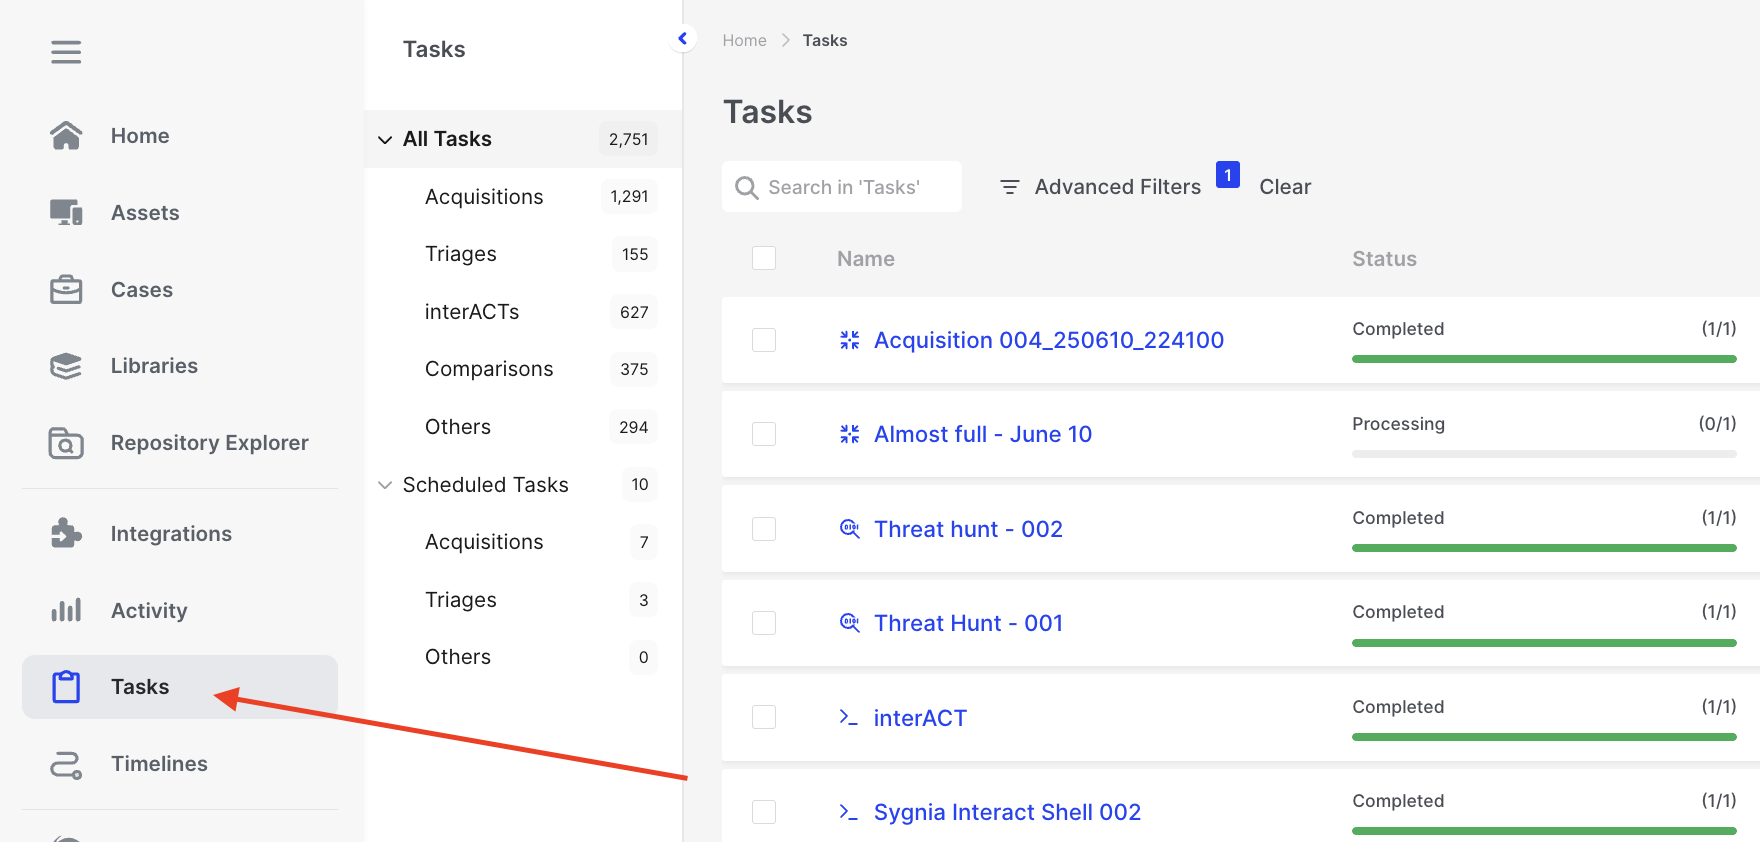
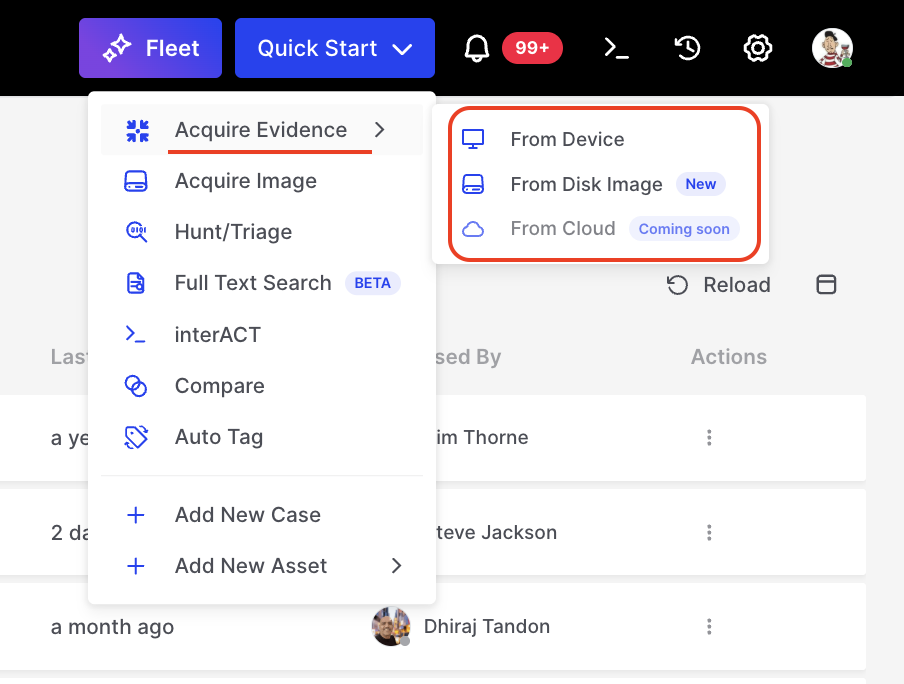
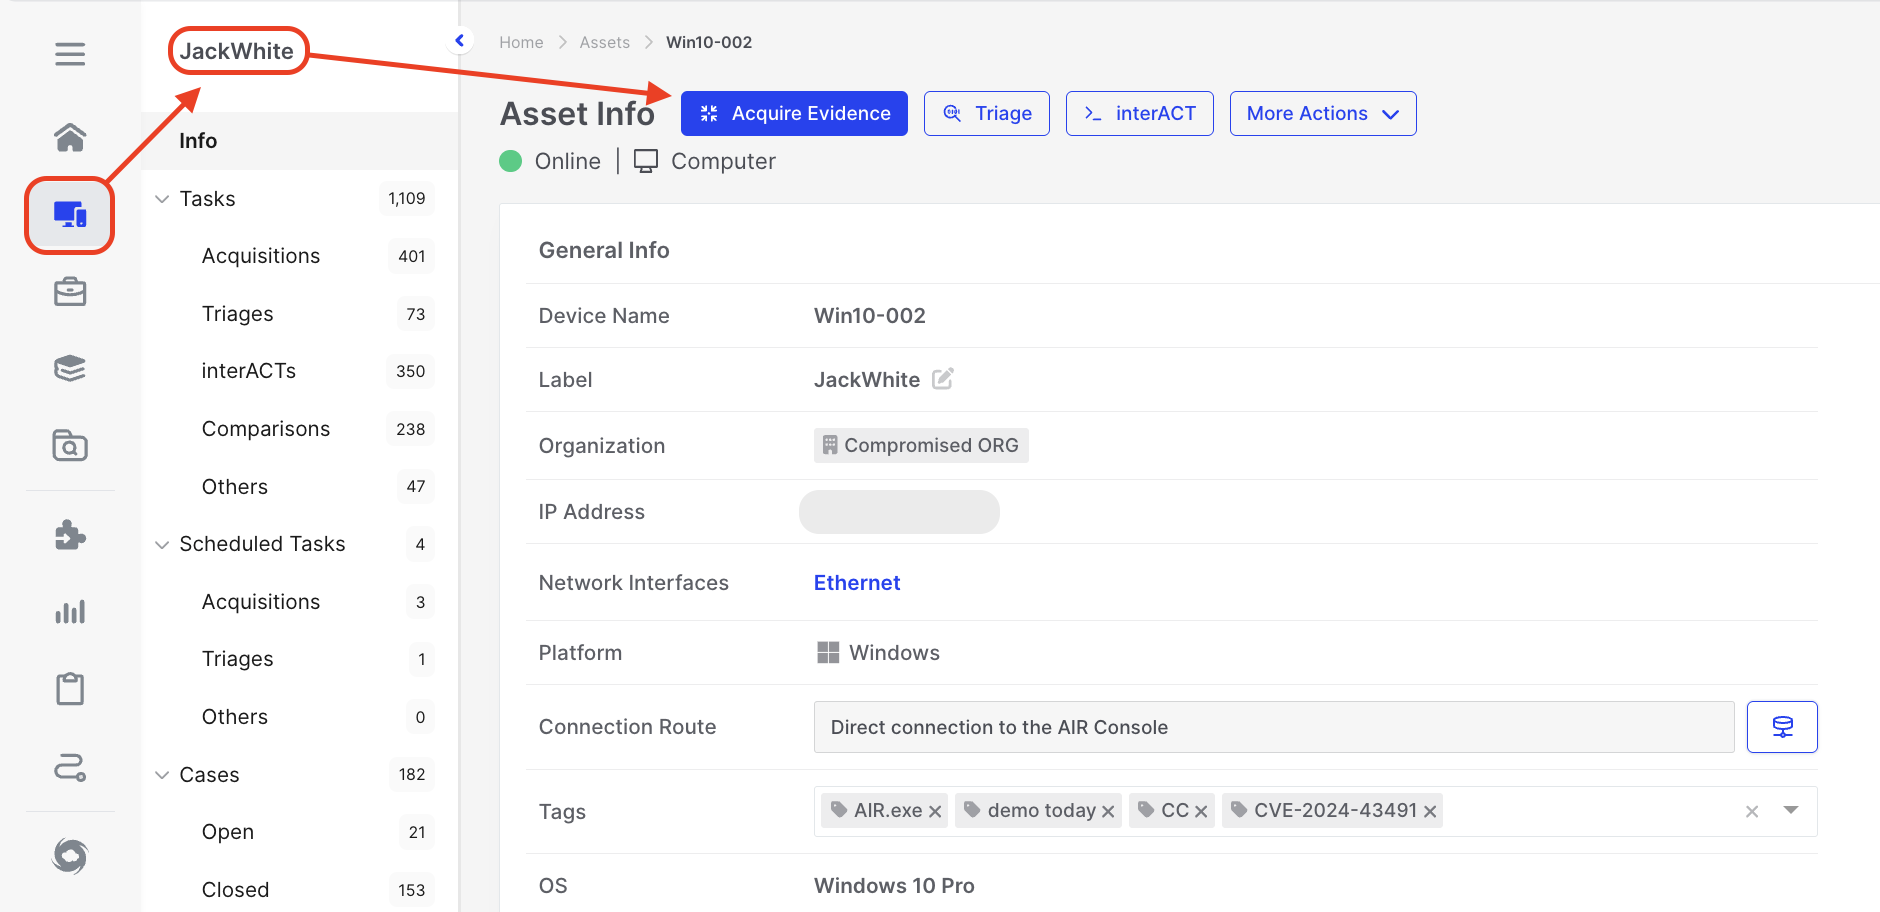
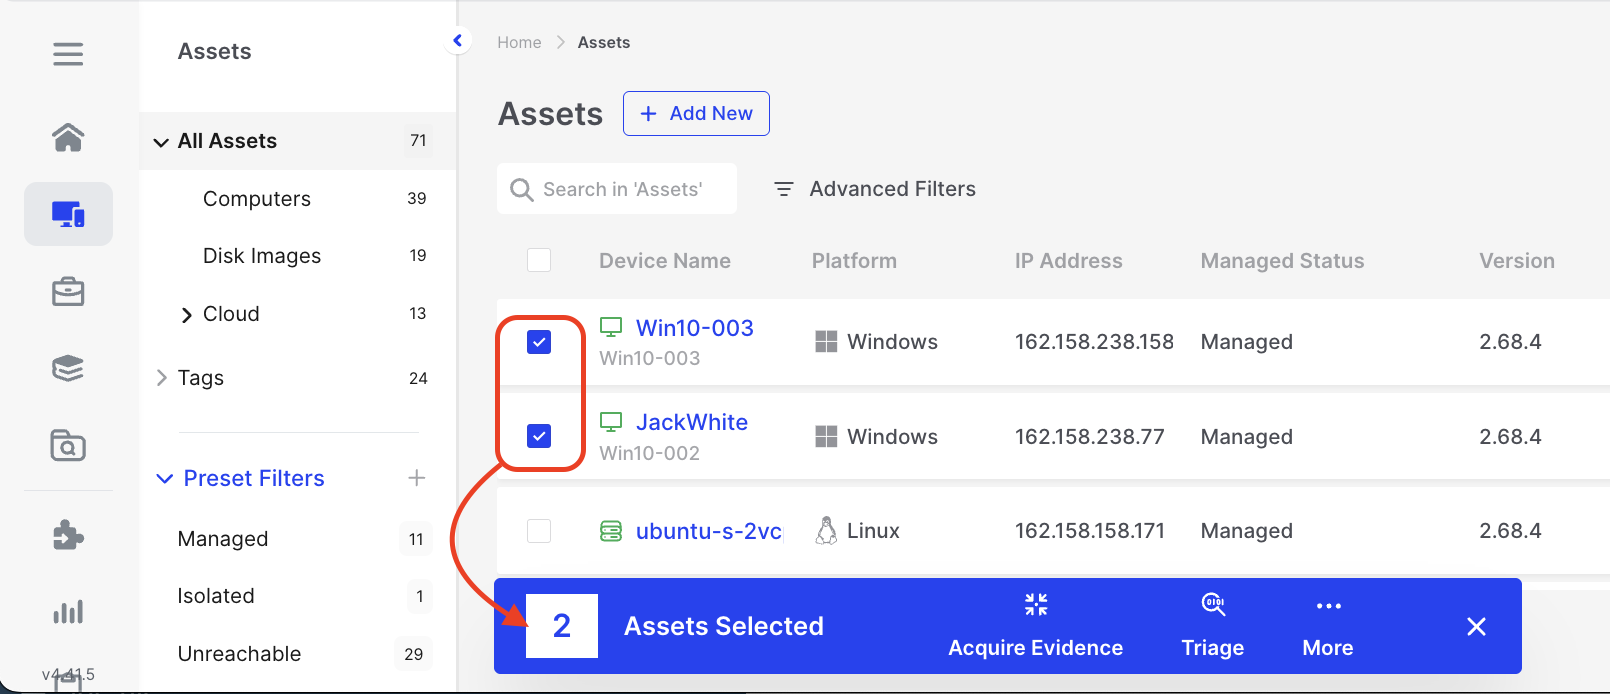
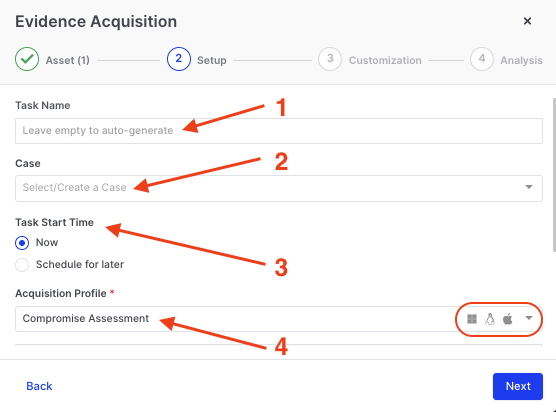
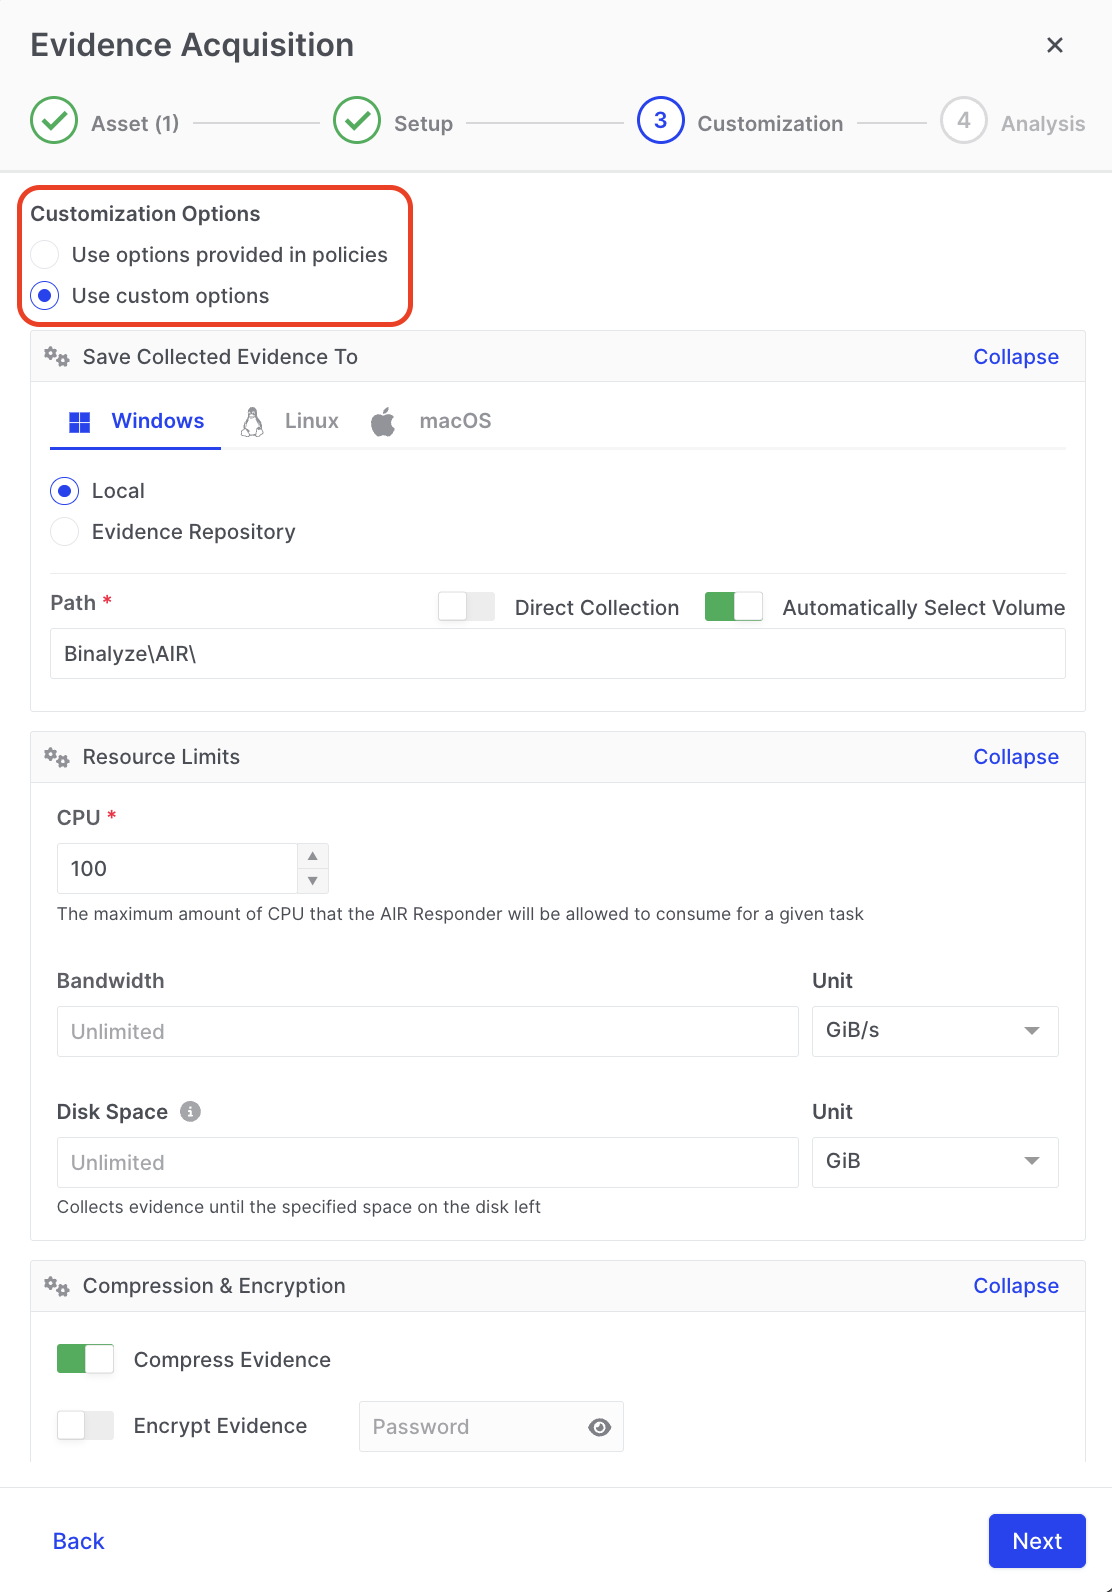

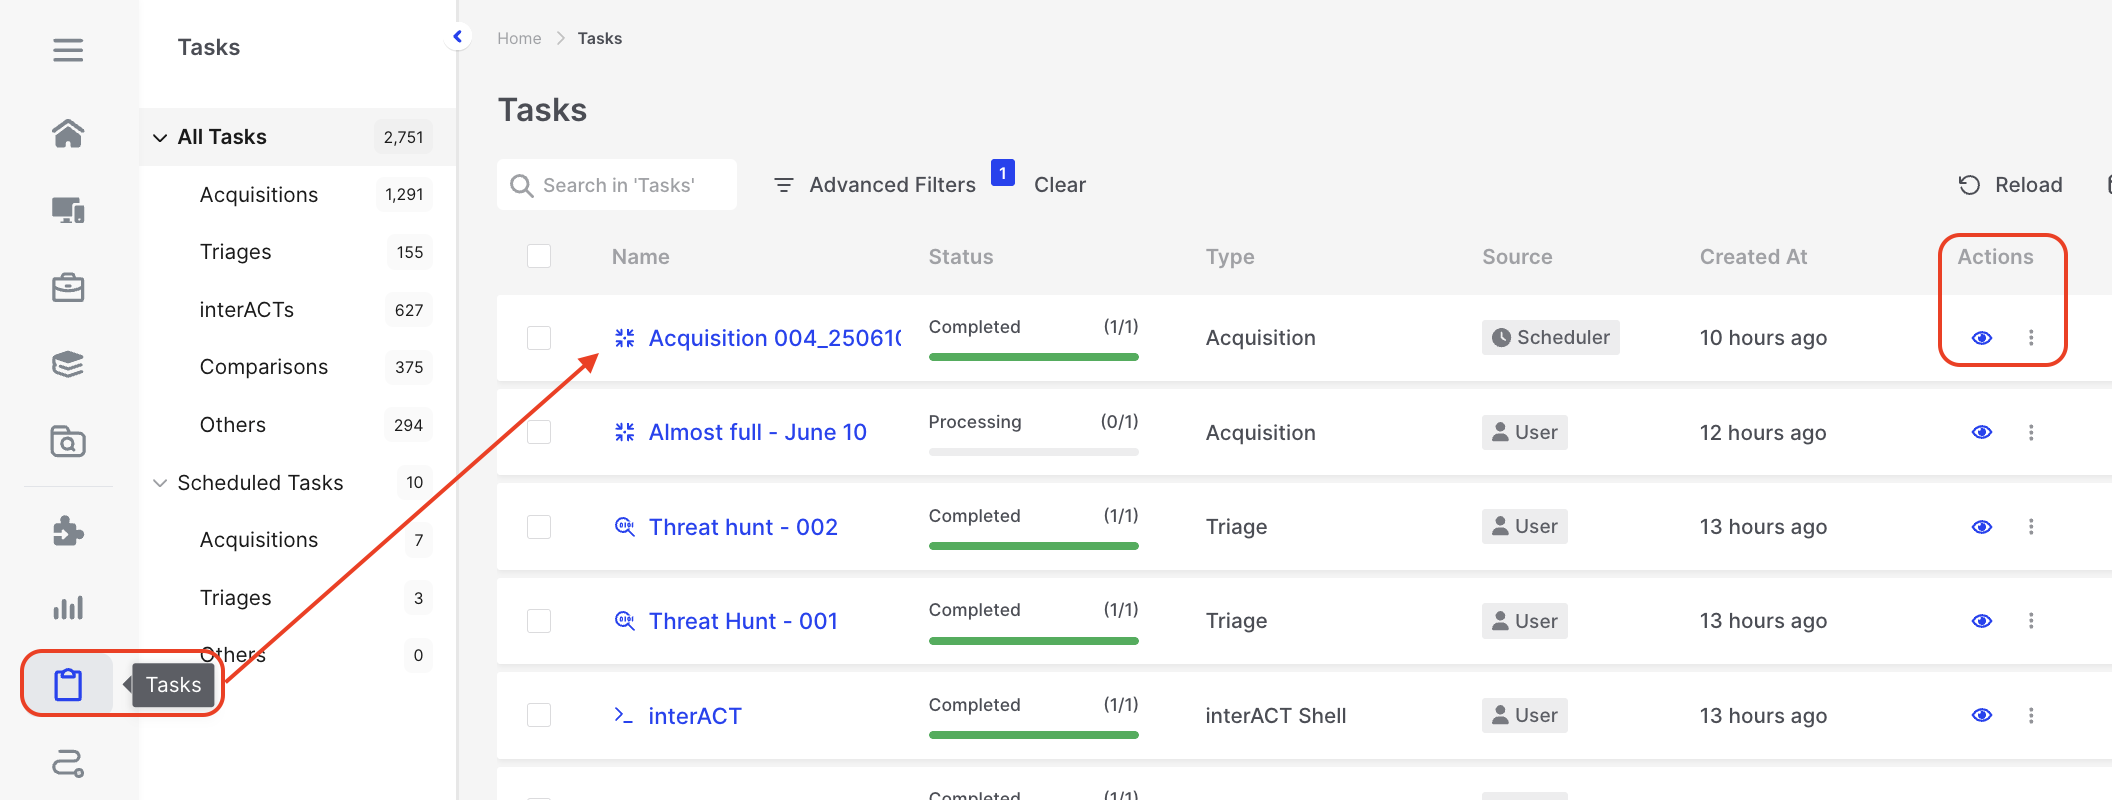
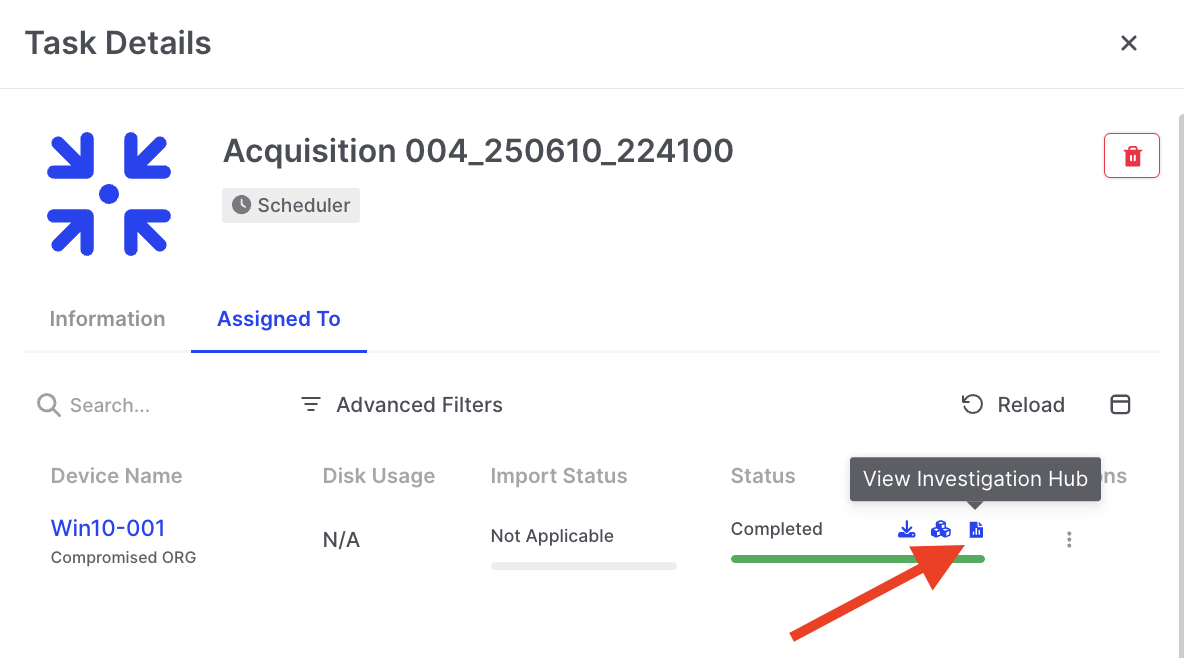
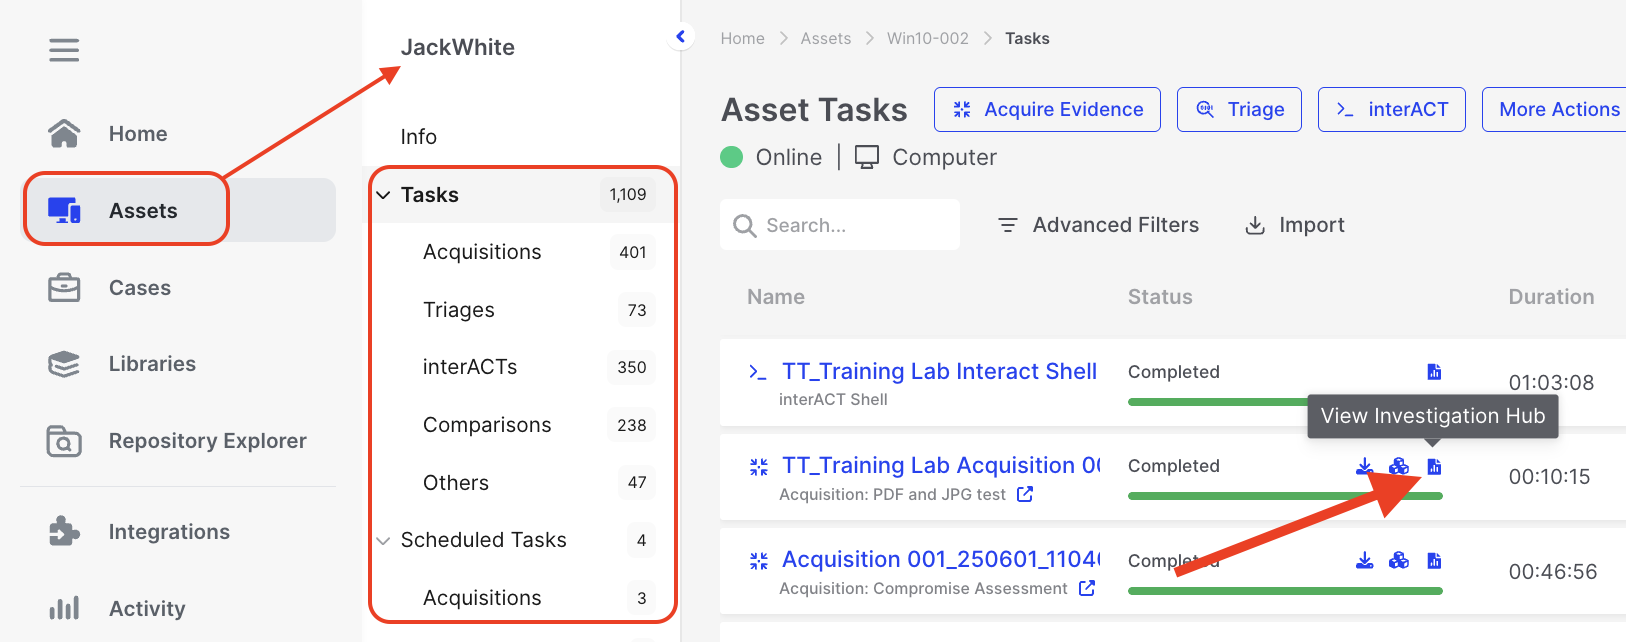
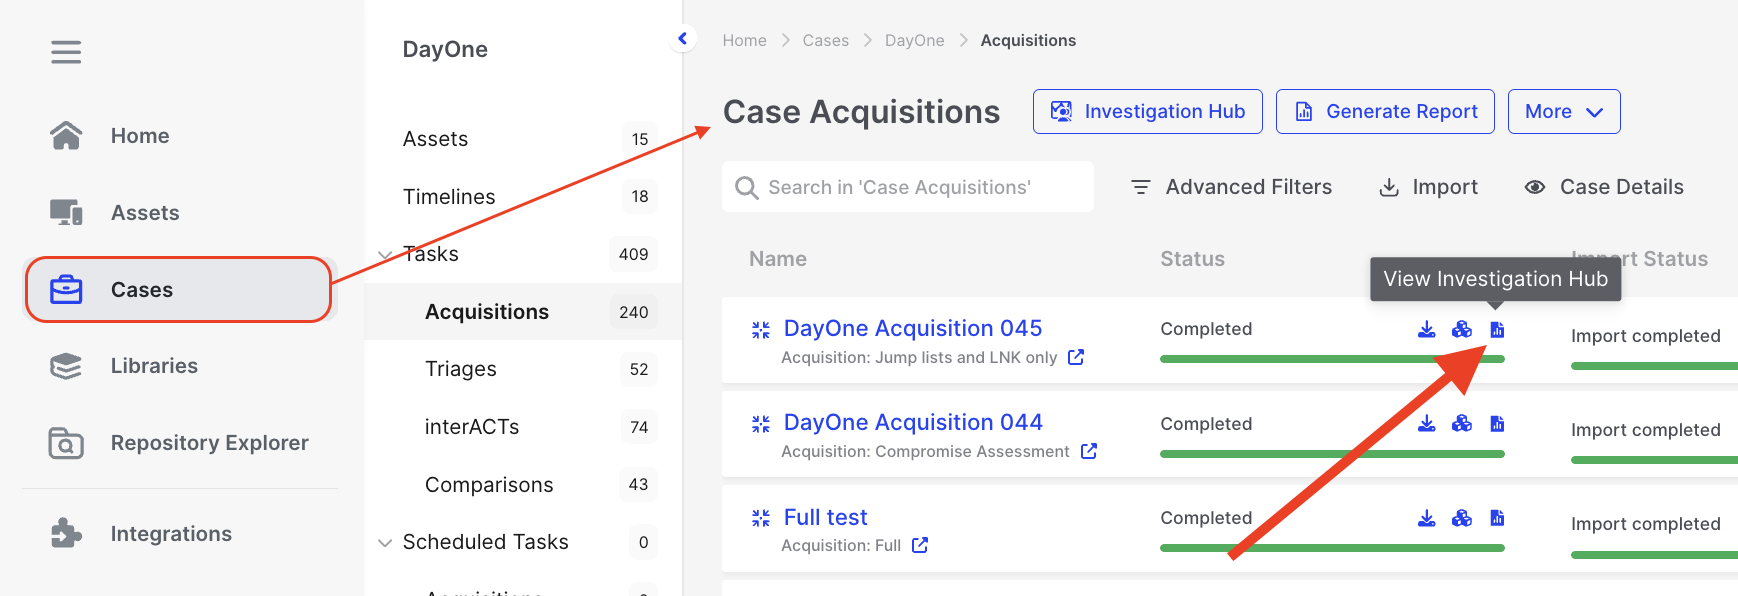
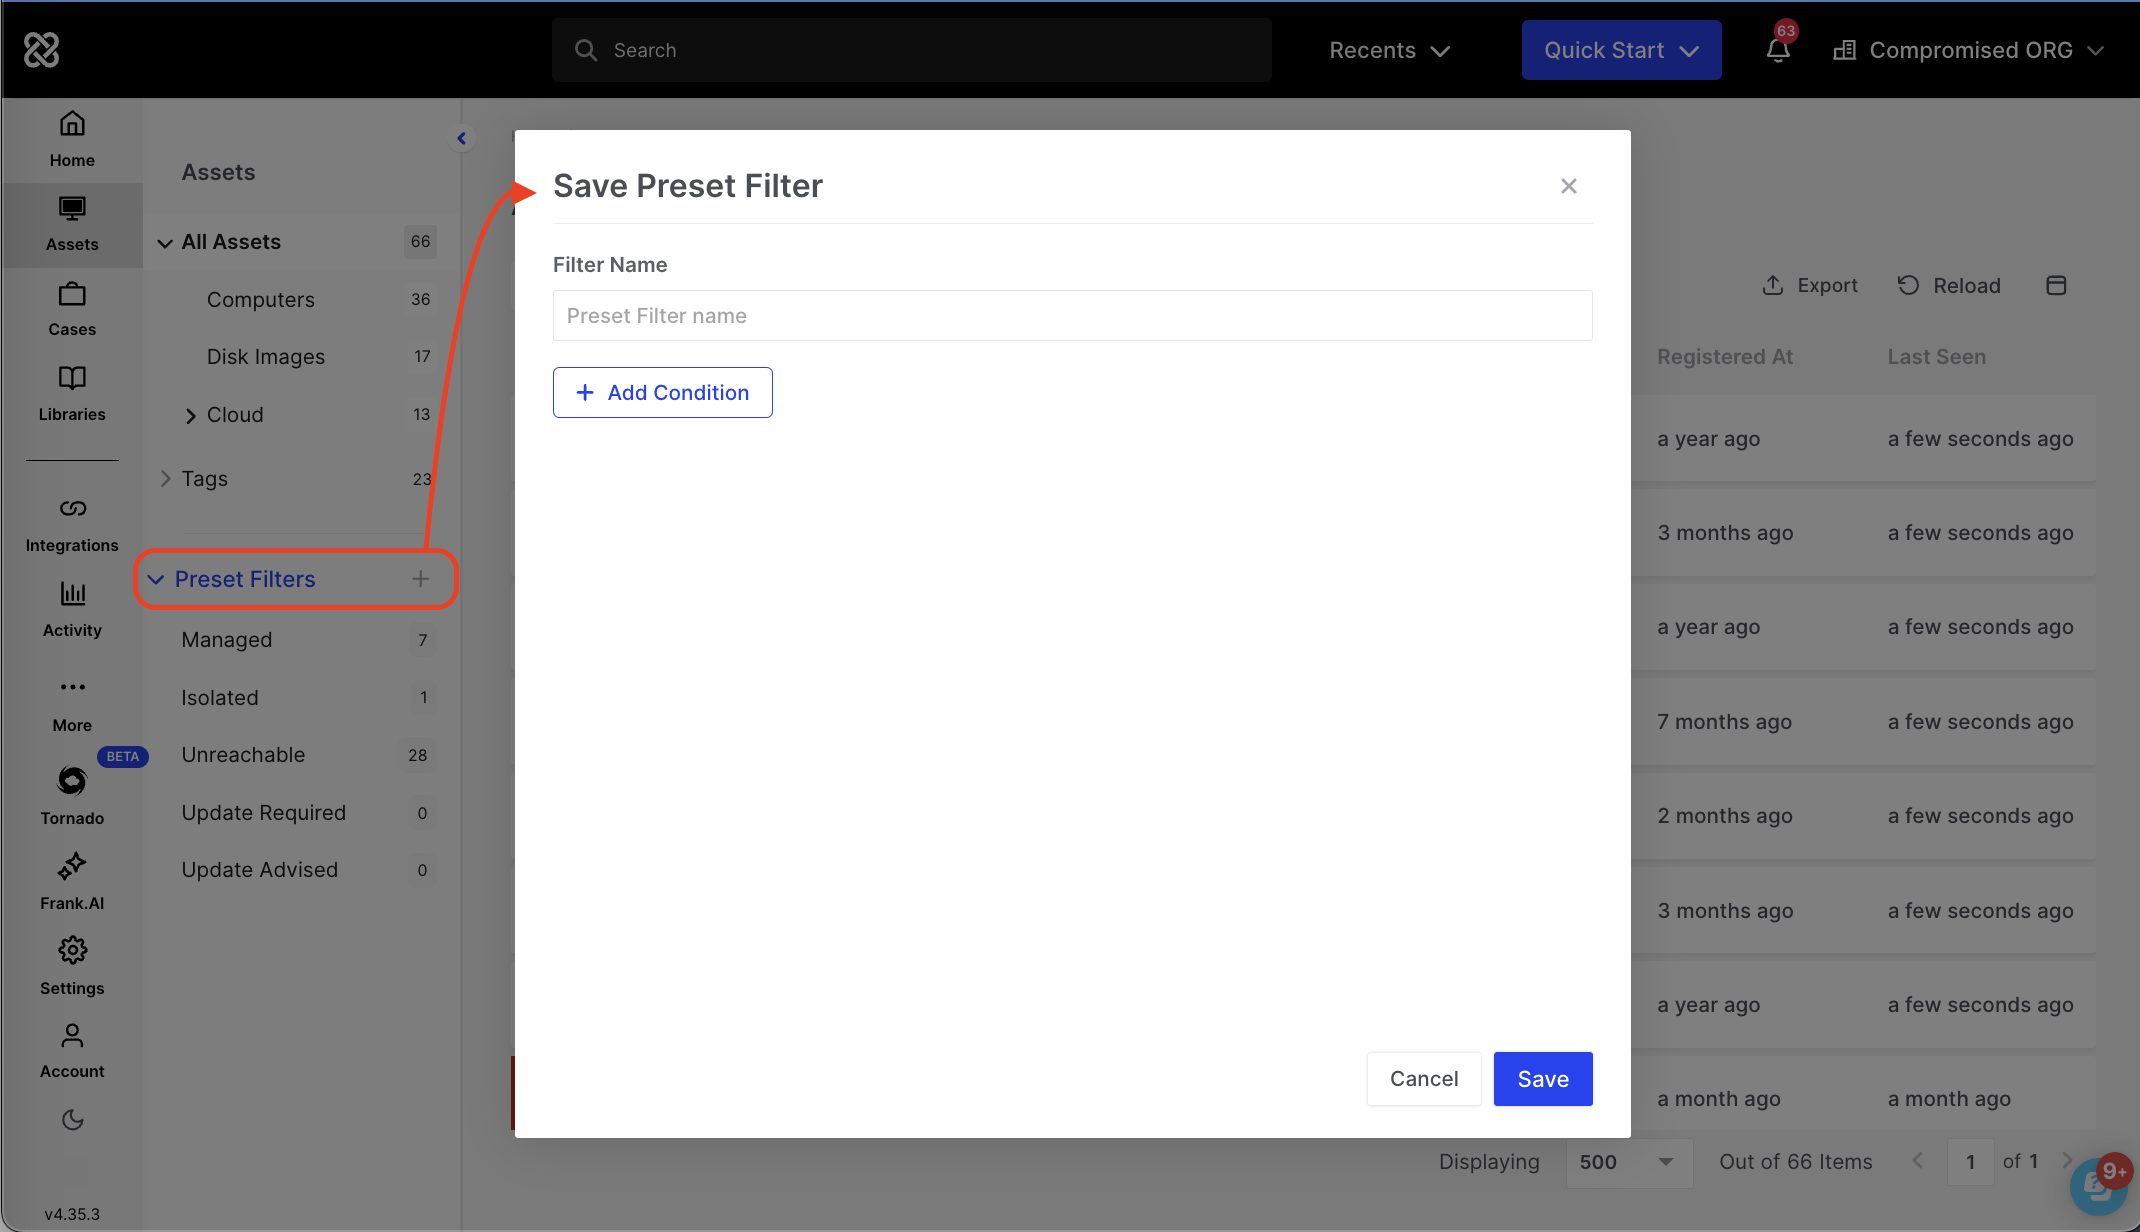
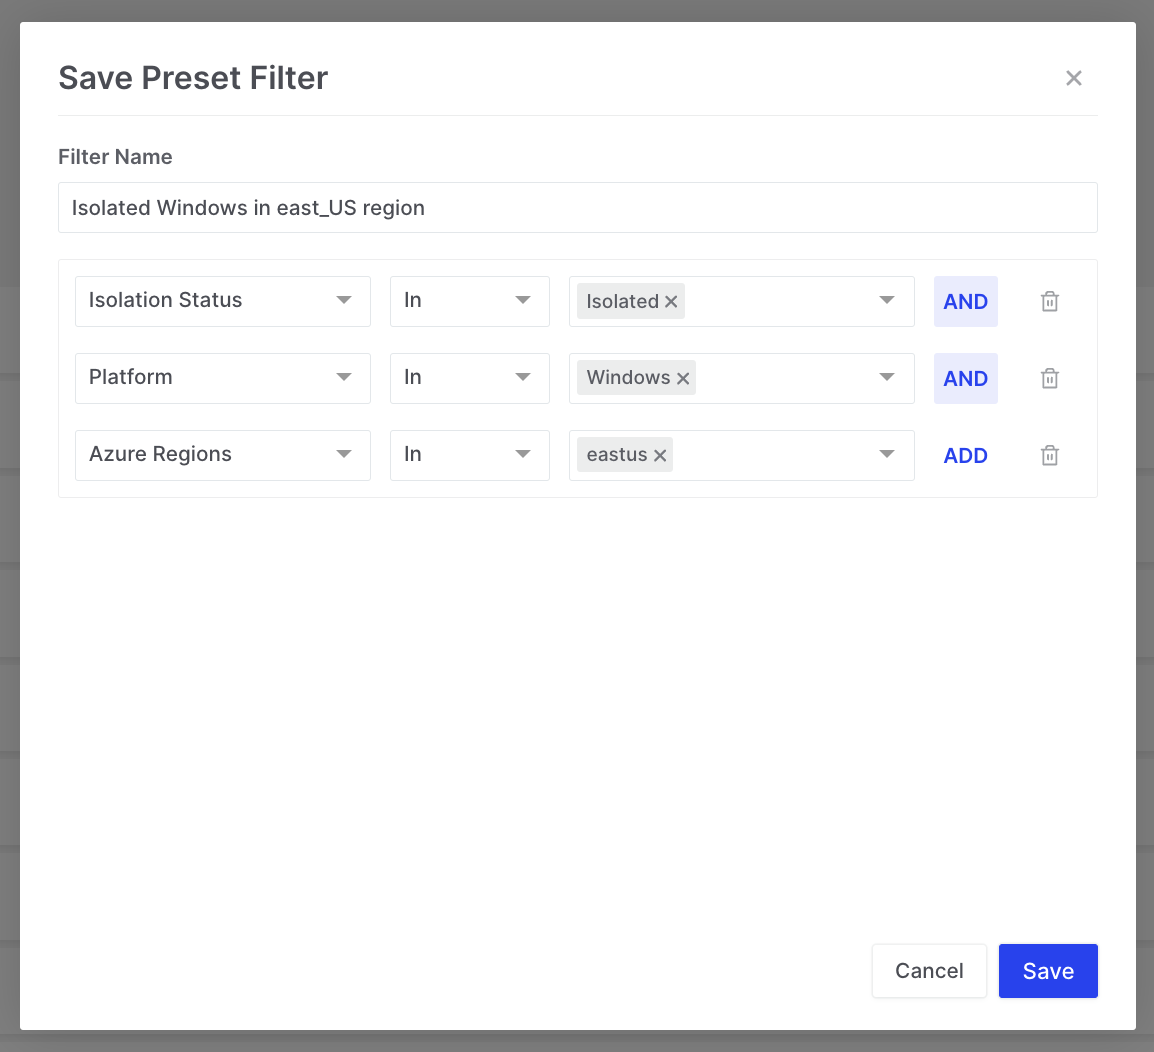
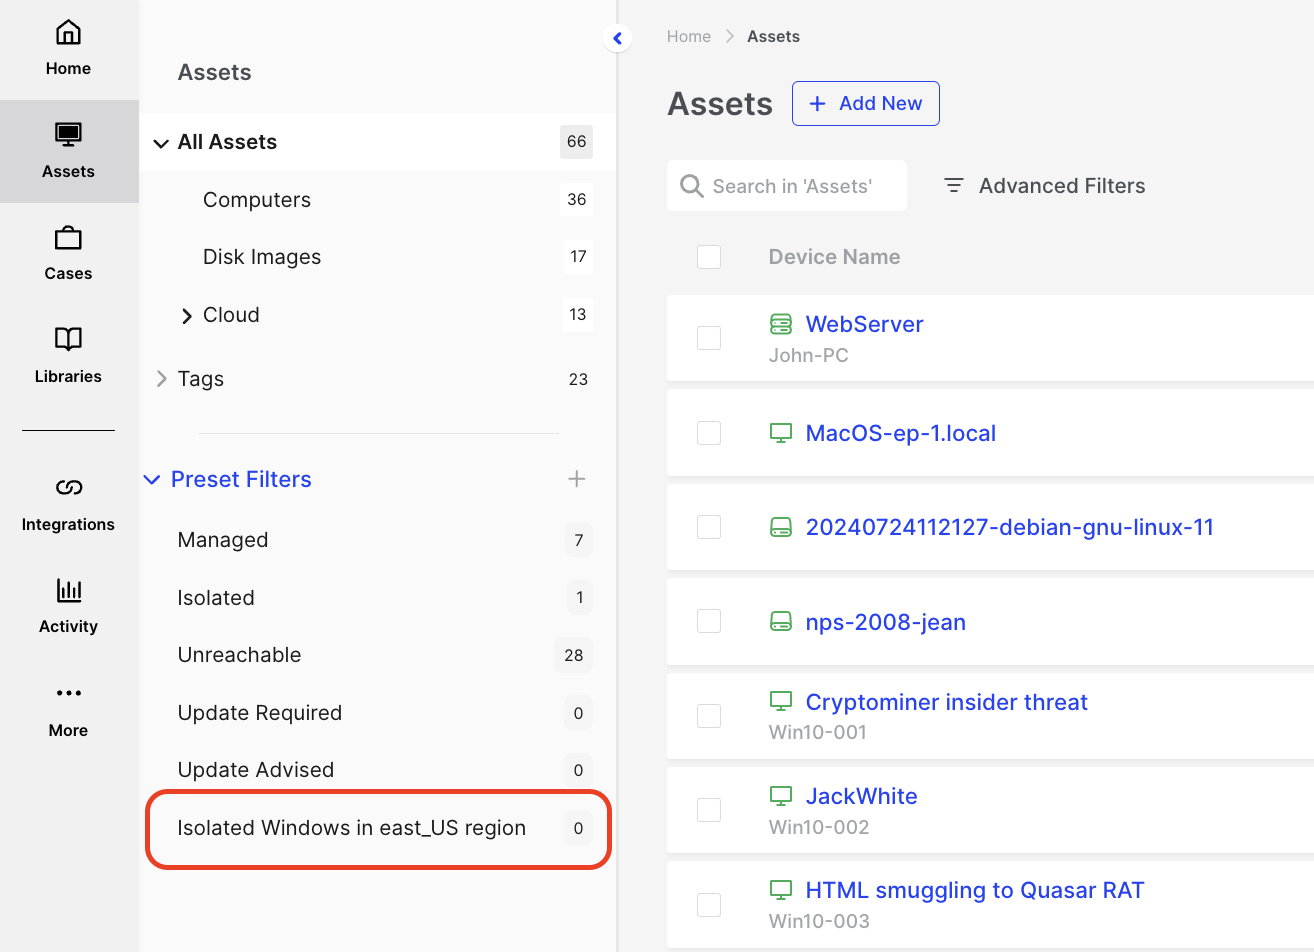
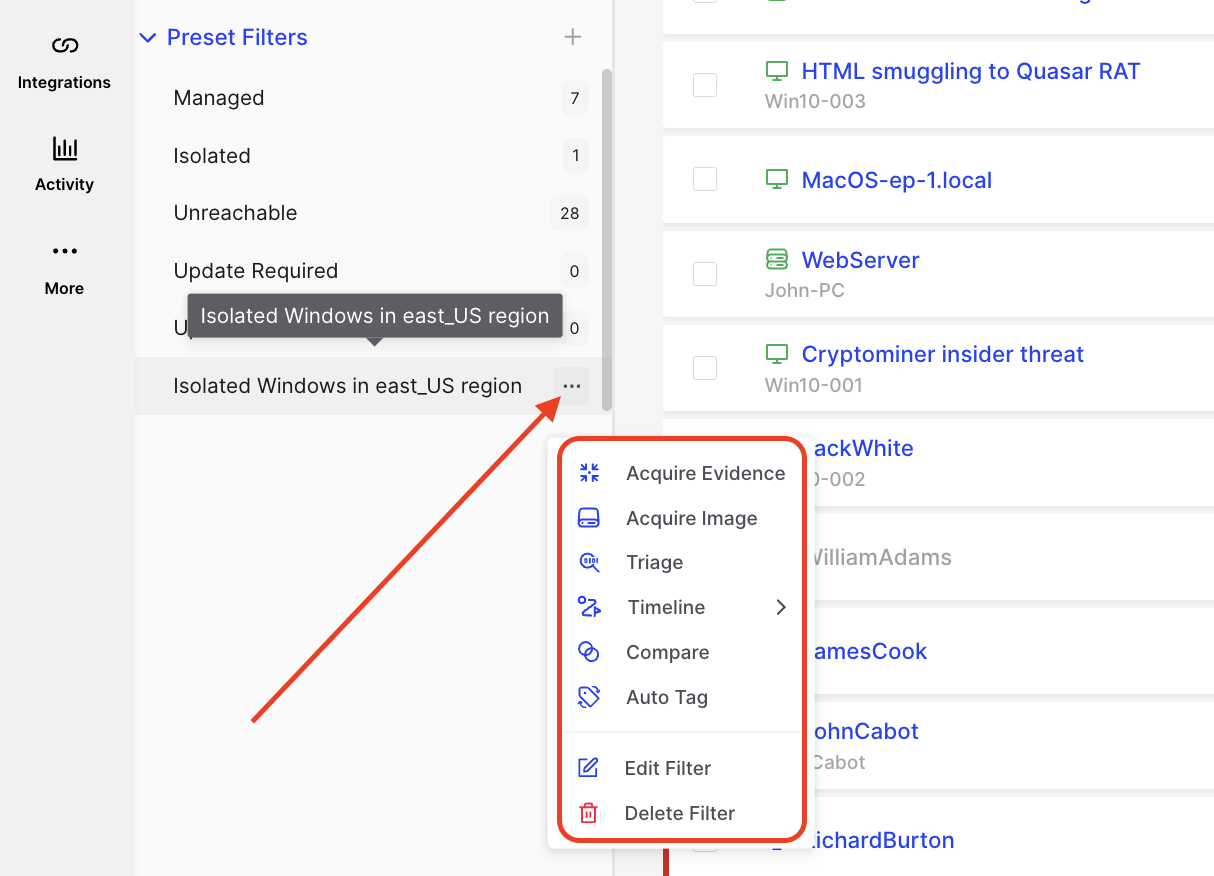
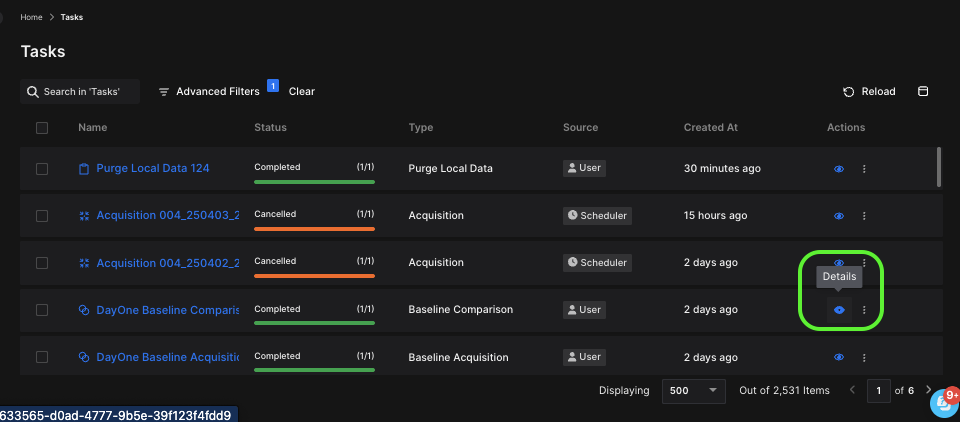
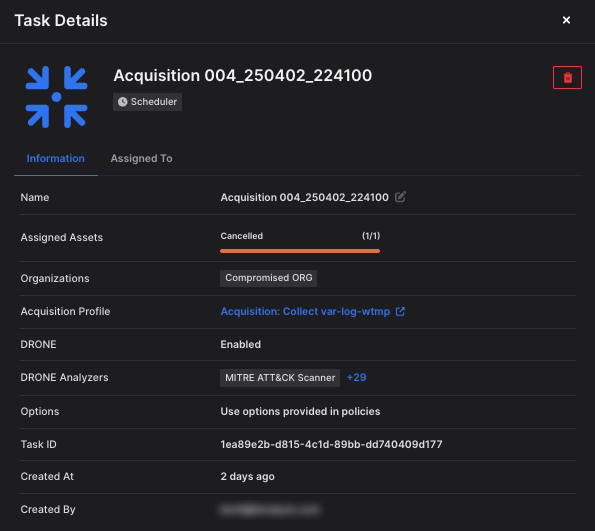
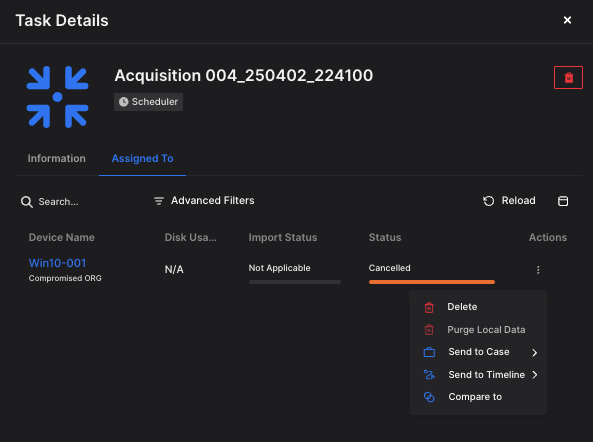
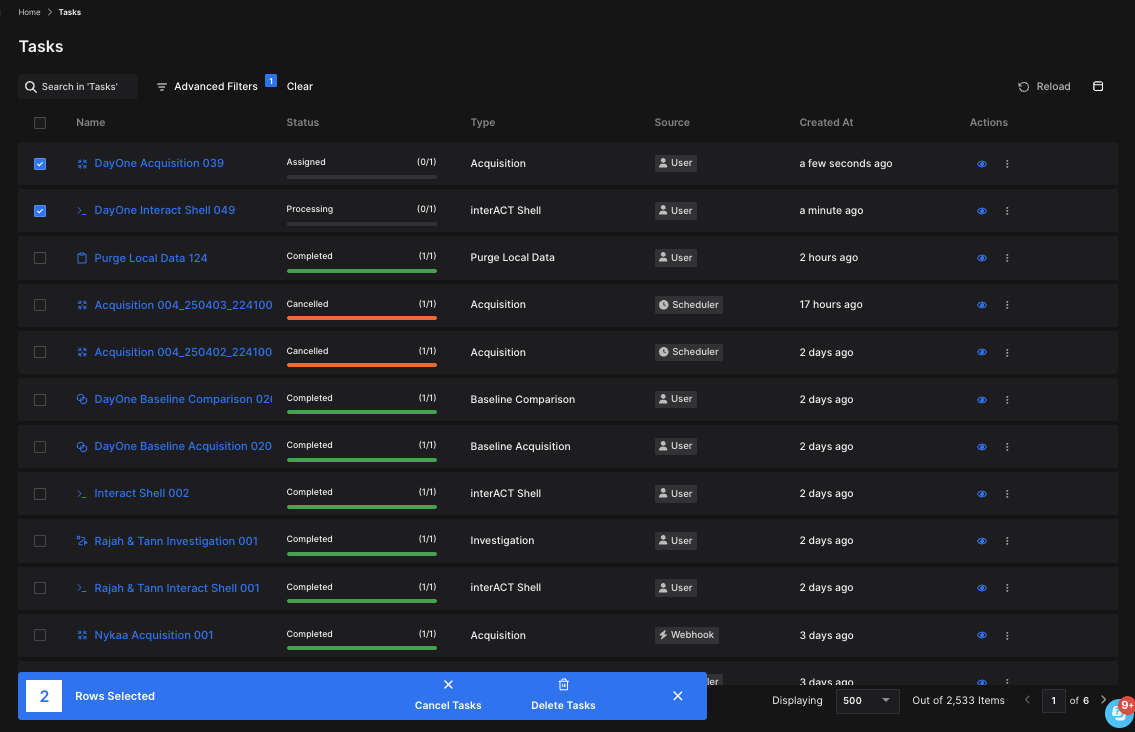
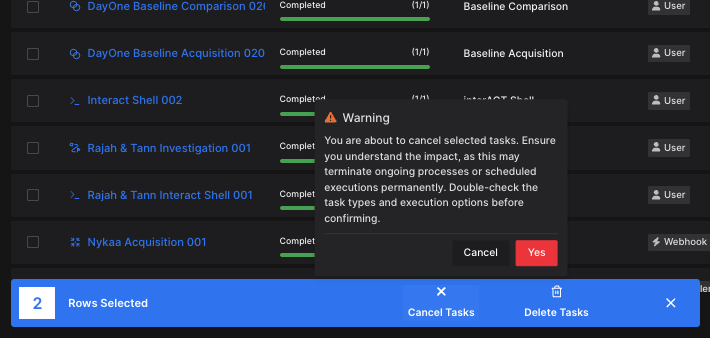
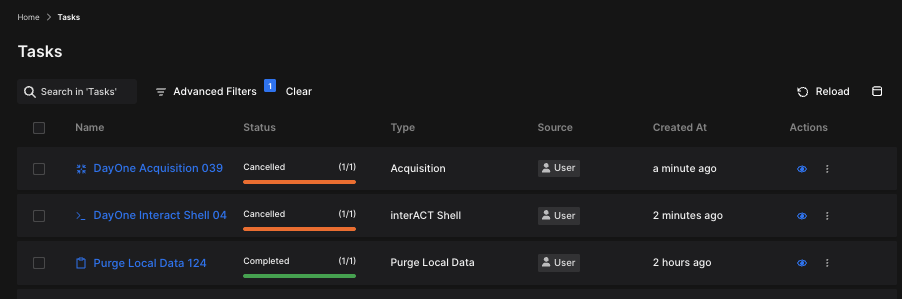
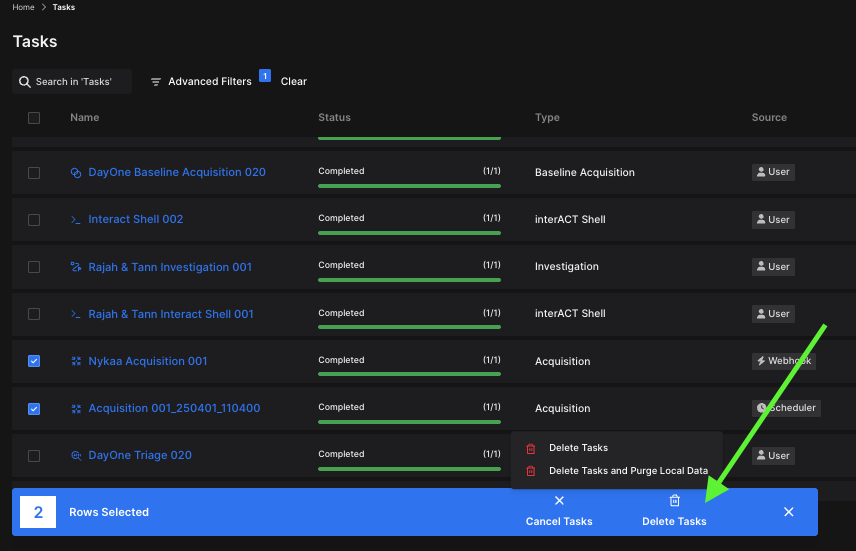
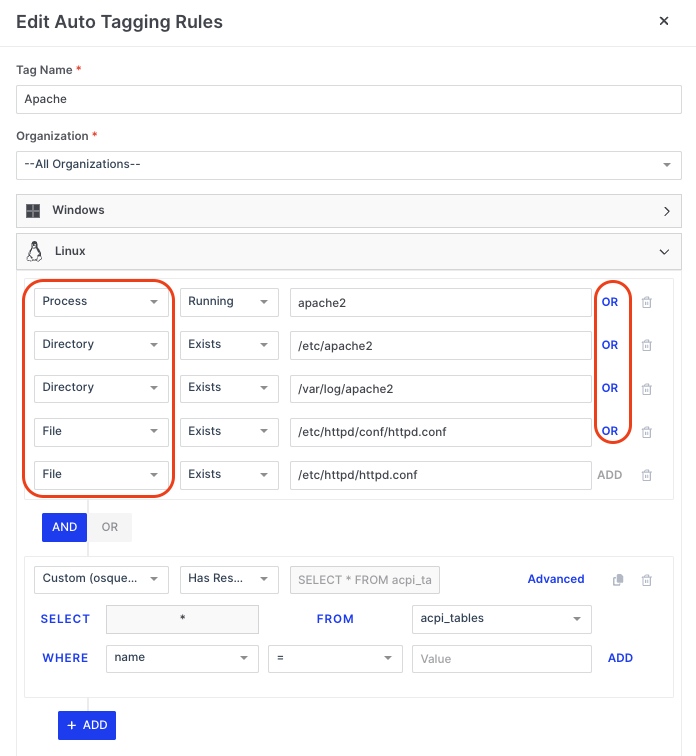
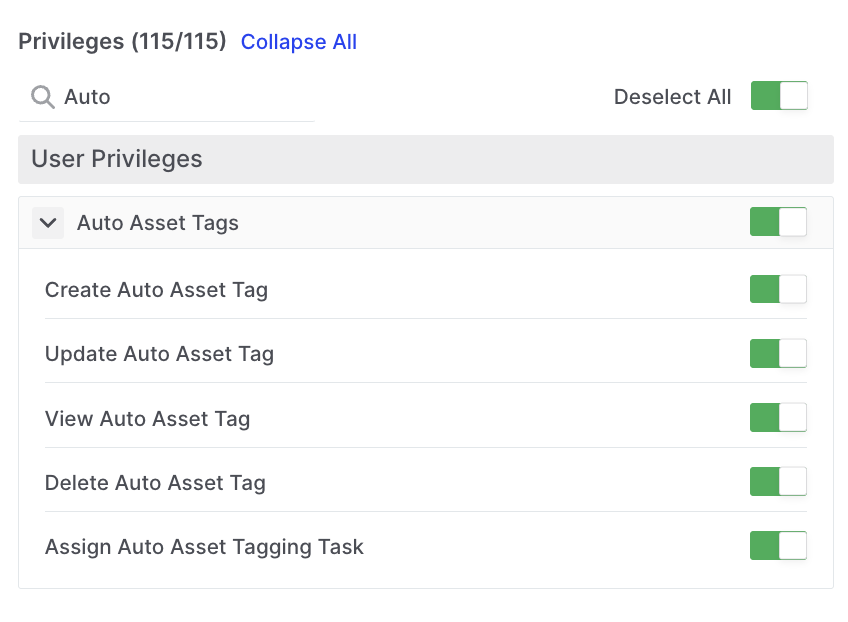
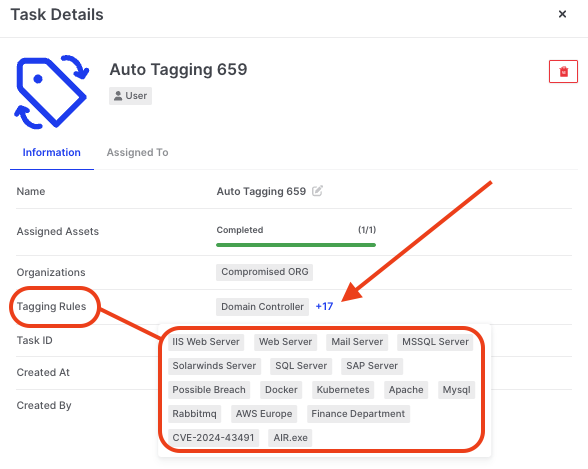


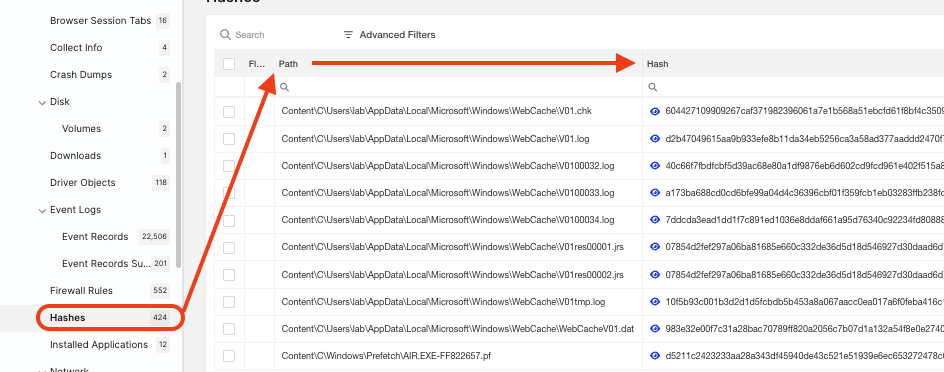
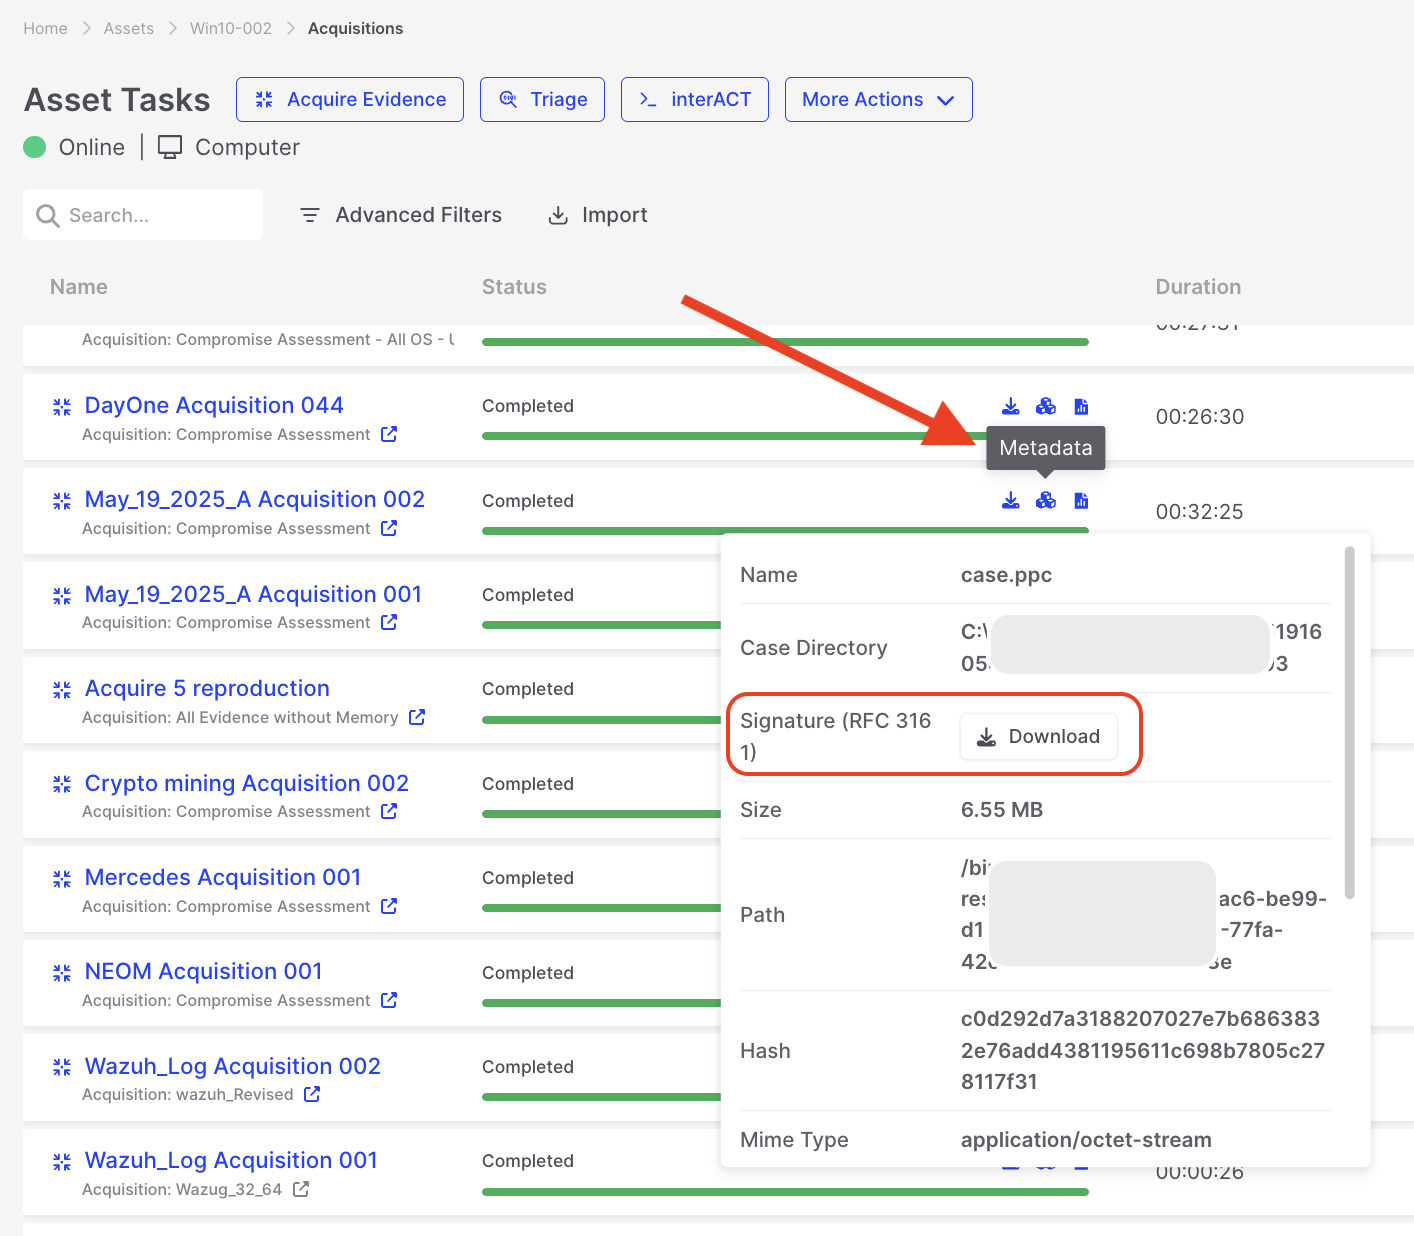


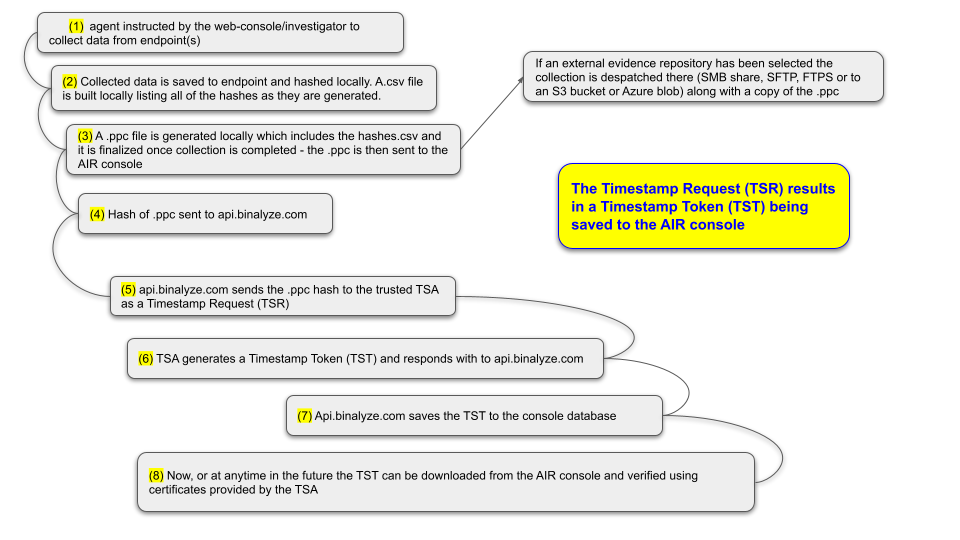
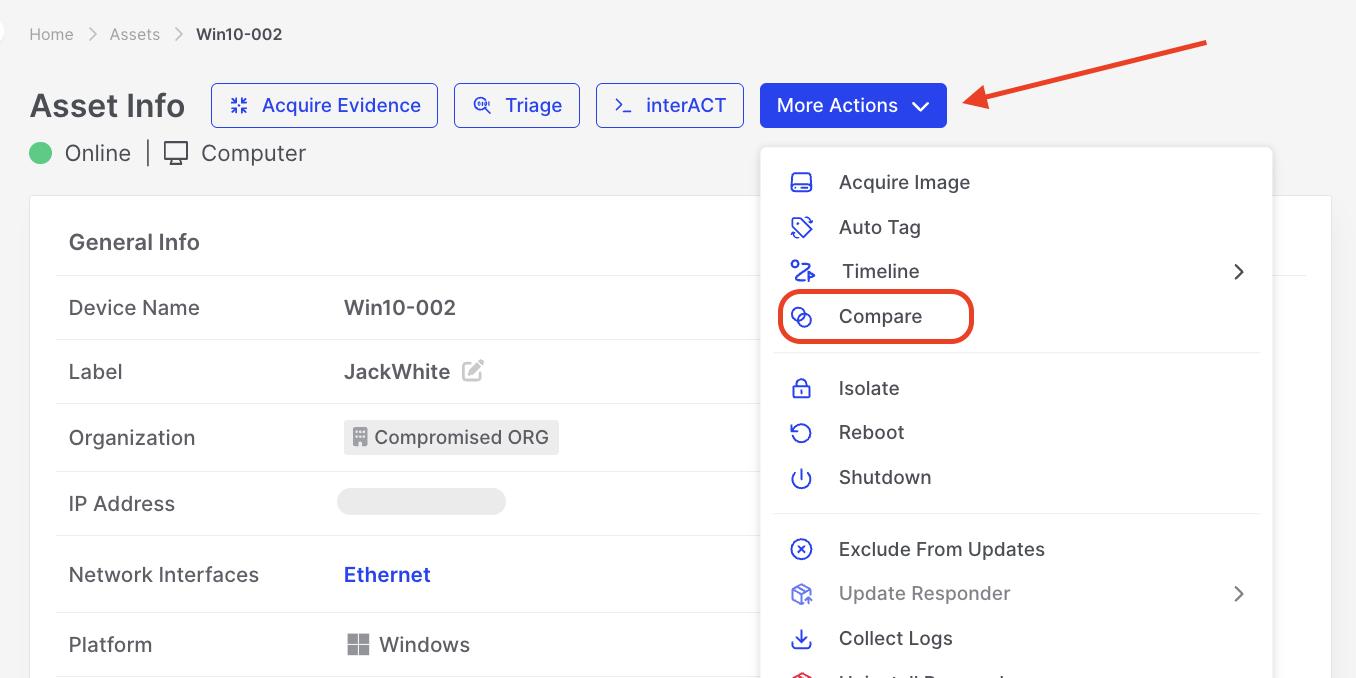
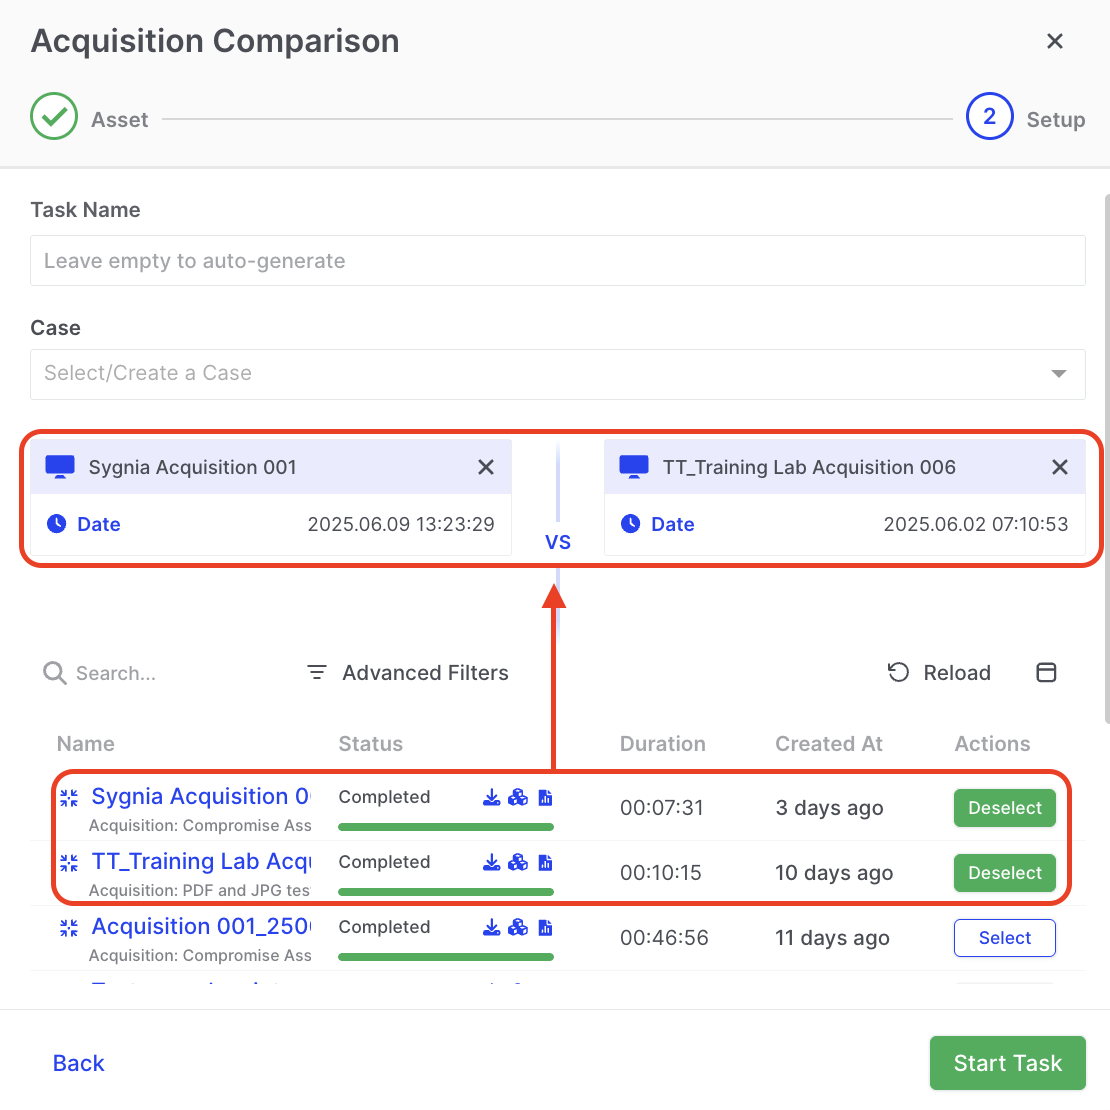
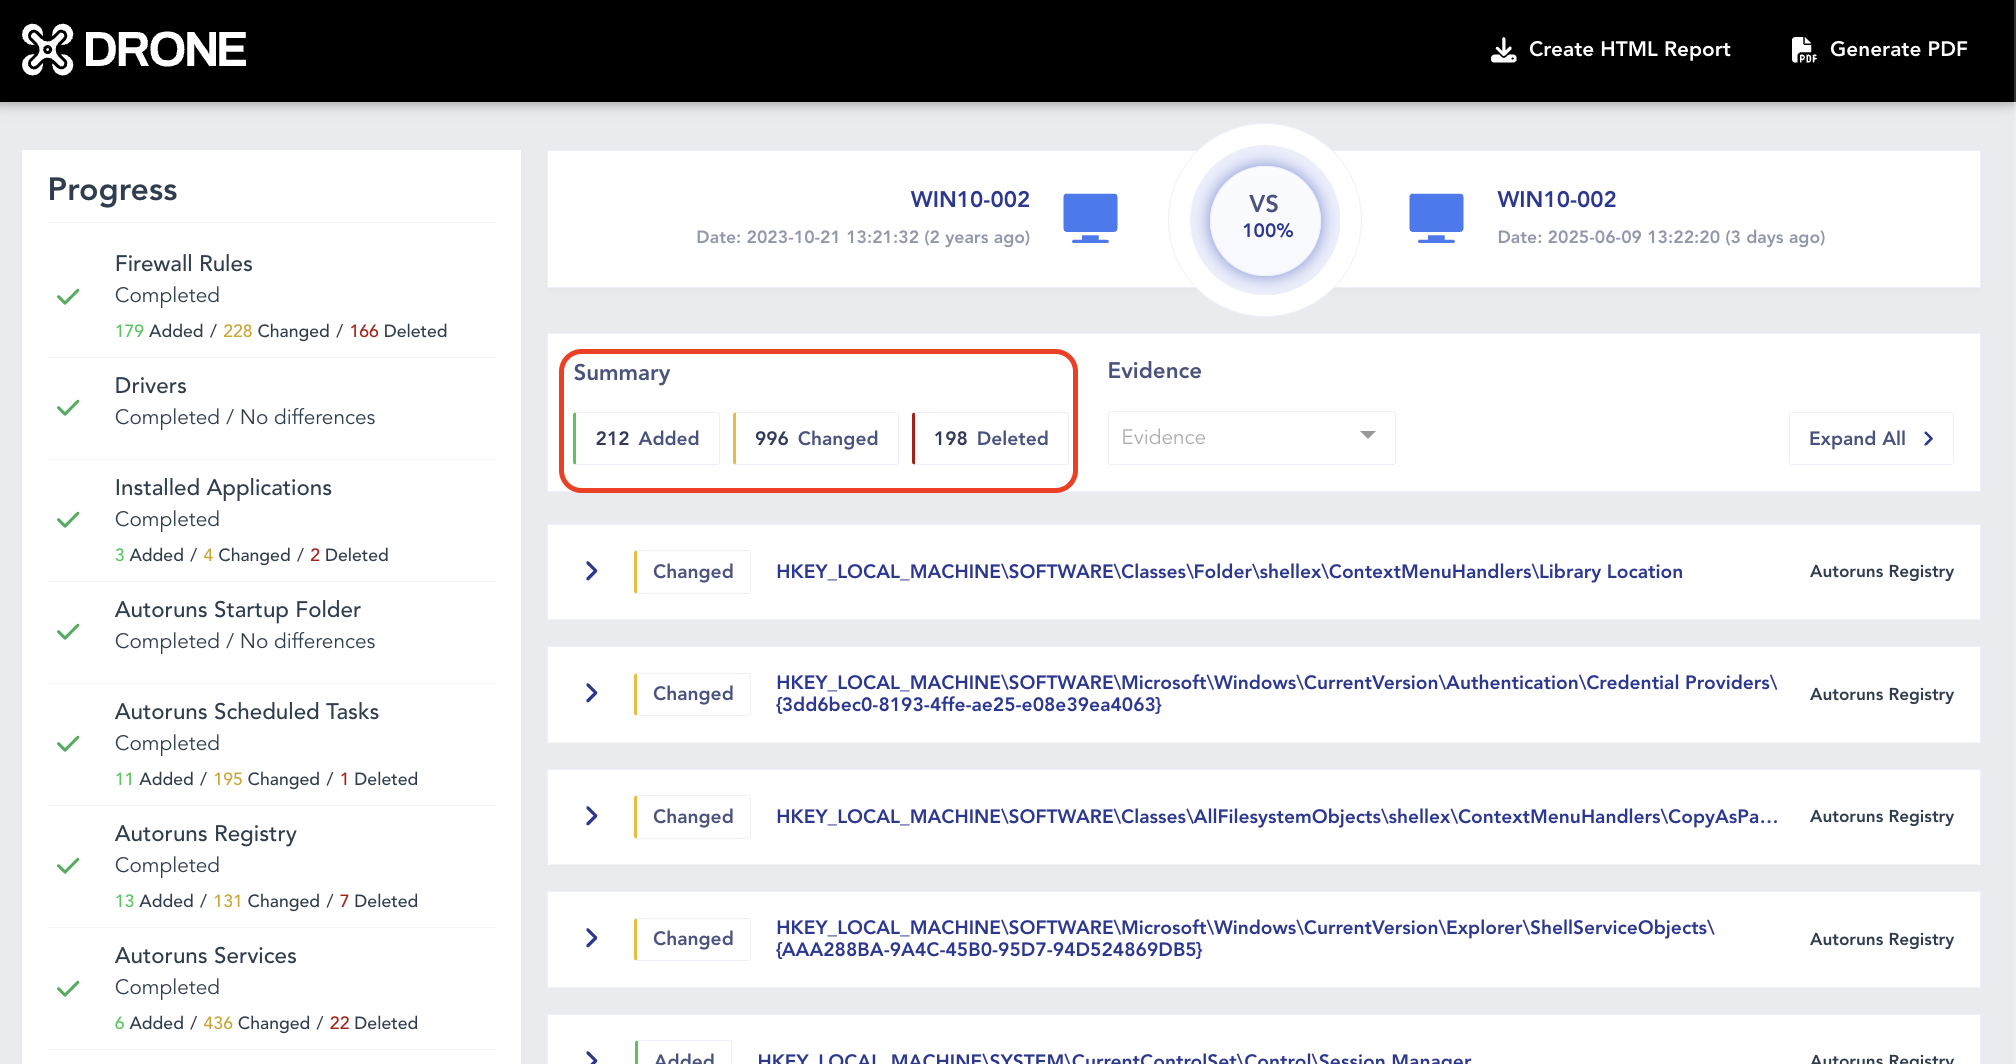

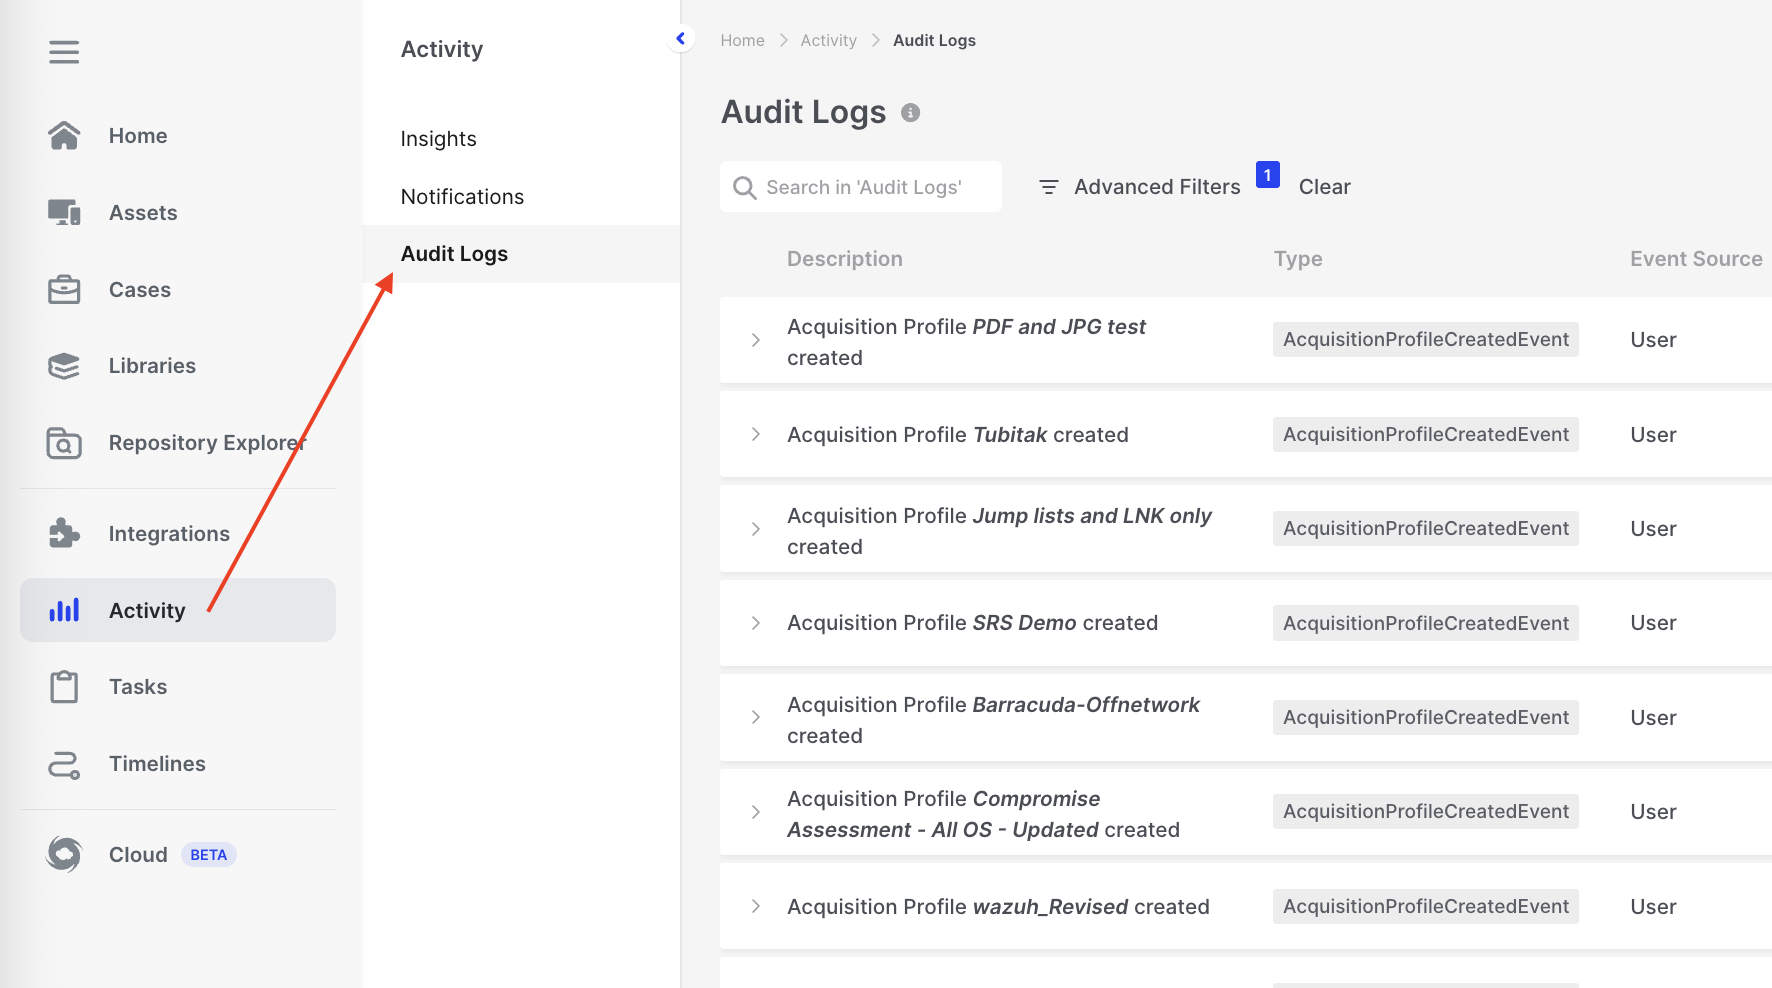

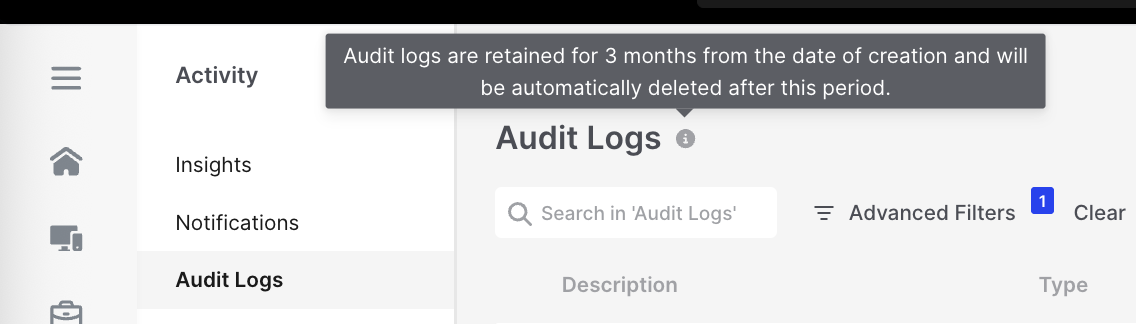
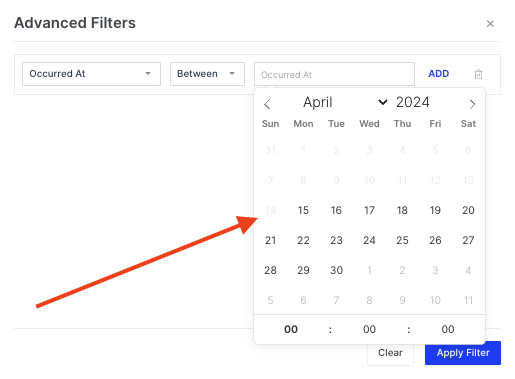
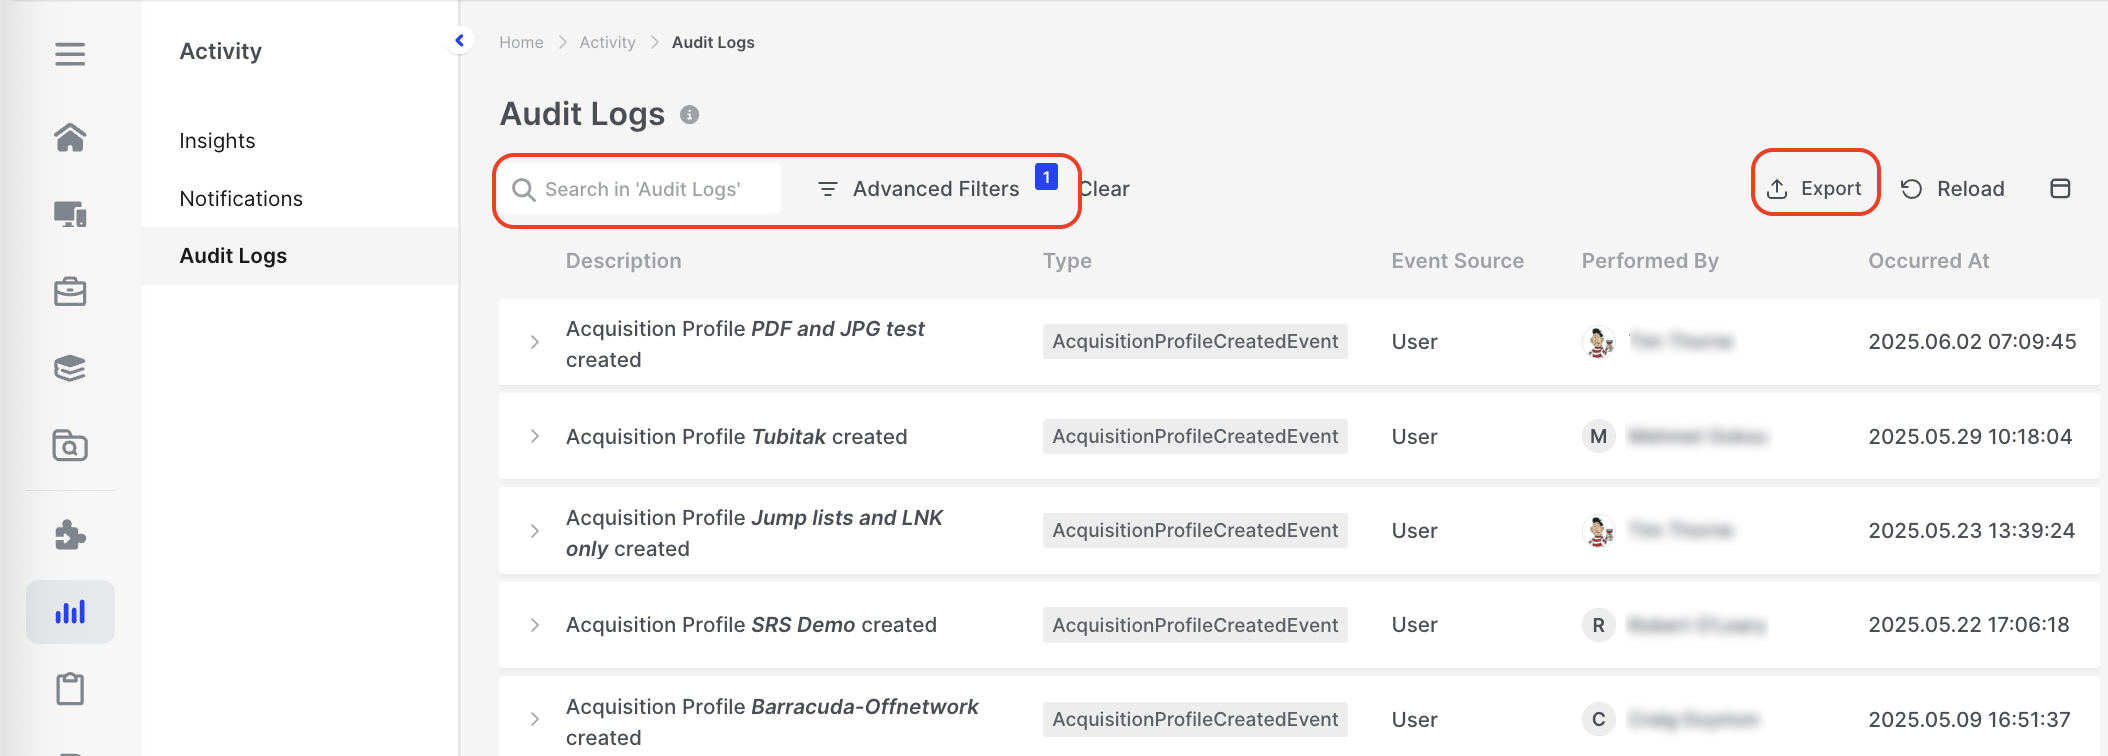
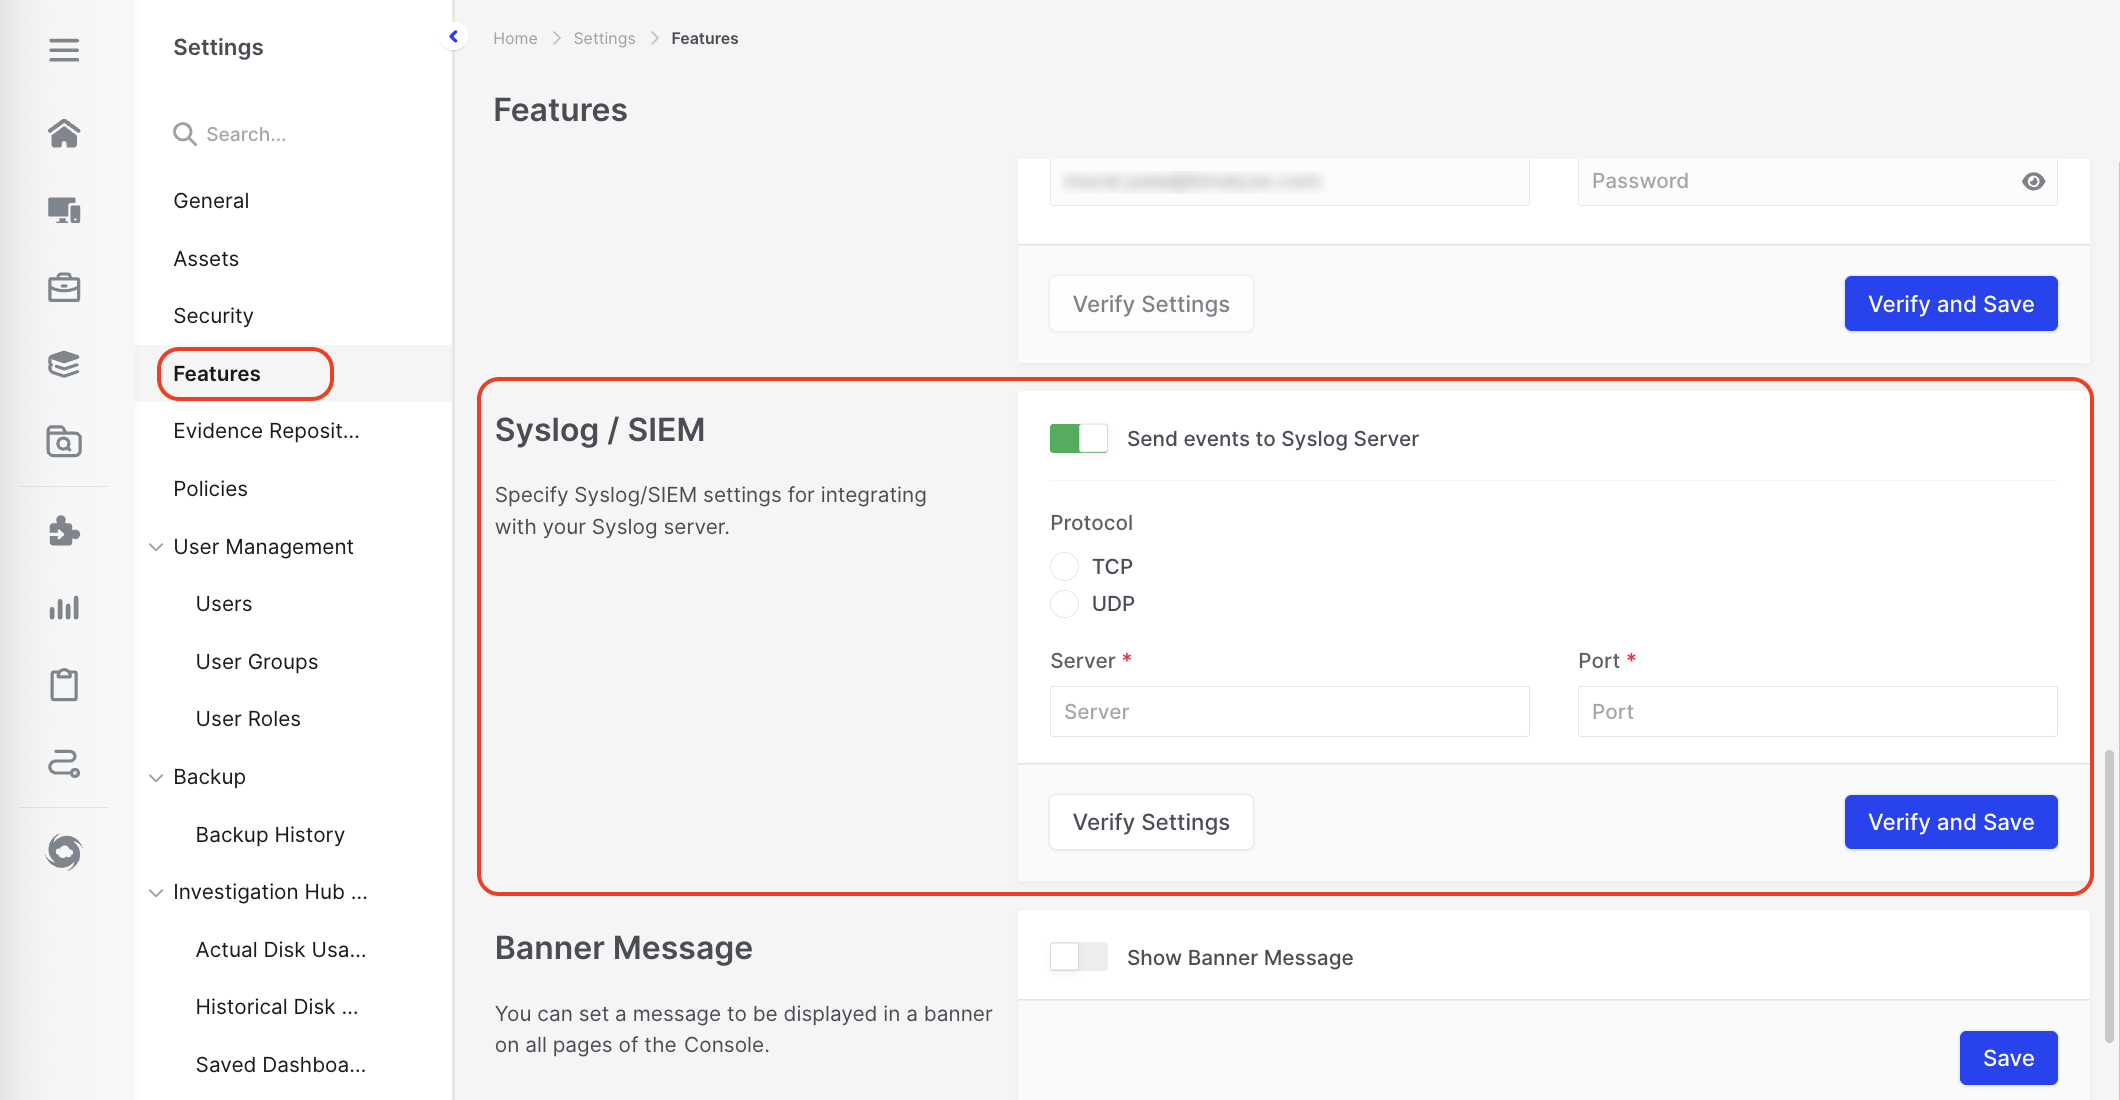
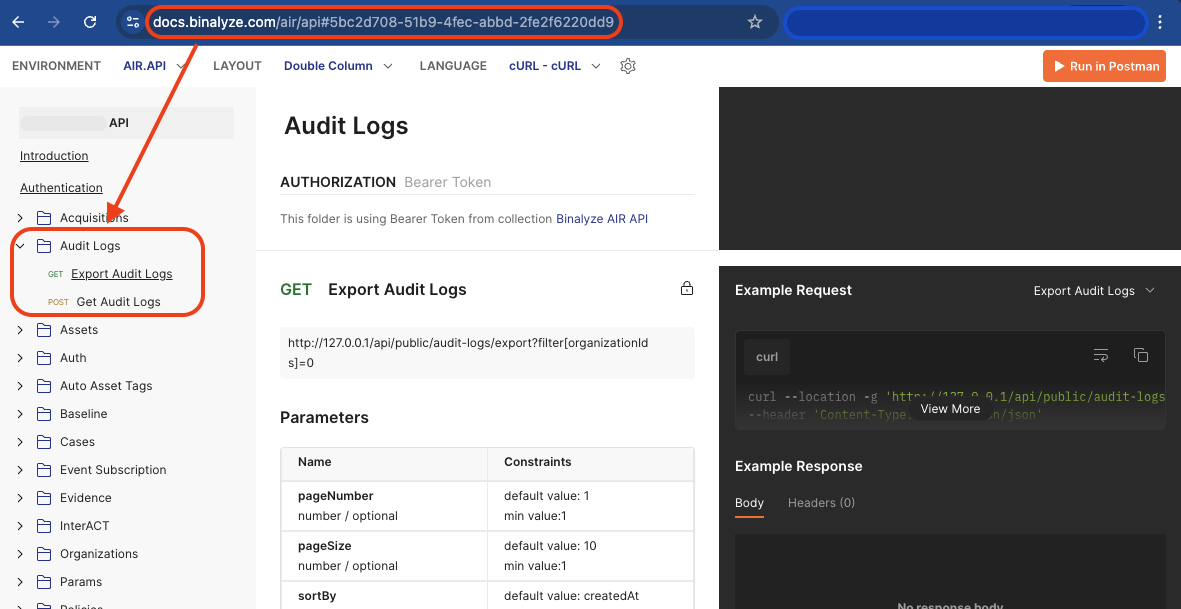
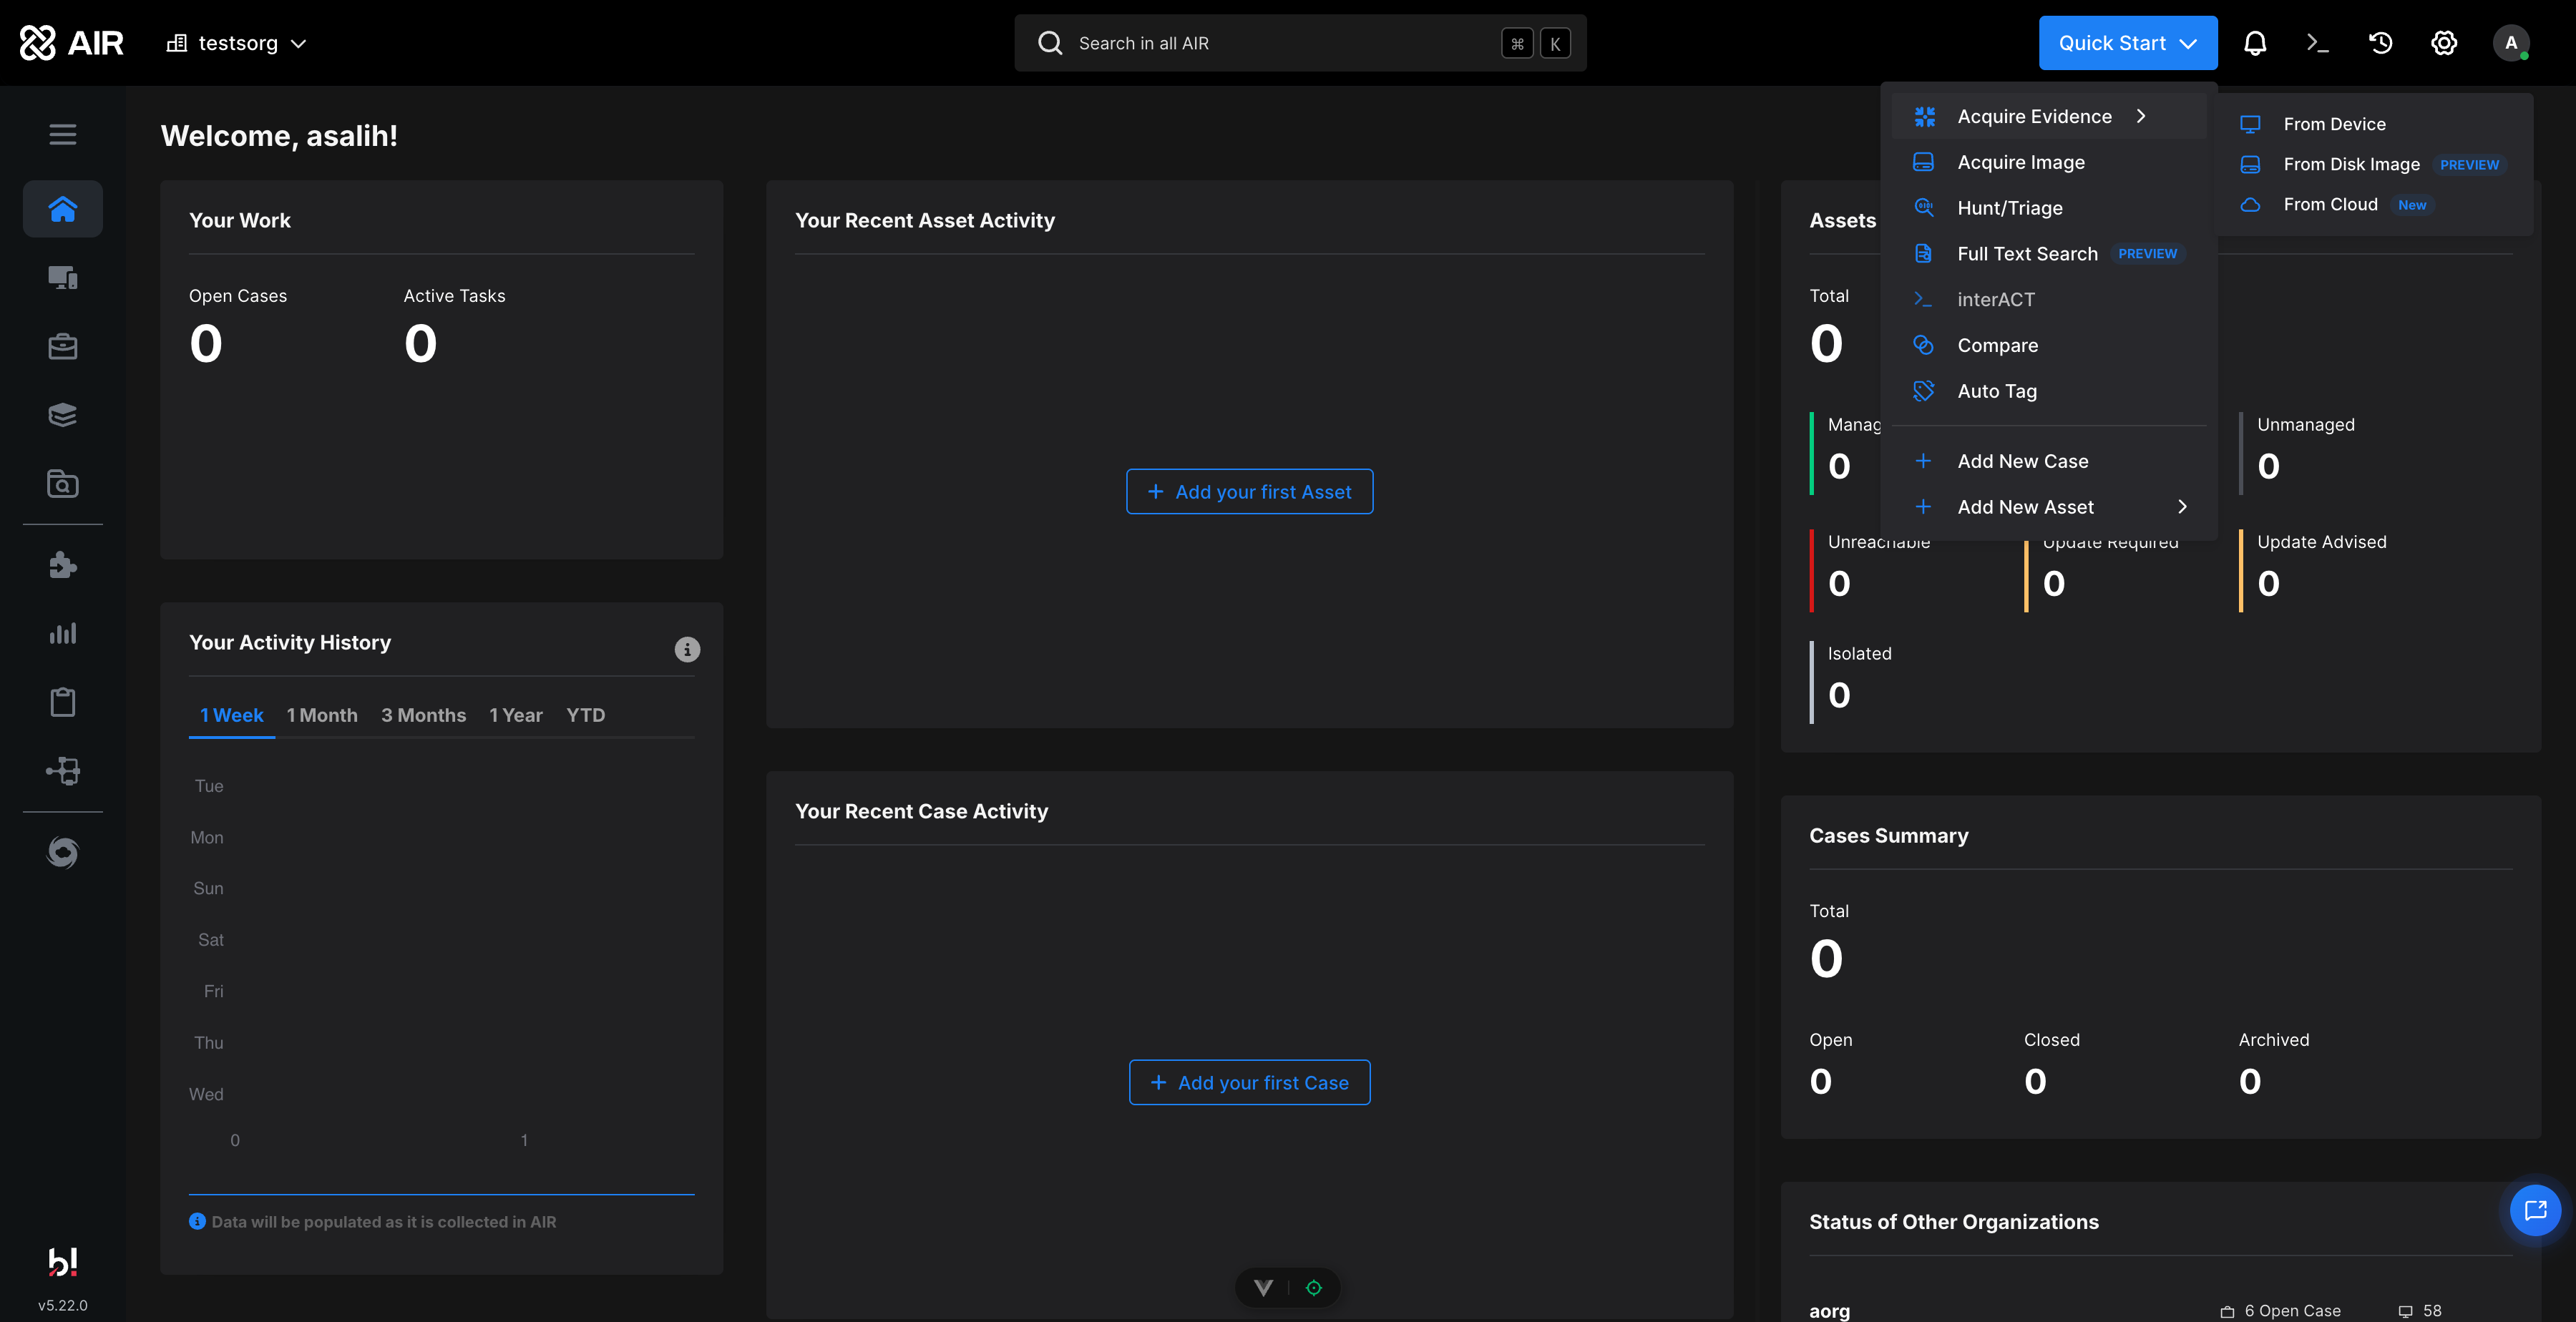
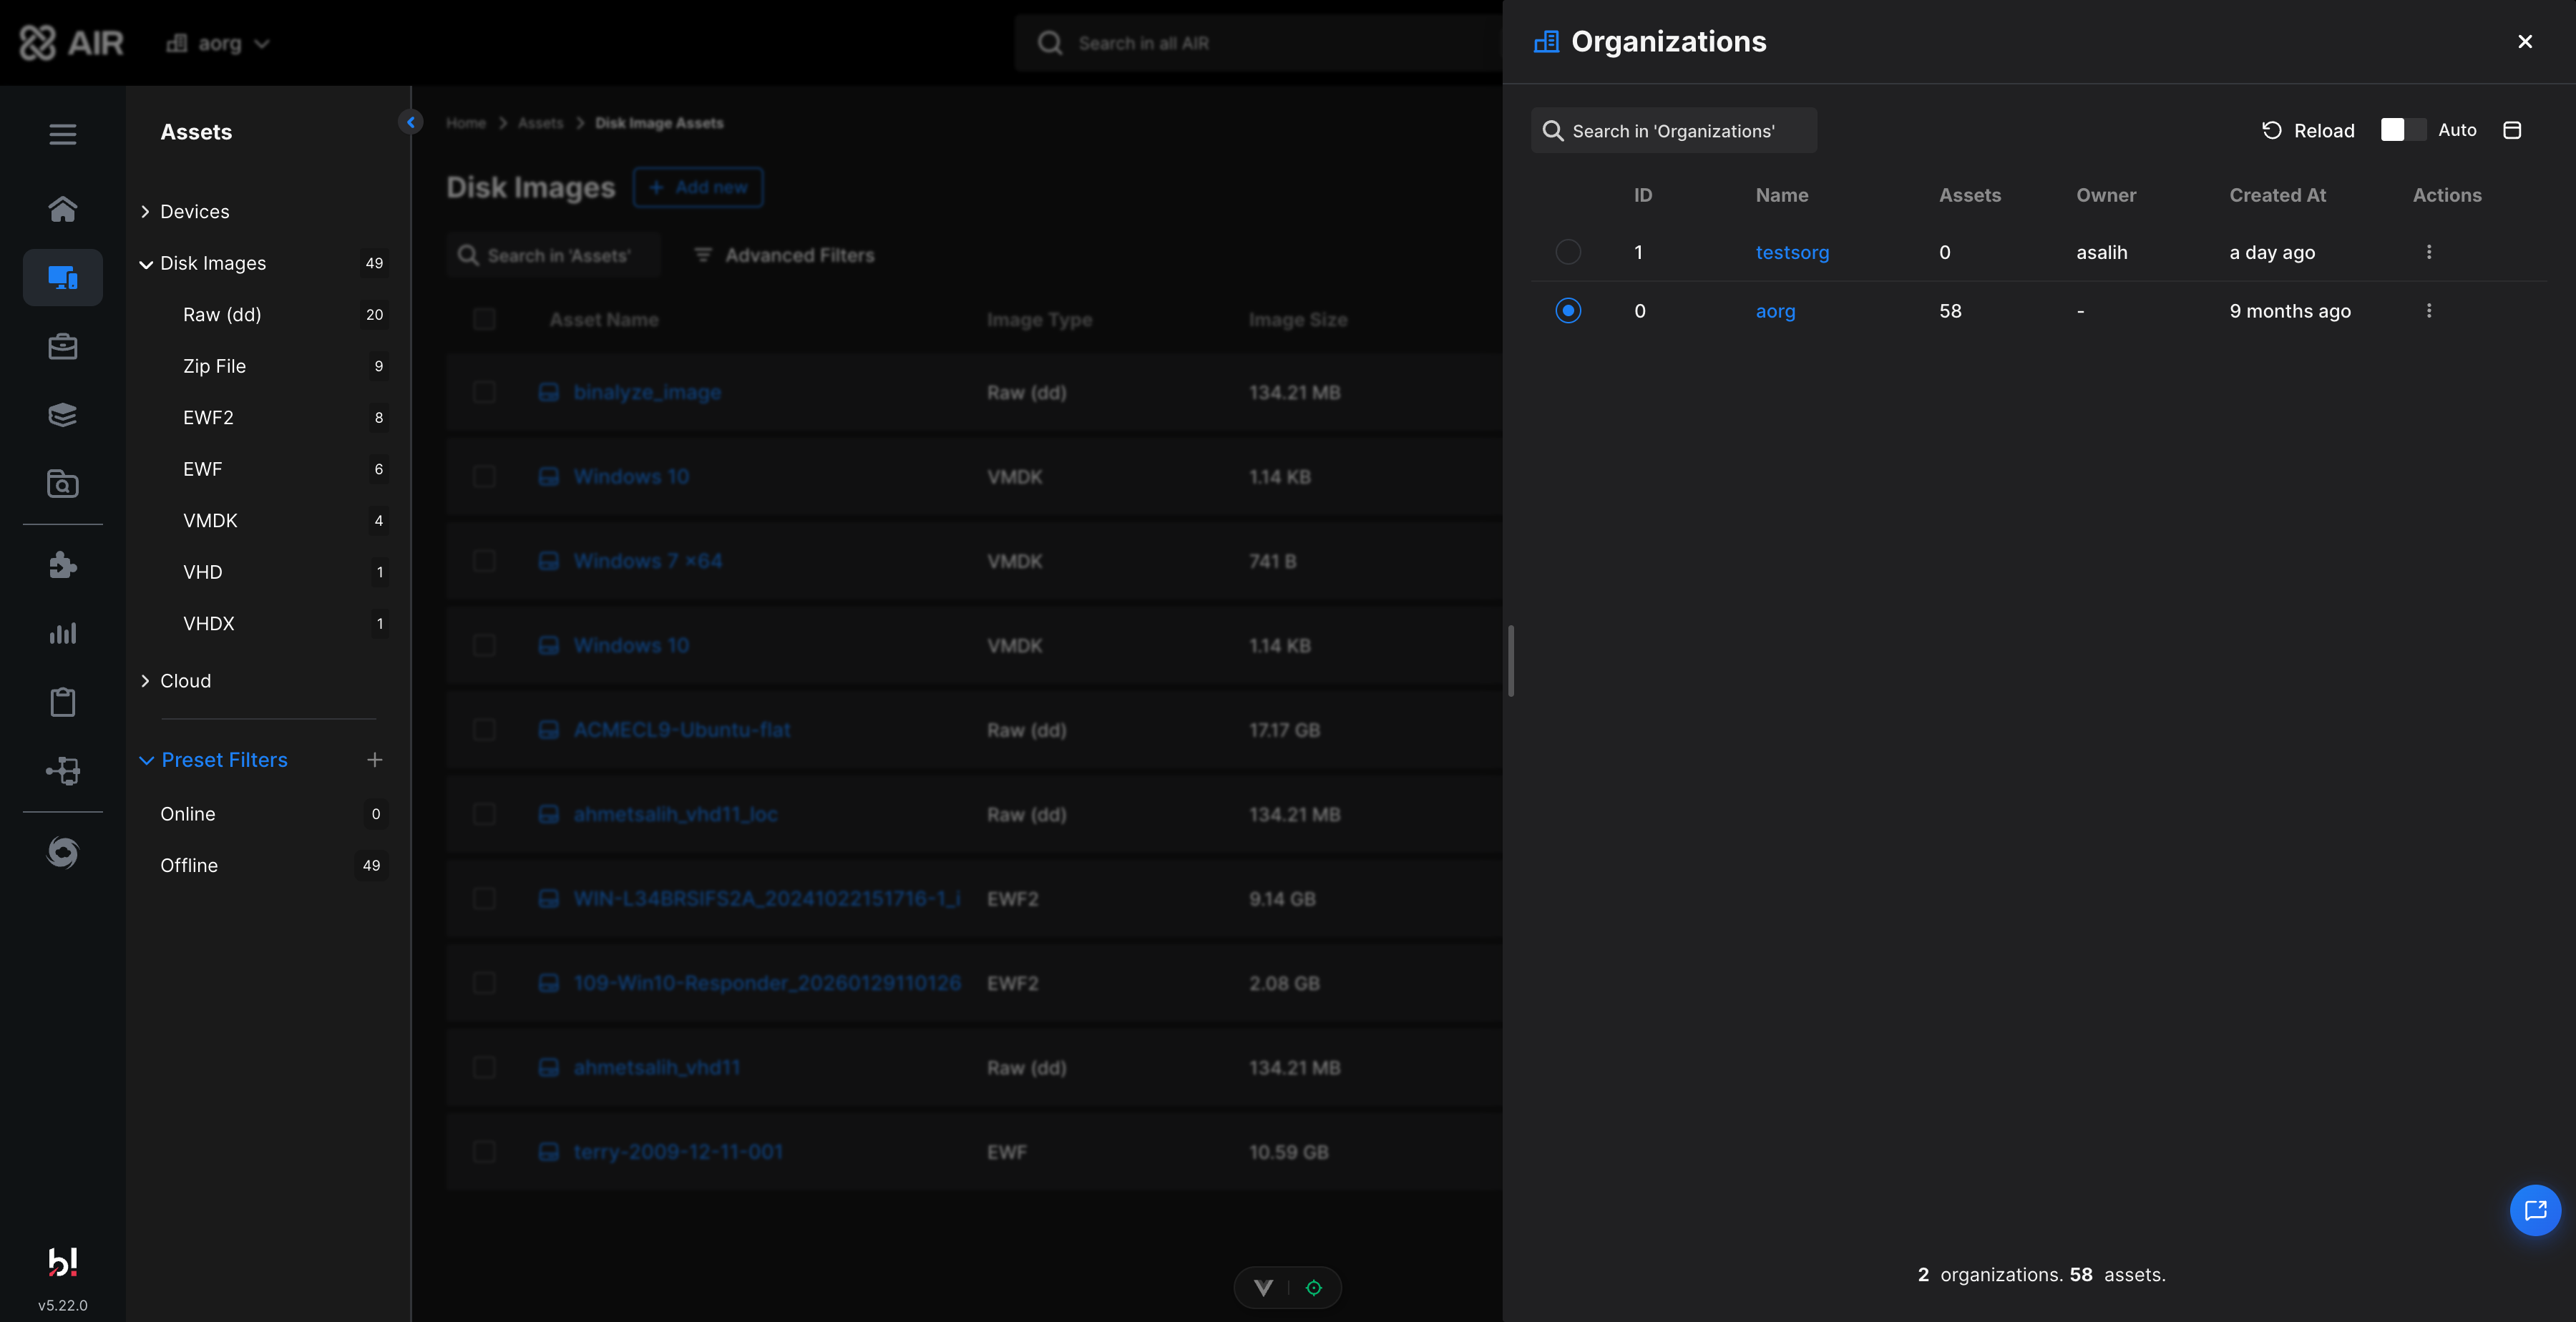
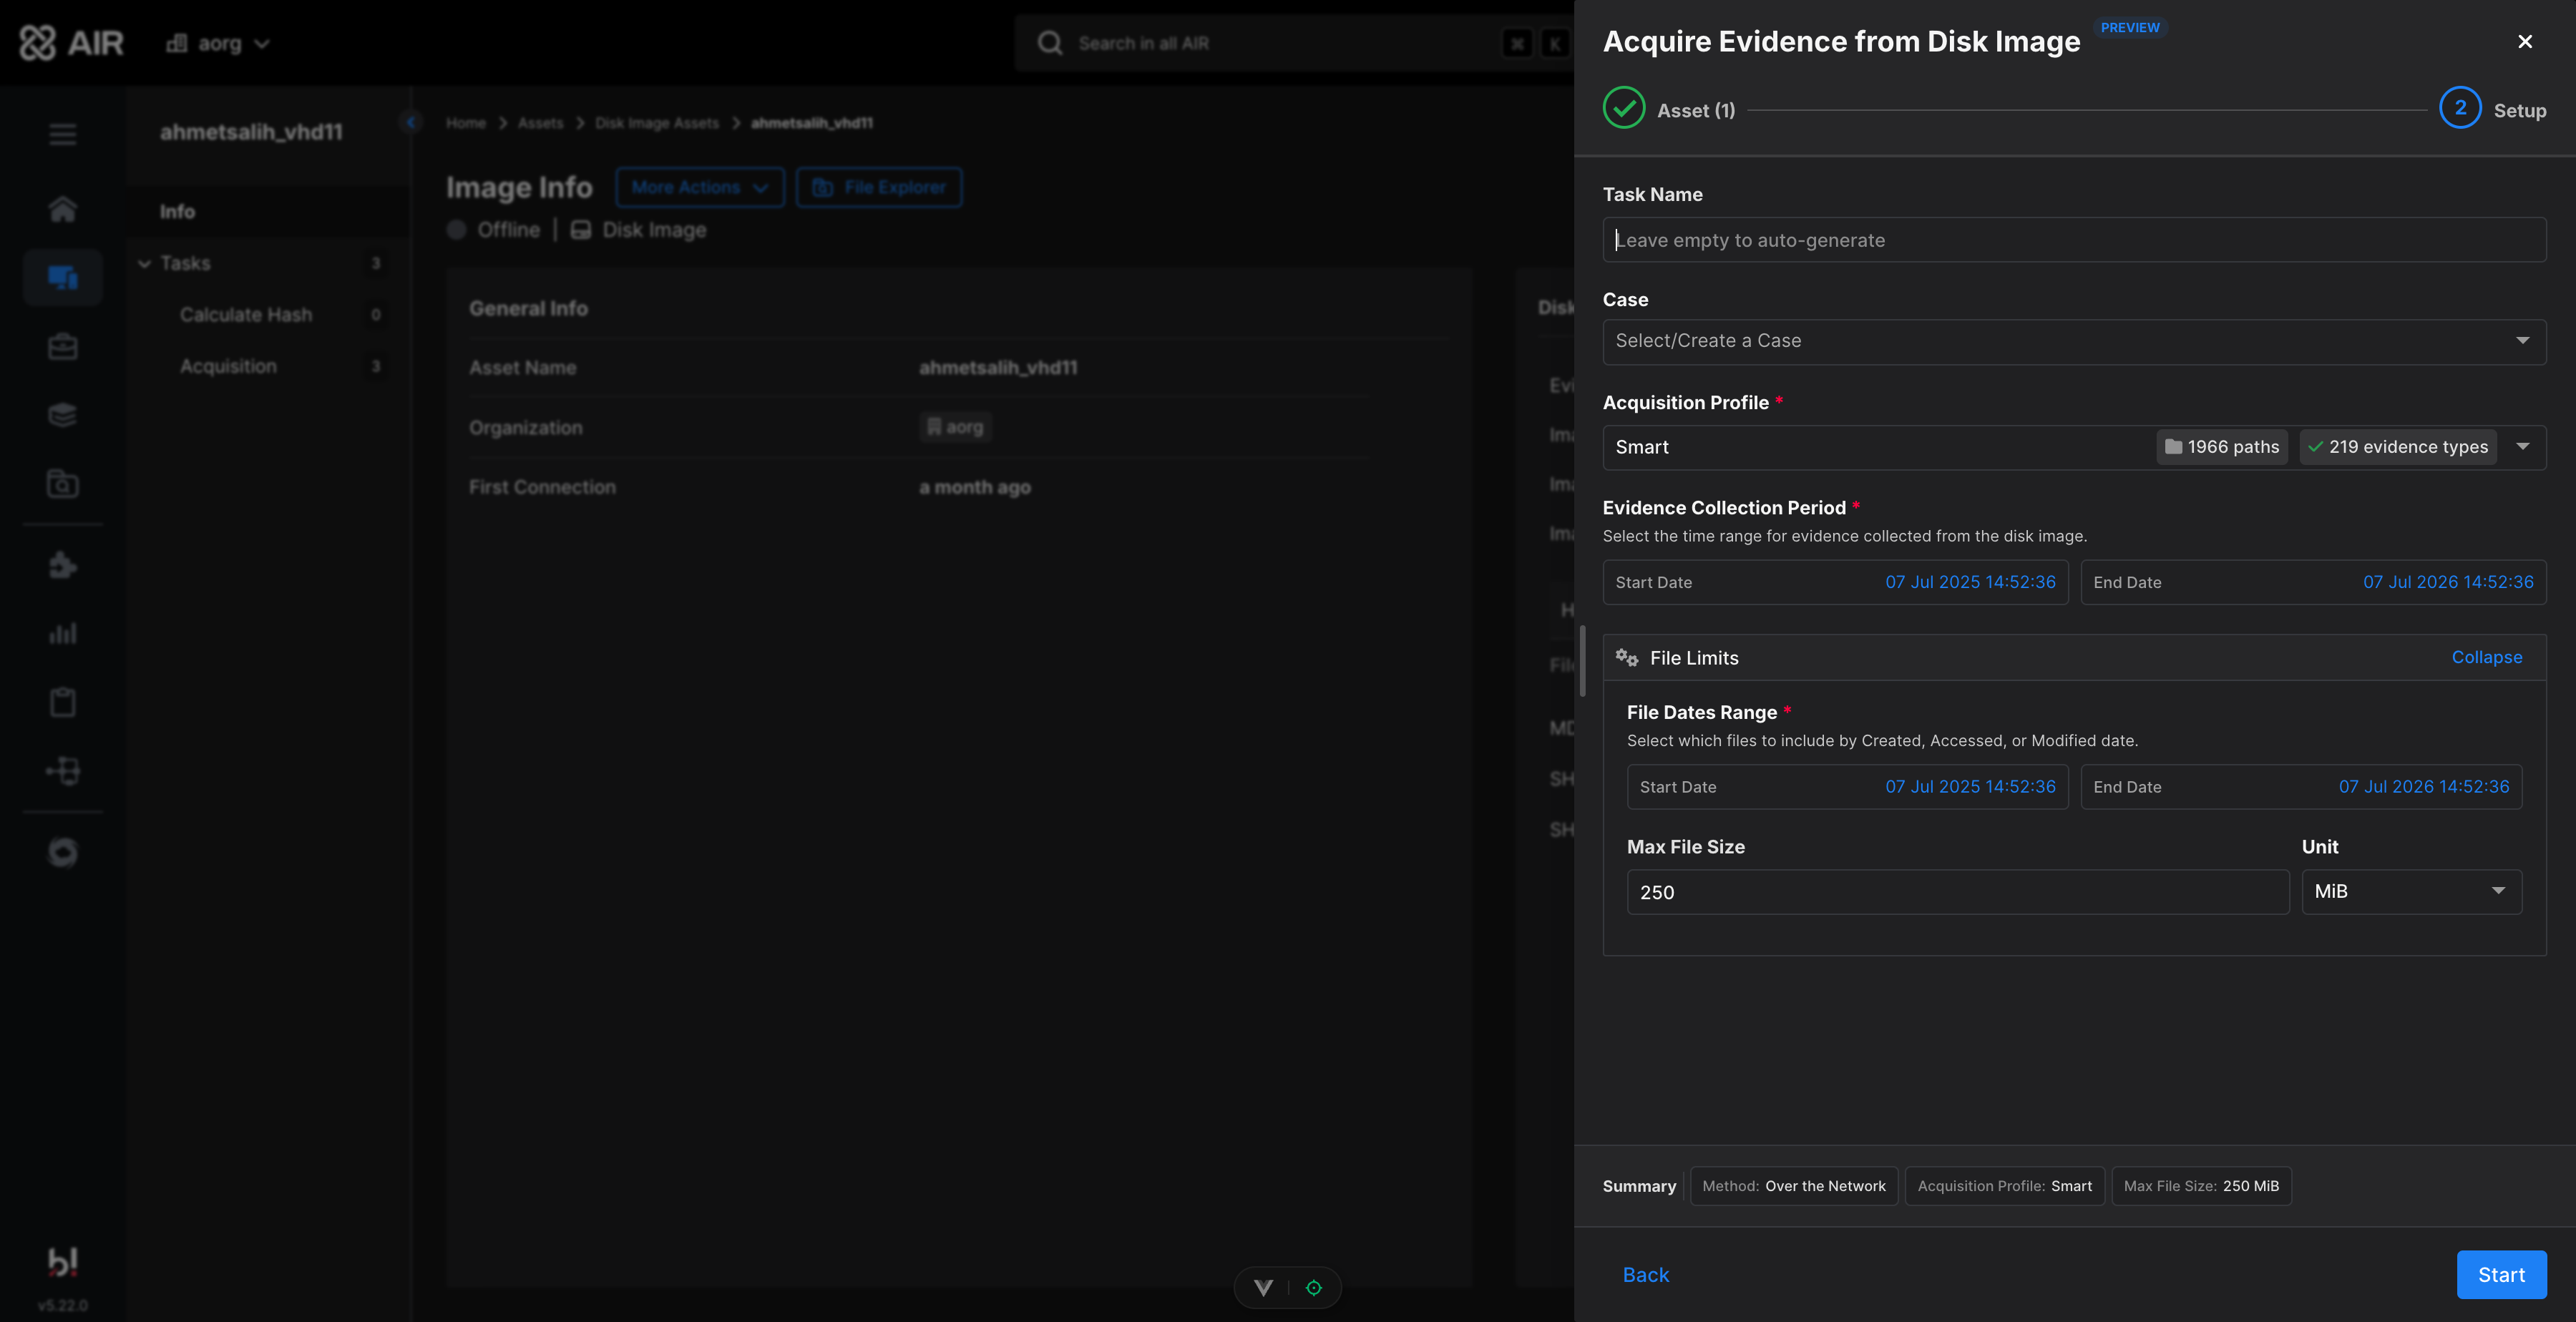
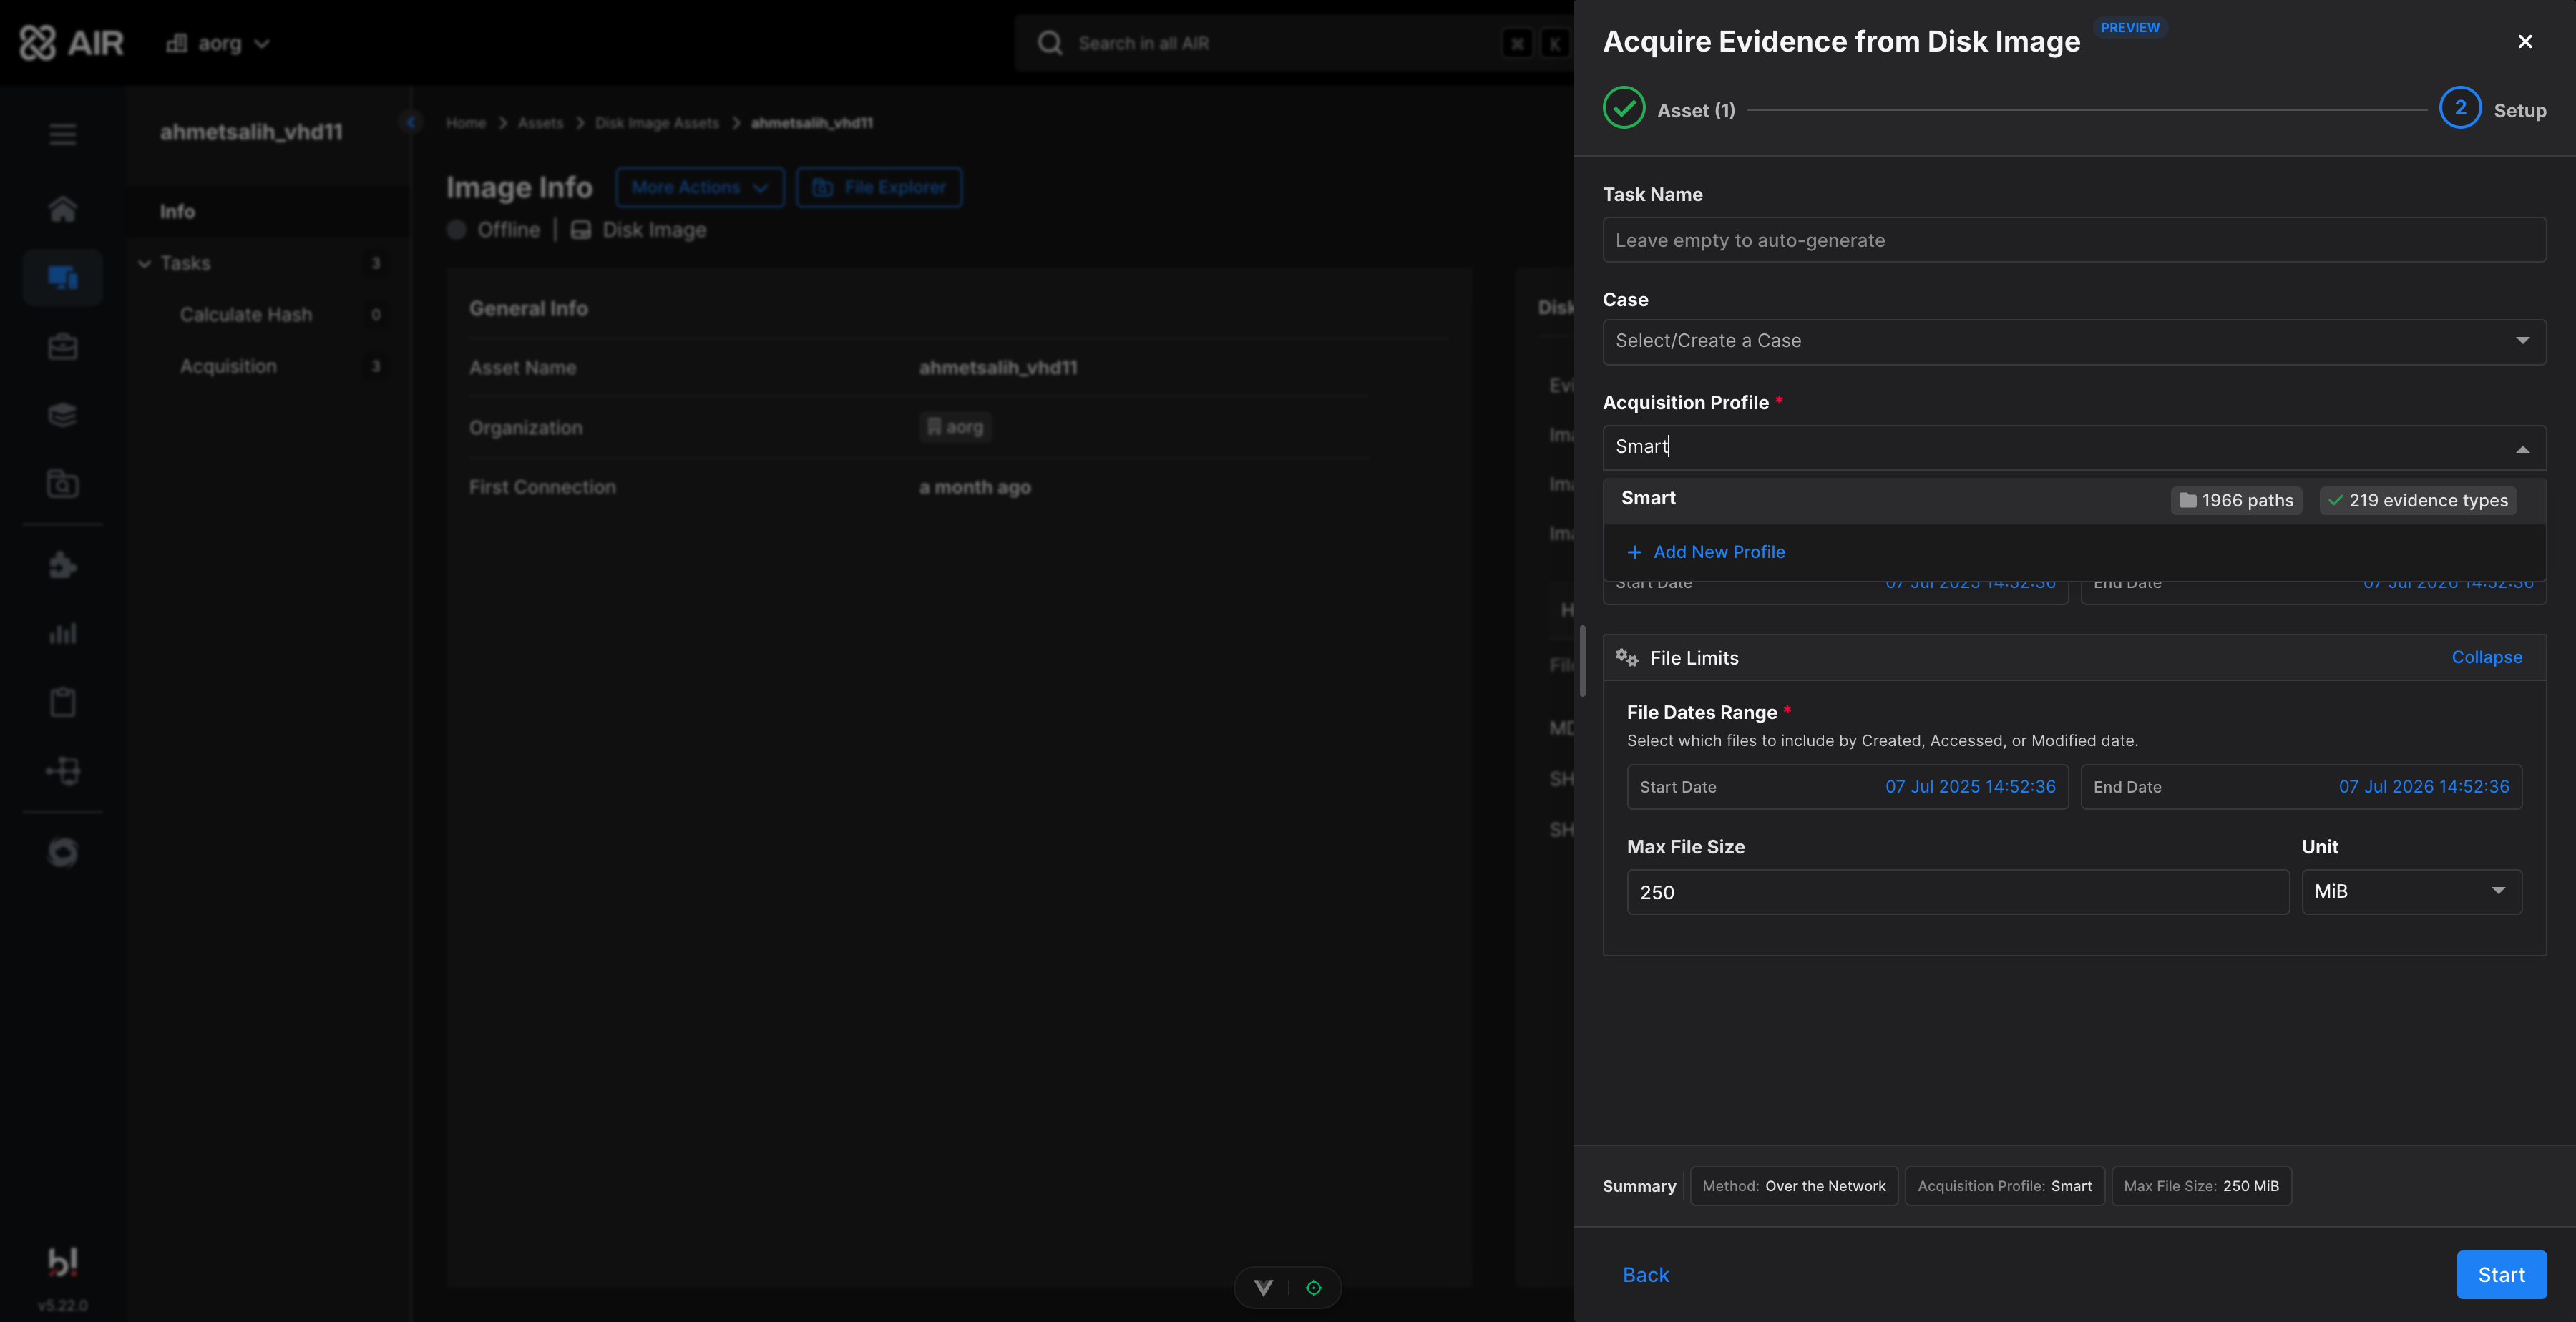
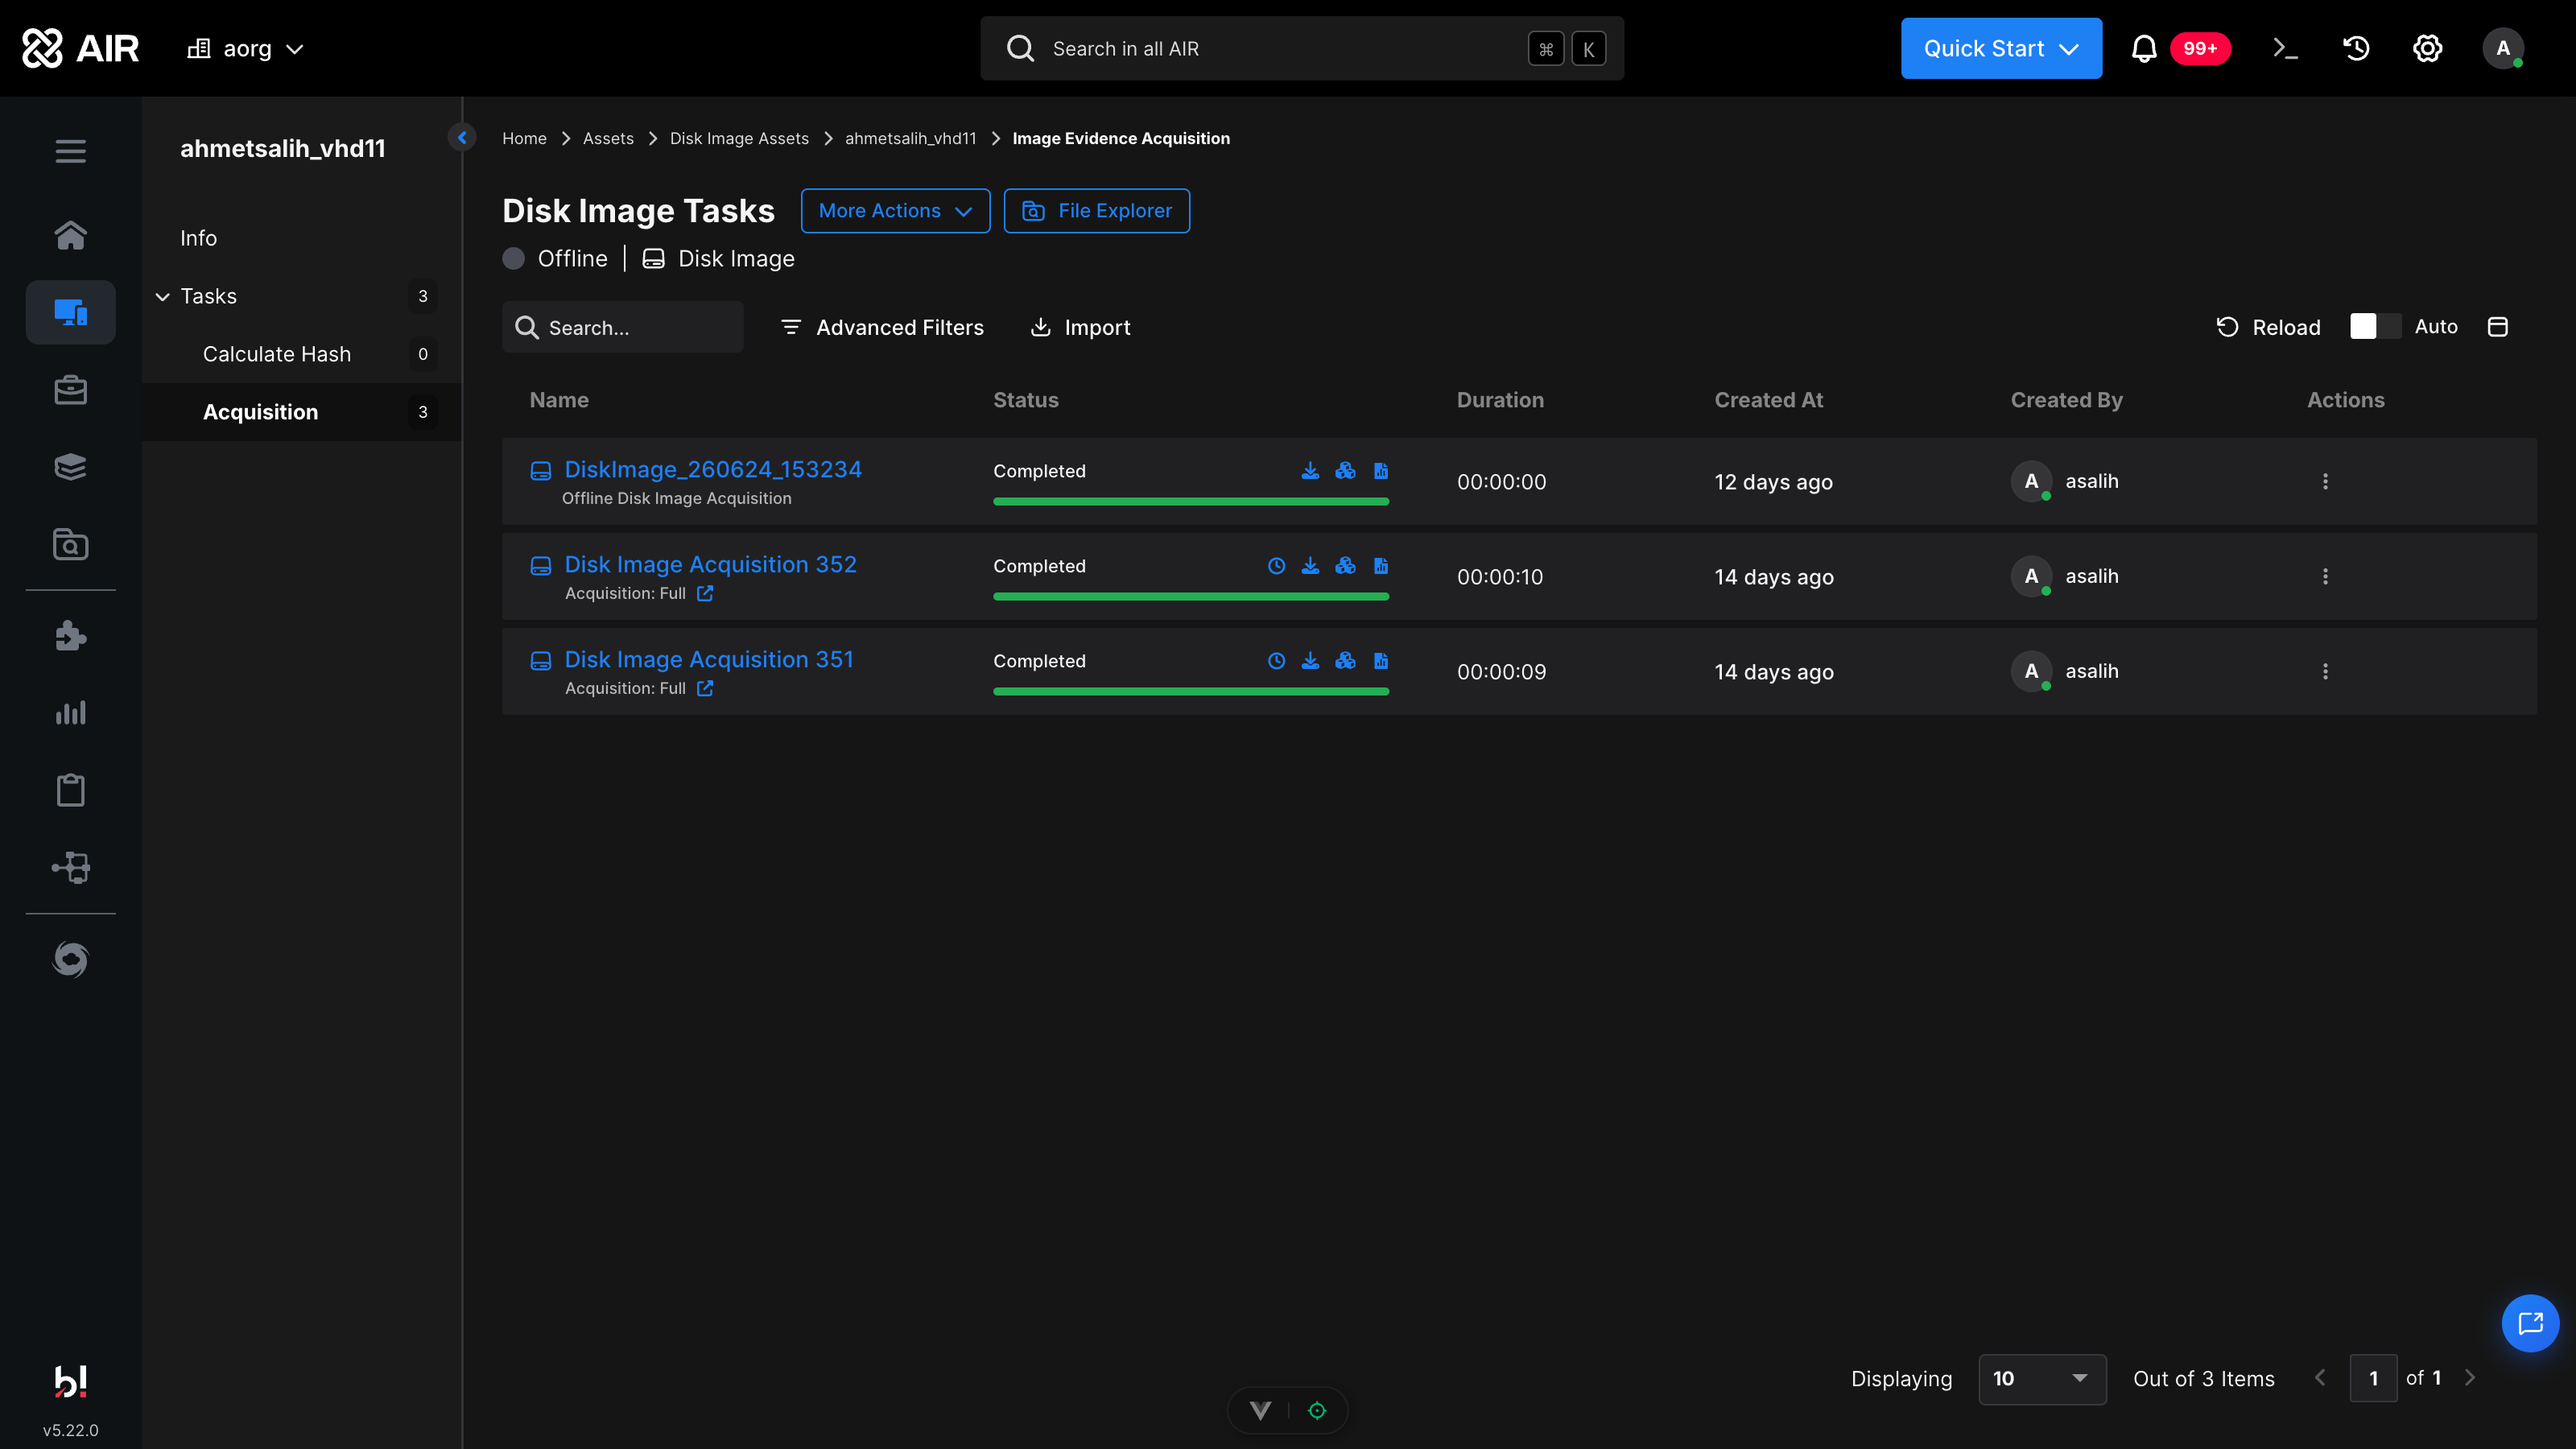
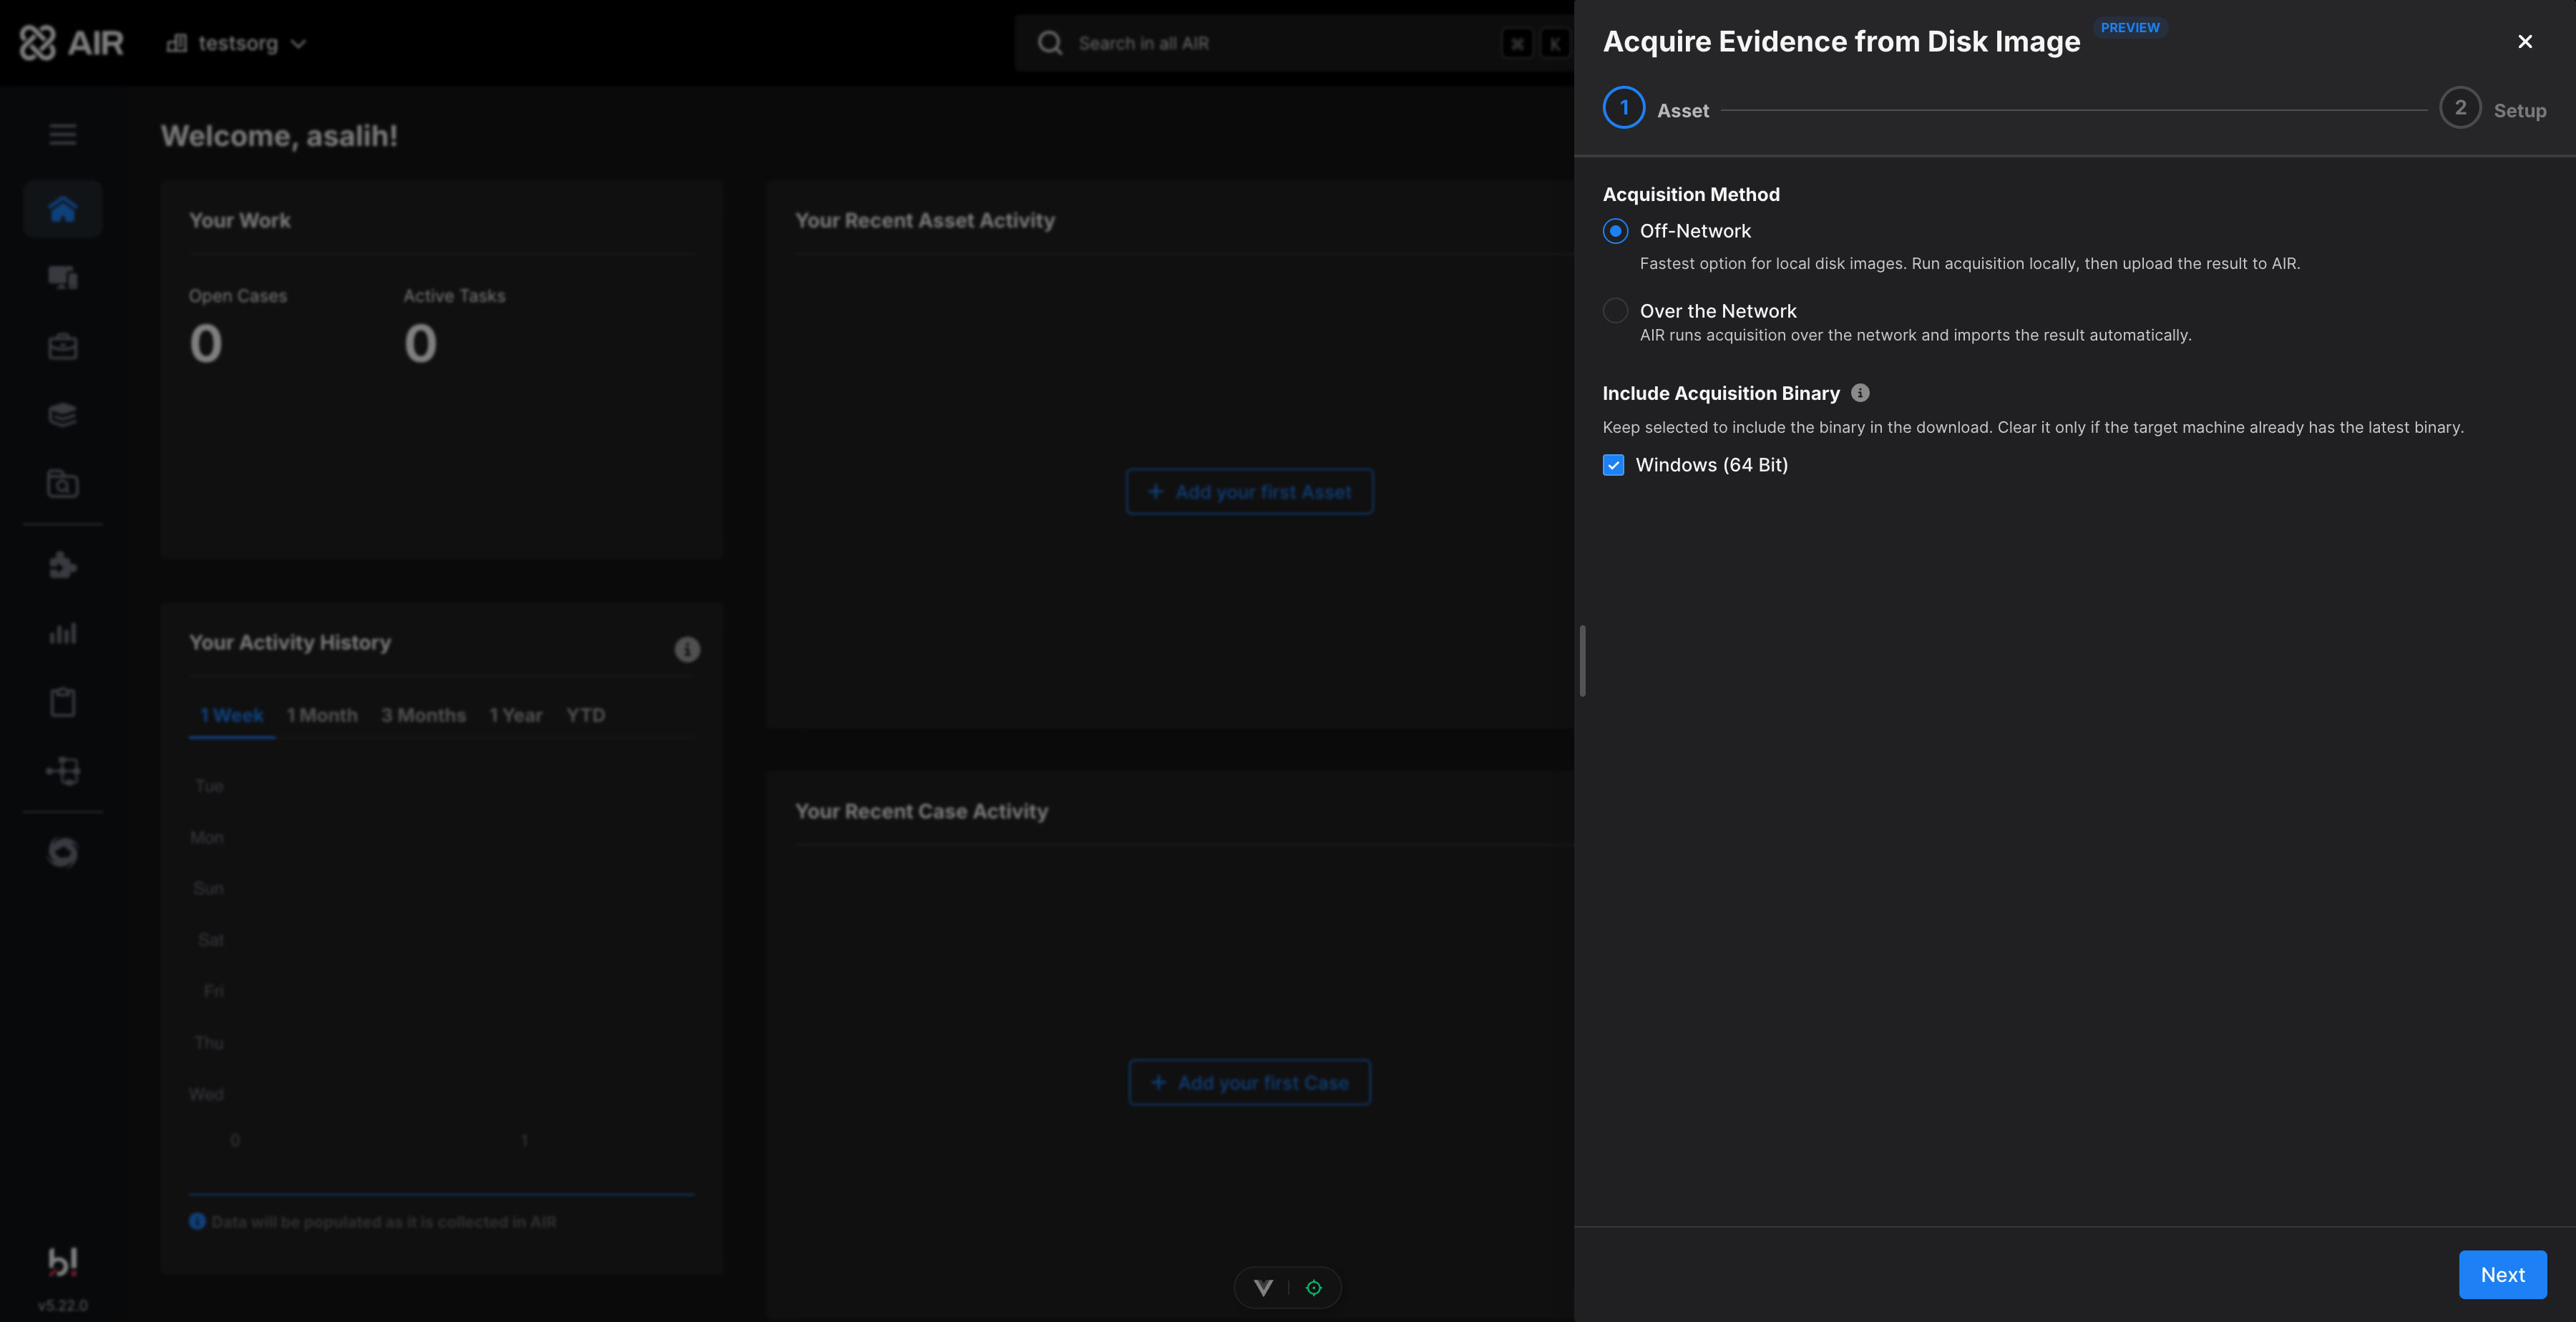
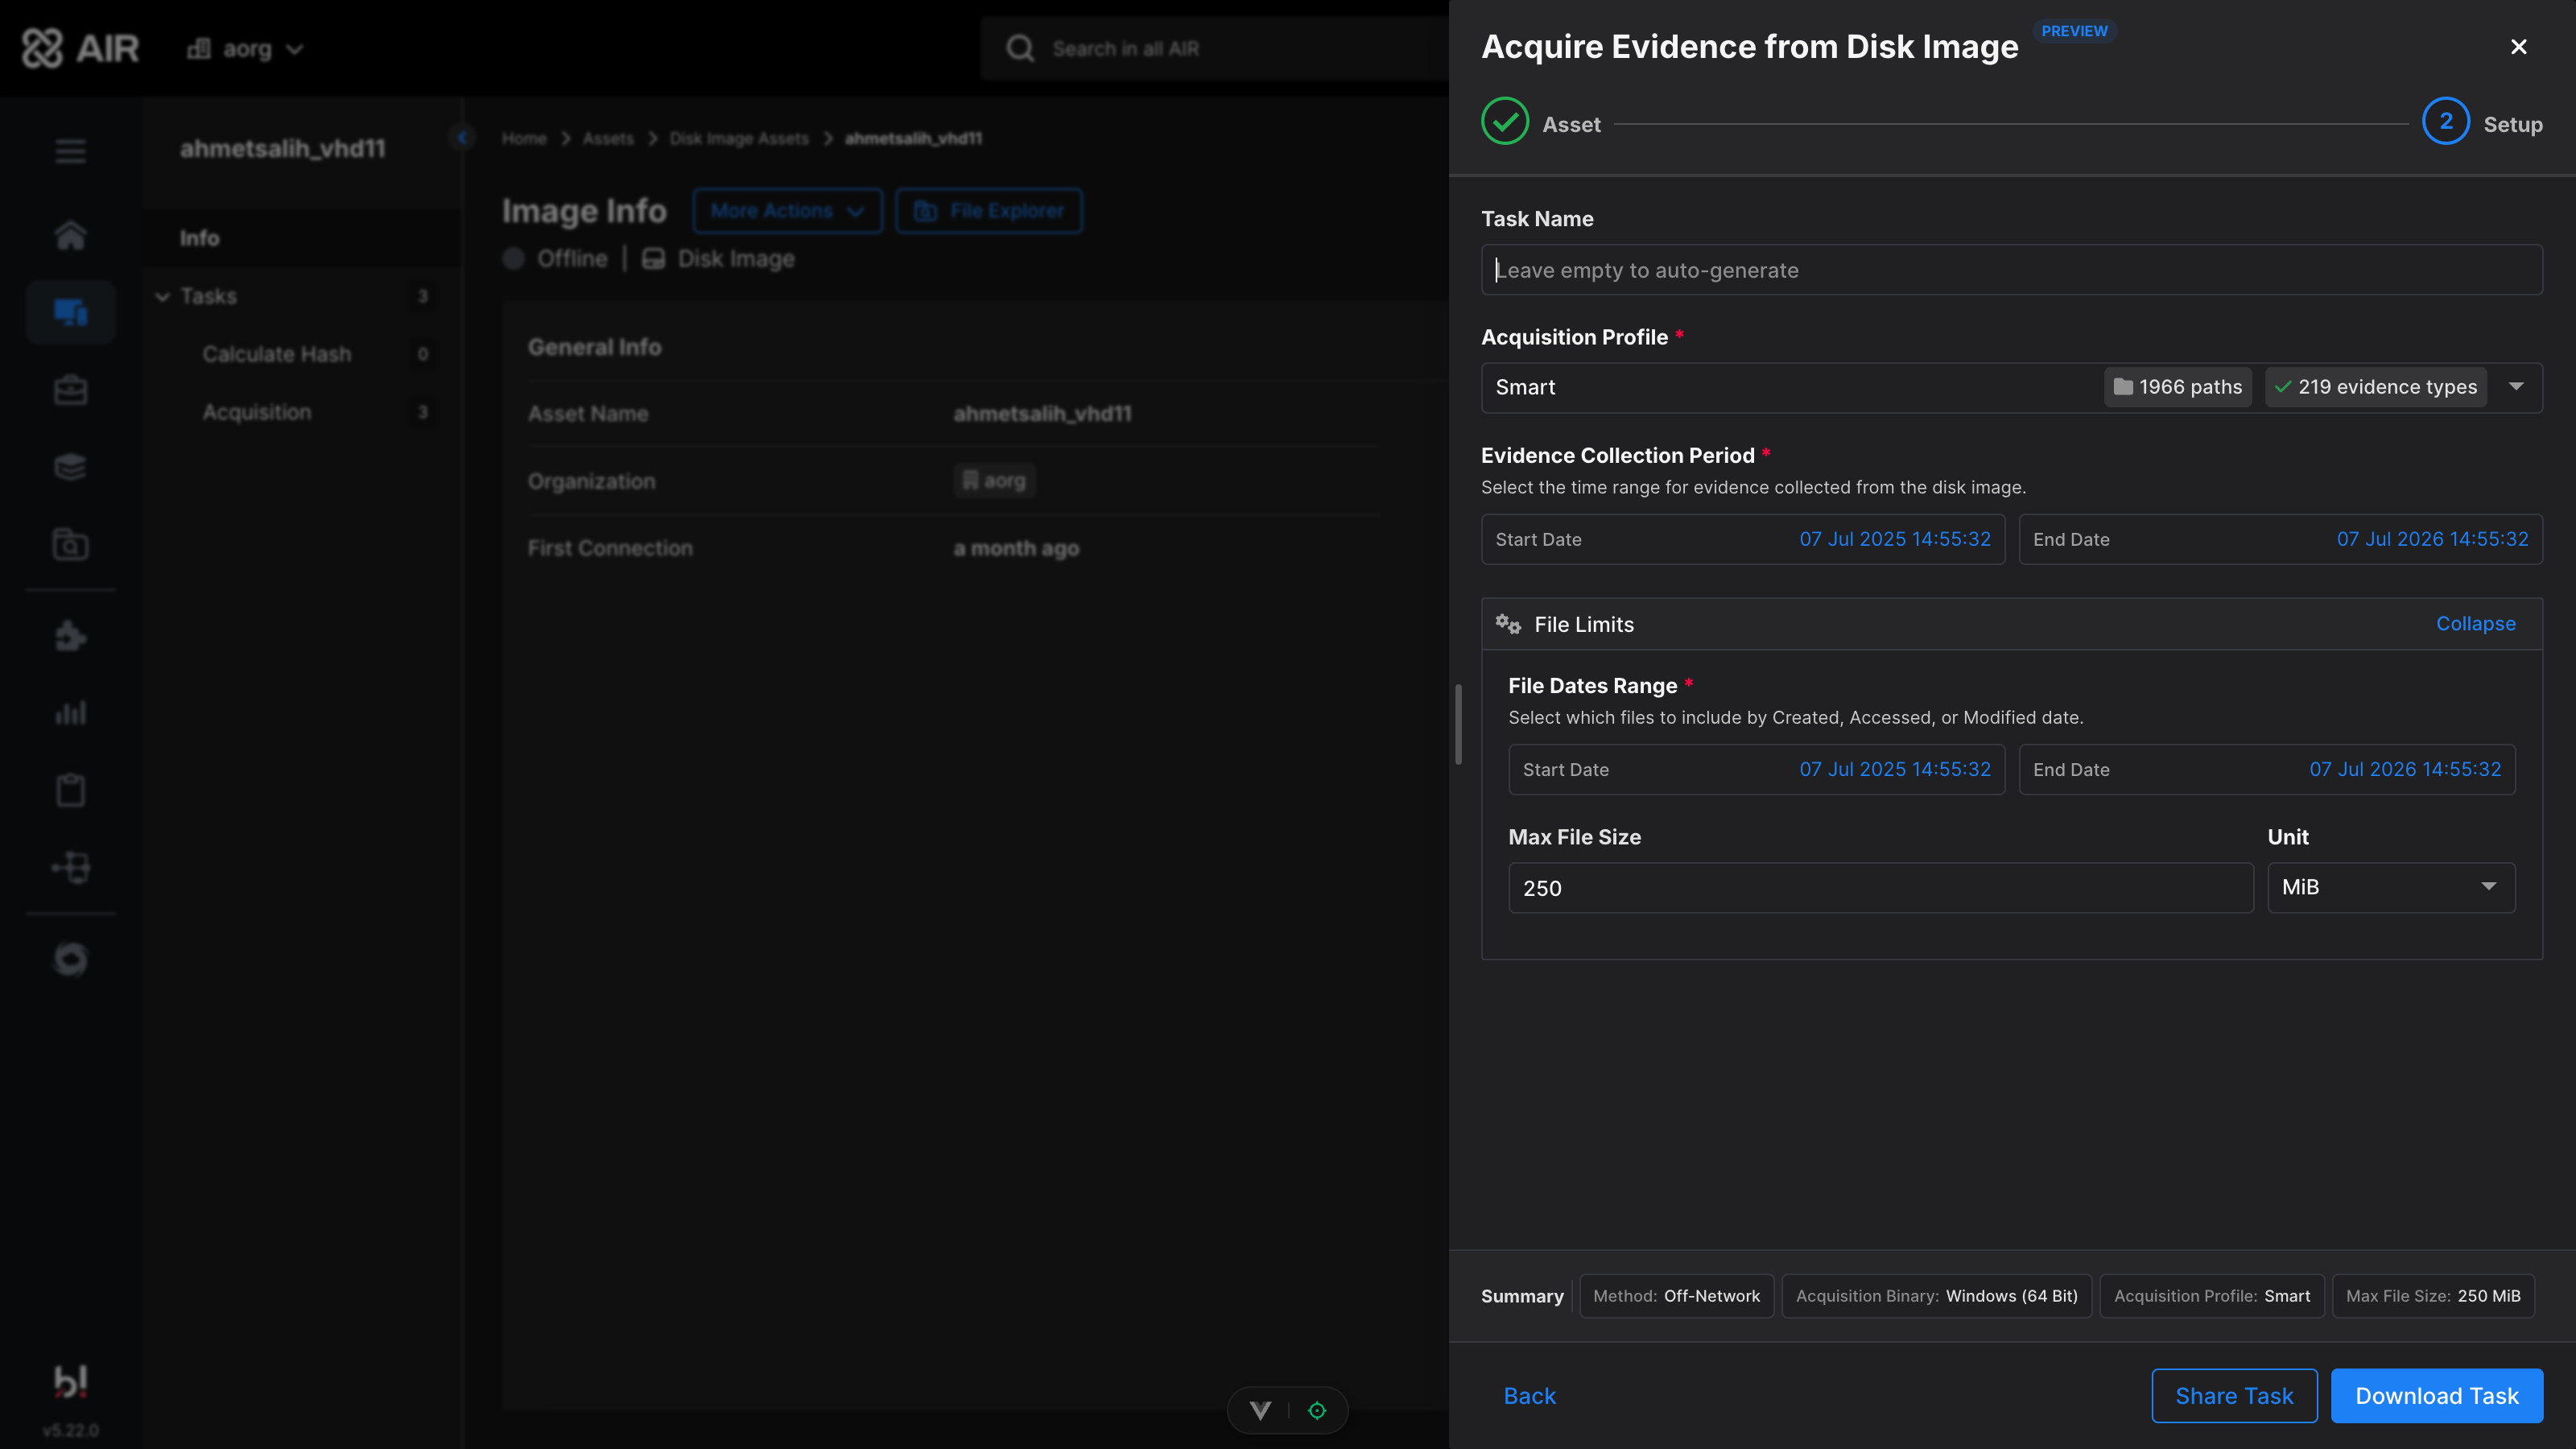
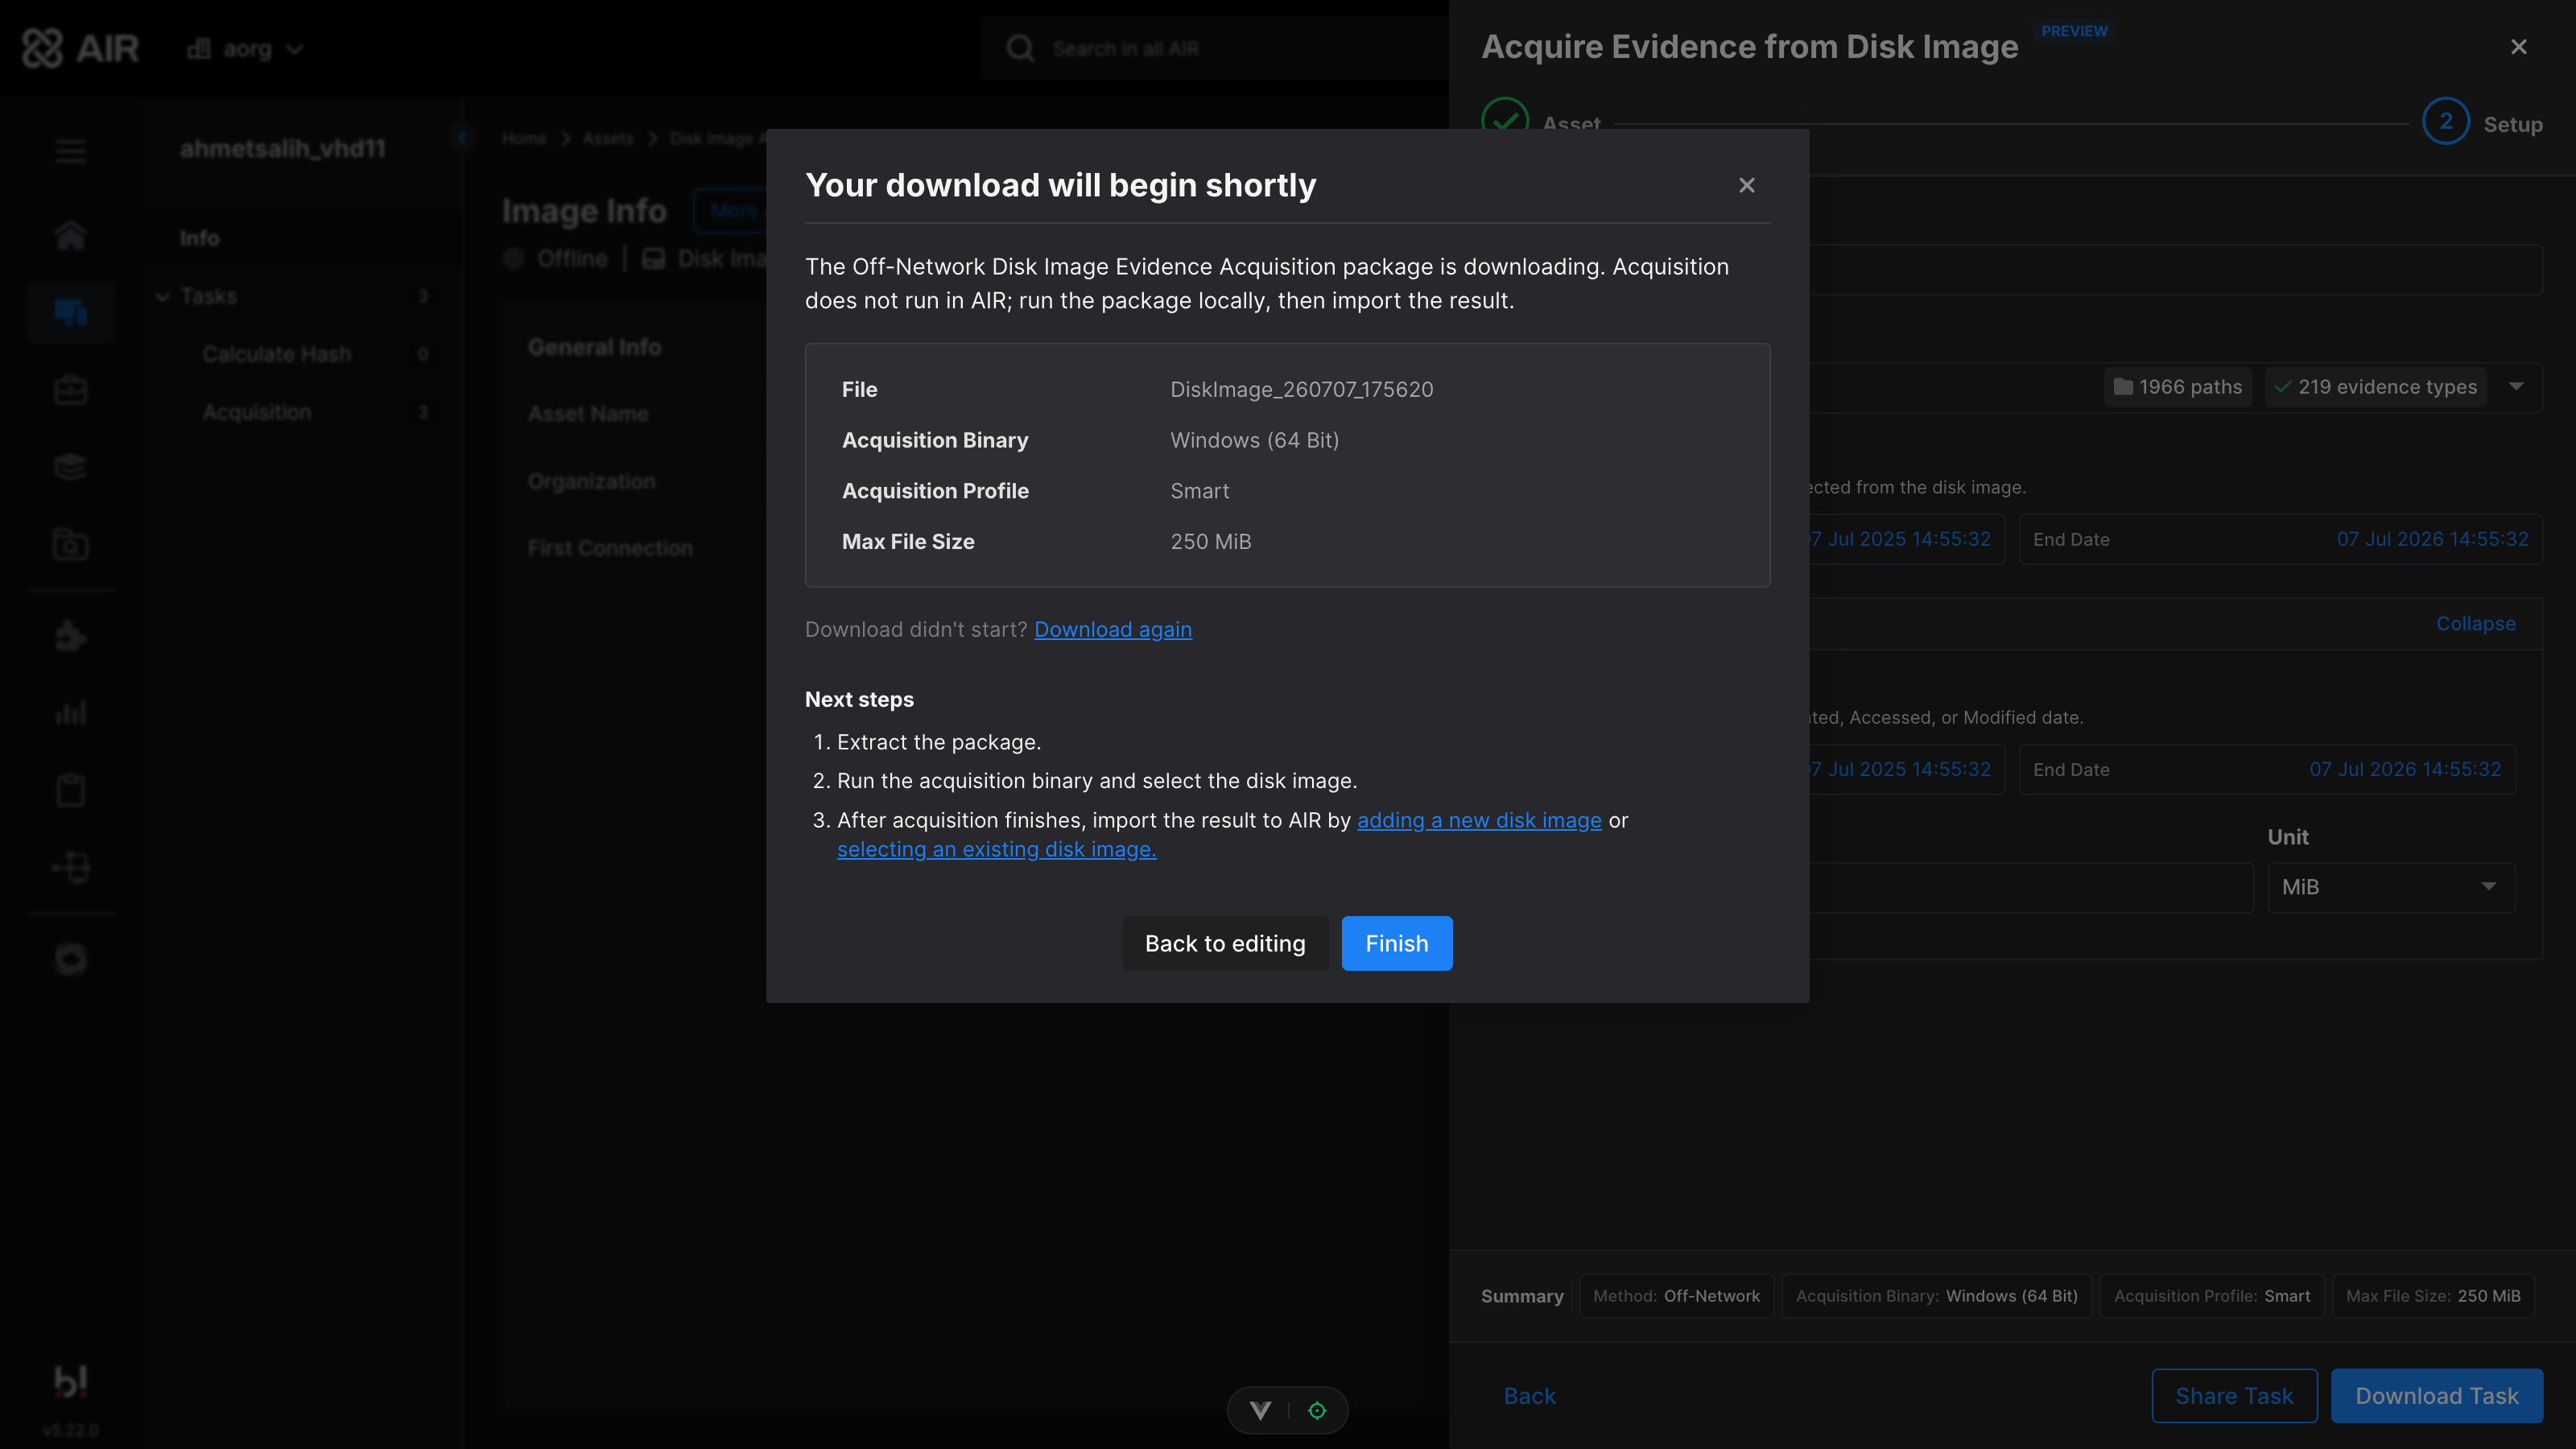
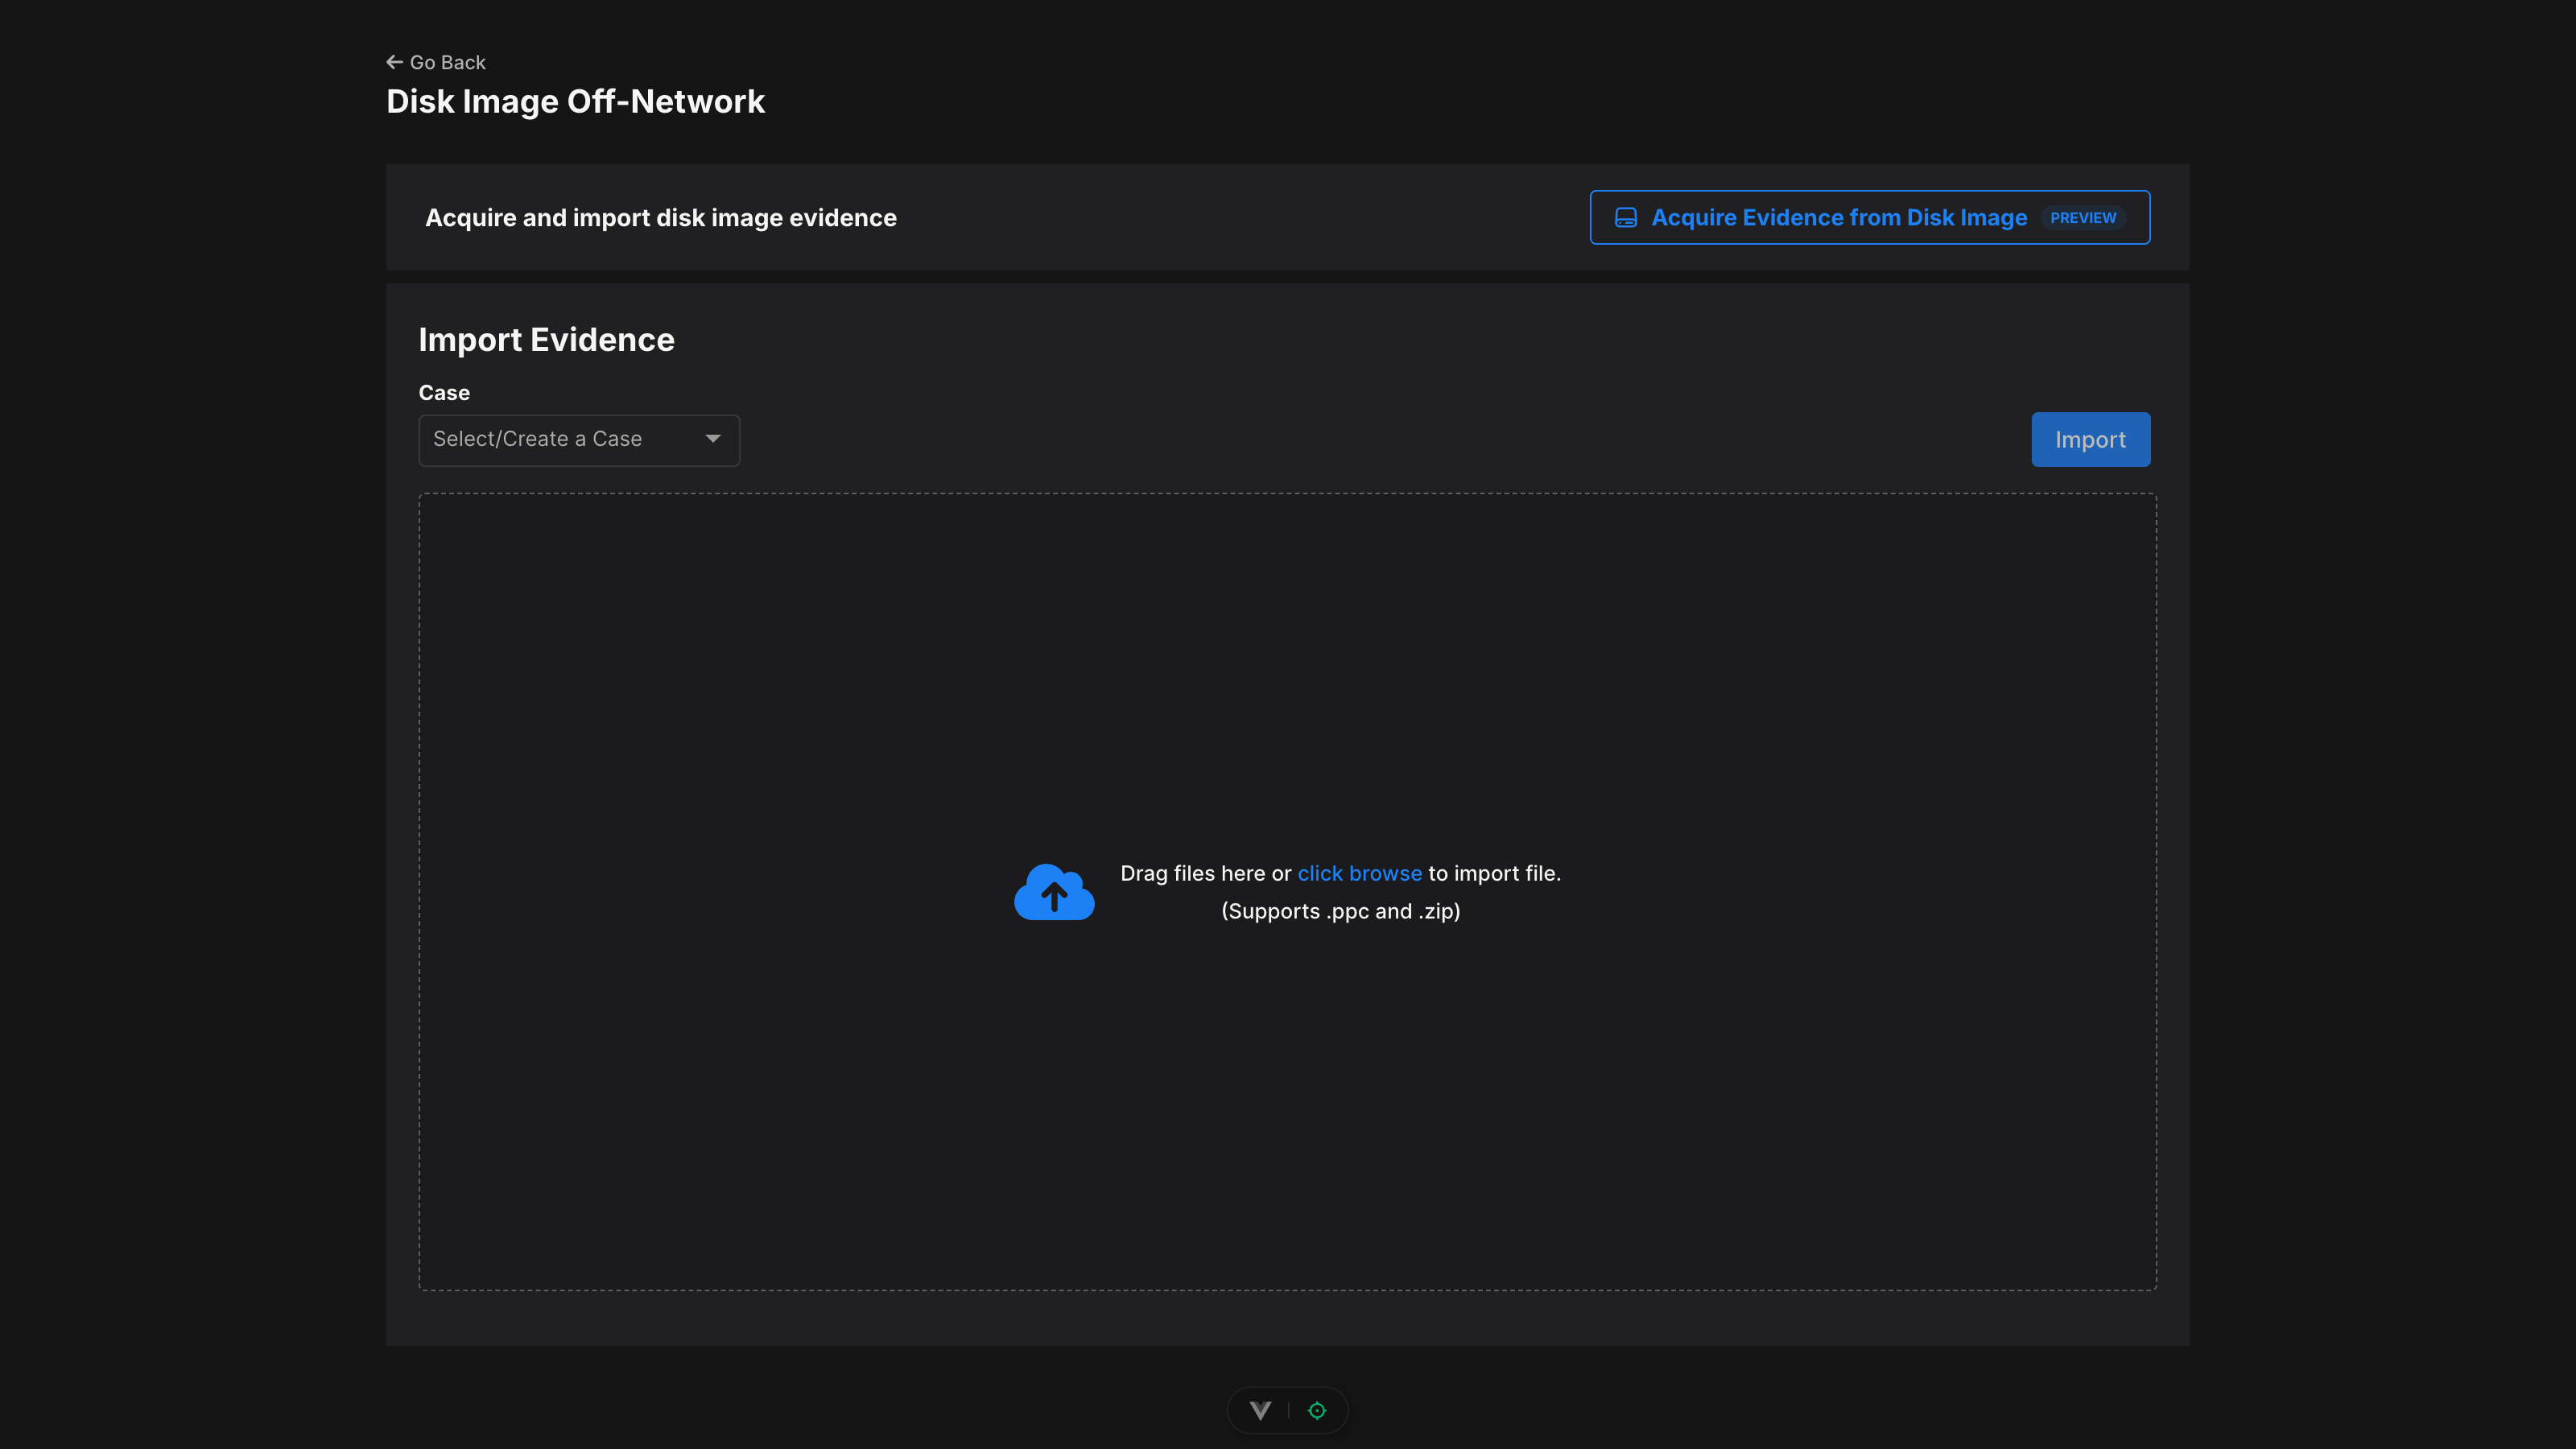
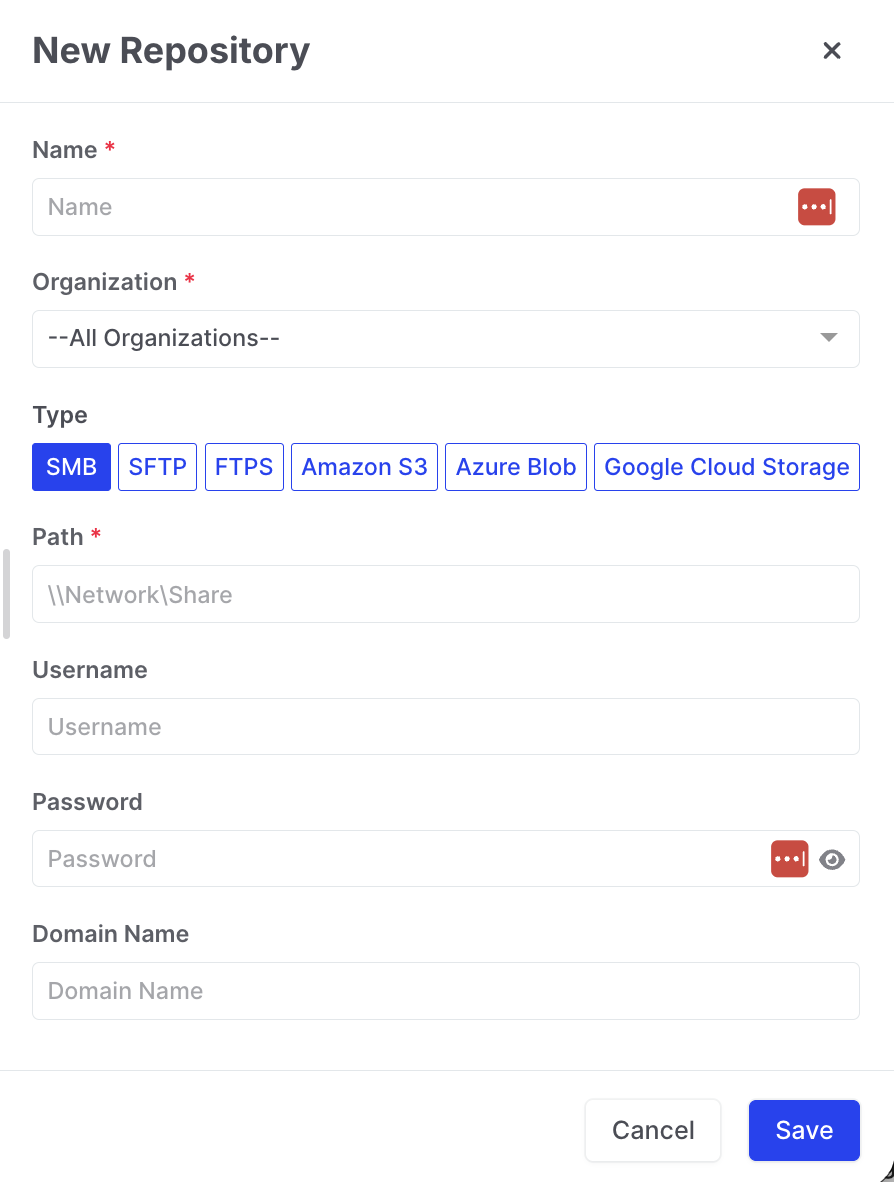


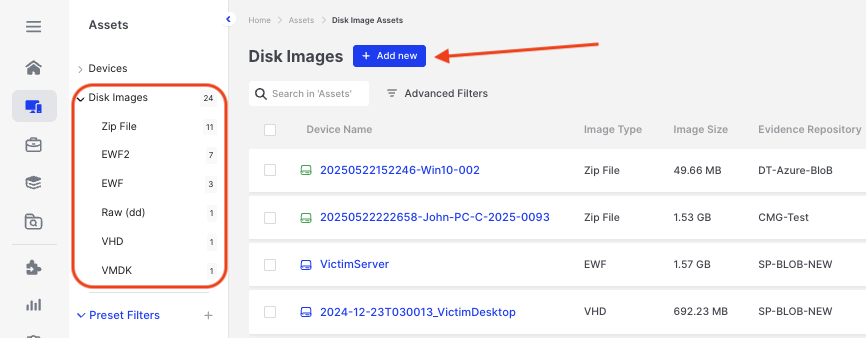
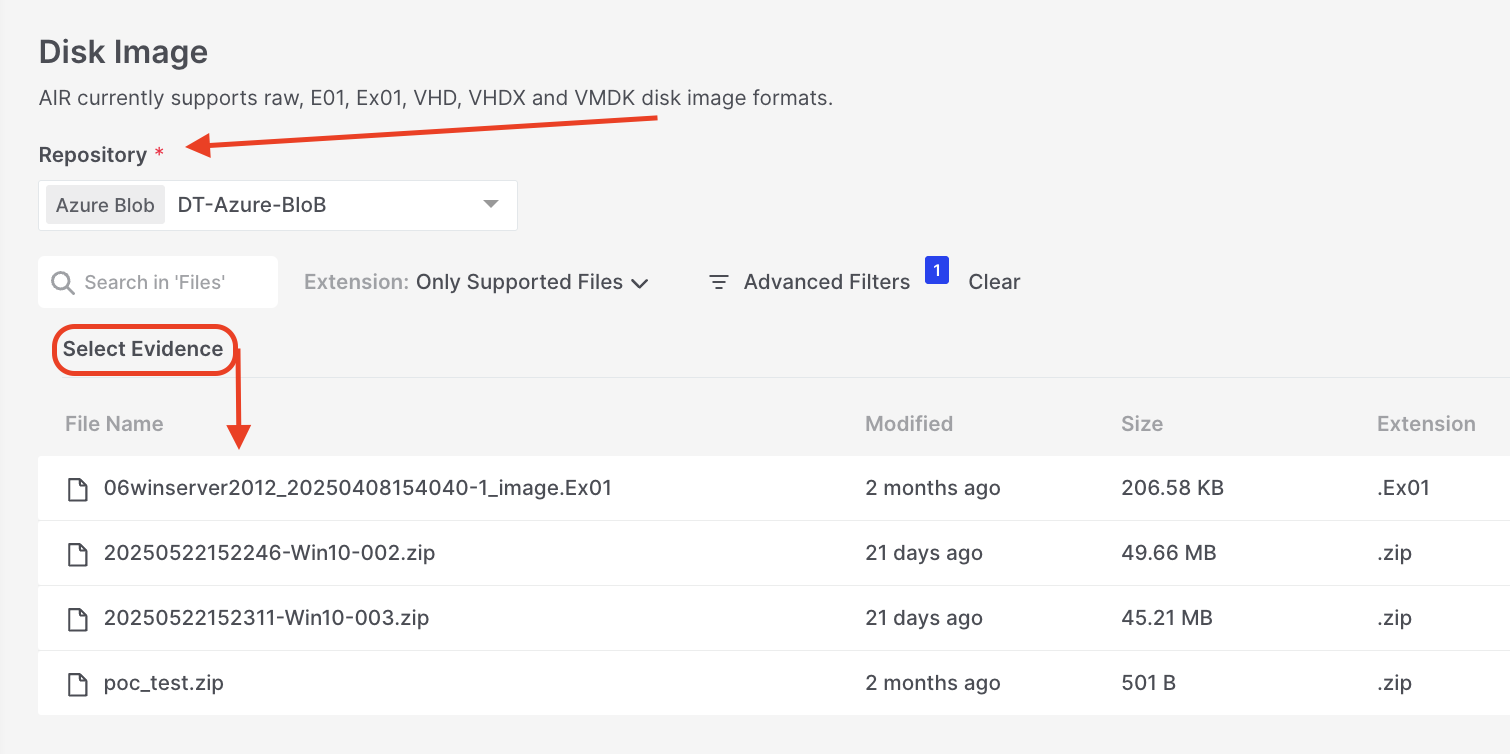
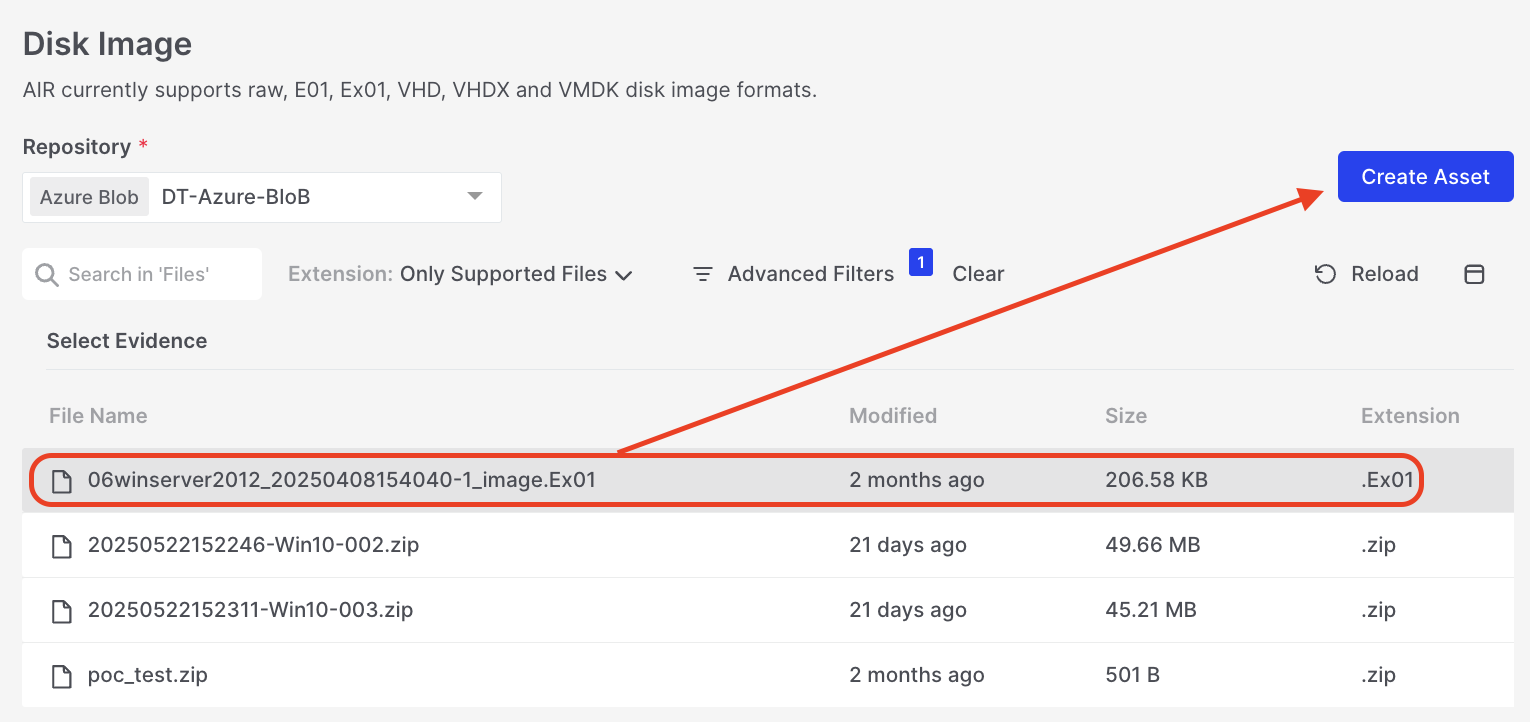
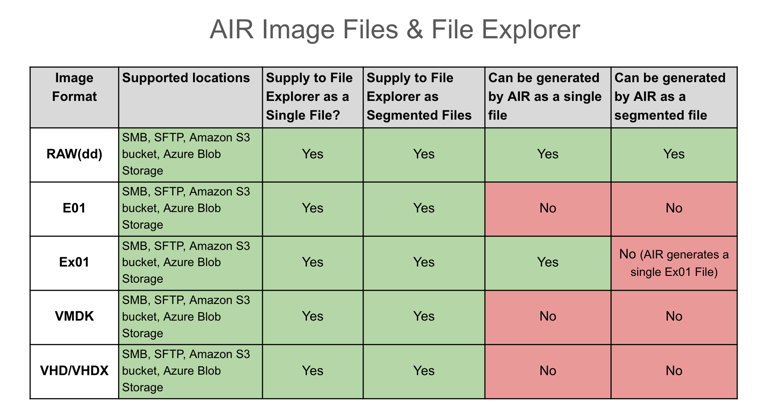
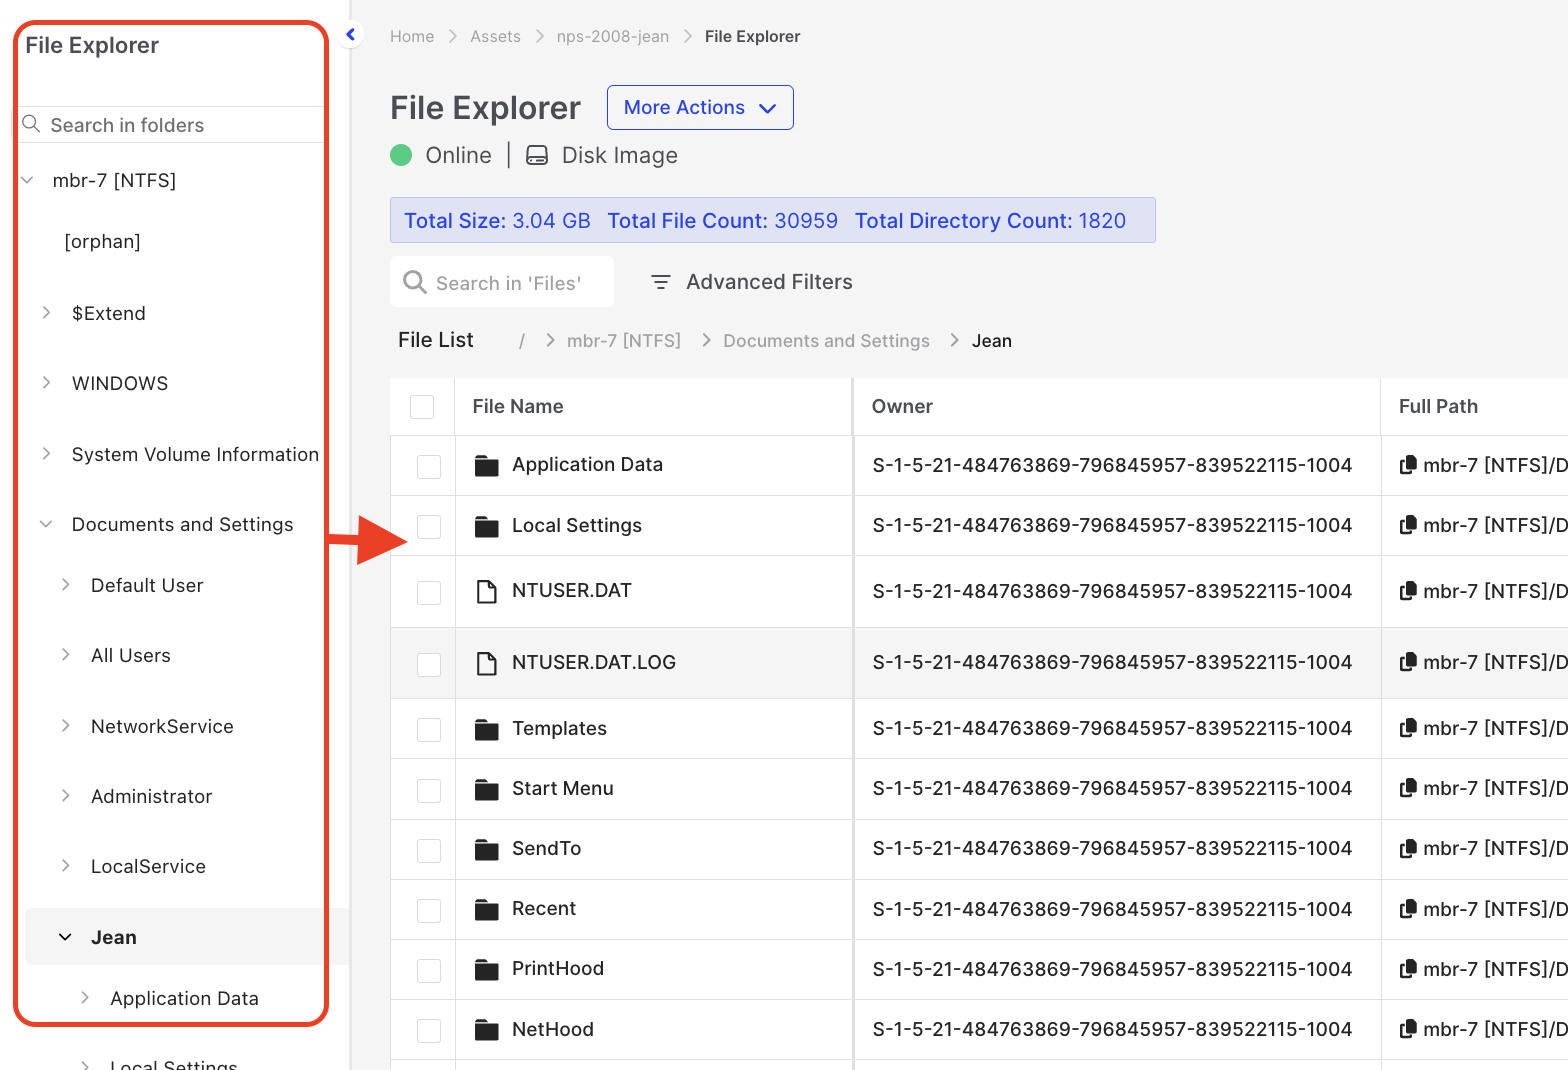


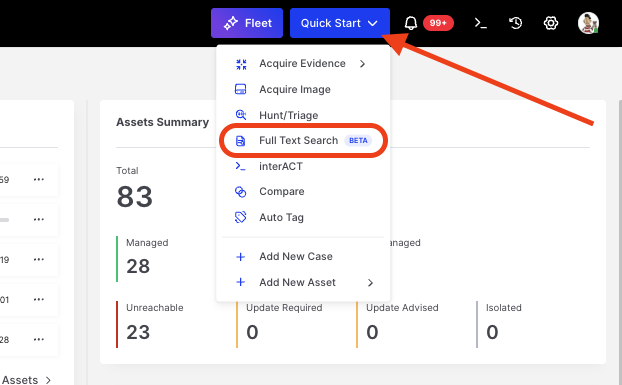
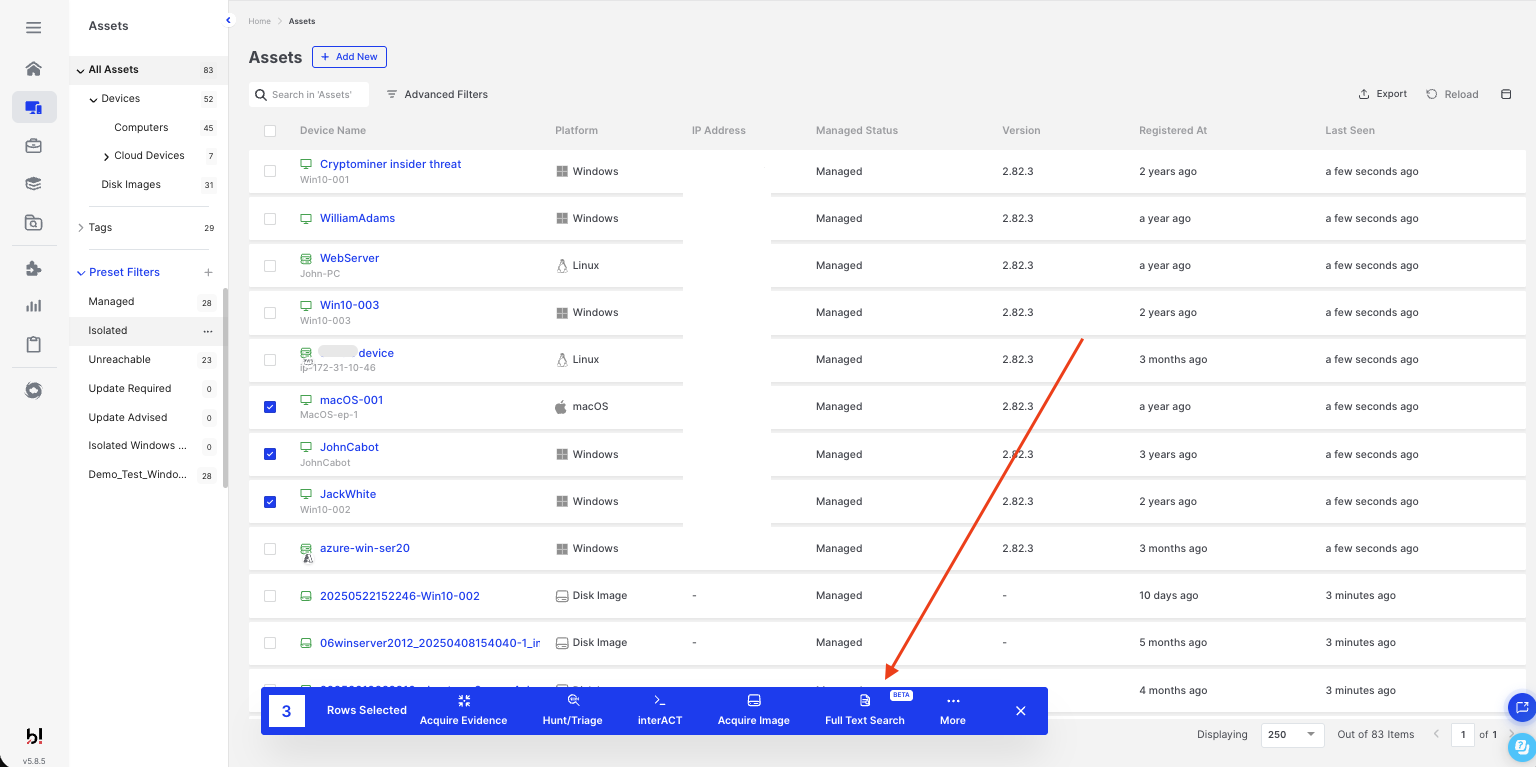
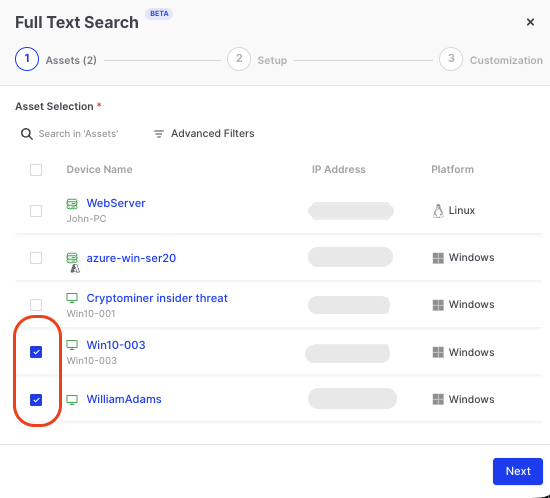
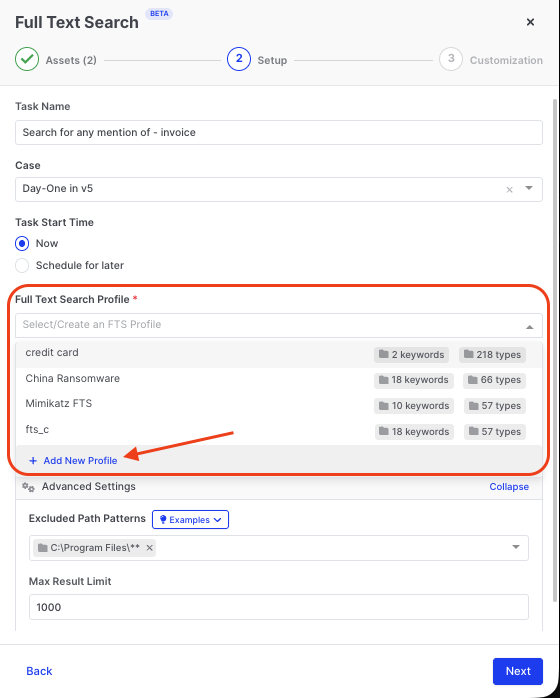
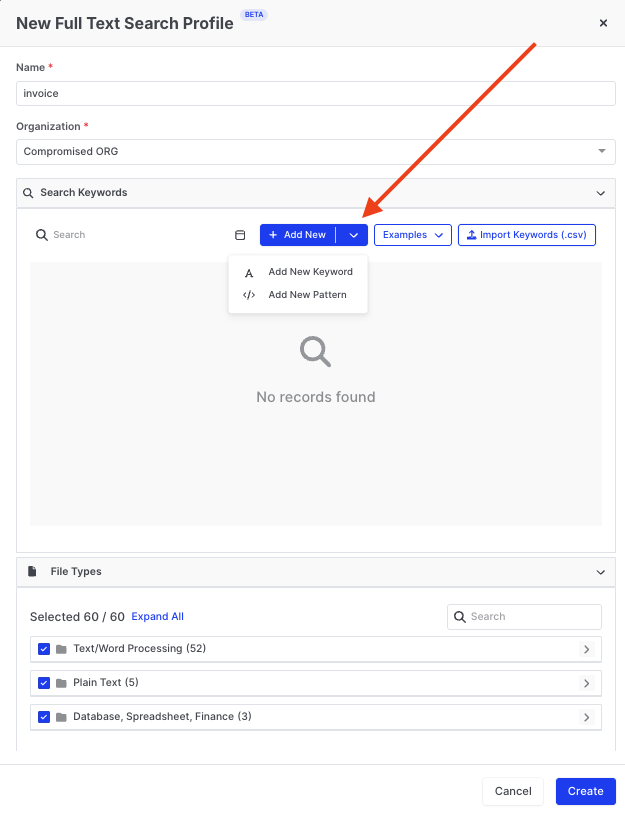
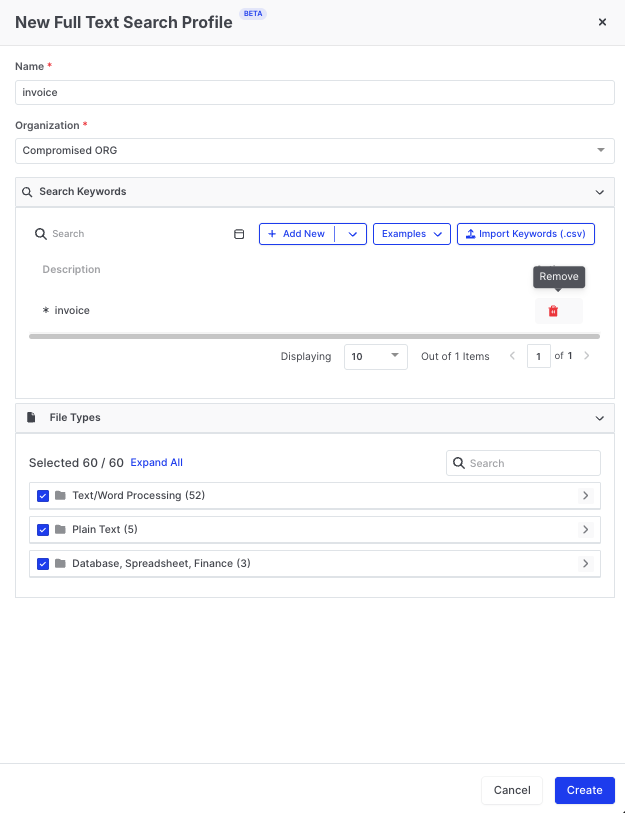
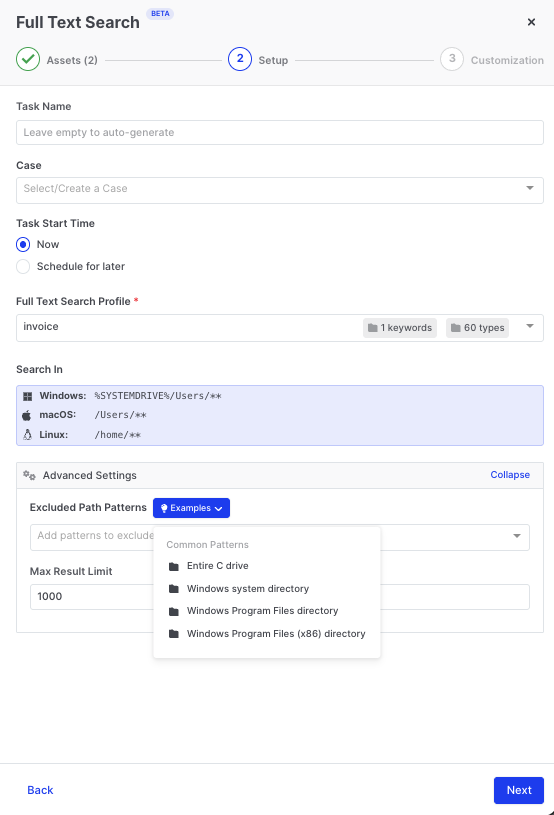
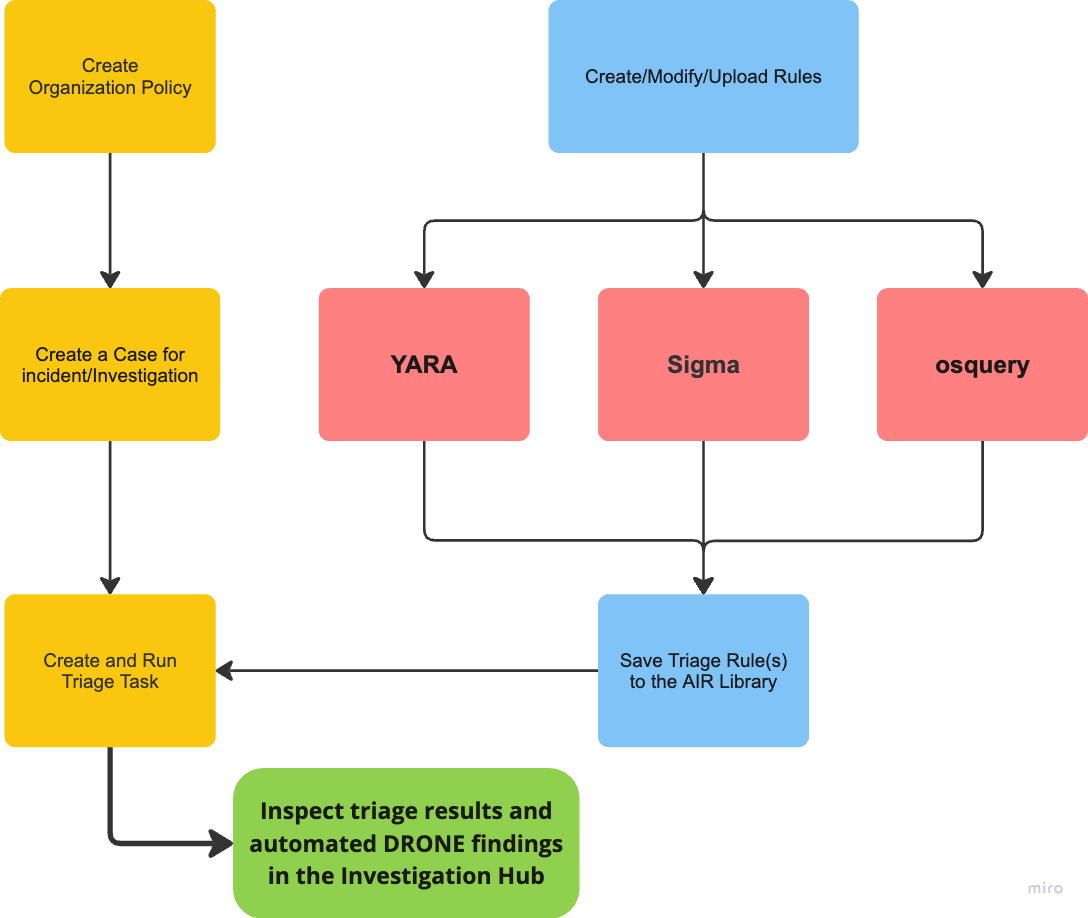

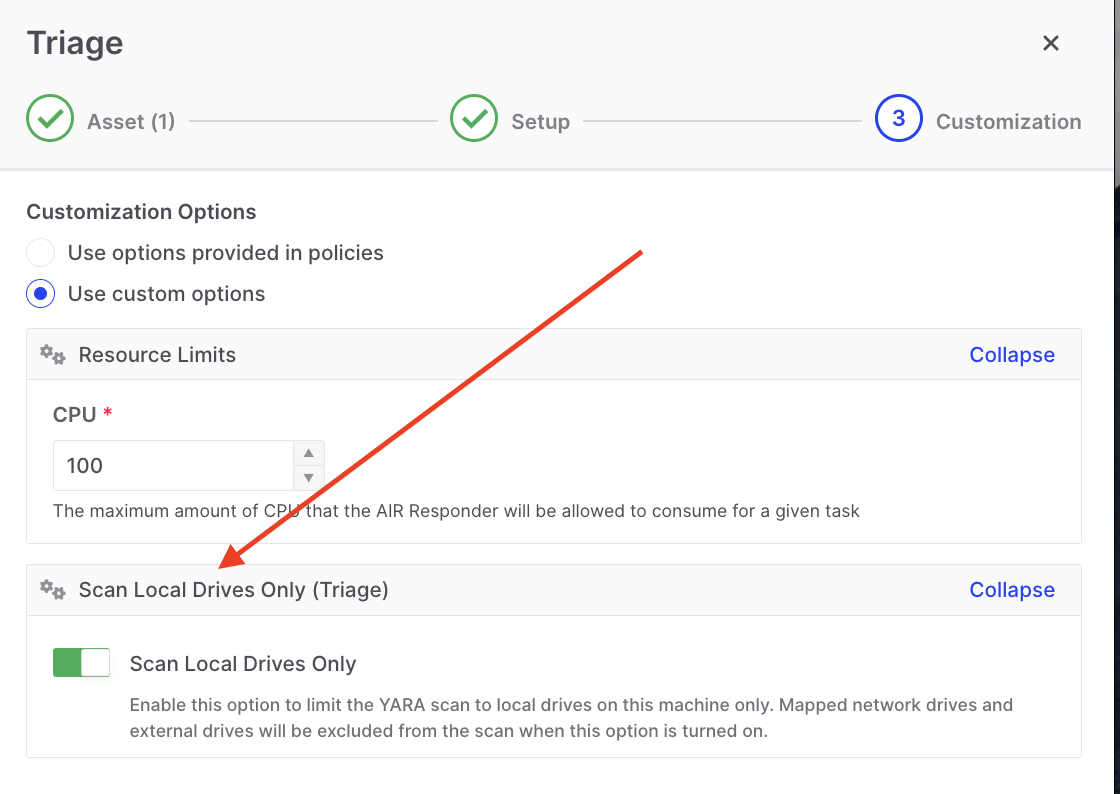
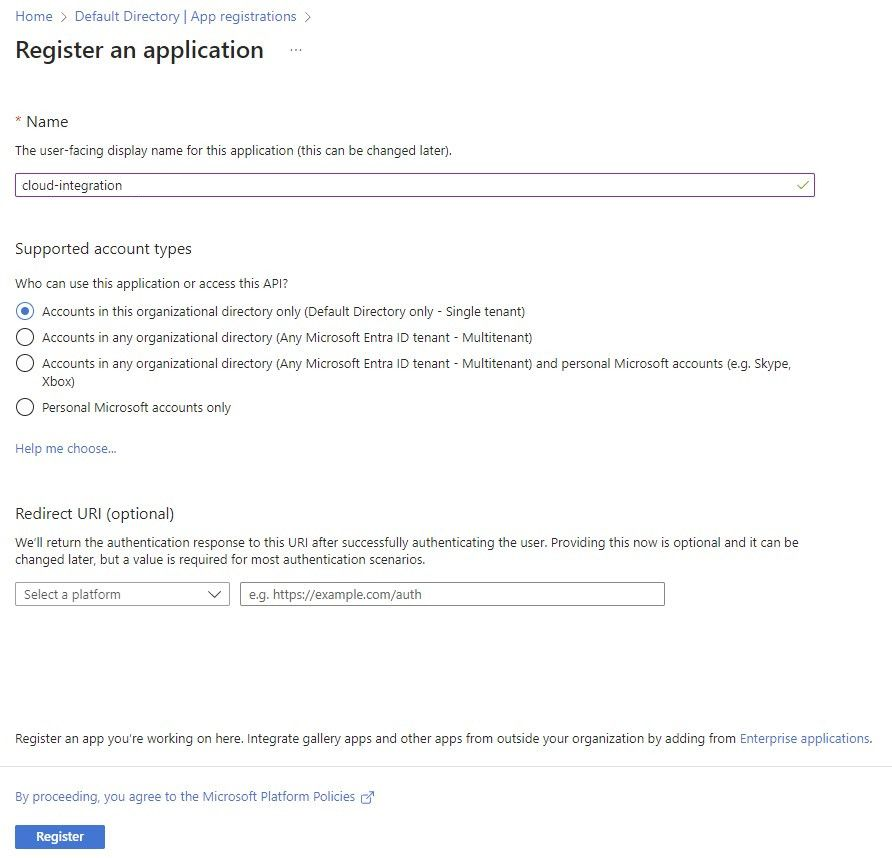
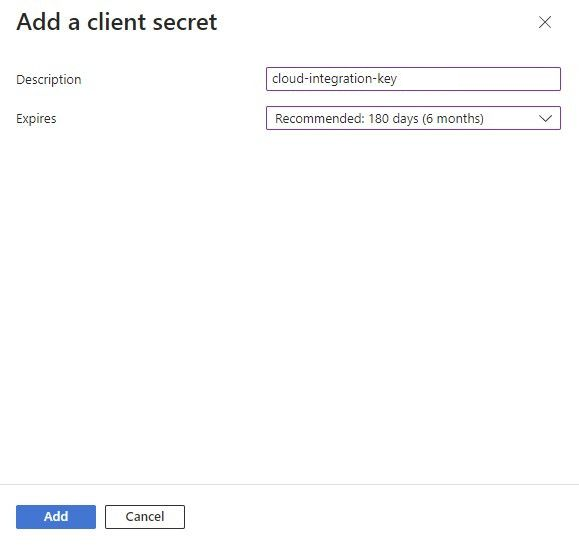
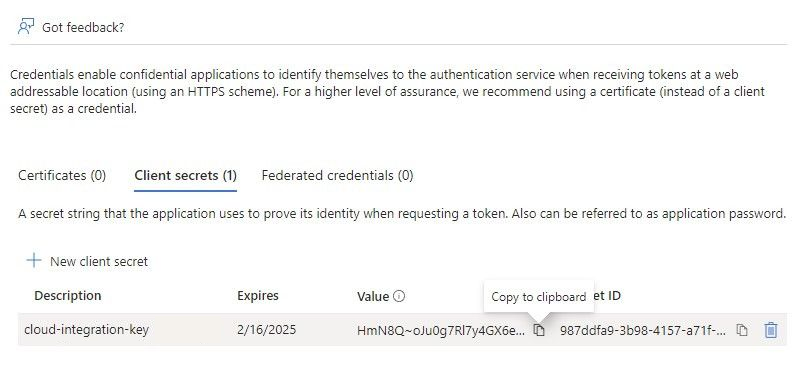
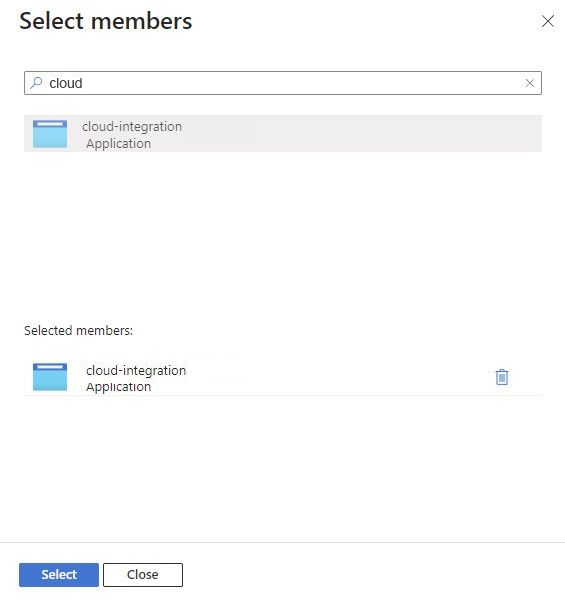
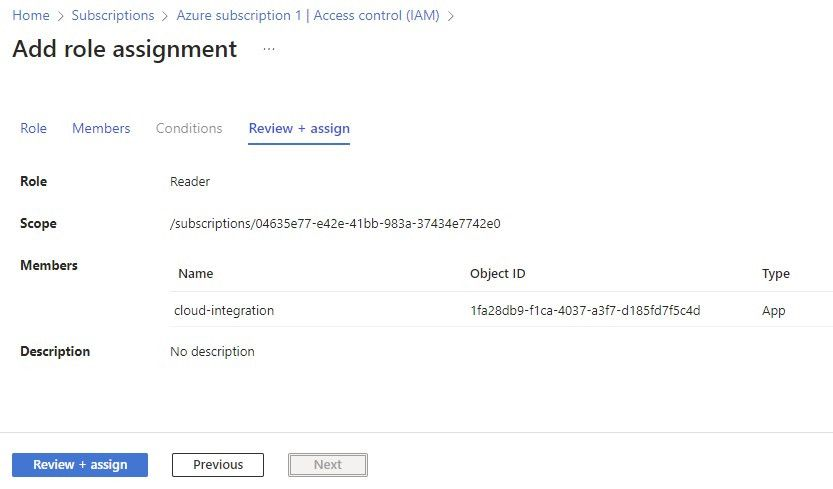
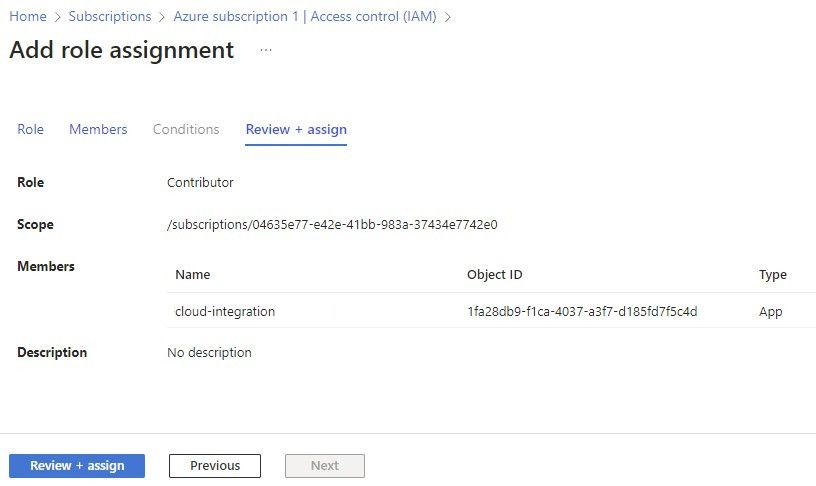
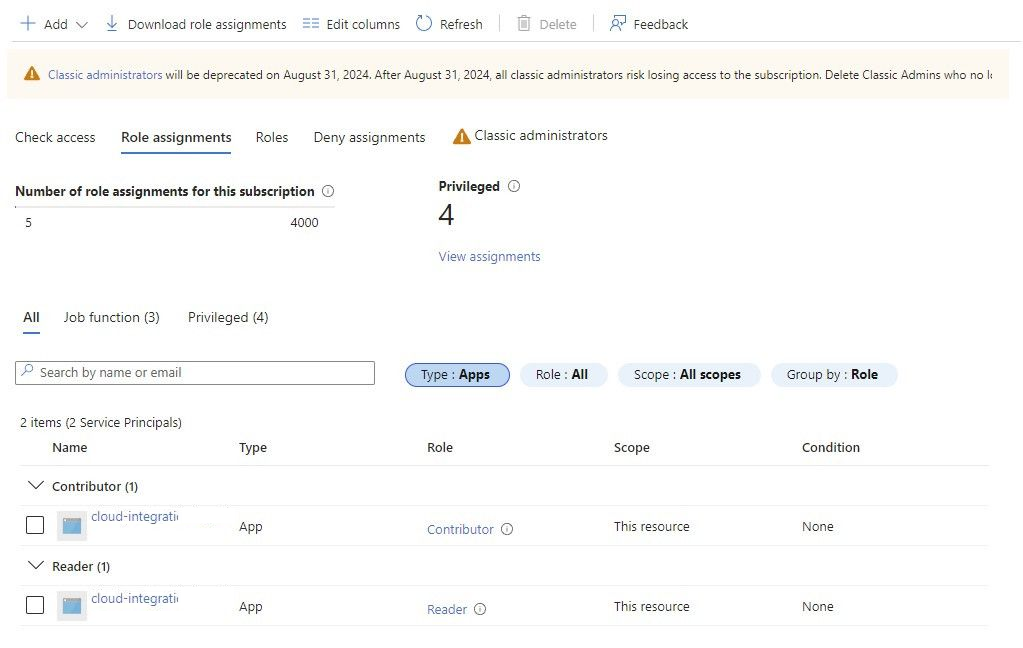
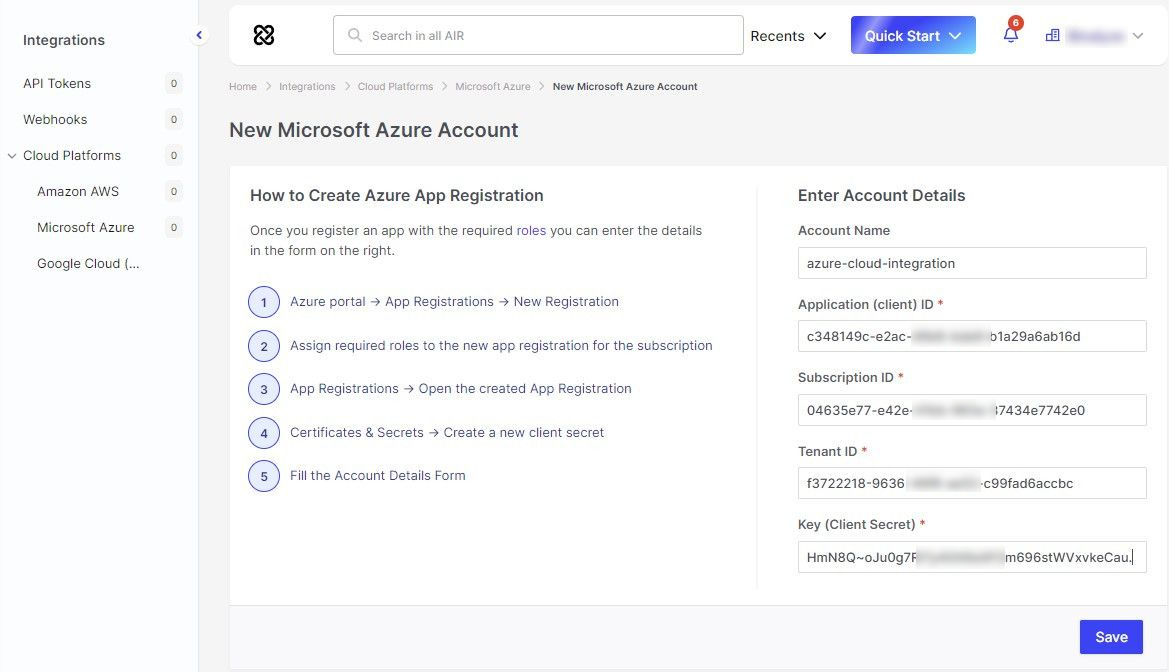
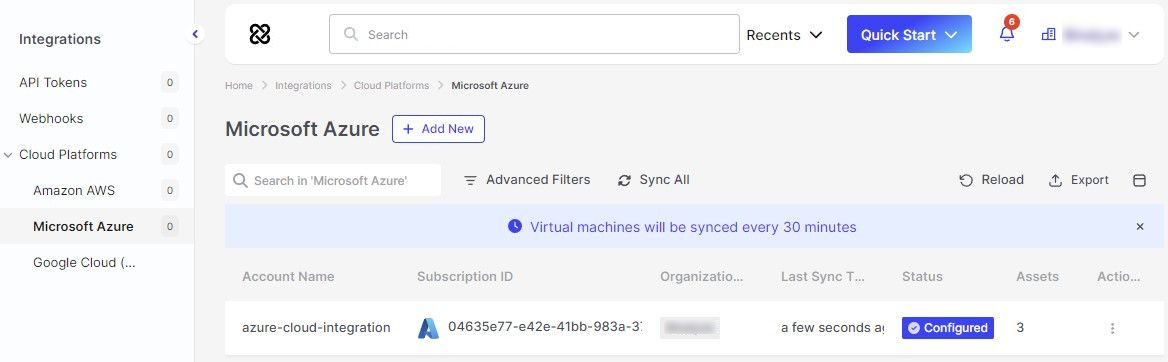
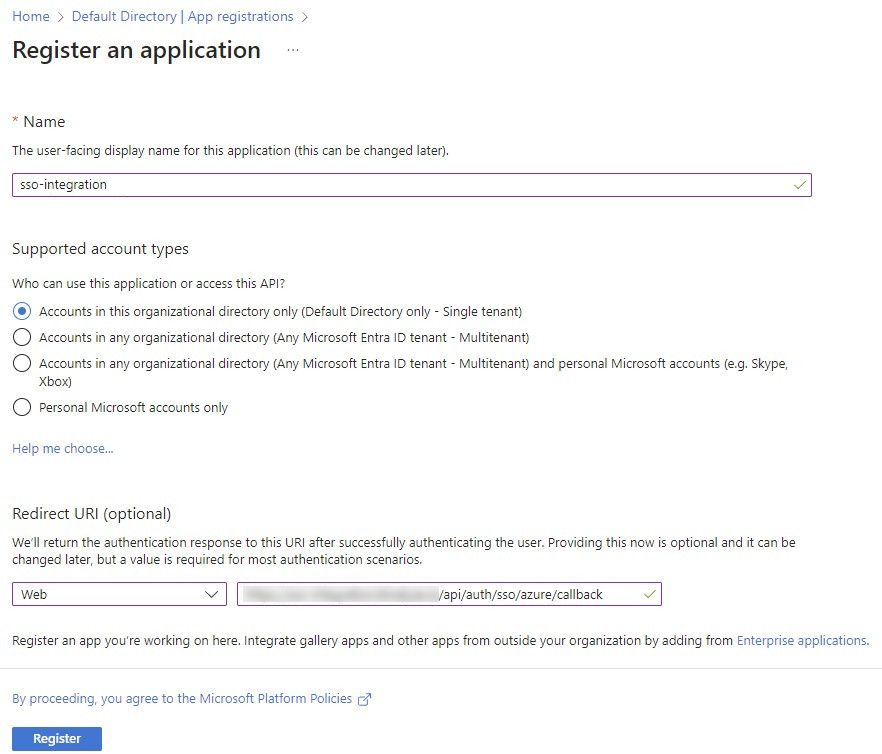
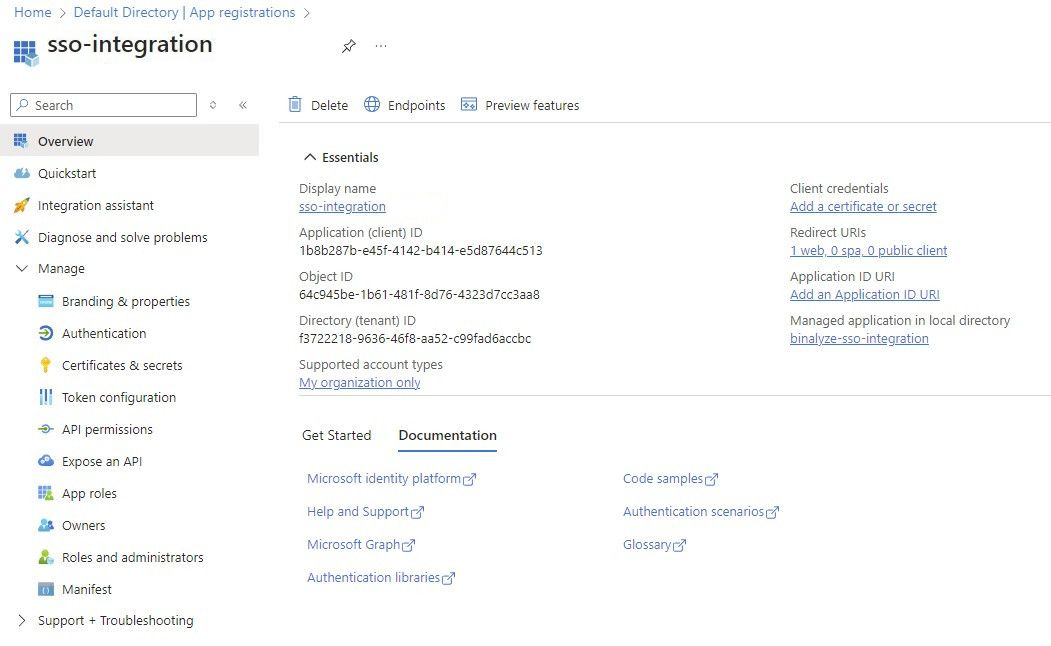
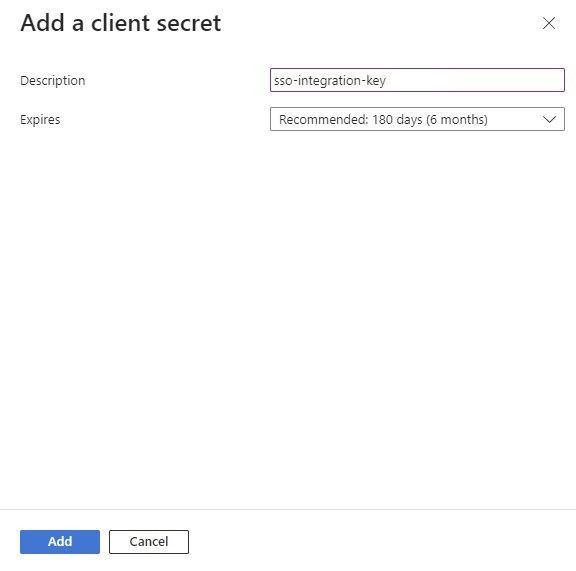
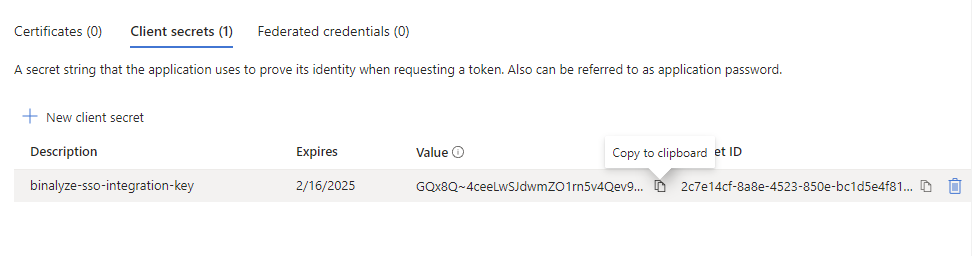
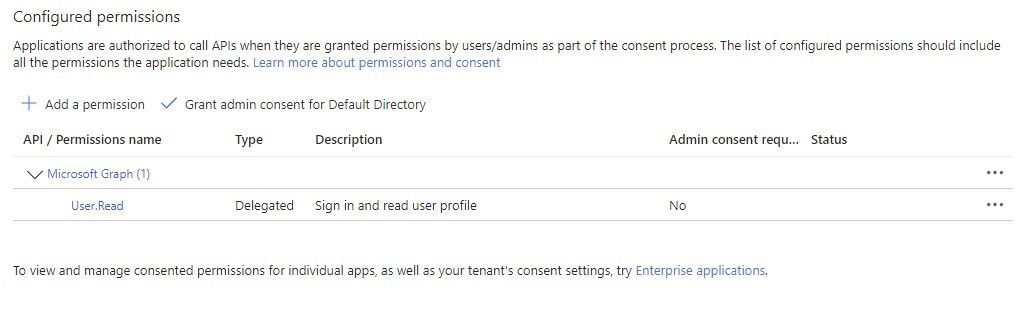
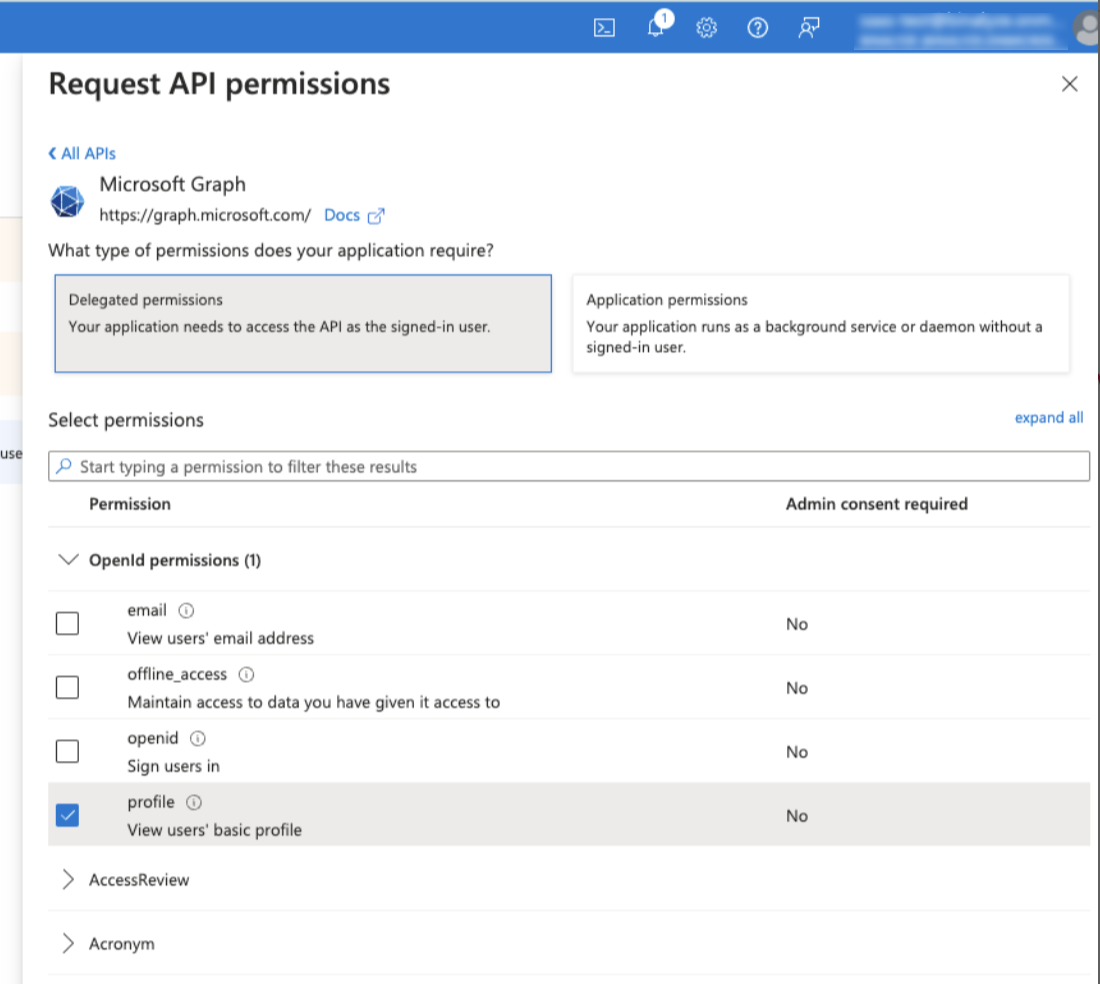
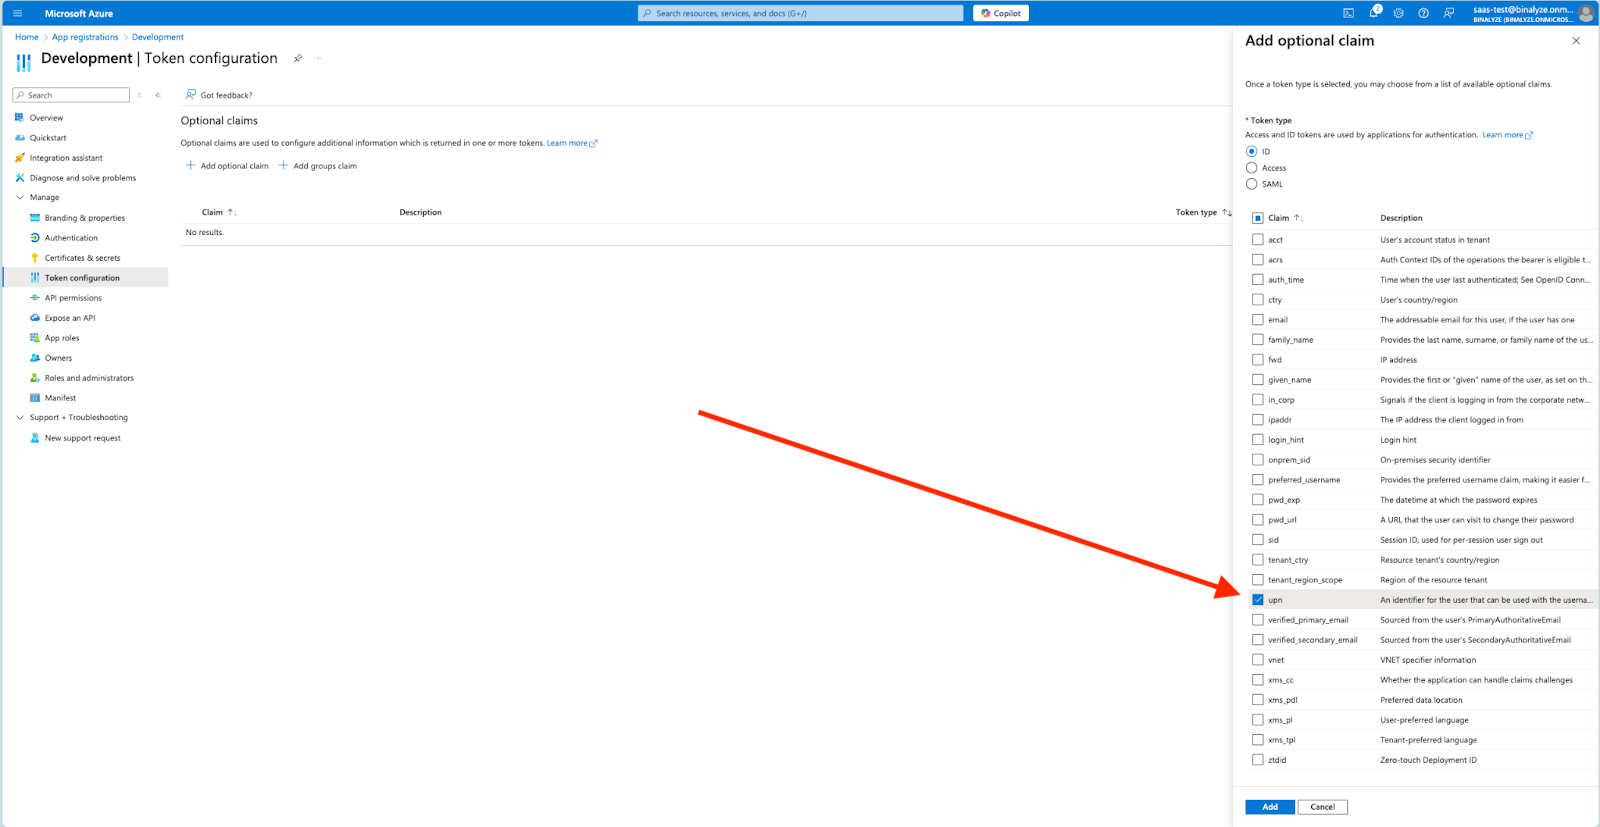
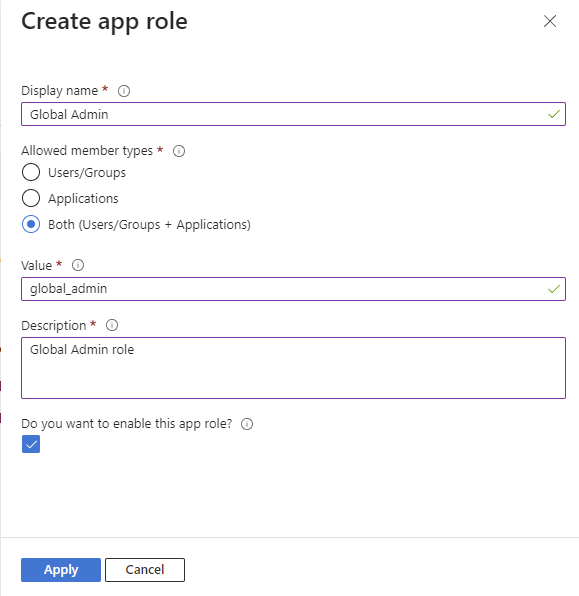
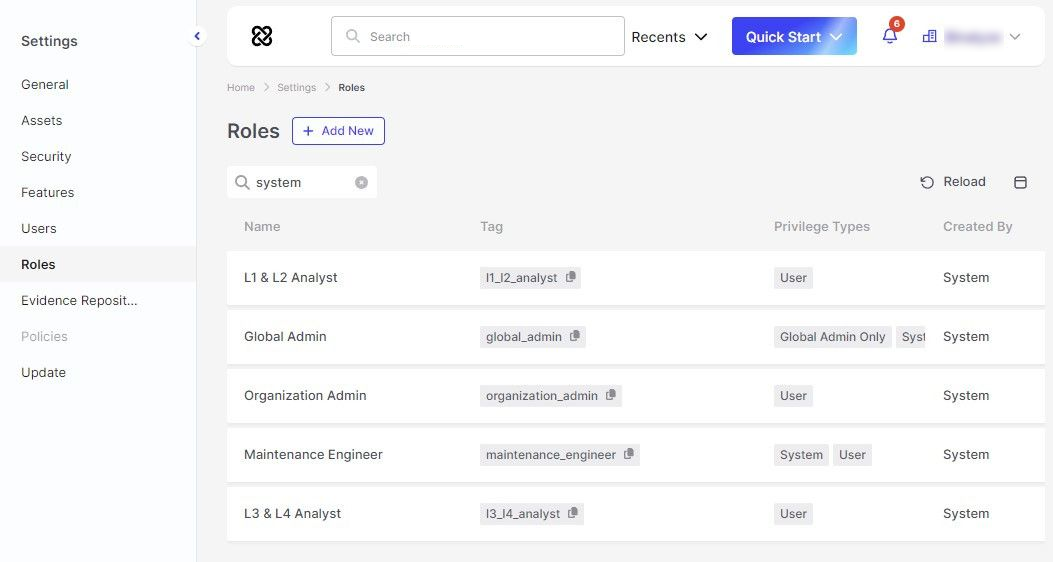
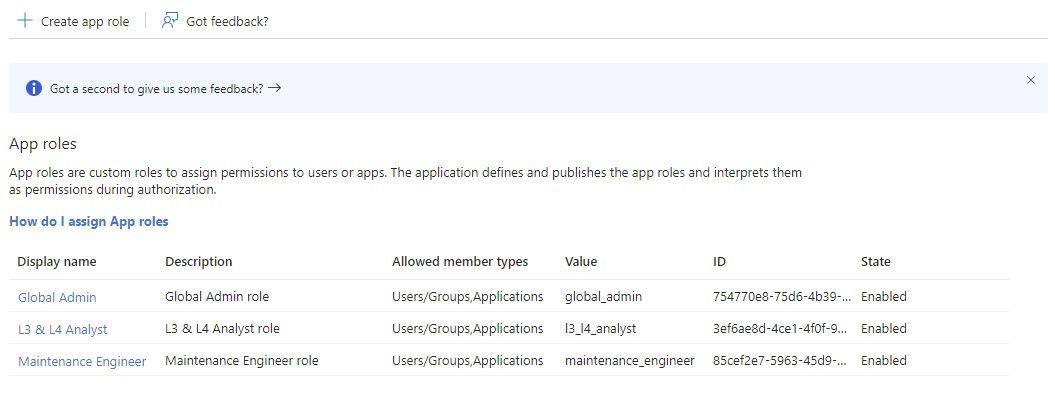
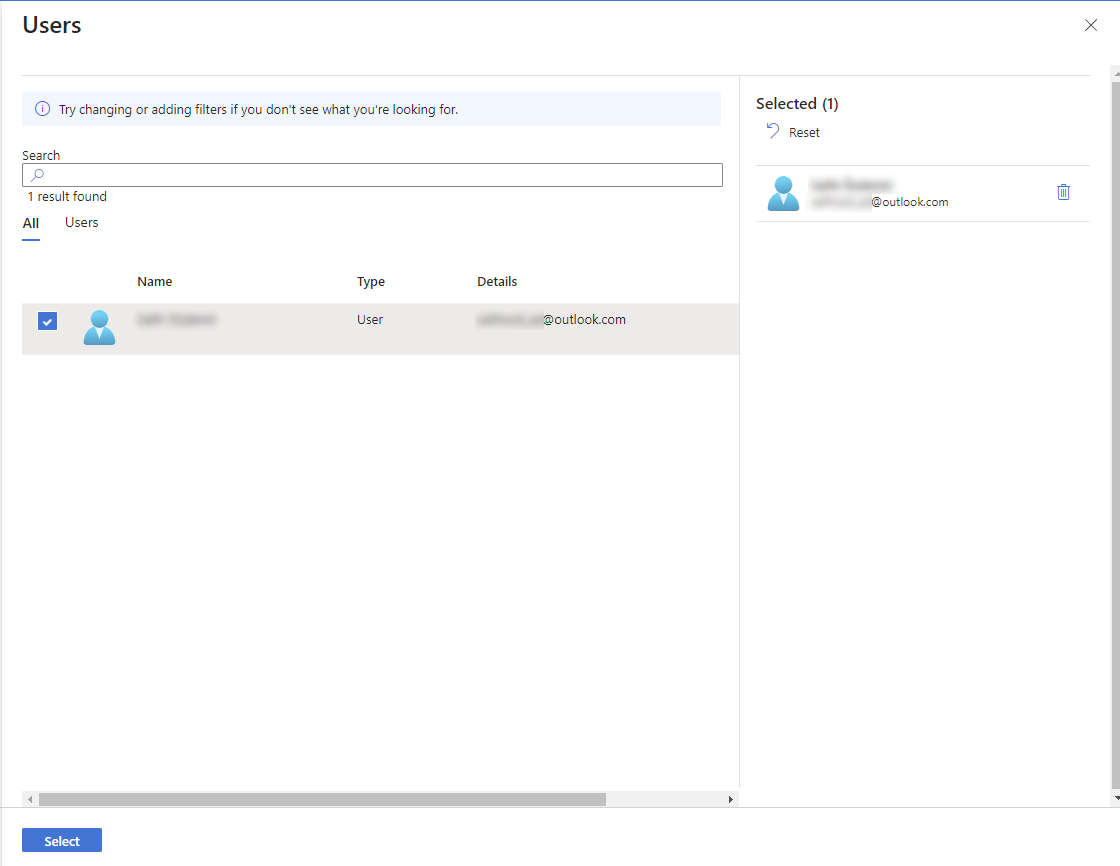
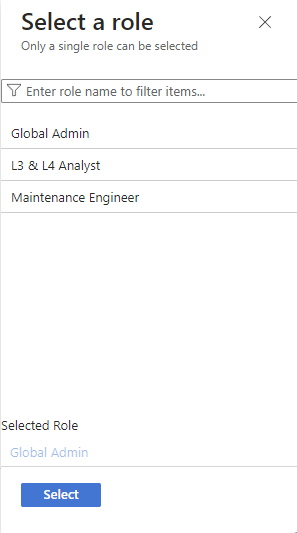
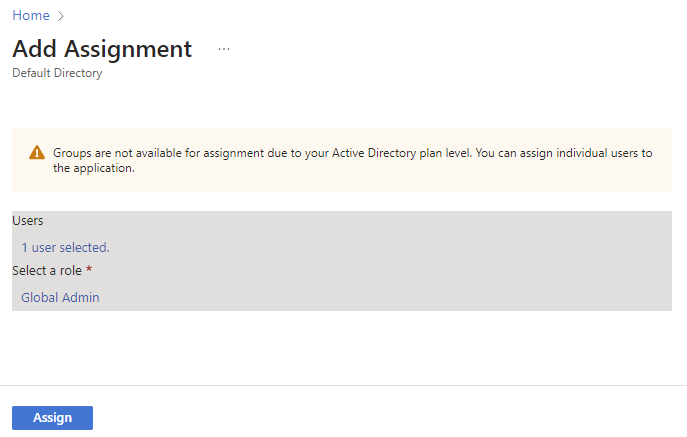
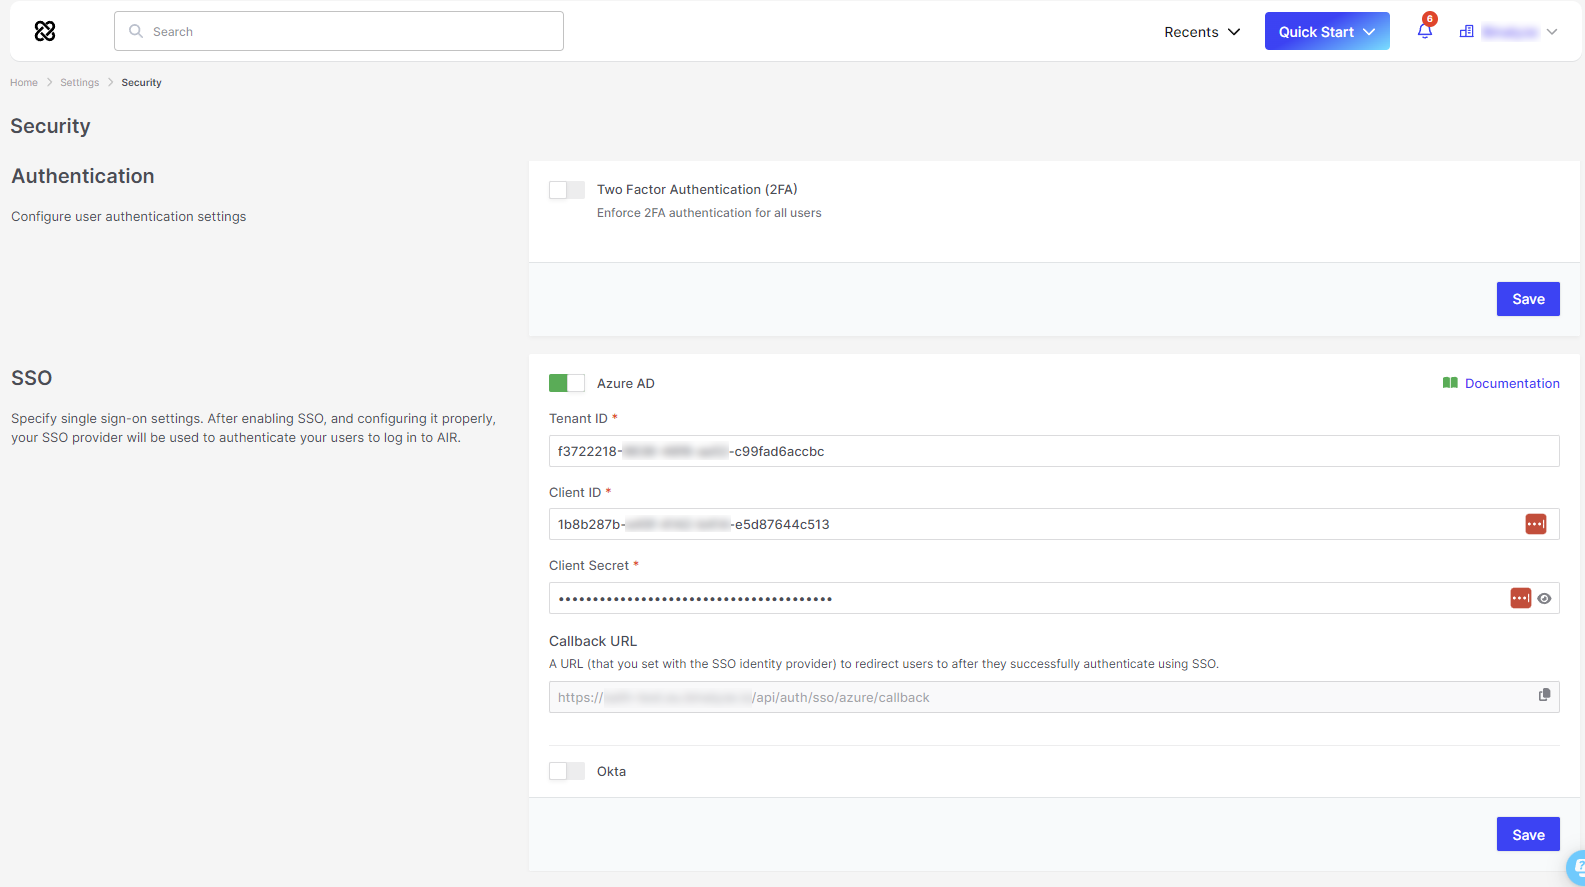
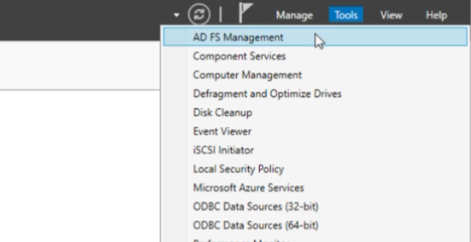
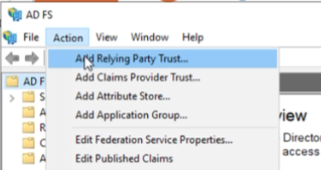
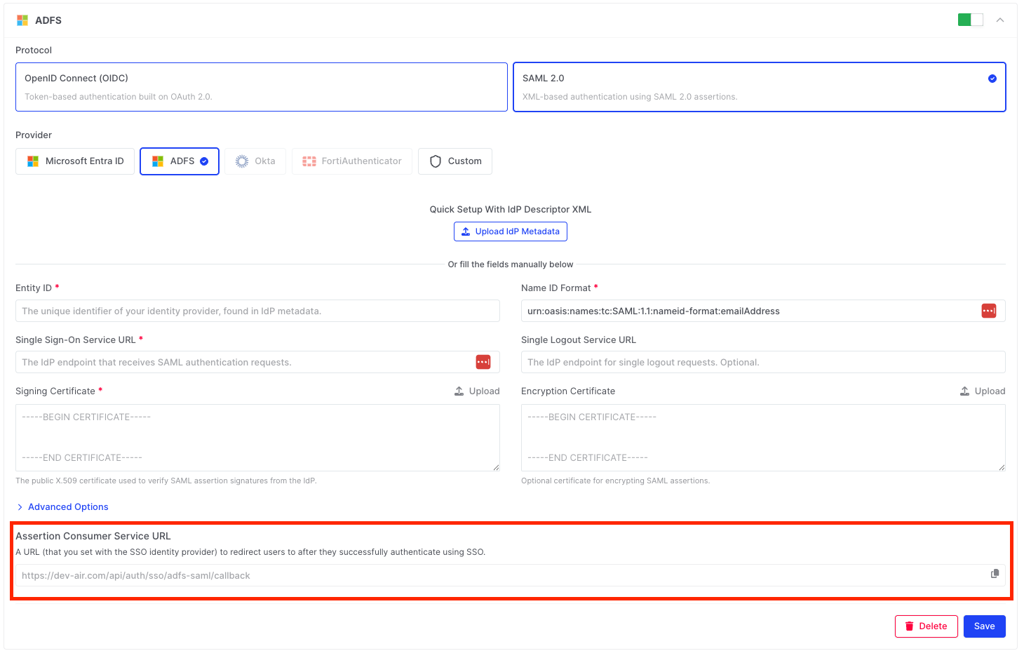
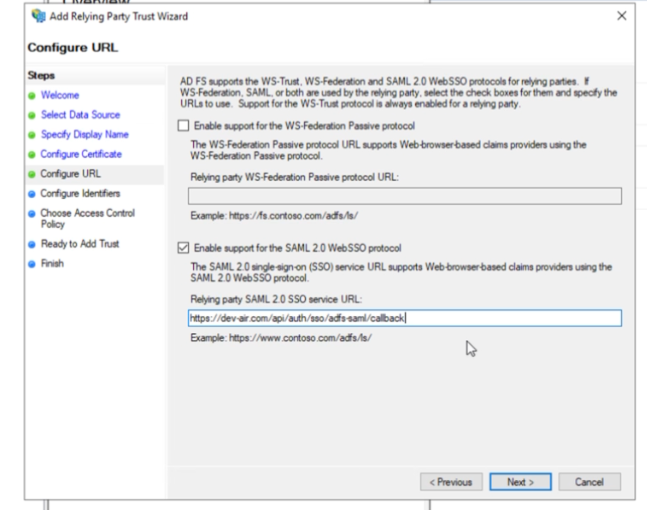
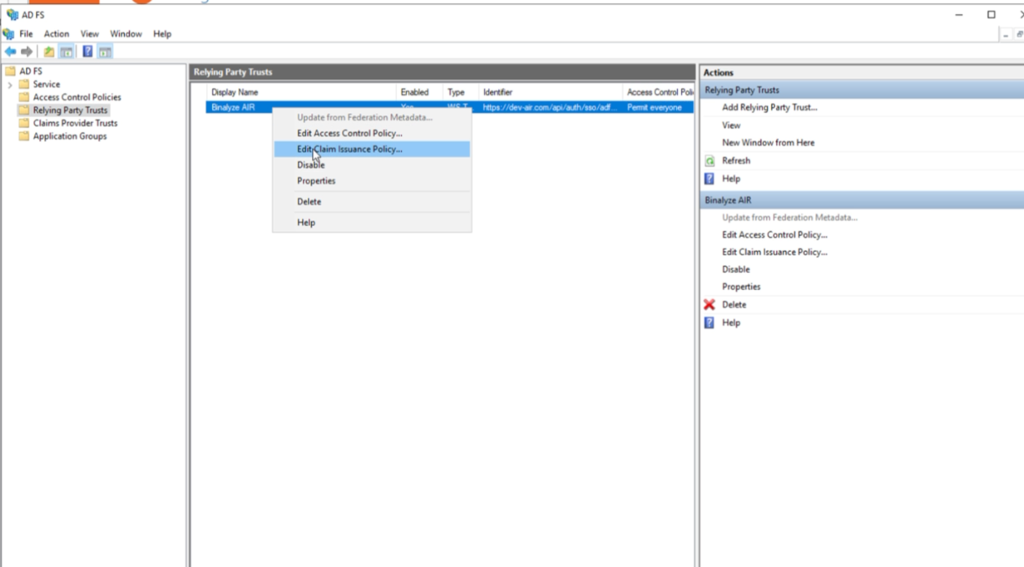
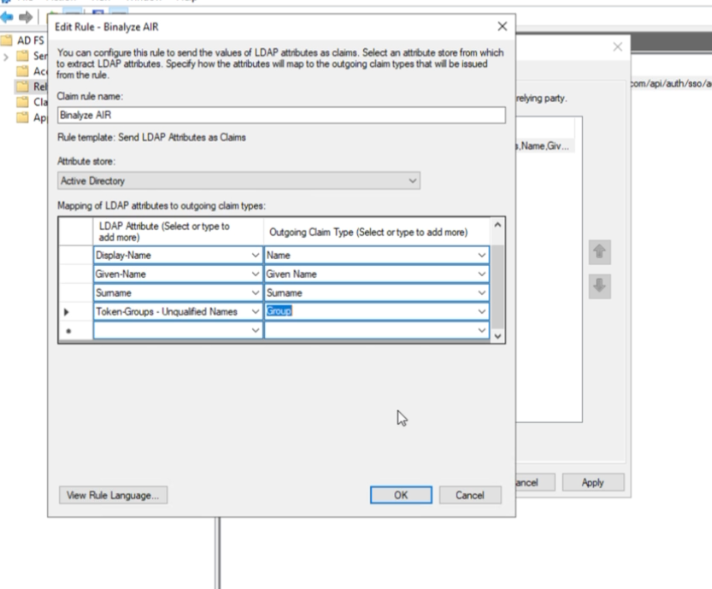
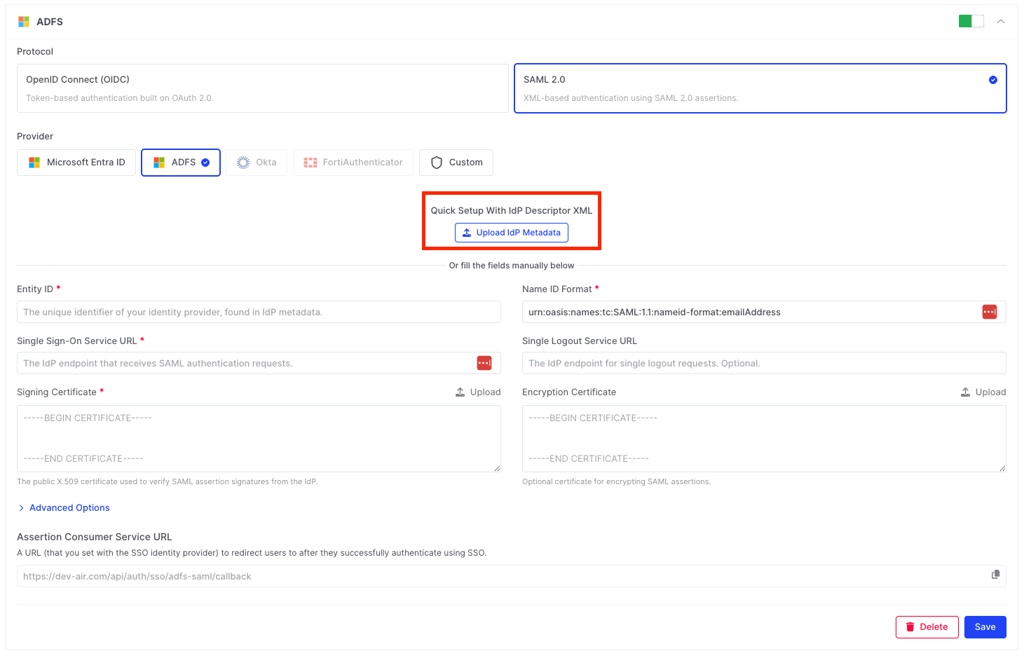
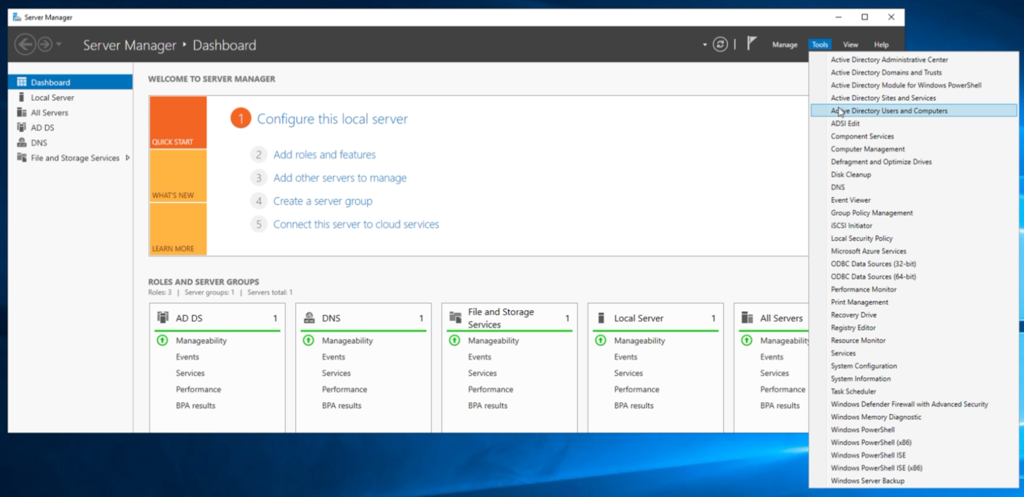
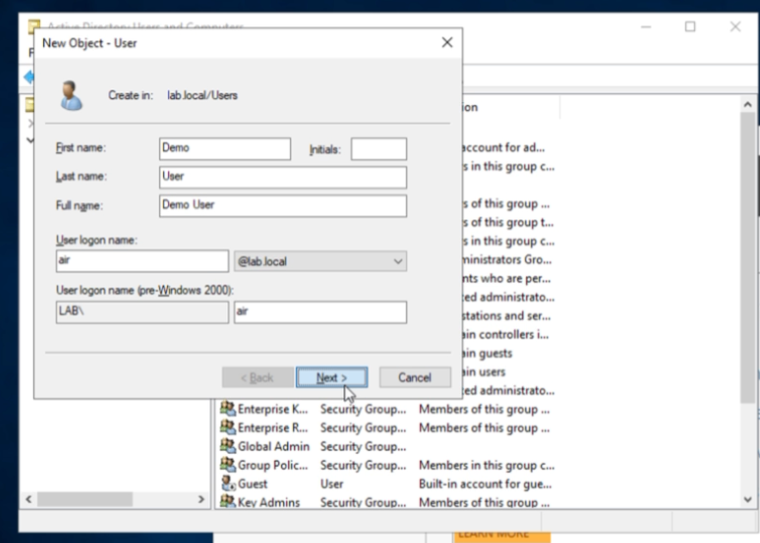
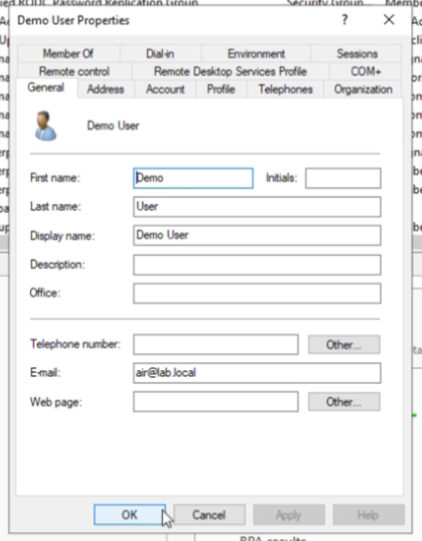
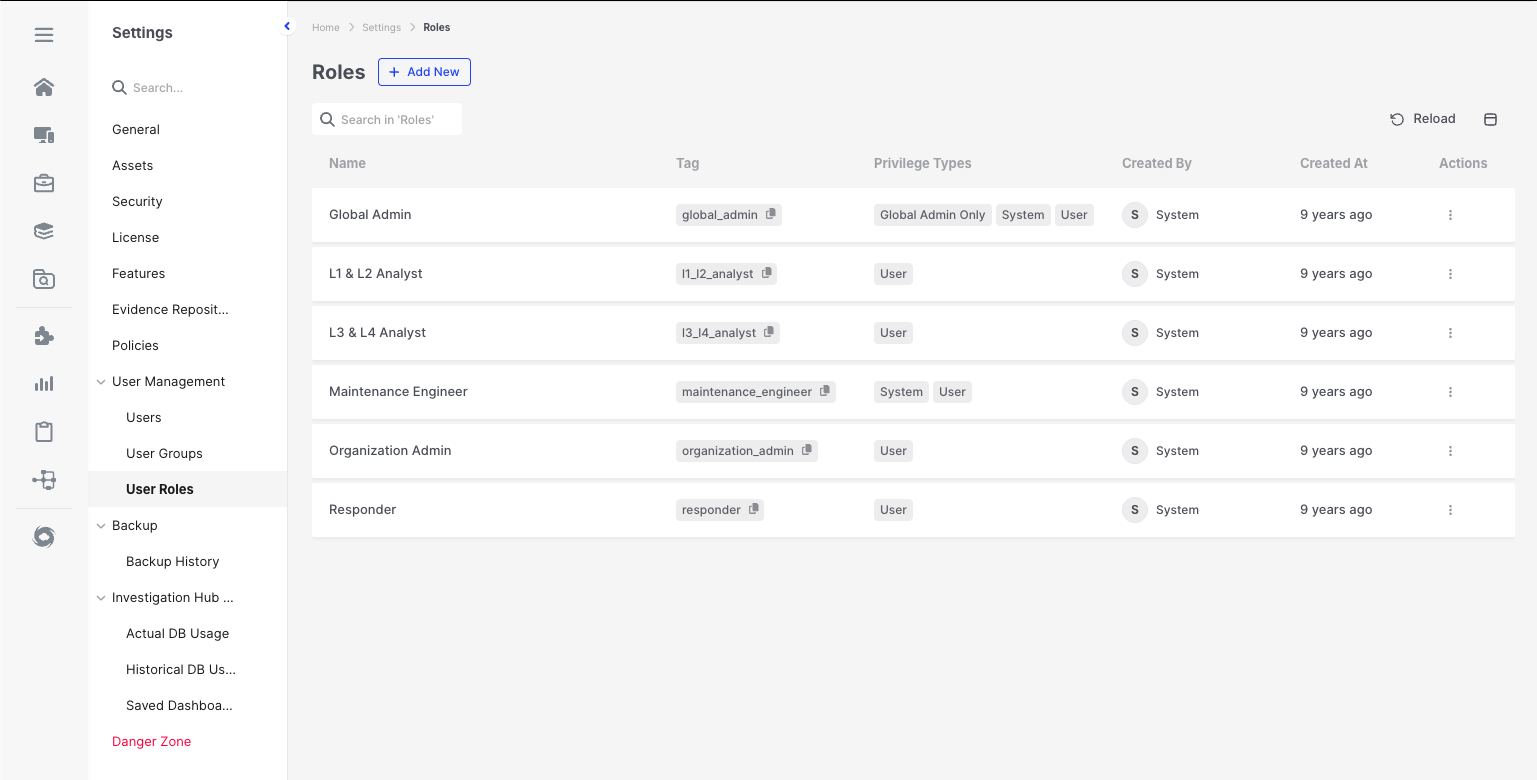
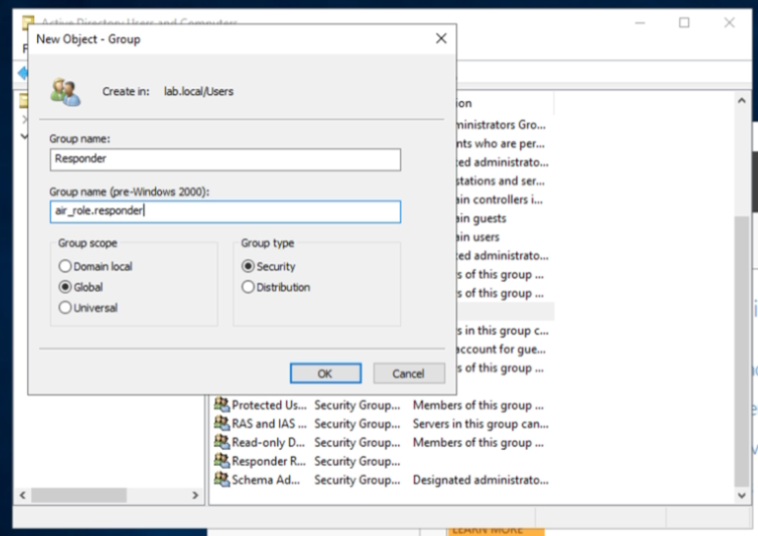
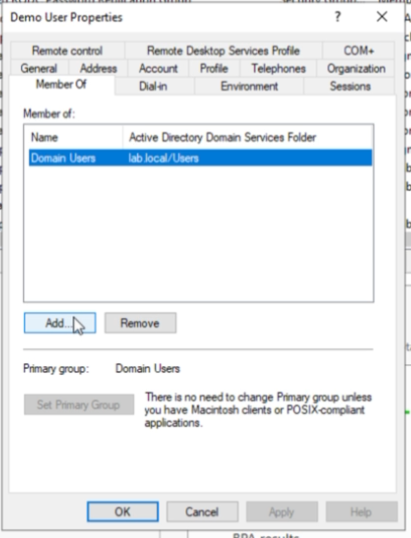
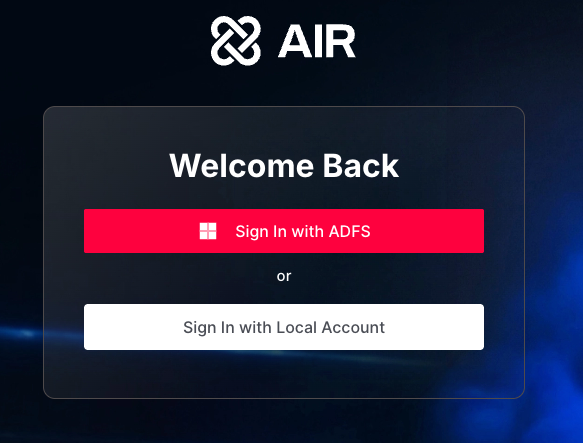
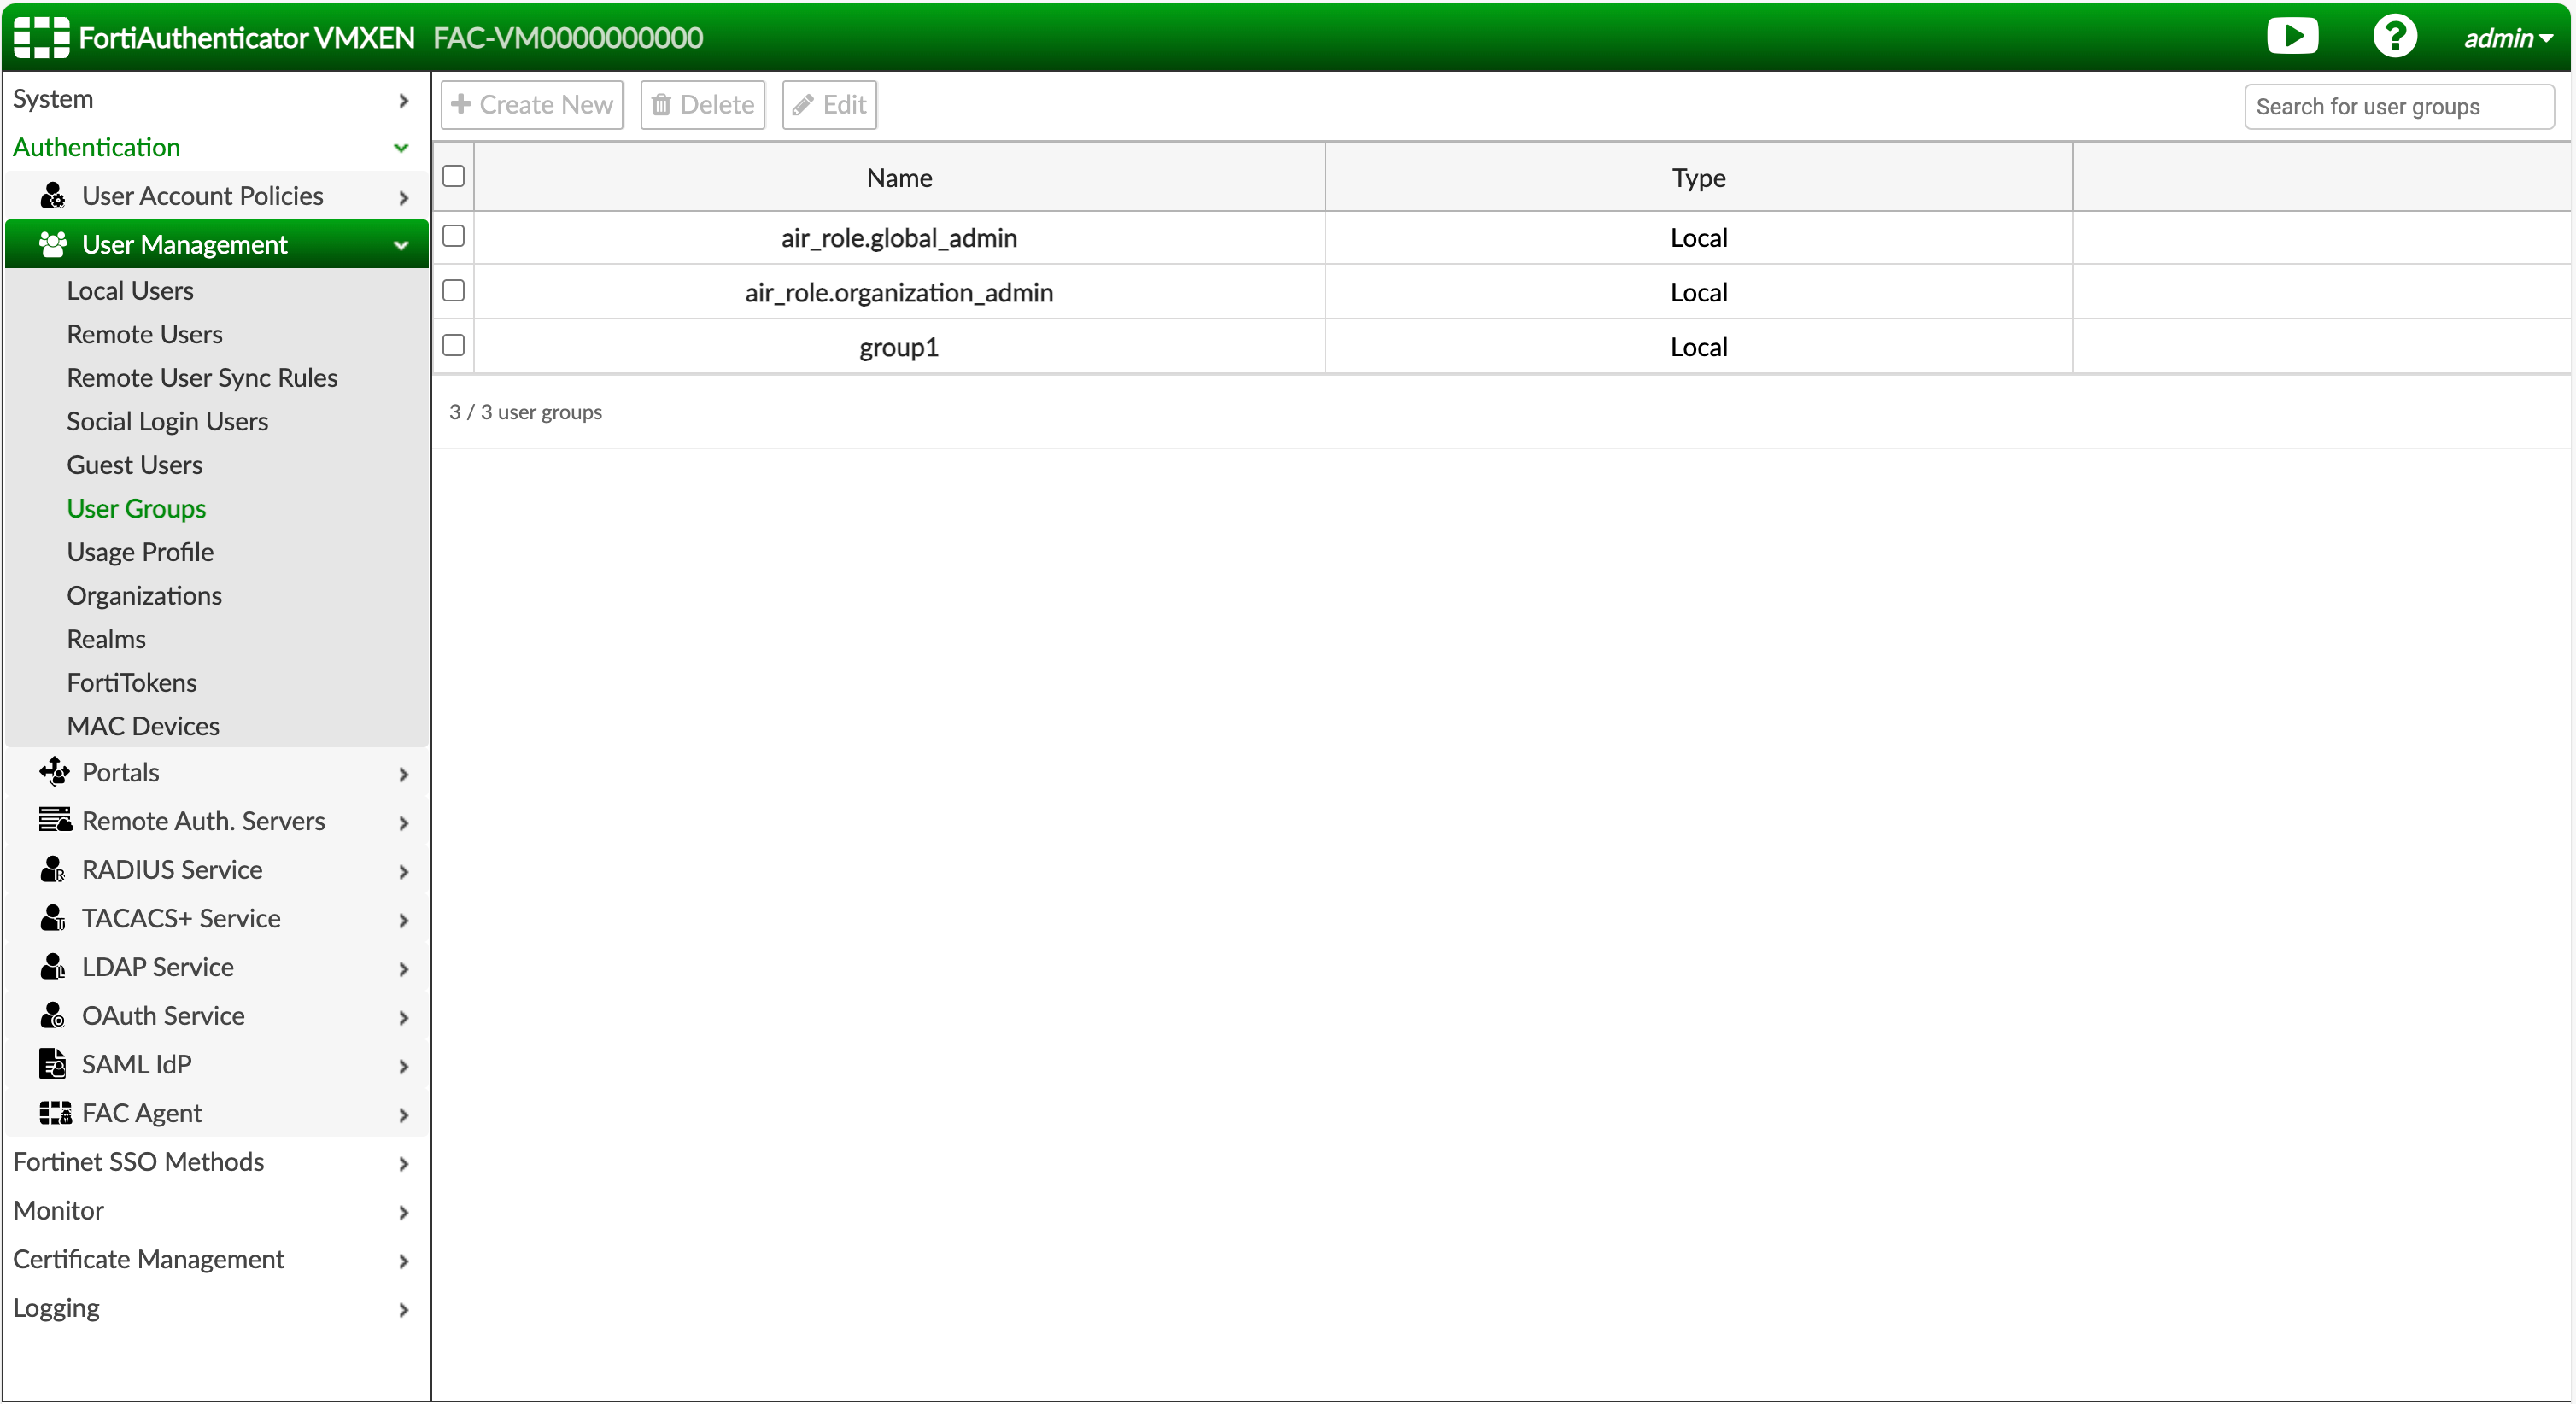
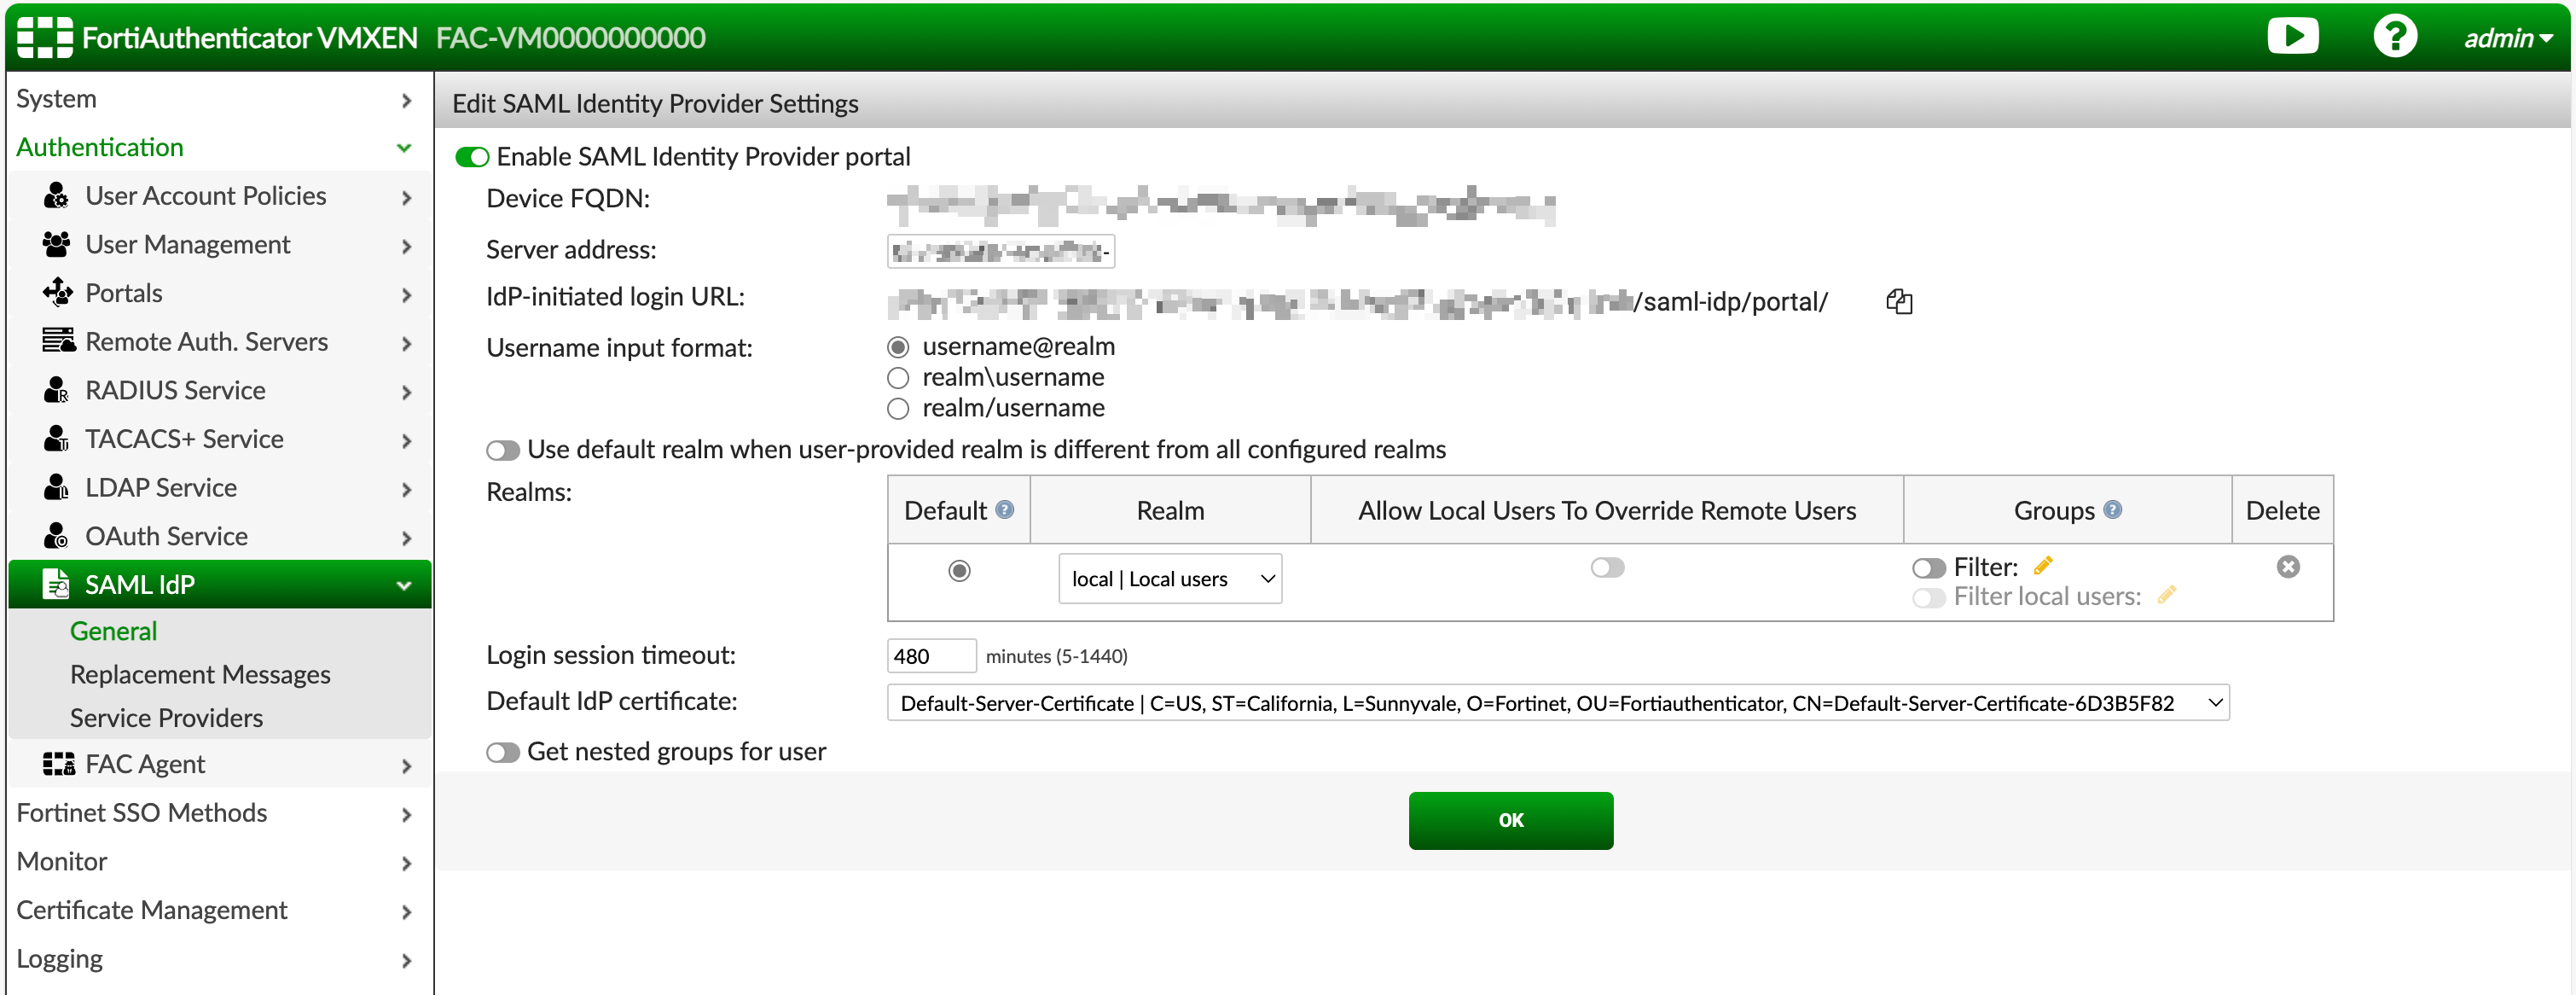
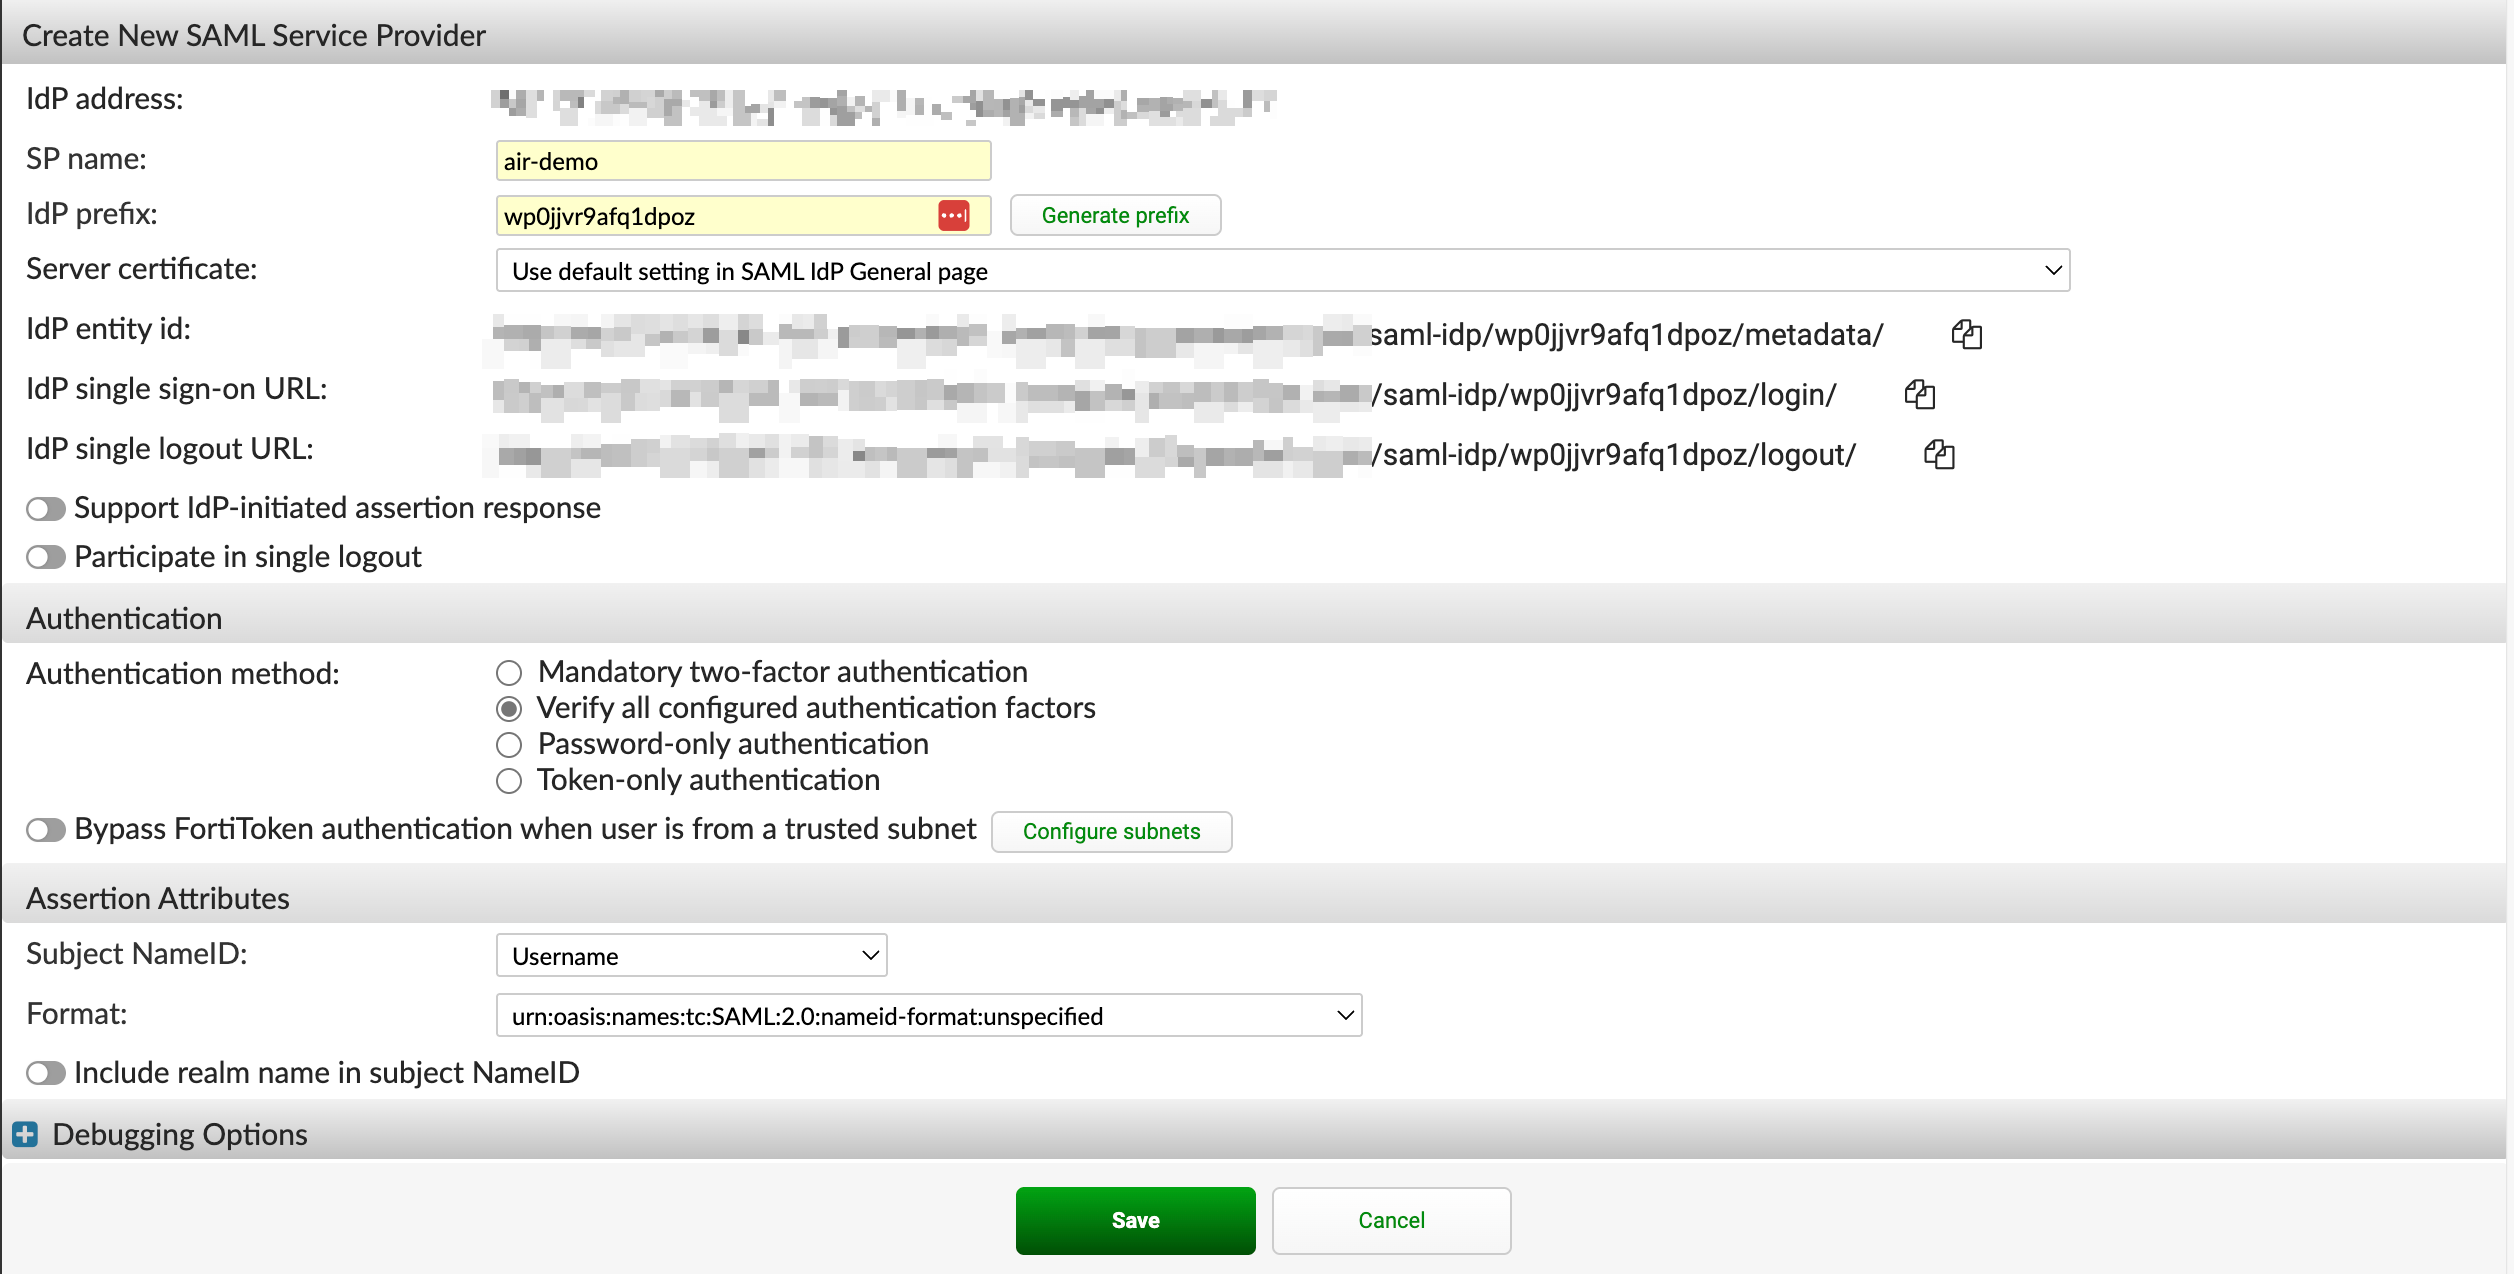
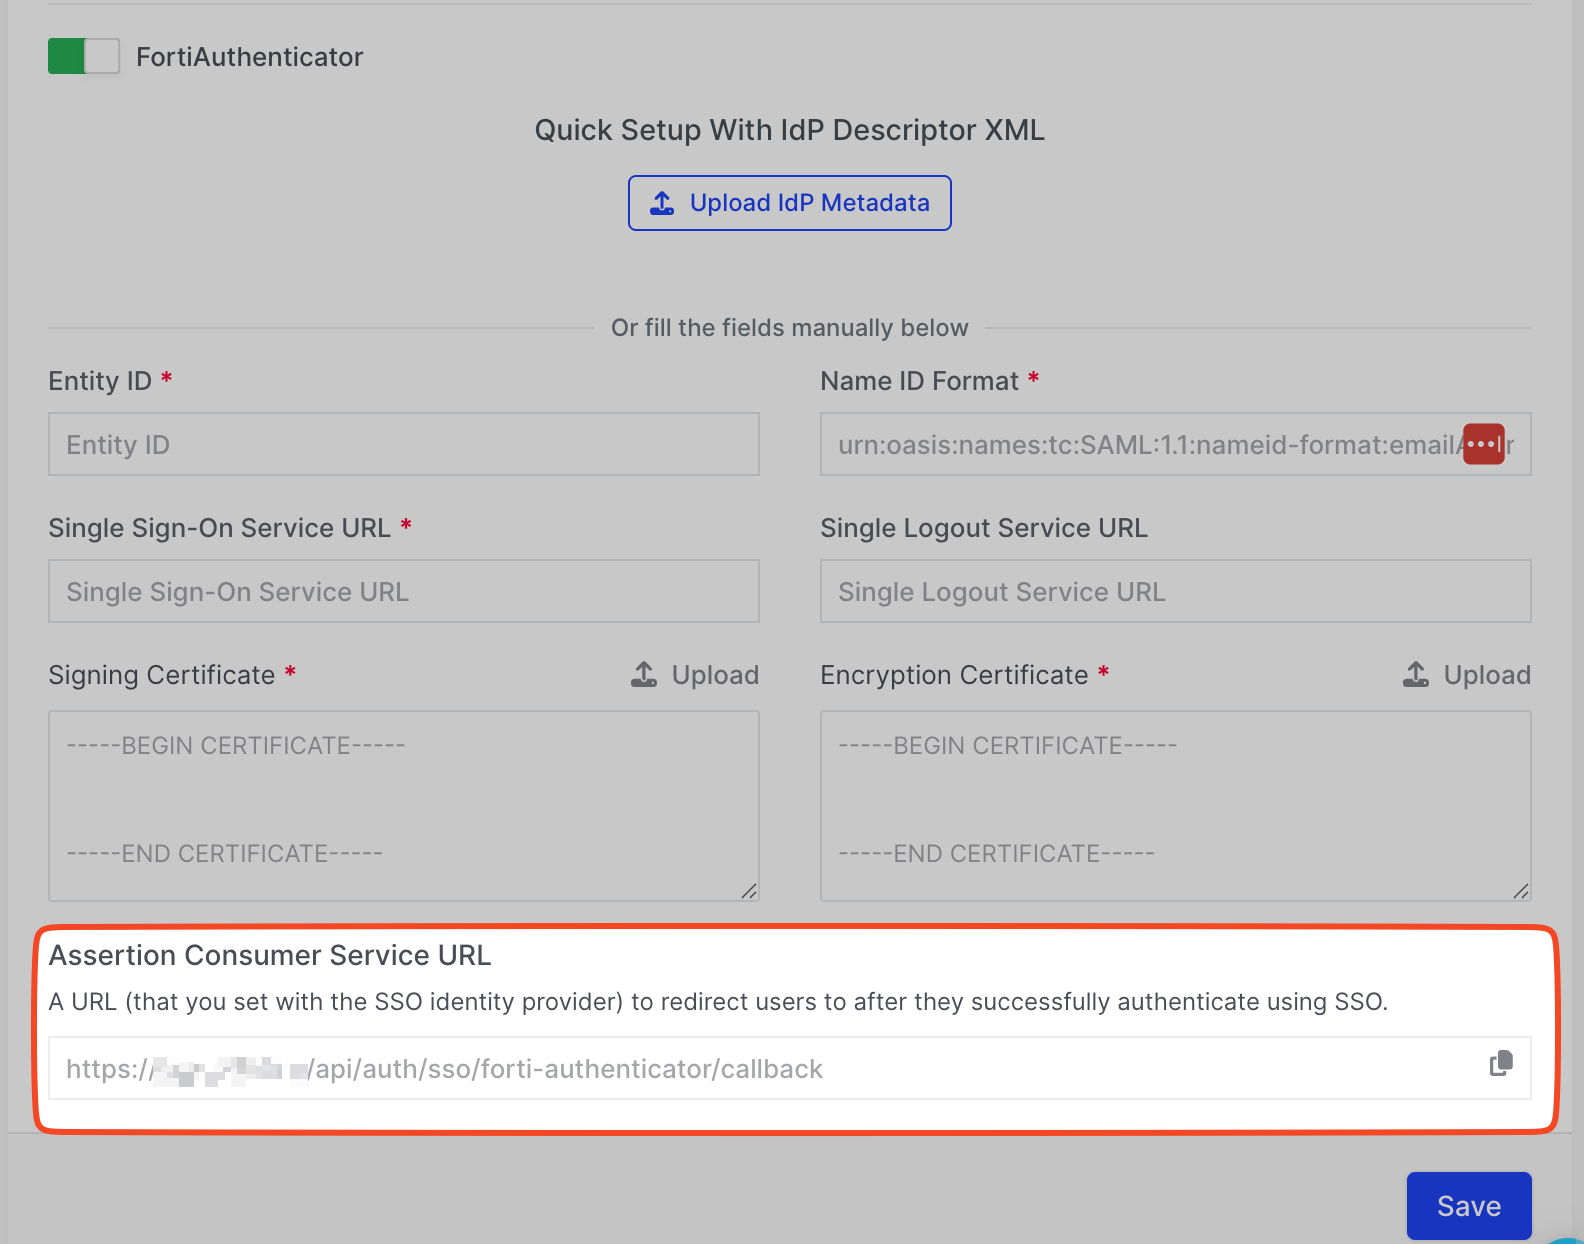

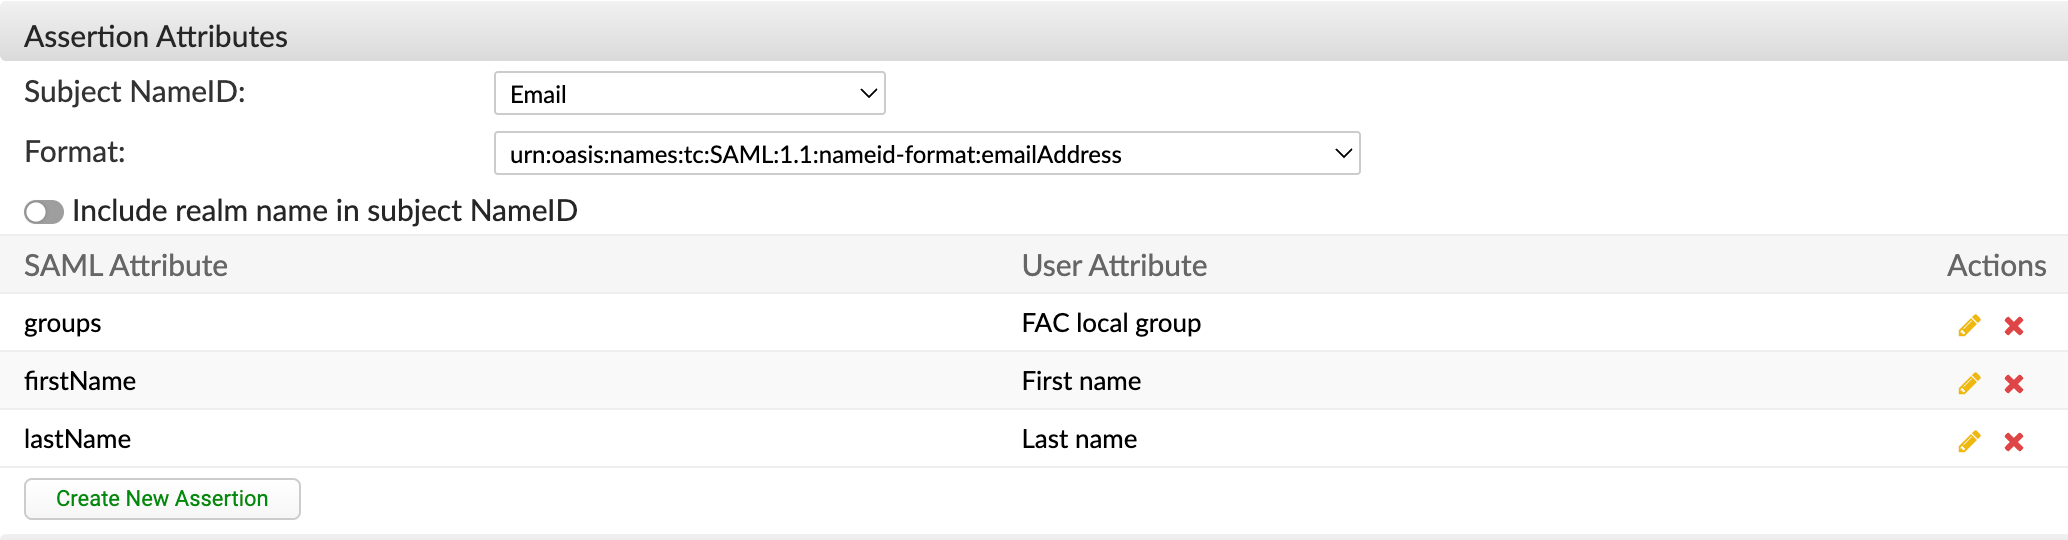
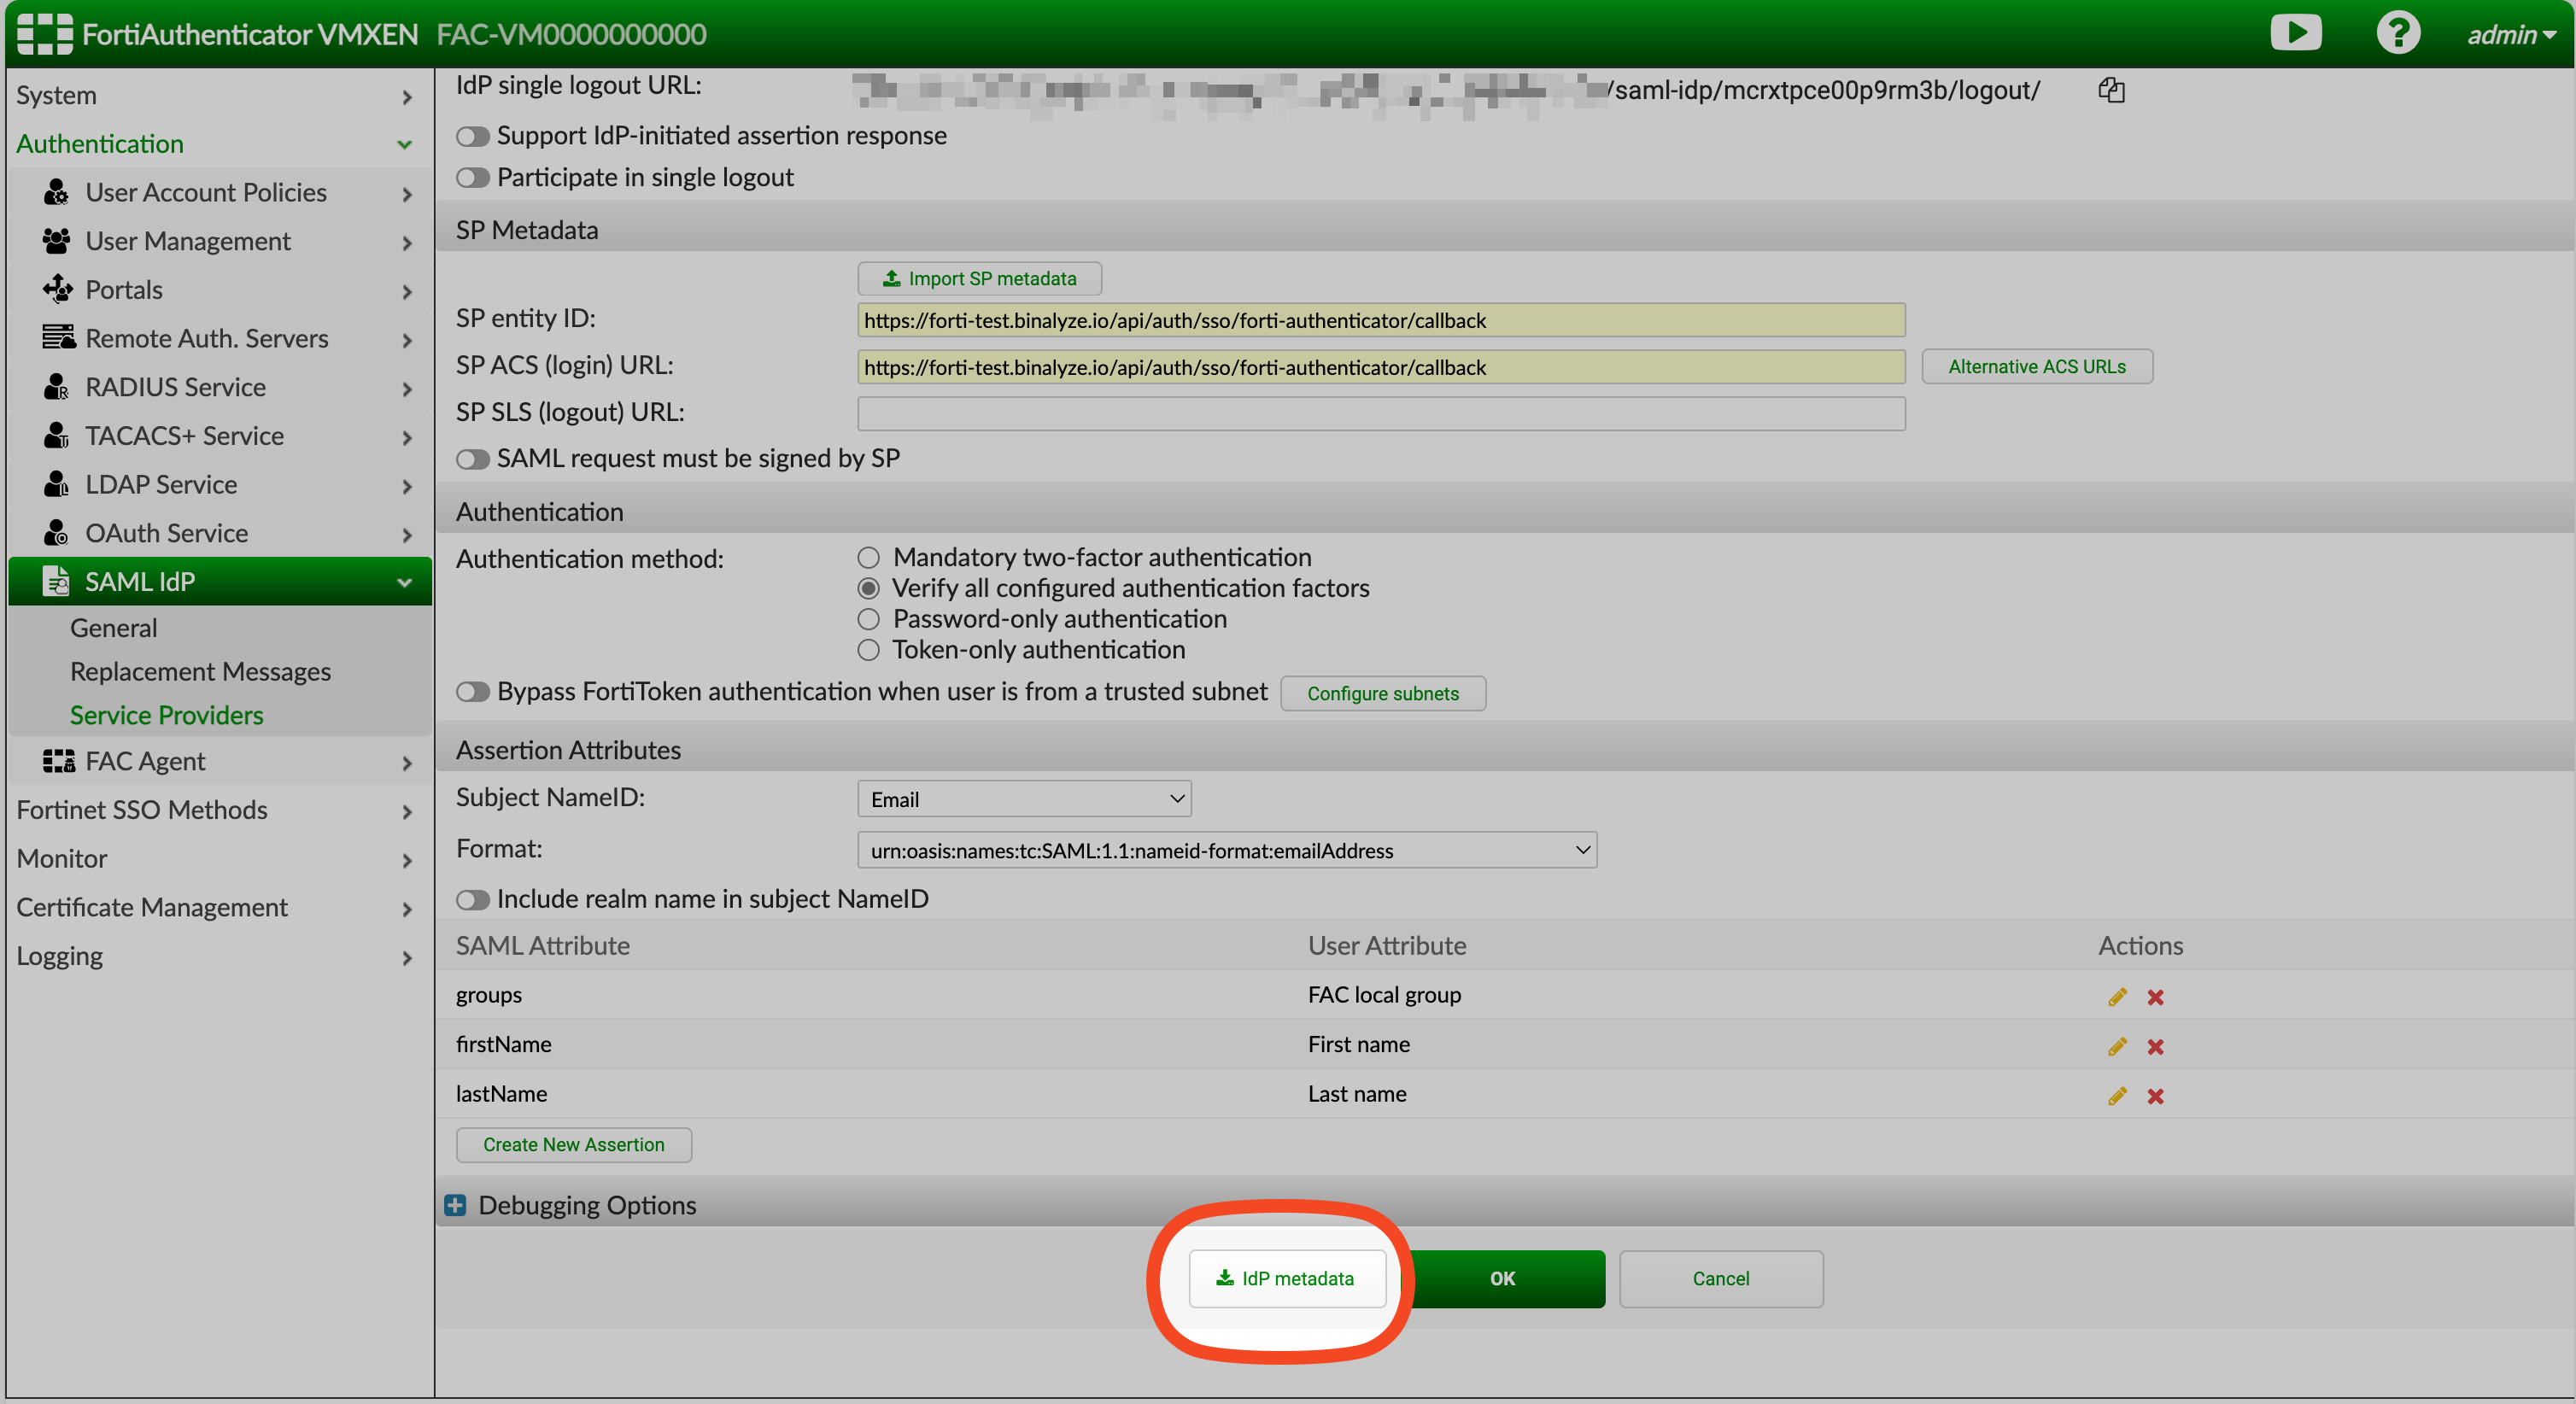
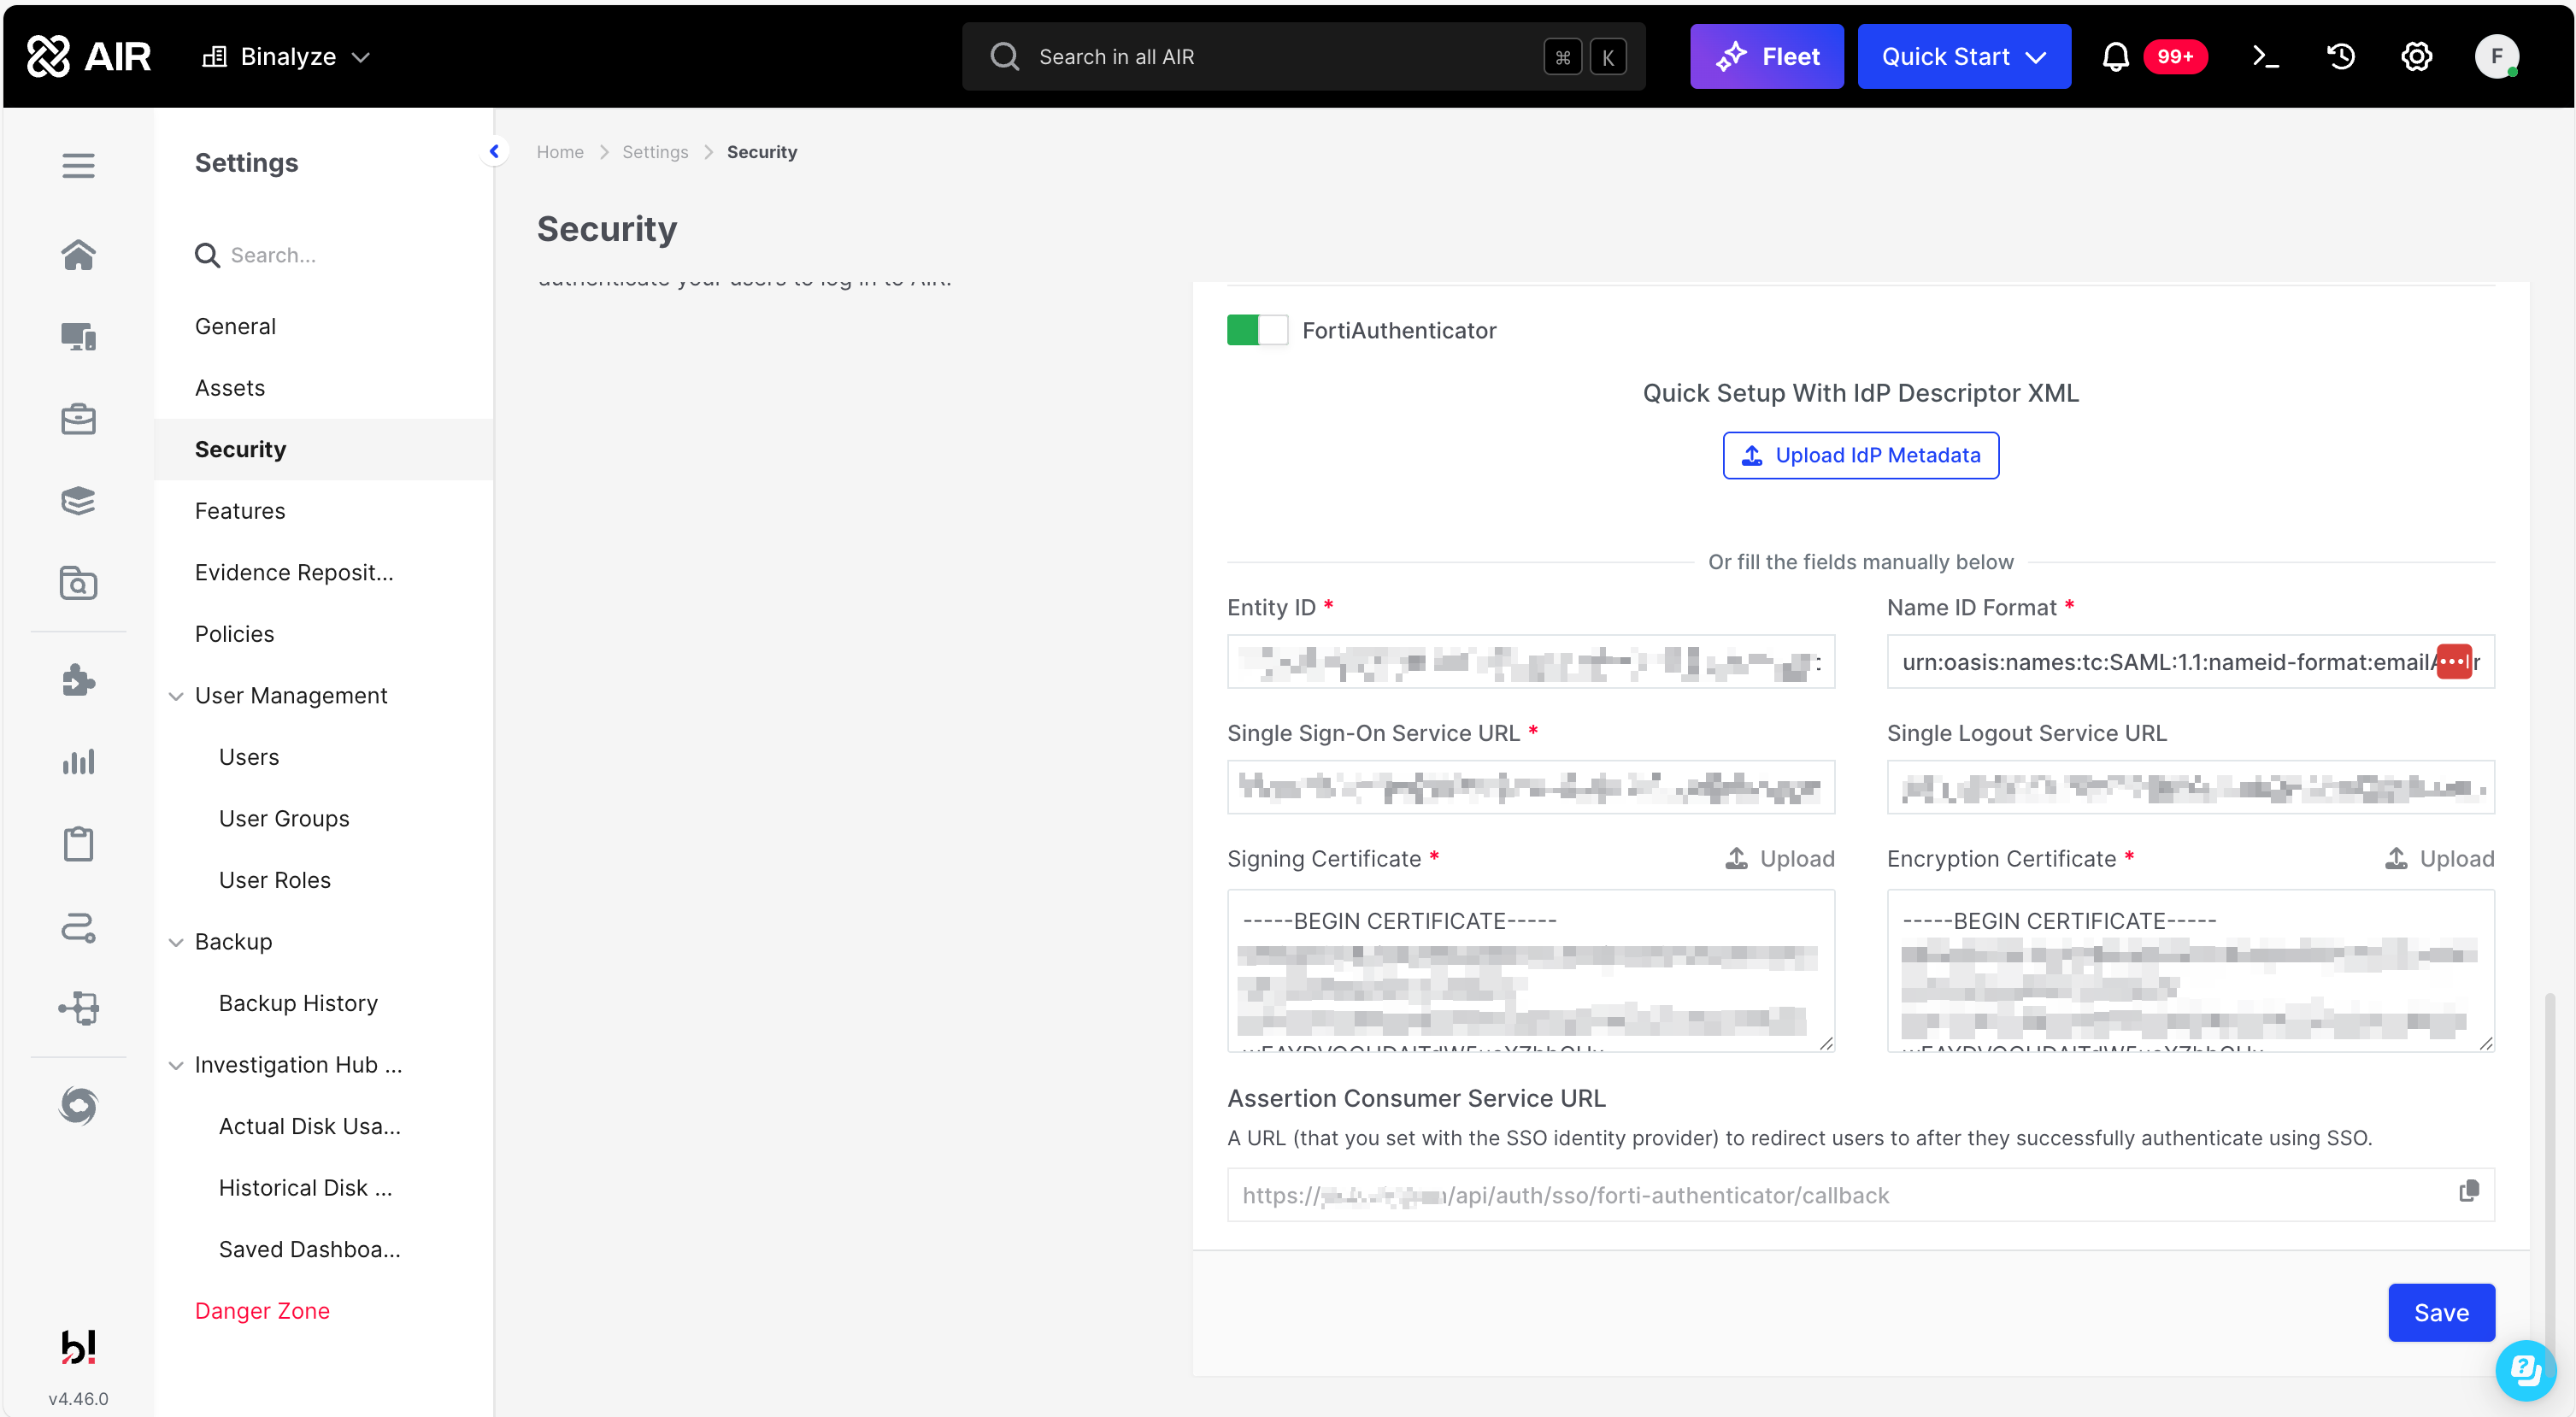
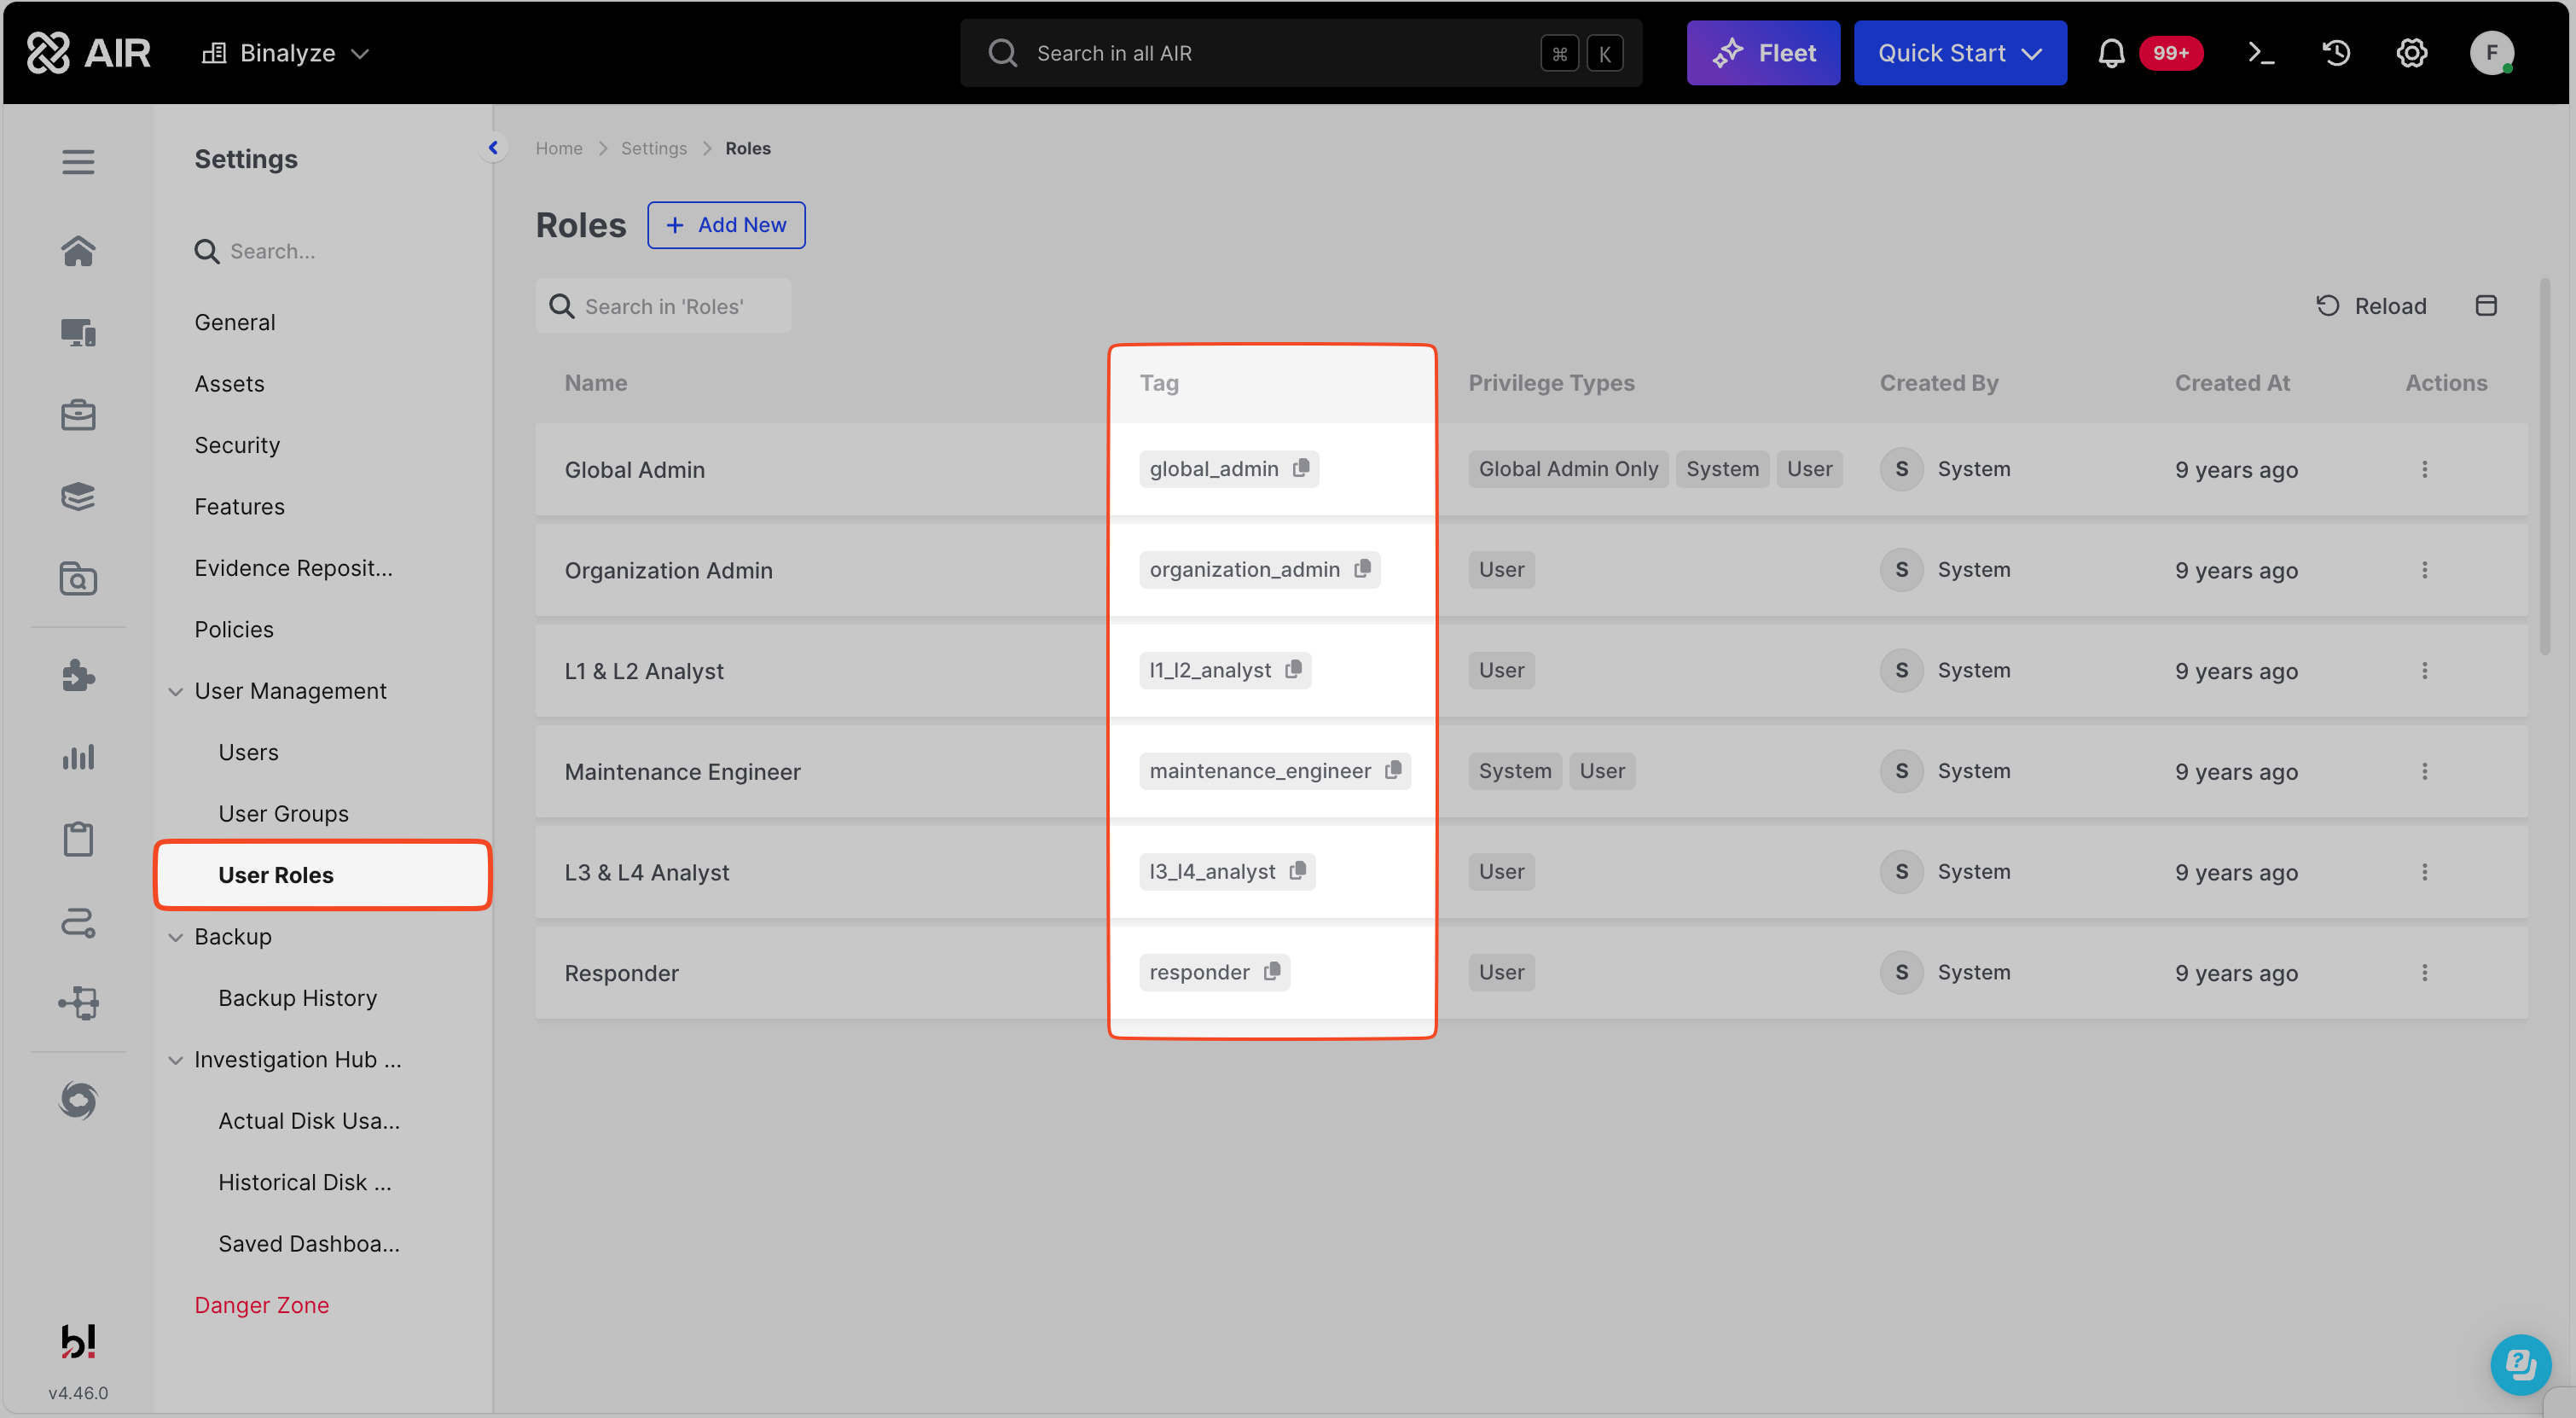
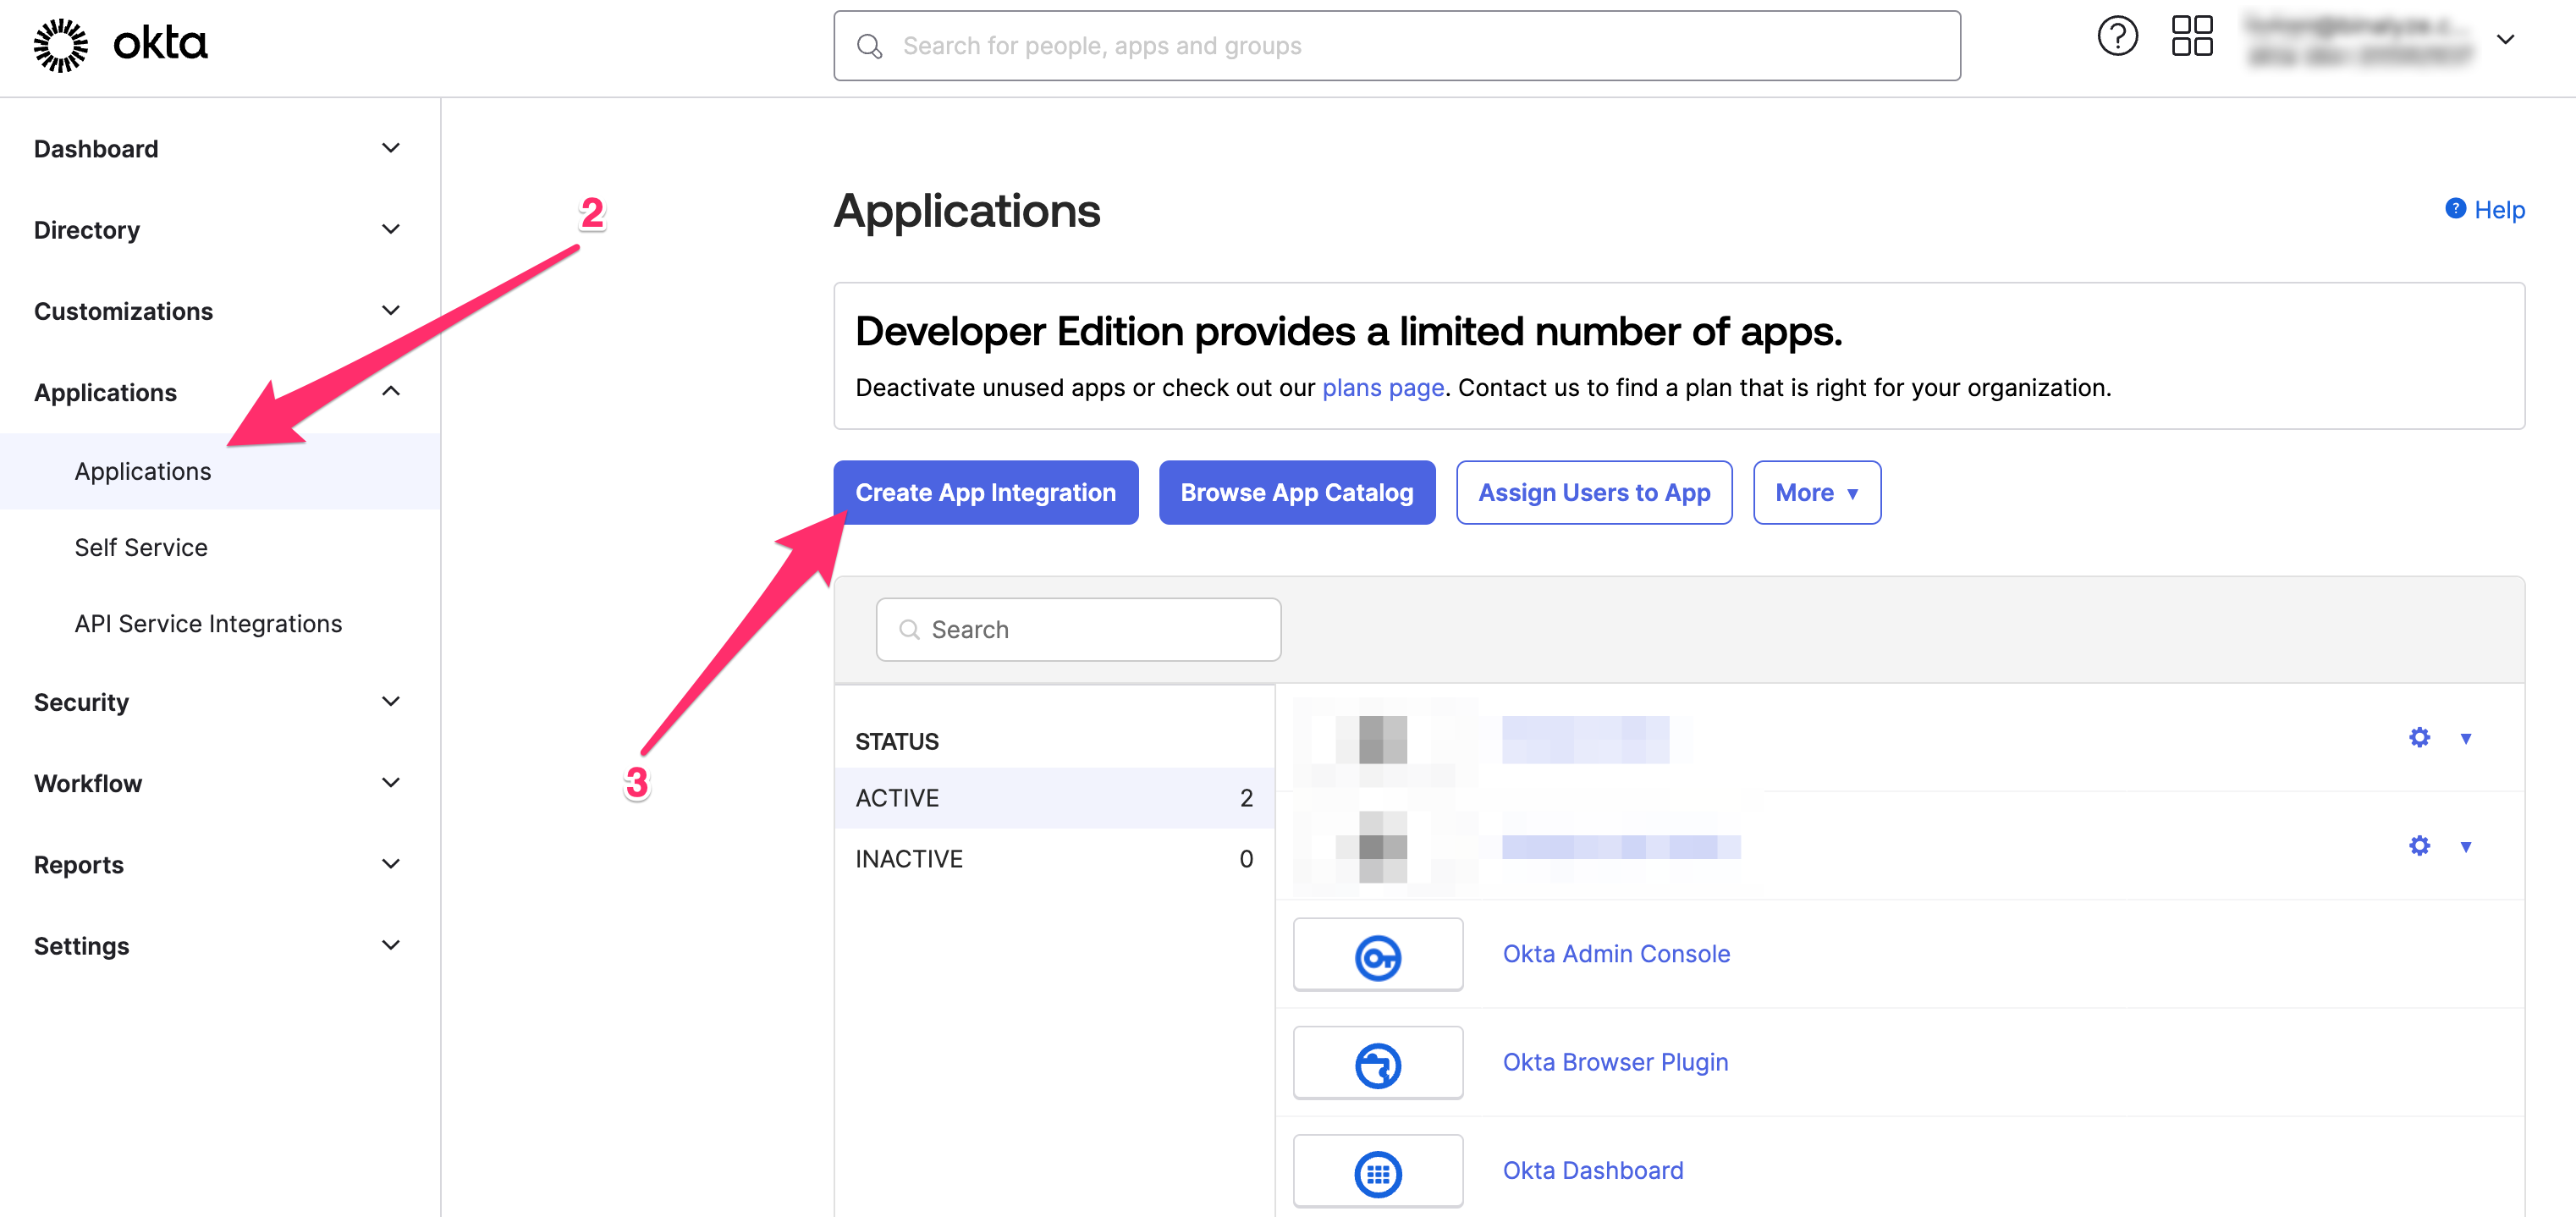
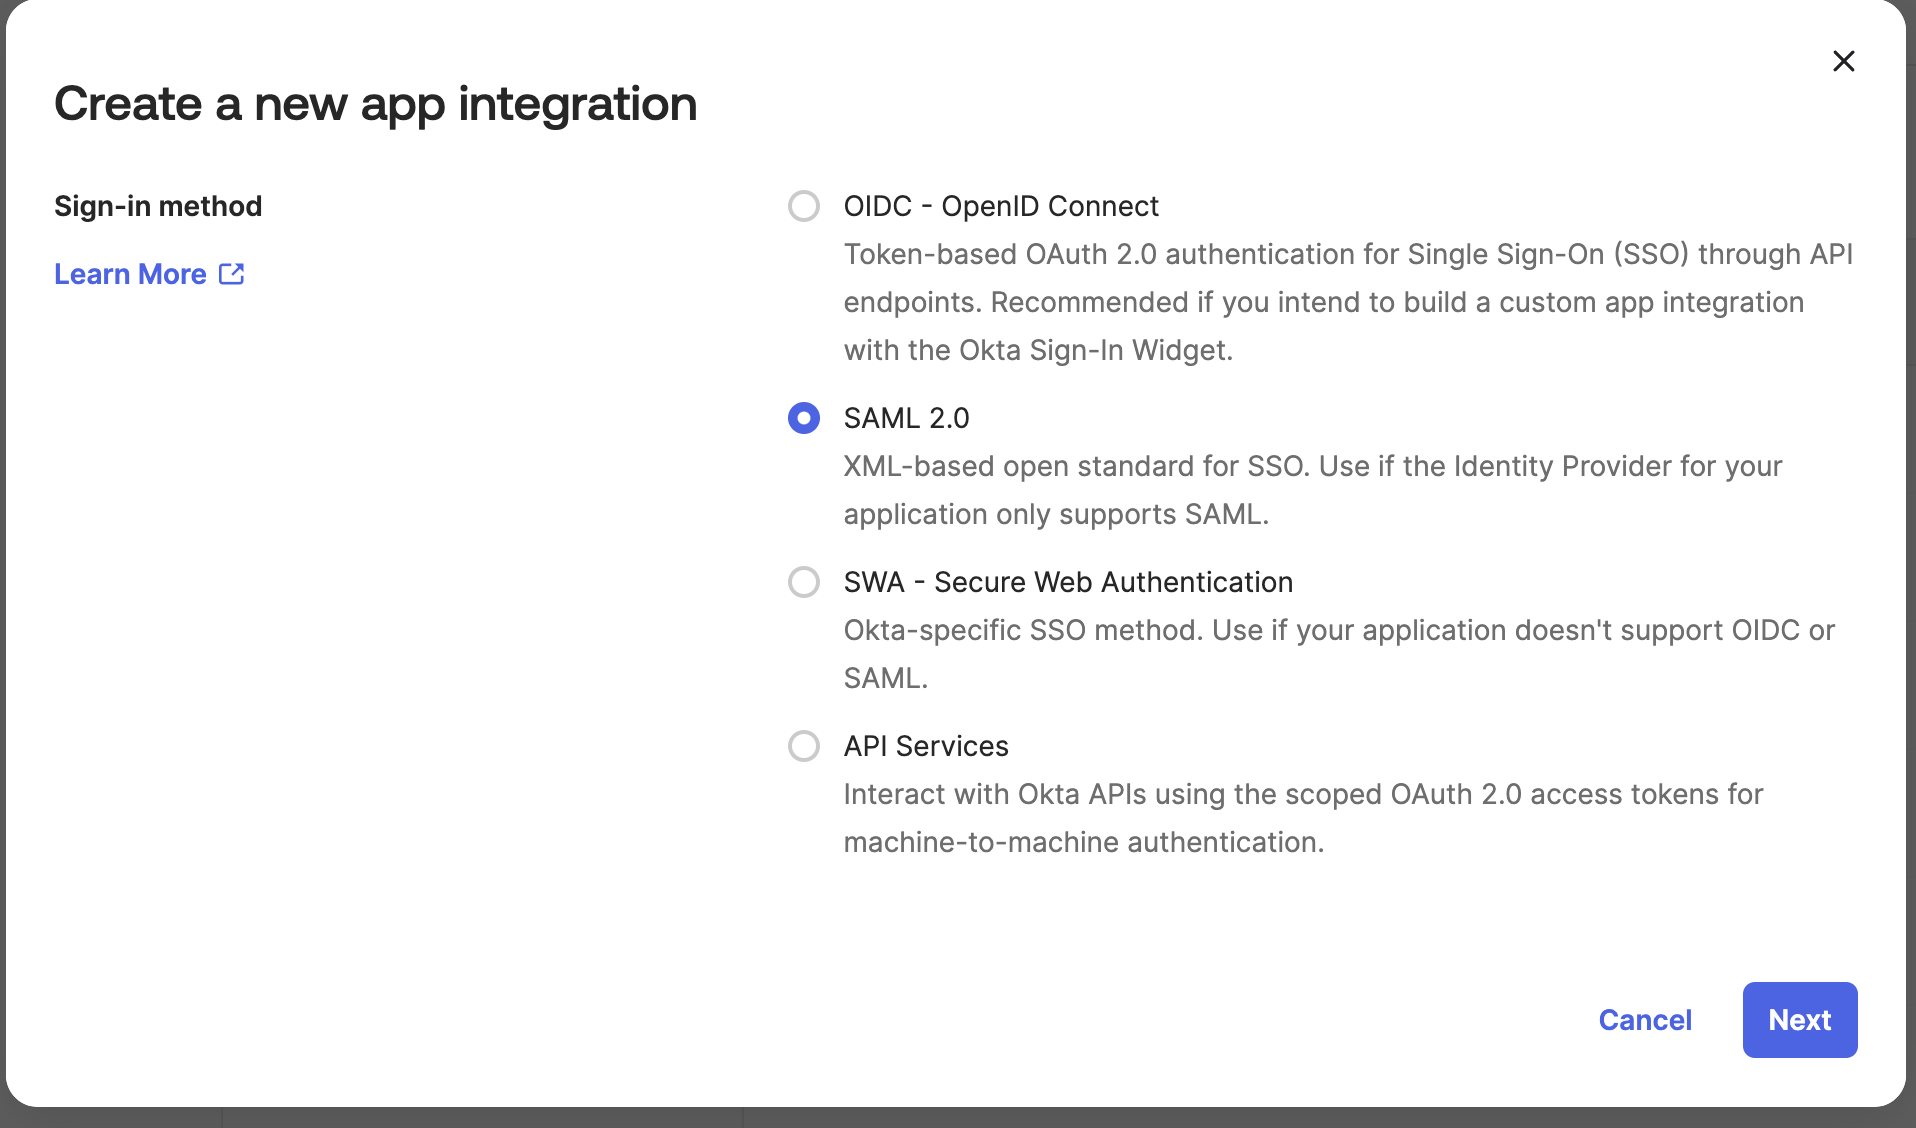
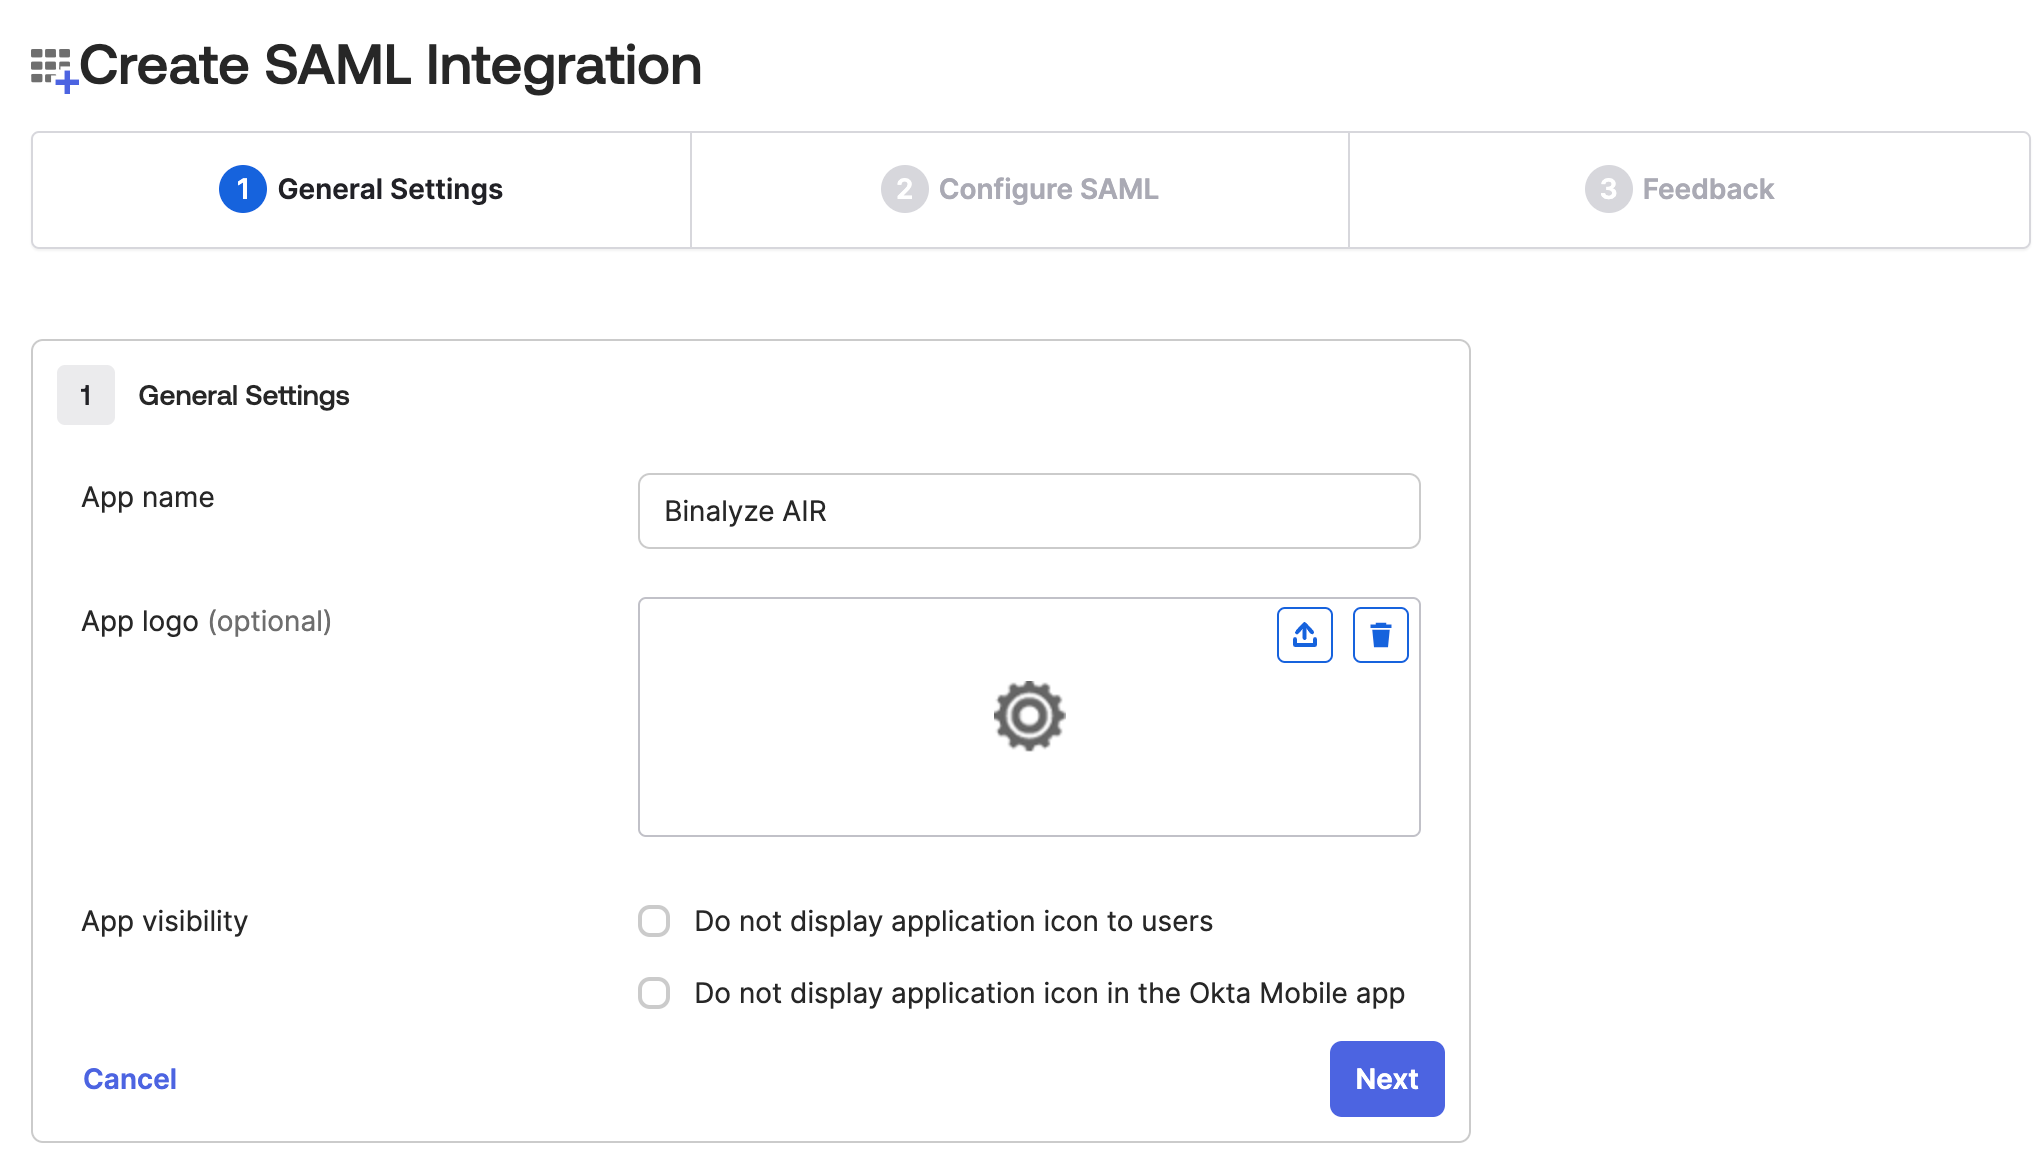
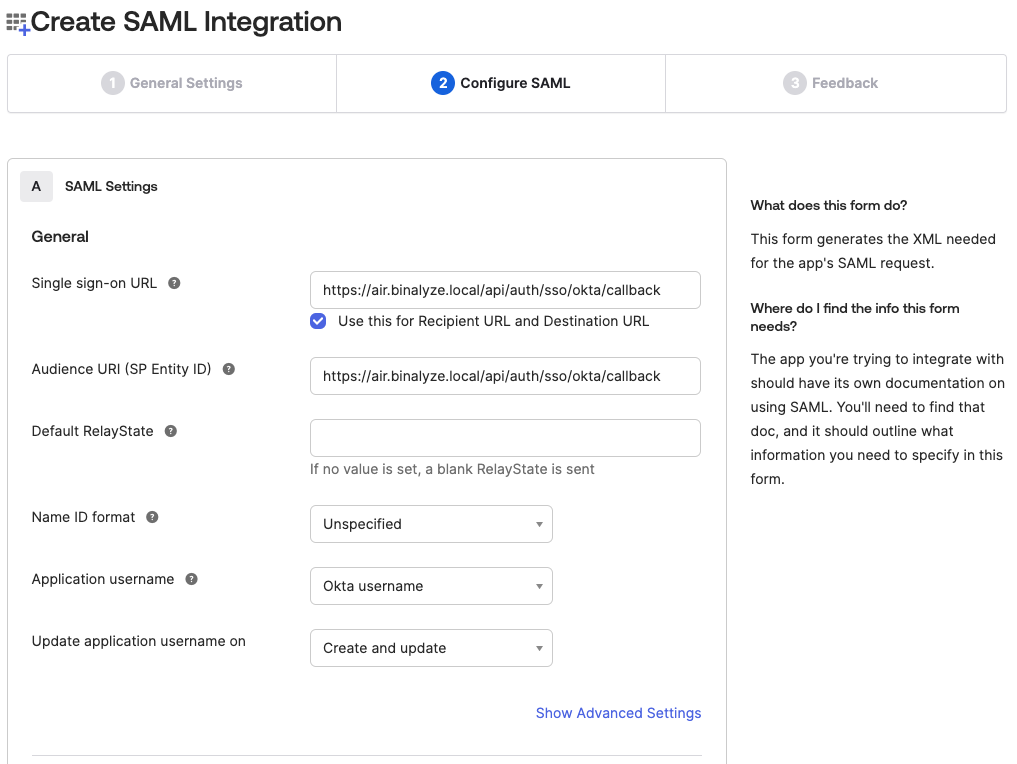
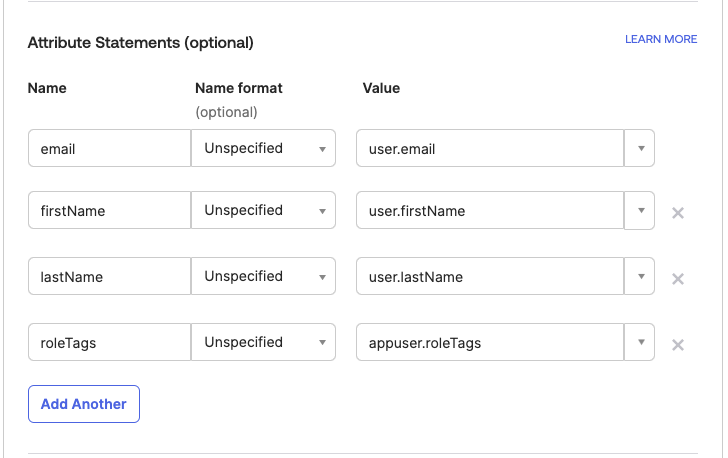
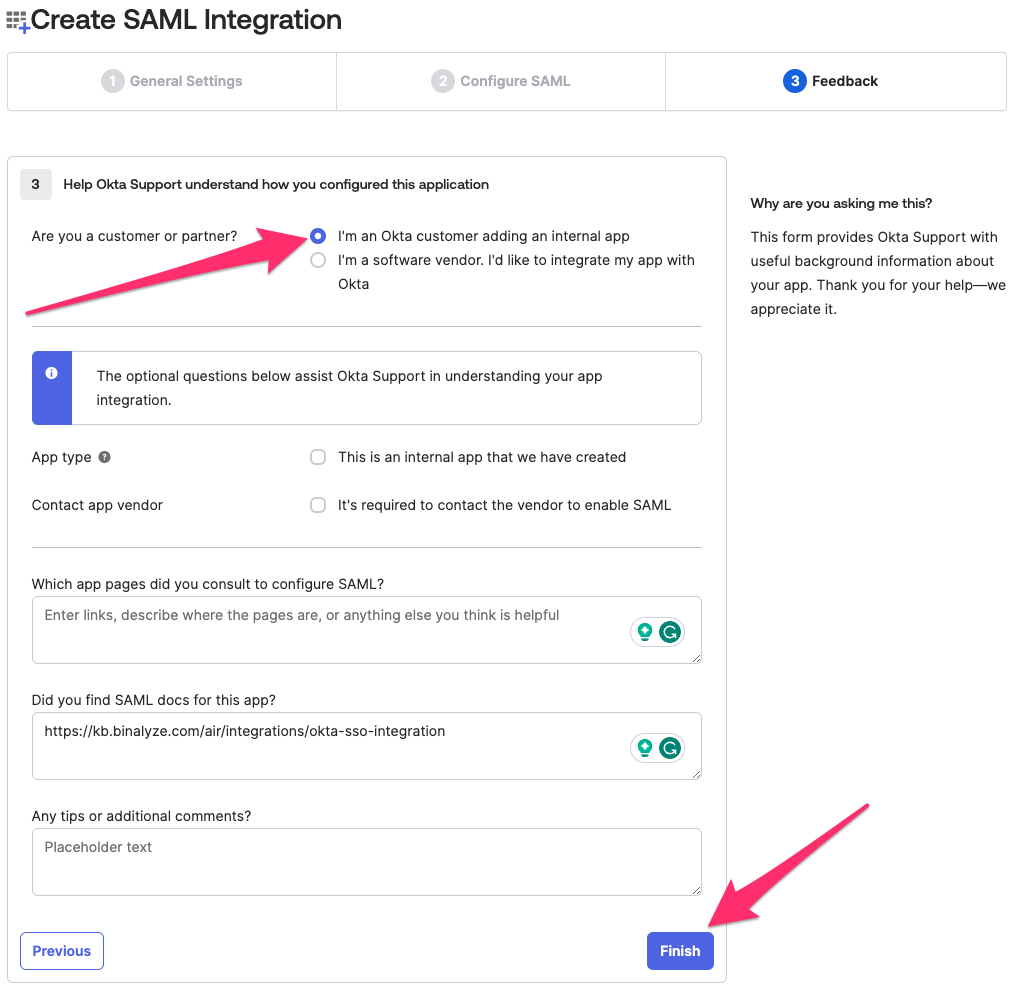
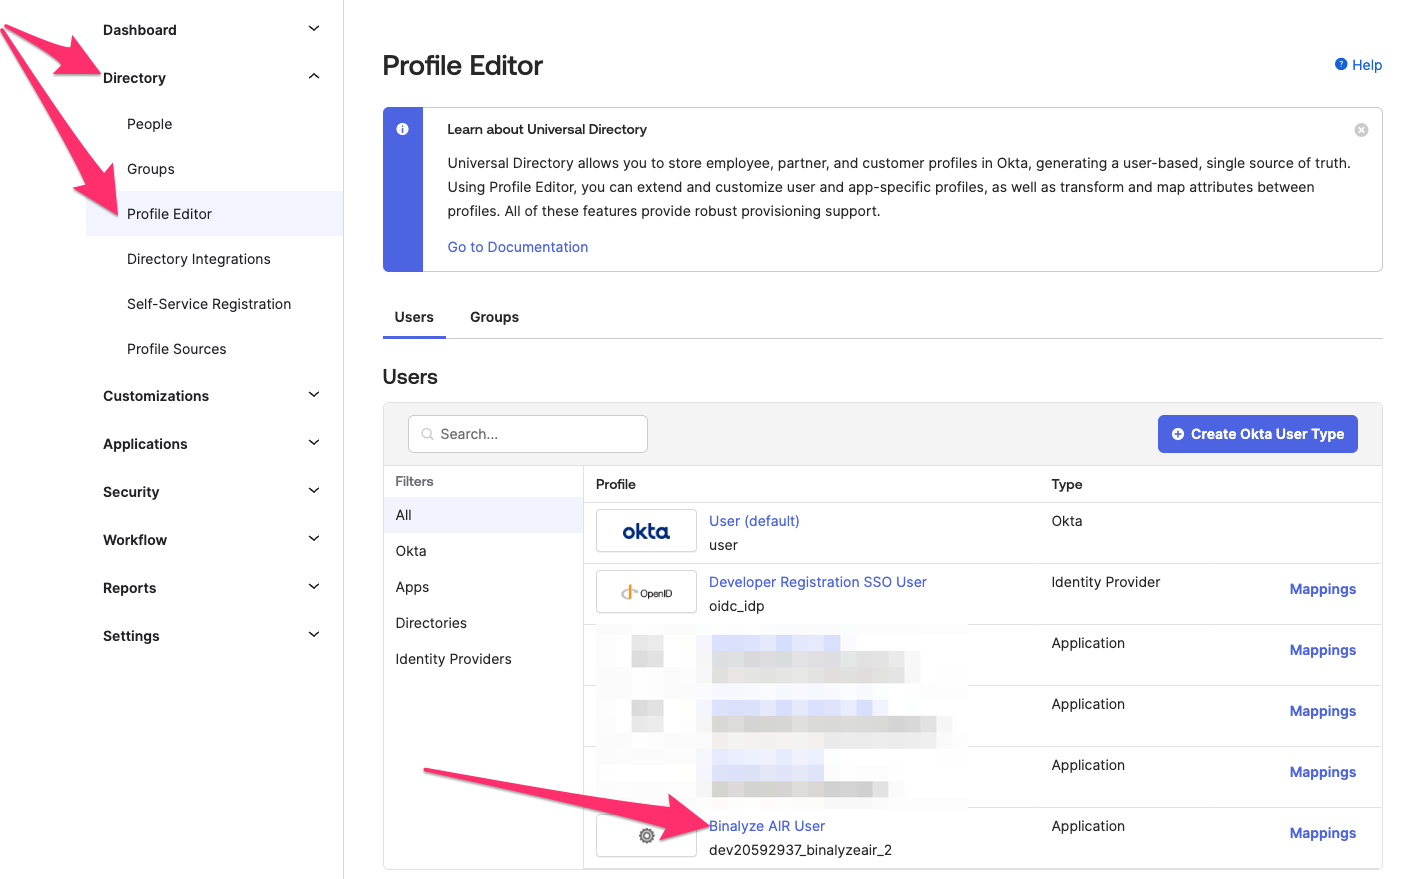
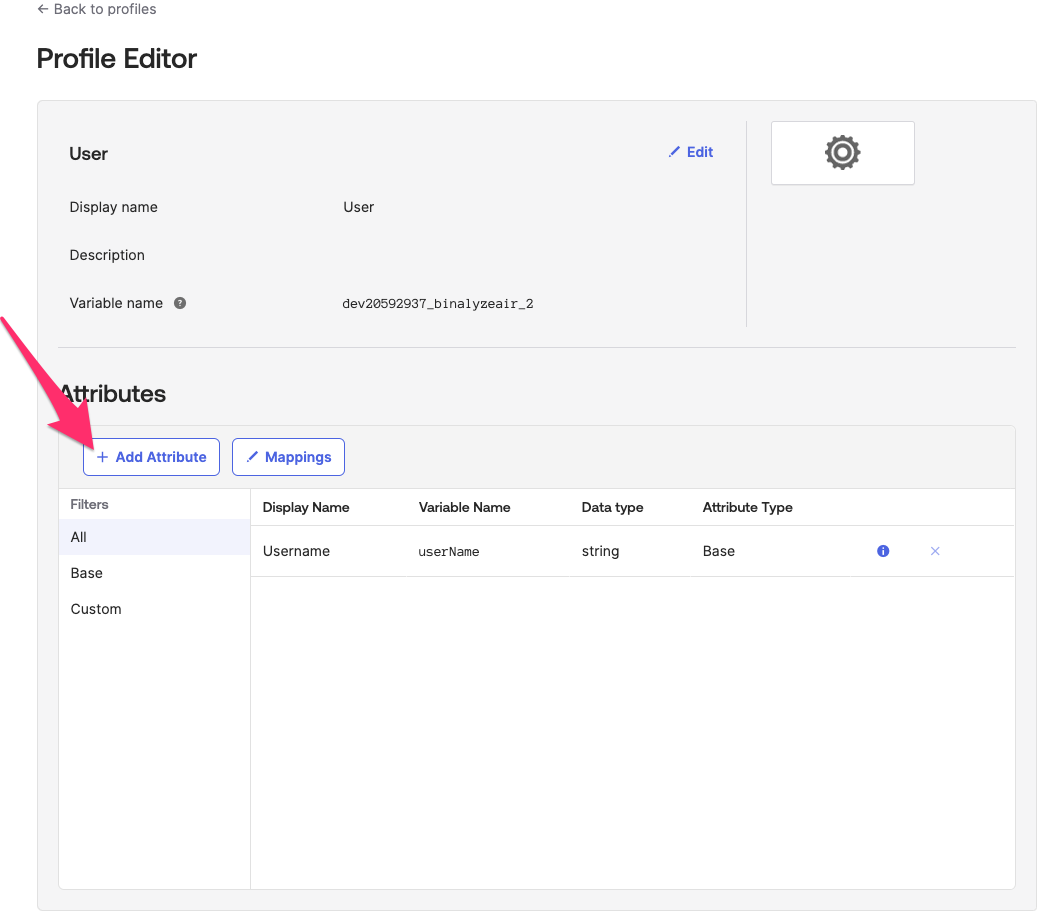
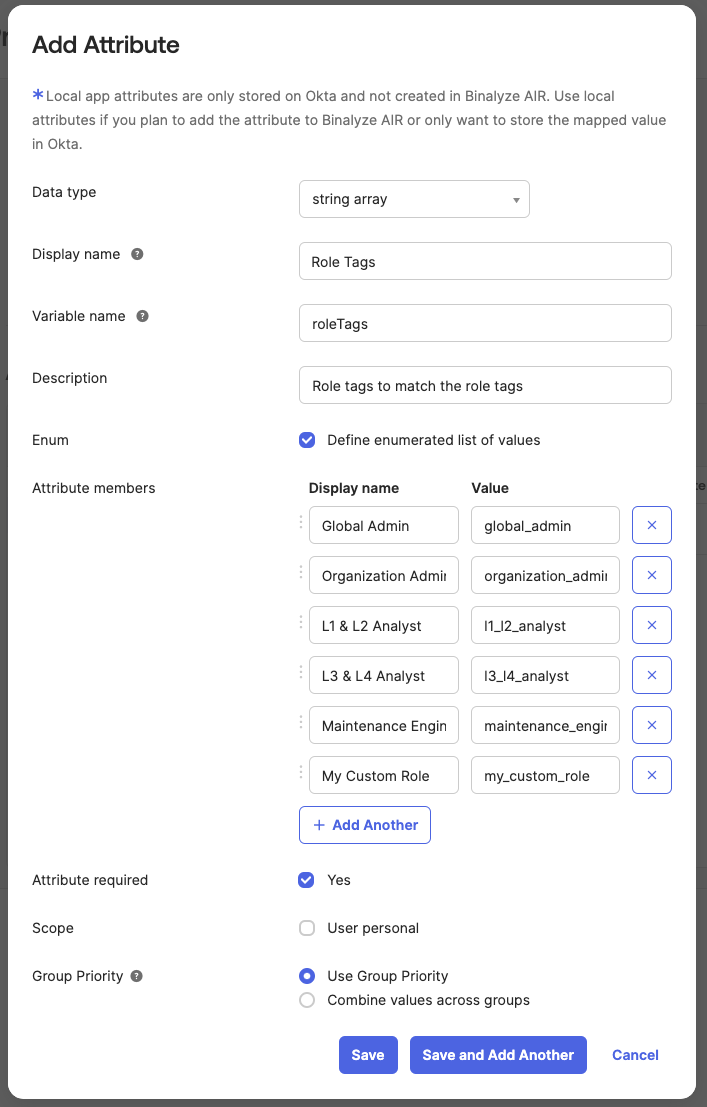
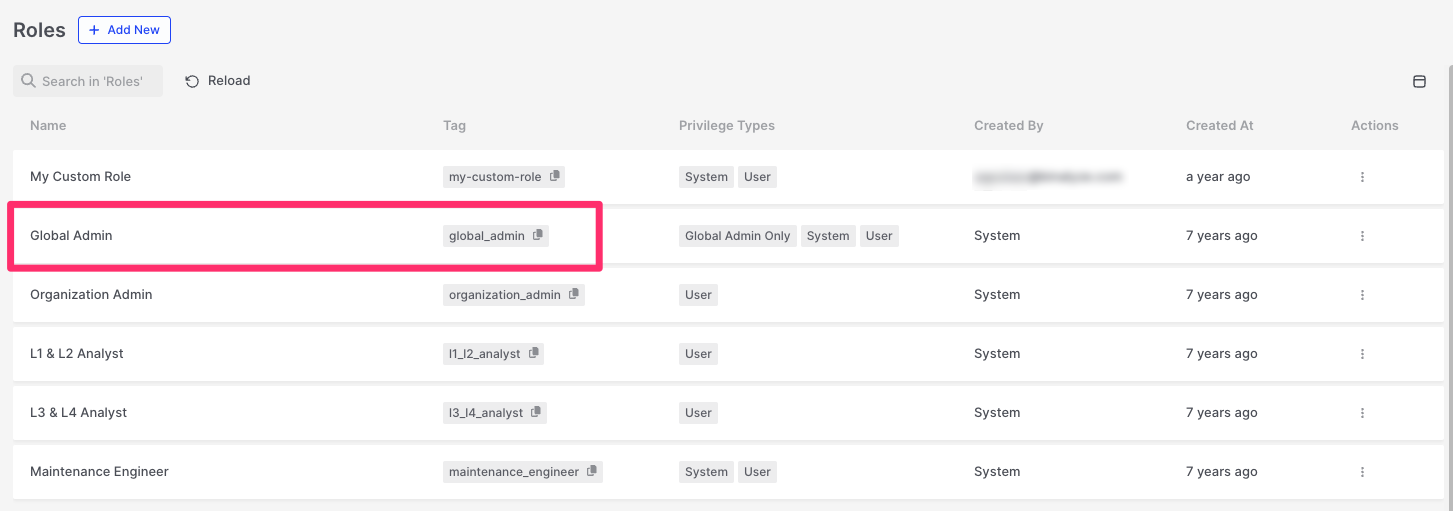
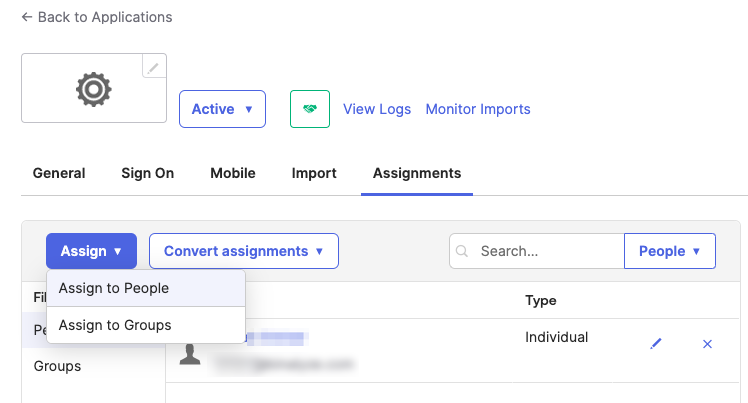
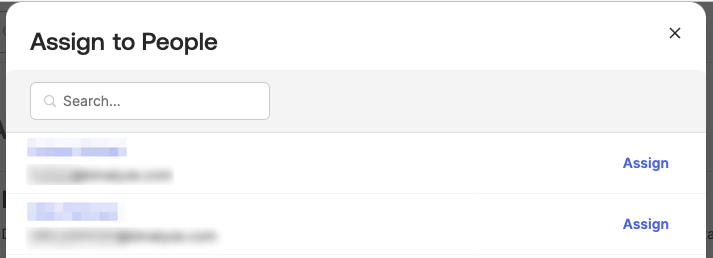
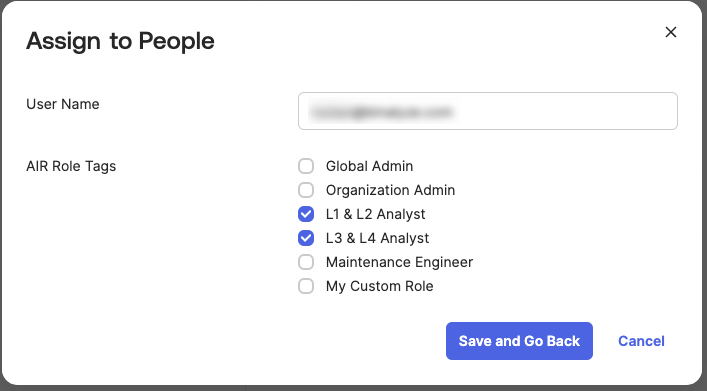
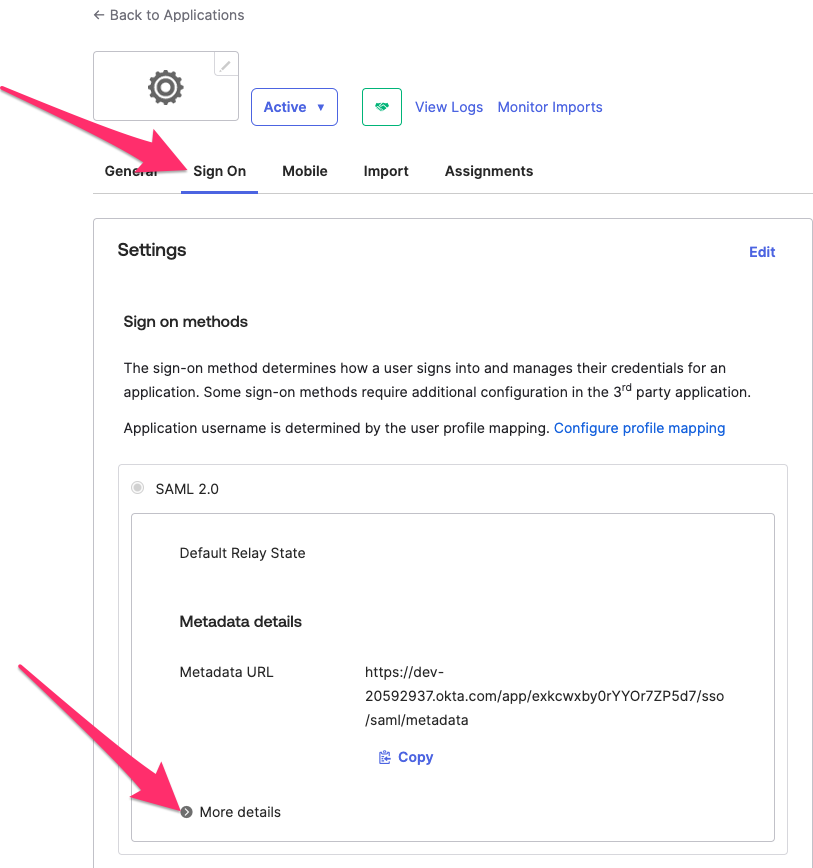
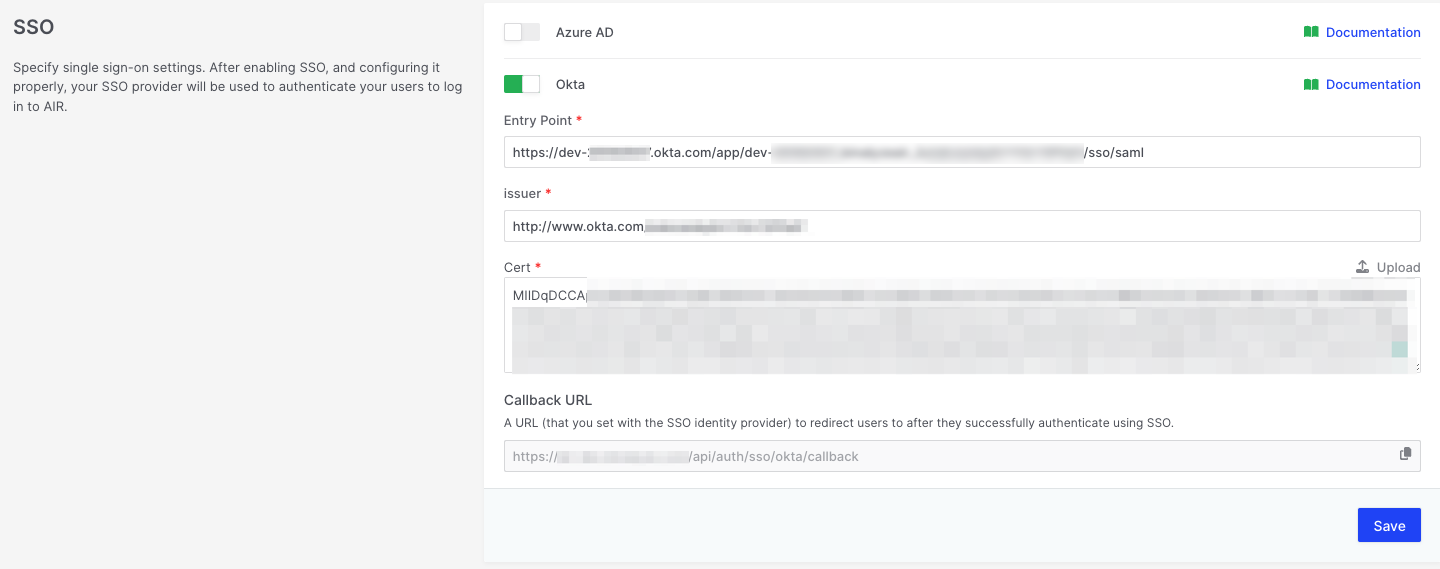
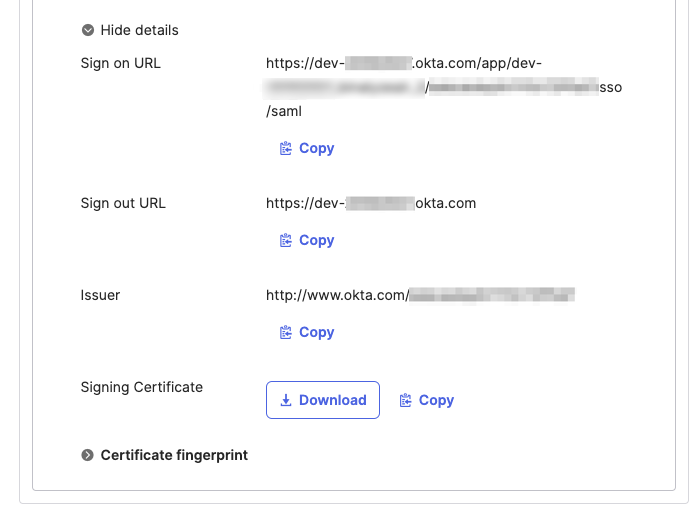
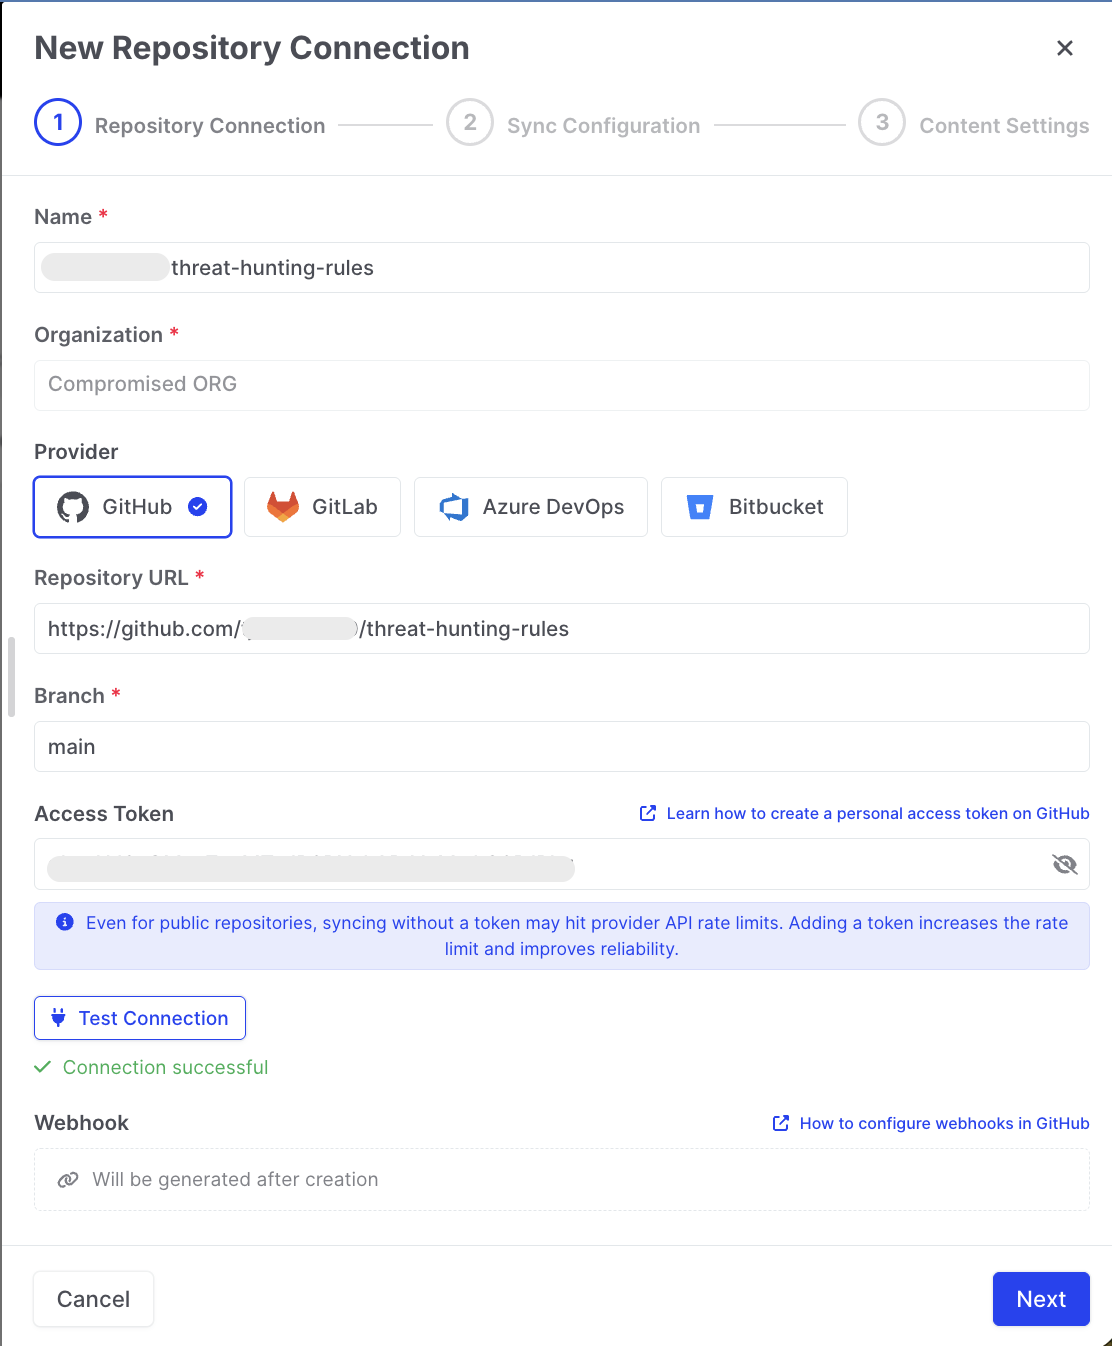
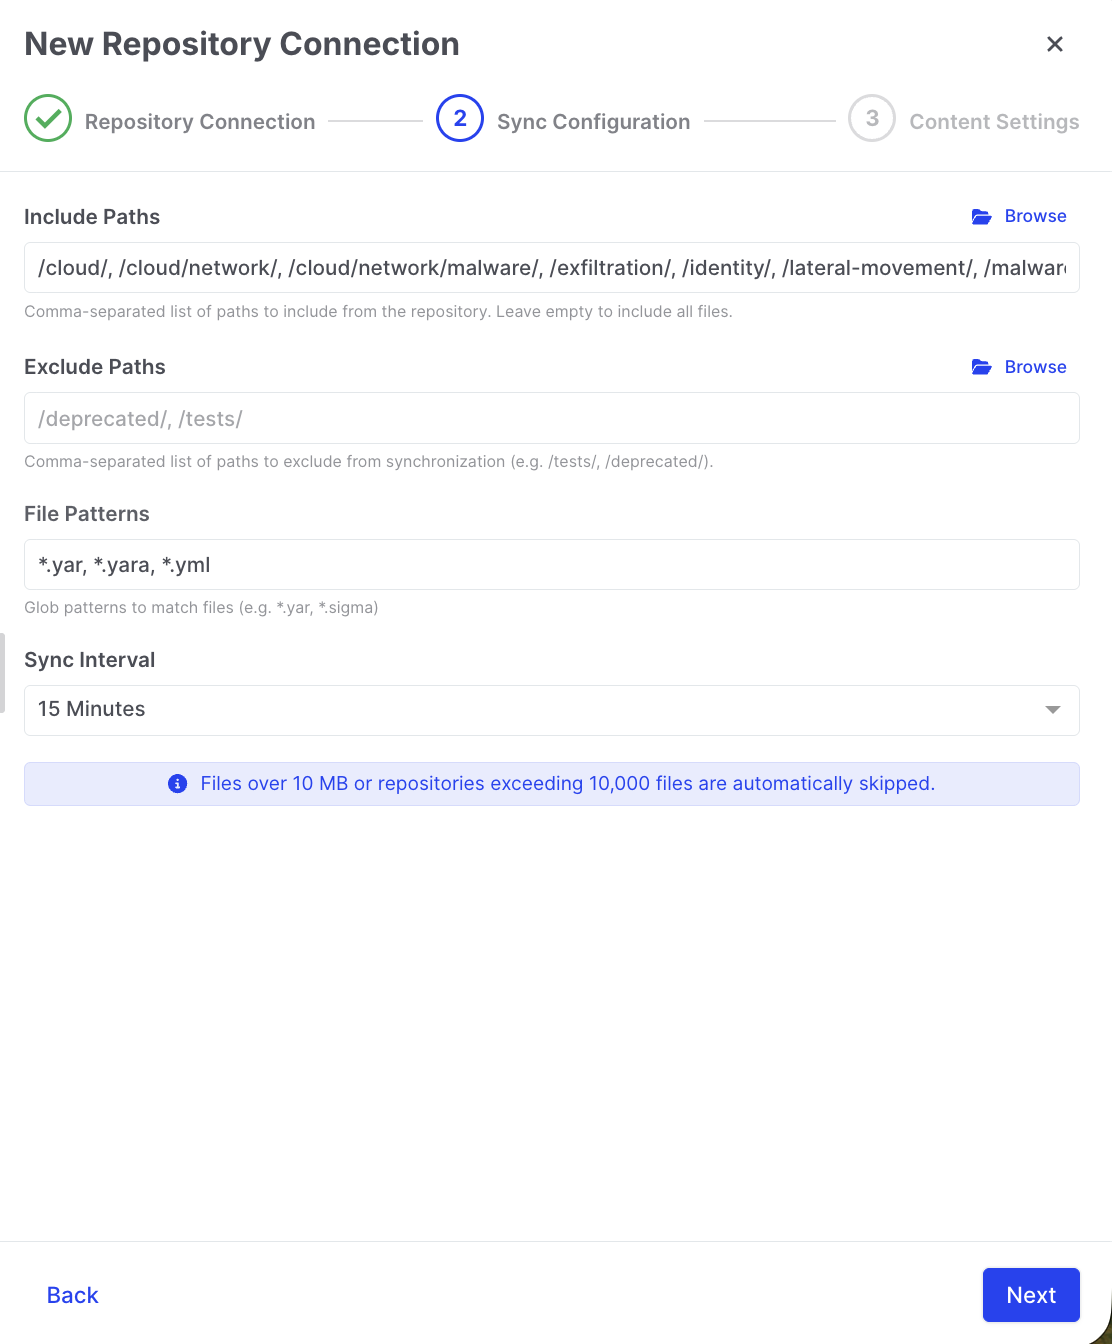
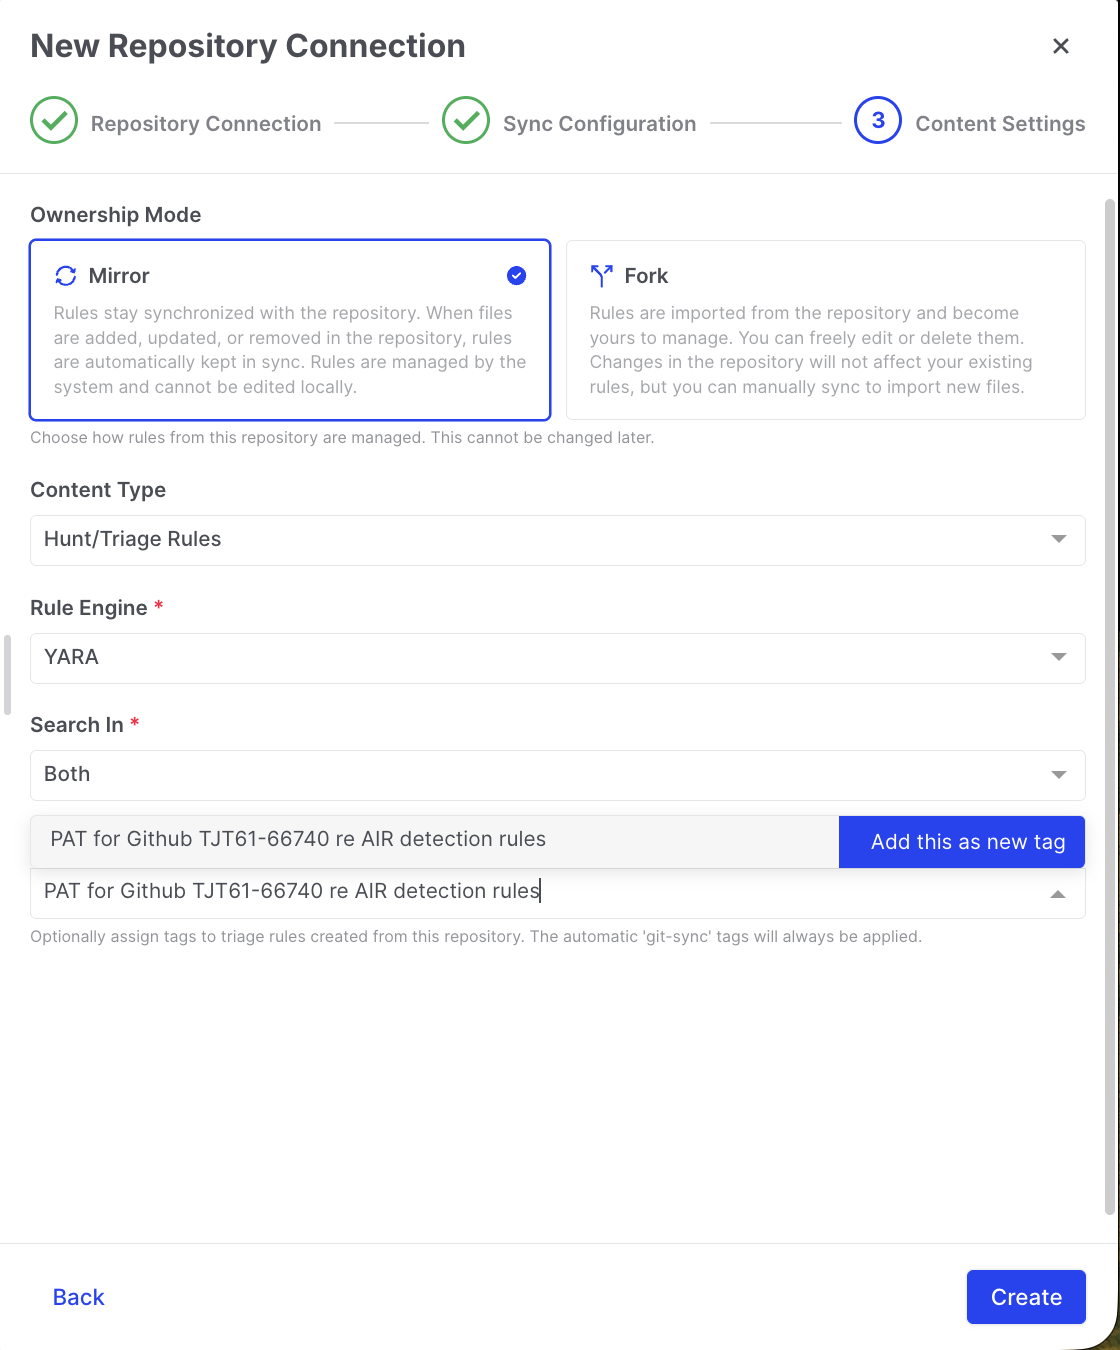
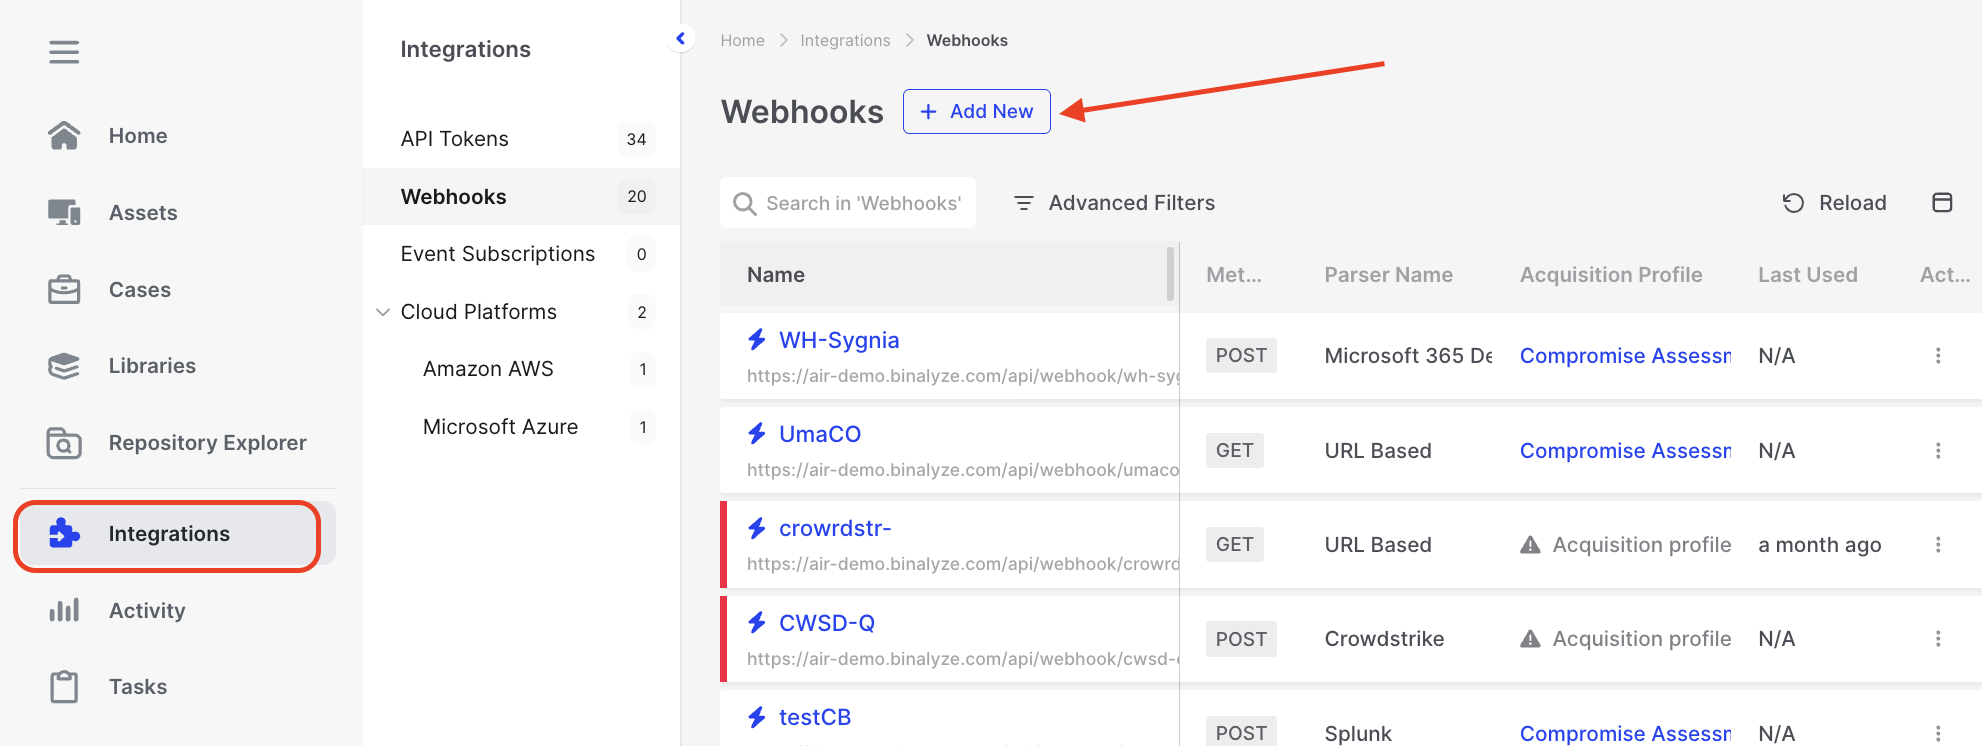
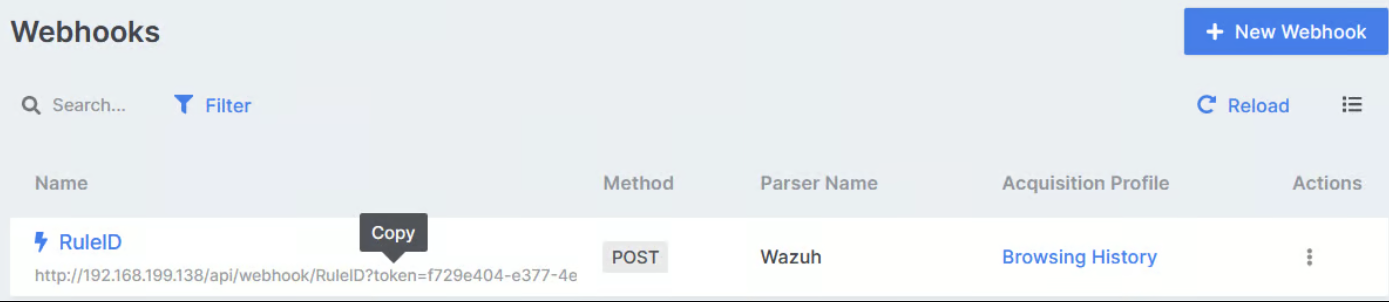 #### **Step 2: Add the Integration Settings in Wazuh**
Open the ossec.conf file with a preferred text editor and add the following line to the end of the file before closing the ossec_config. The name must be precisely custom-air. For detailed information, please see the [Wazuh Documentation](https://documentation.wazuh.com/current/user-manual/reference/ossec-conf/integration.html).
```
///redacted///
…
#### **Step 2: Add the Integration Settings in Wazuh**
Open the ossec.conf file with a preferred text editor and add the following line to the end of the file before closing the ossec_config. The name must be precisely custom-air. For detailed information, please see the [Wazuh Documentation](https://documentation.wazuh.com/current/user-manual/reference/ossec-conf/integration.html).
```
///redacted///
…
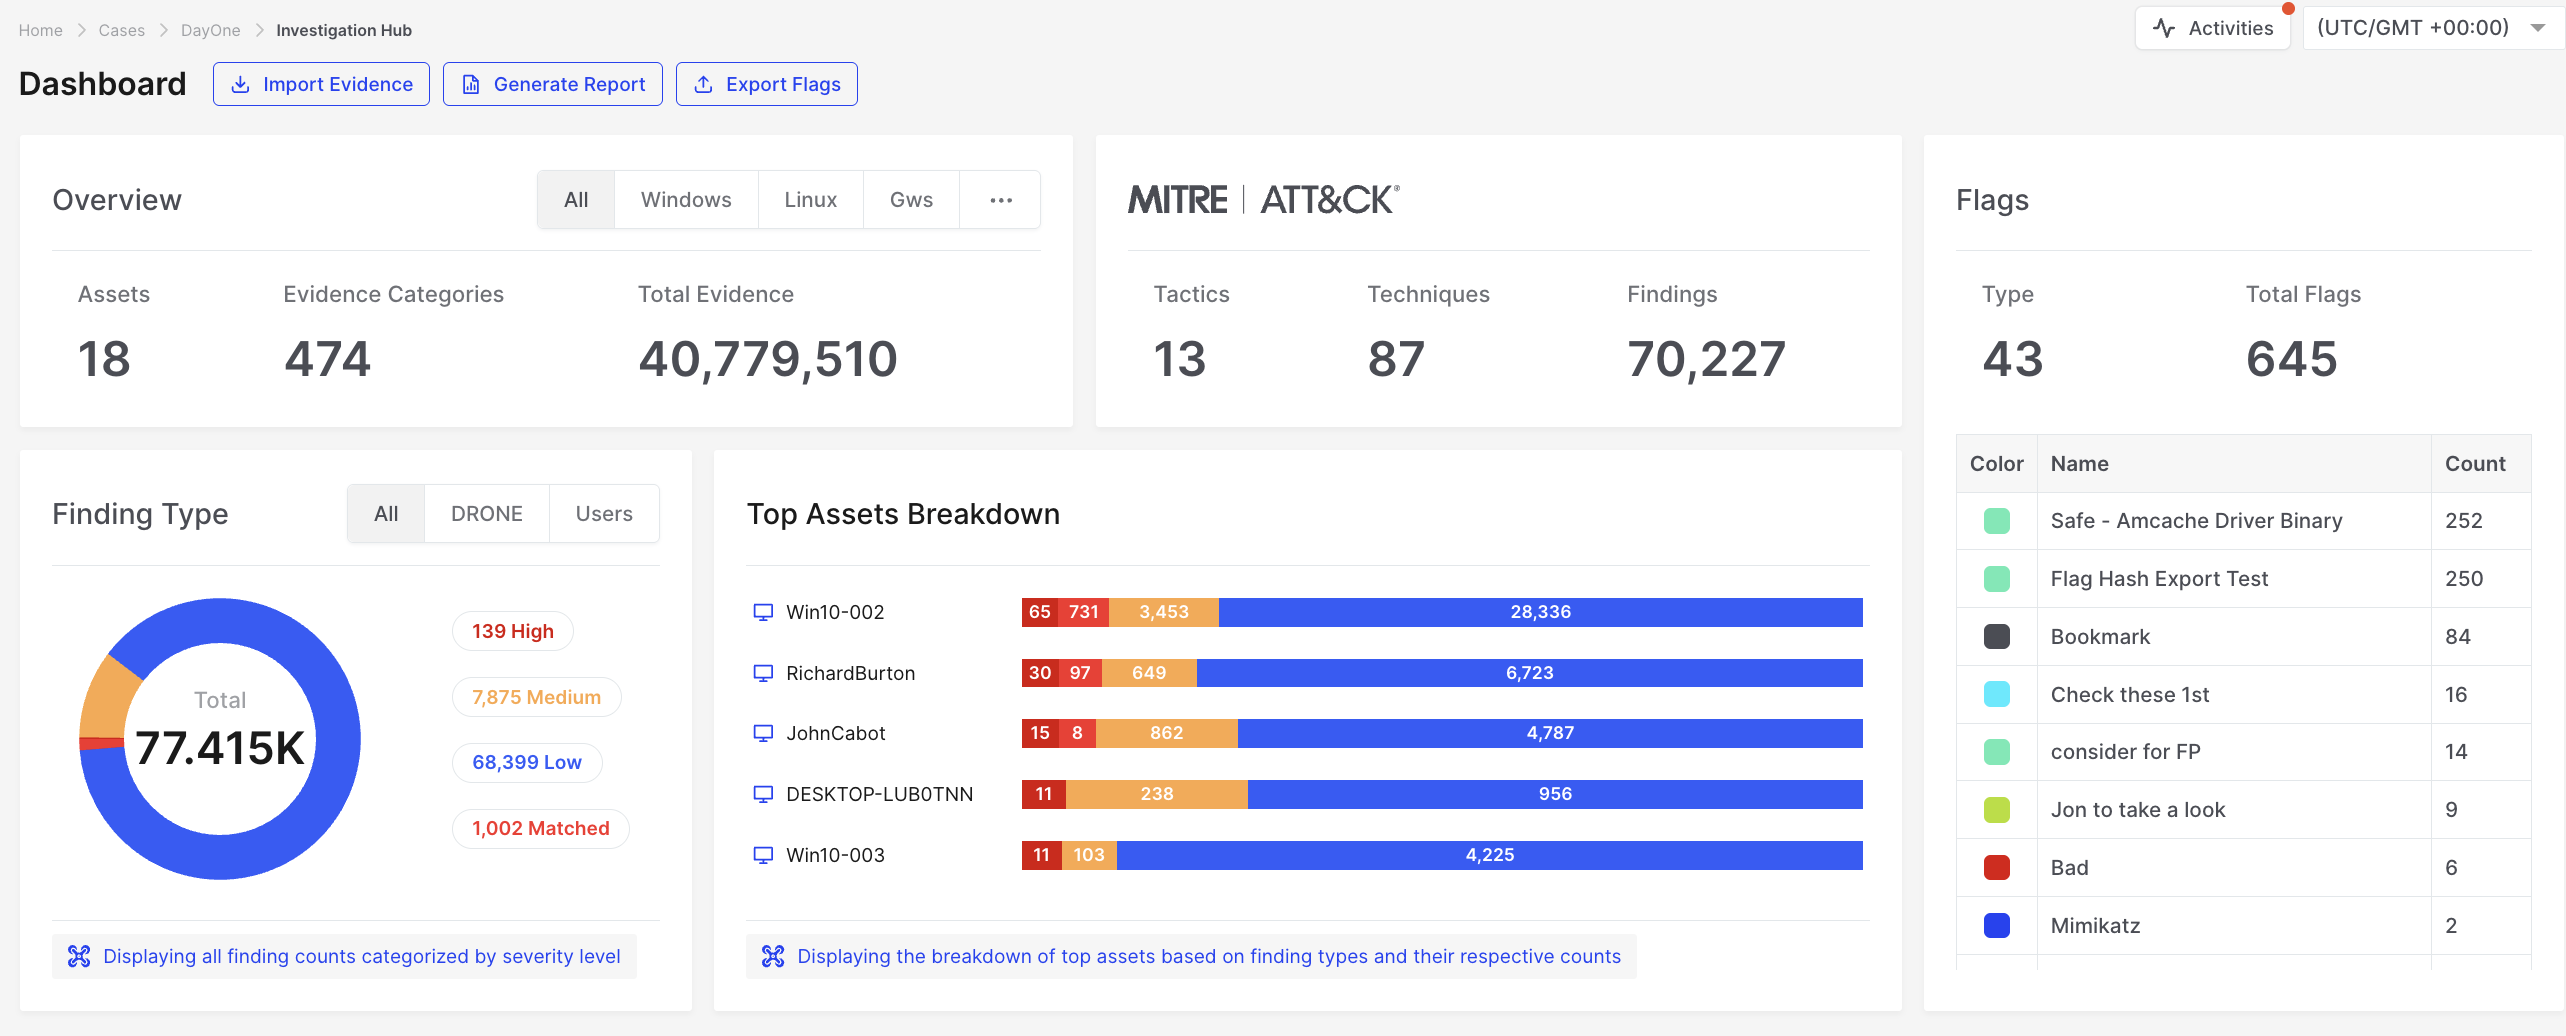
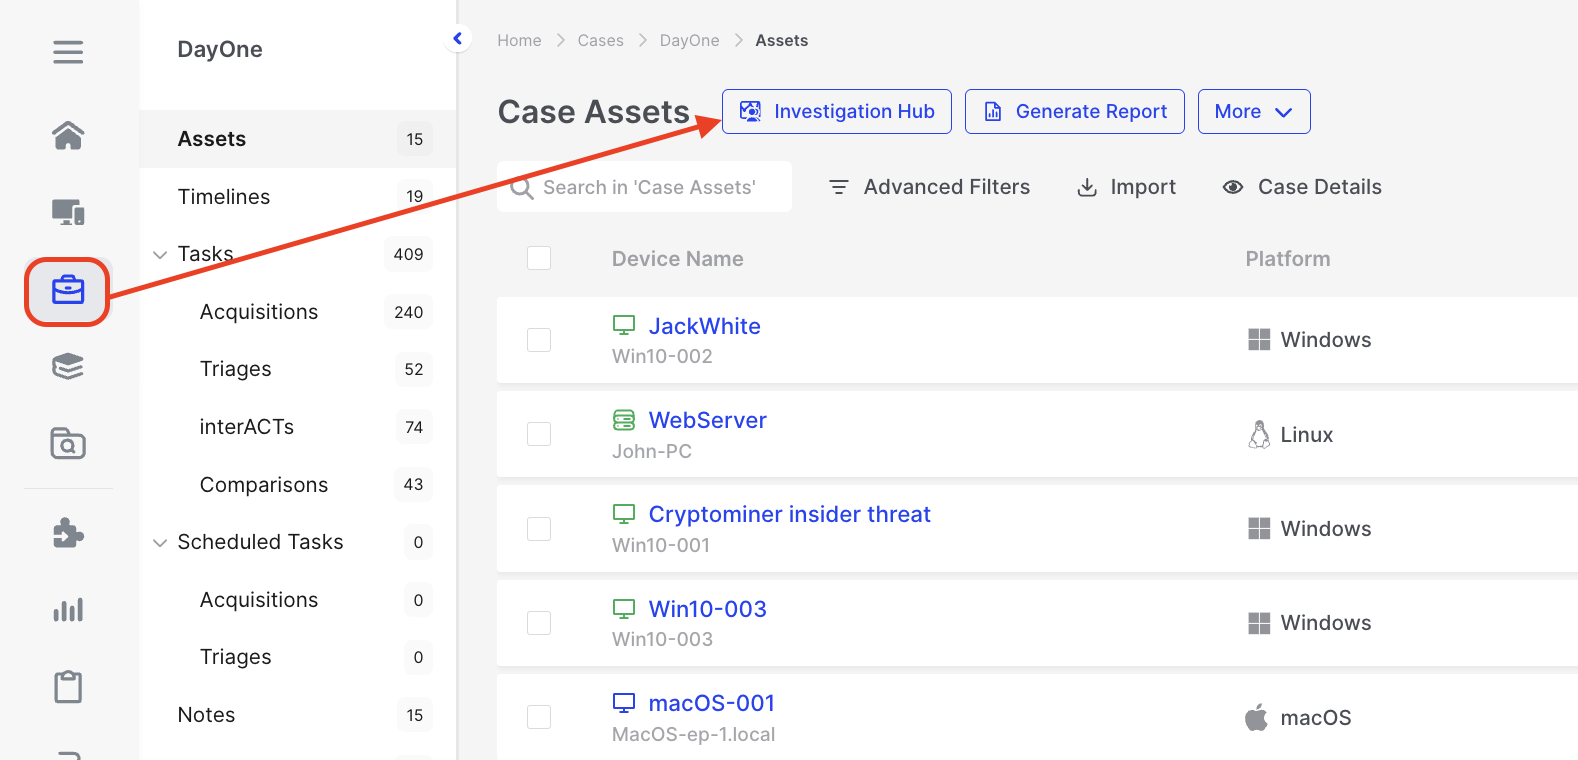
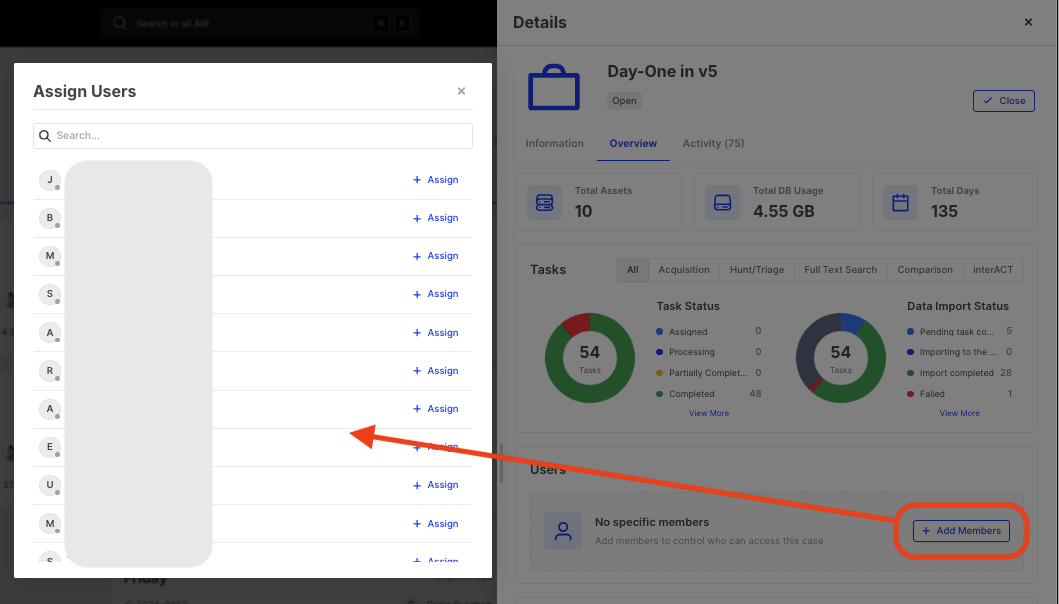
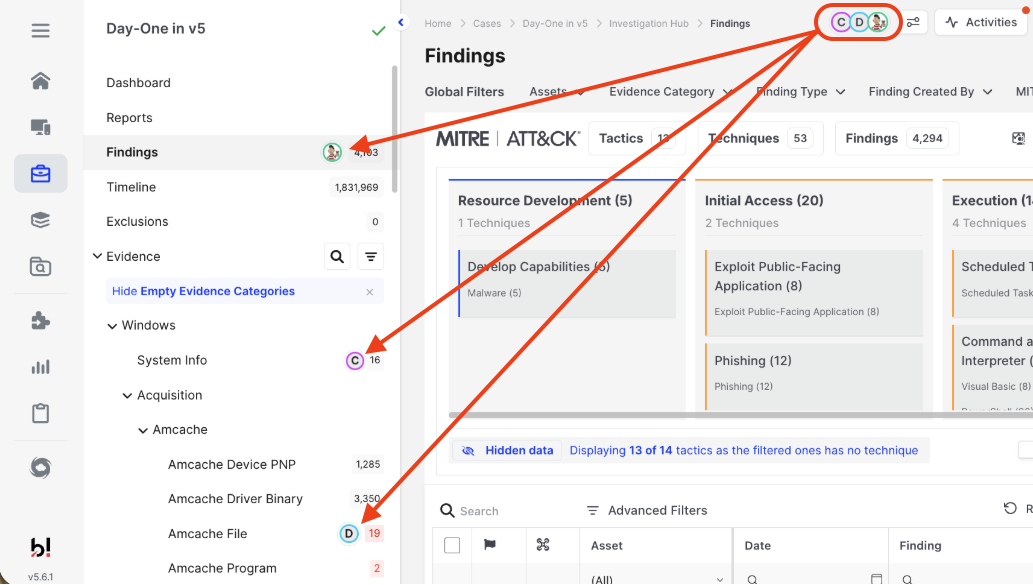


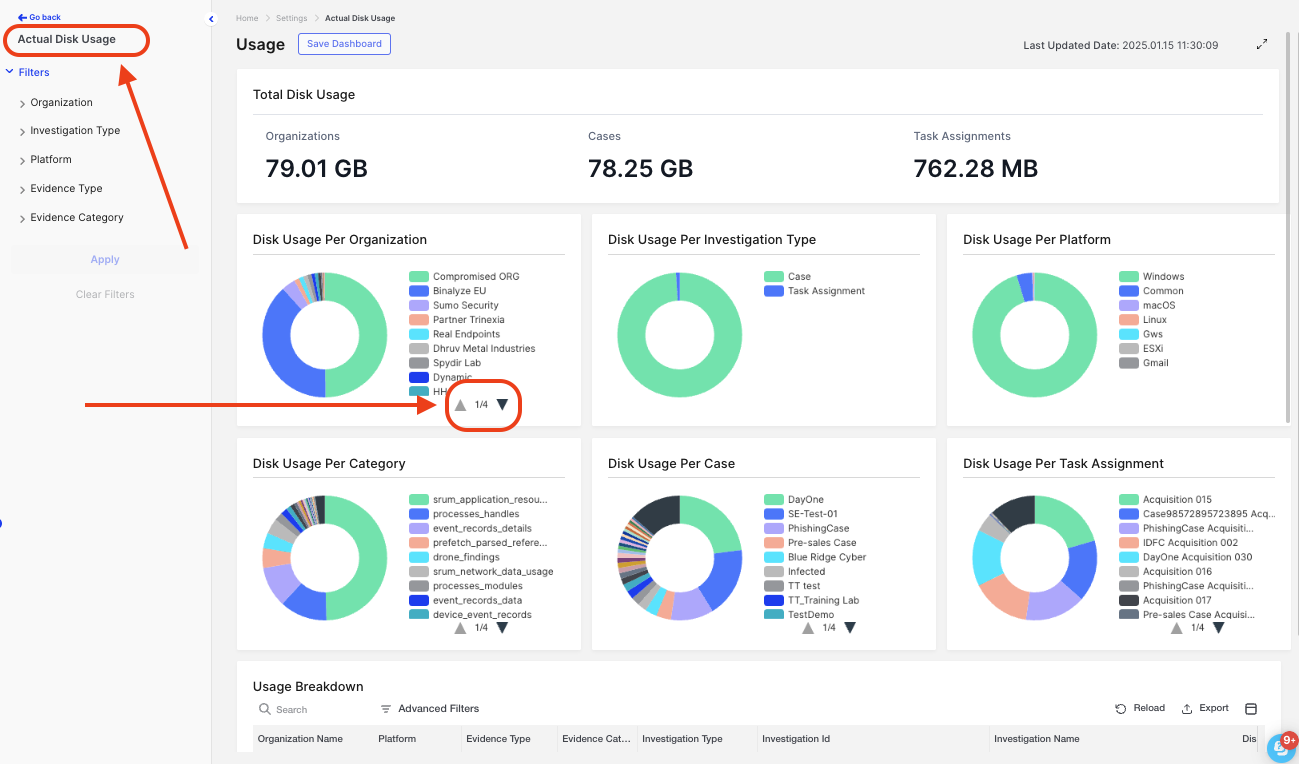
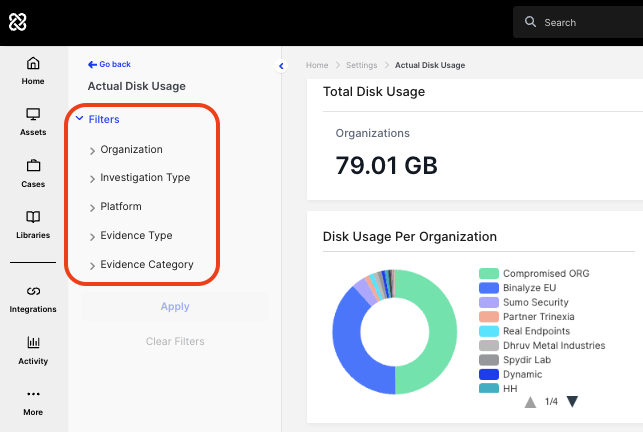
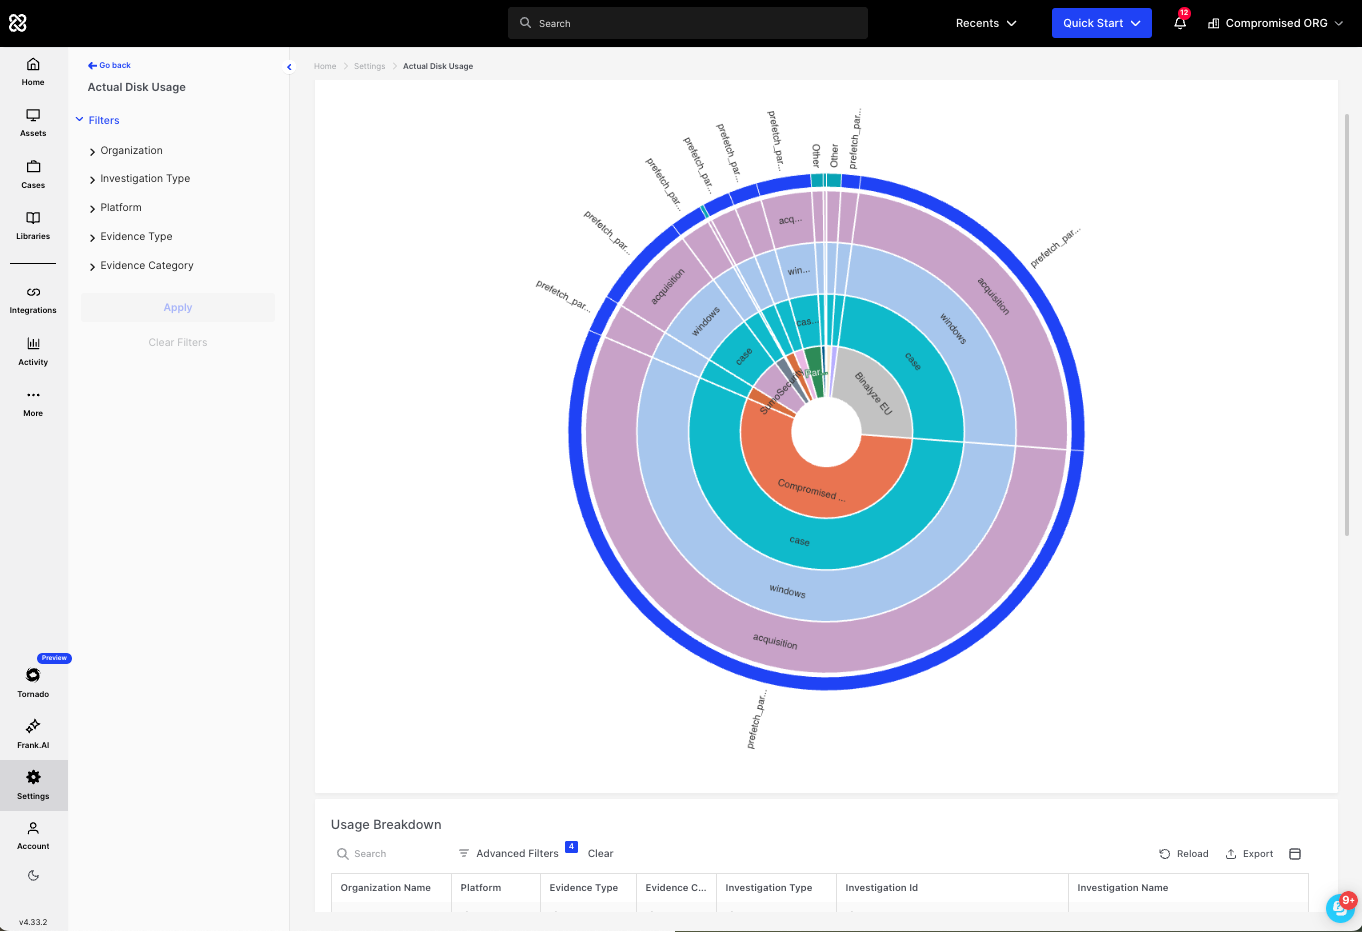
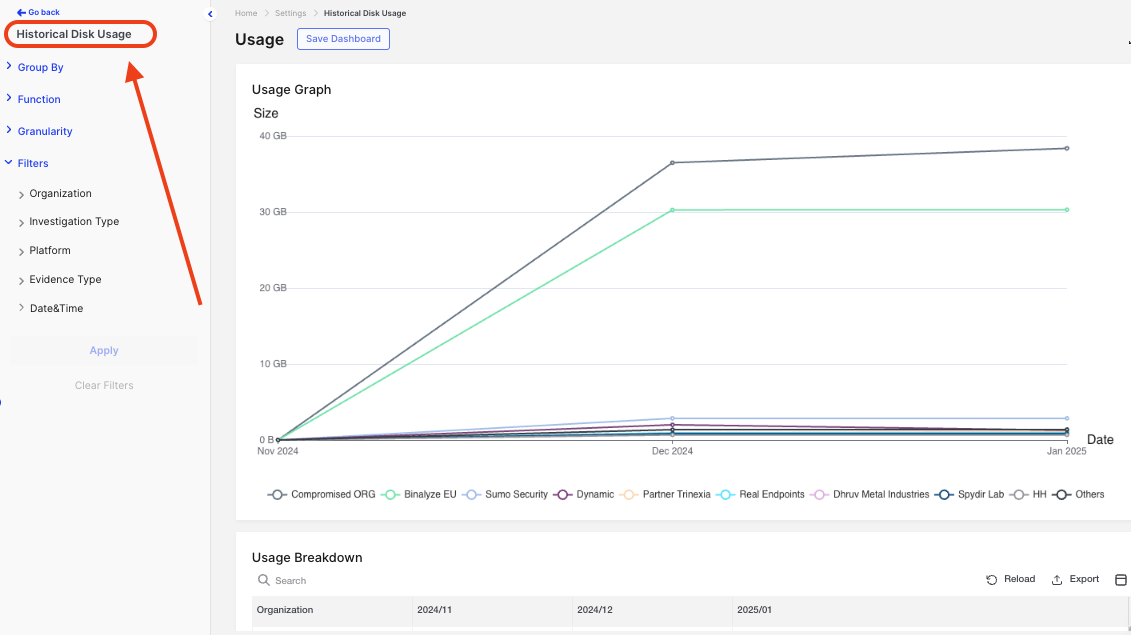
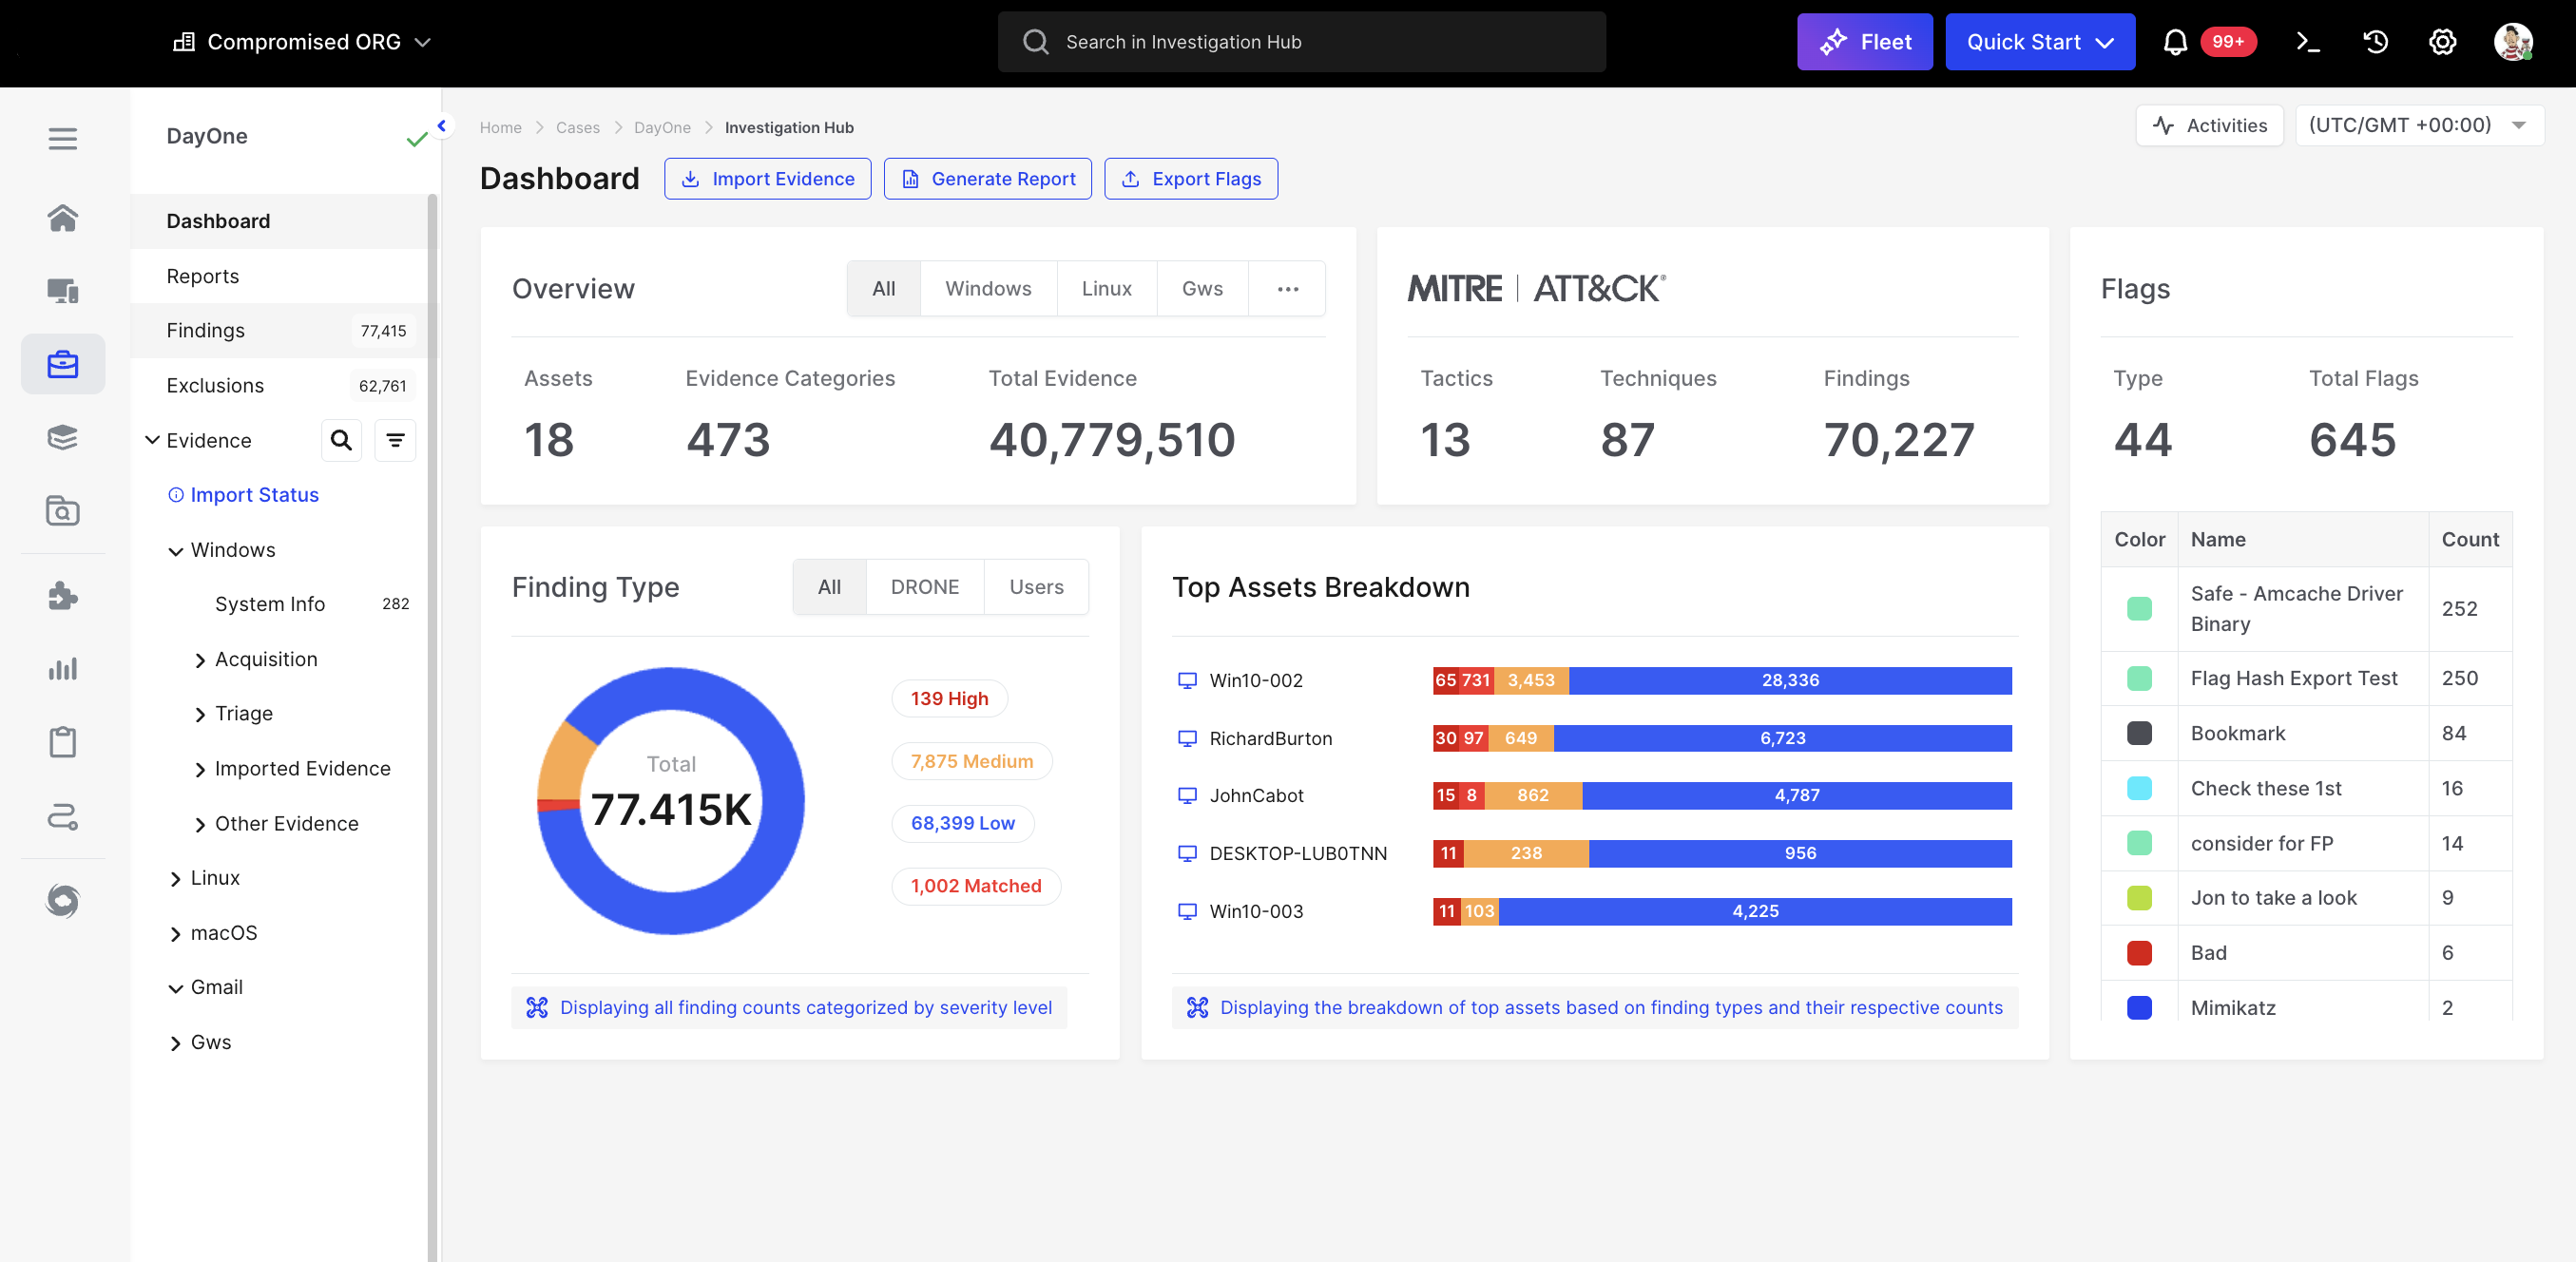

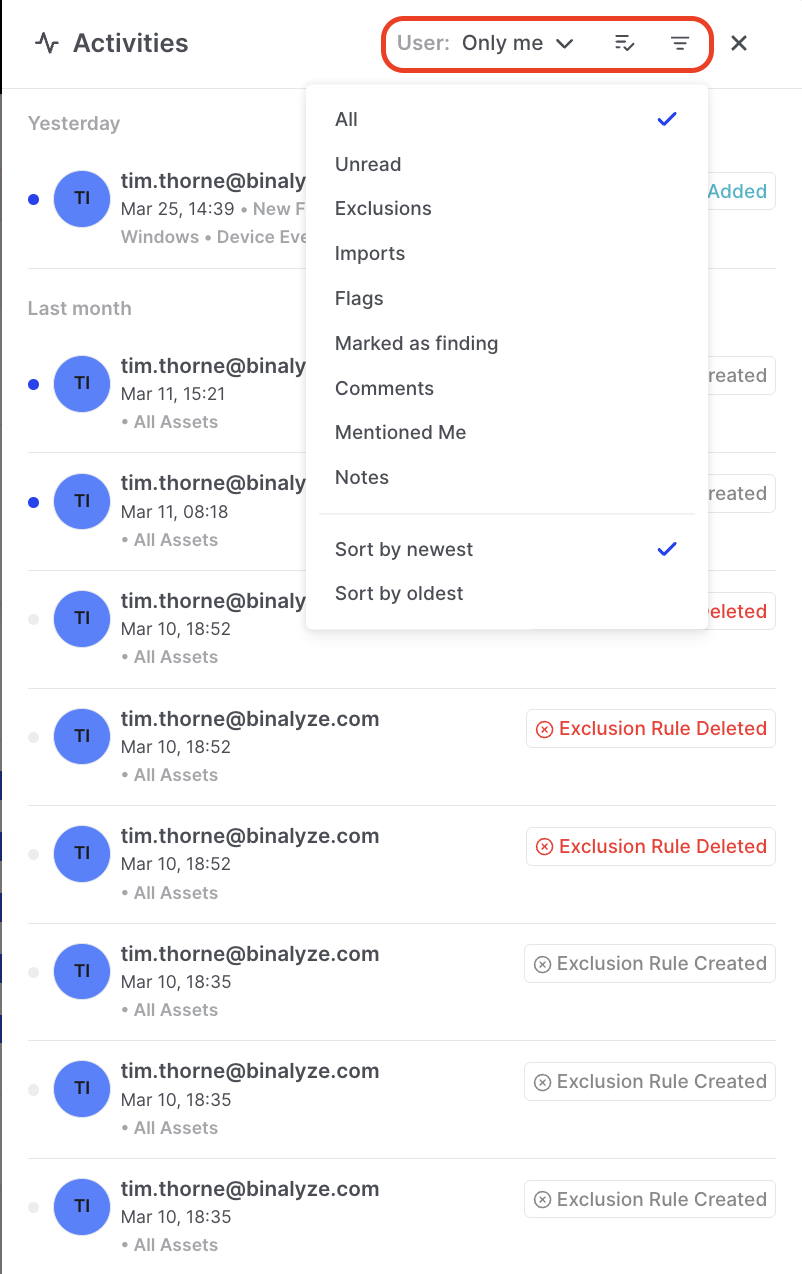
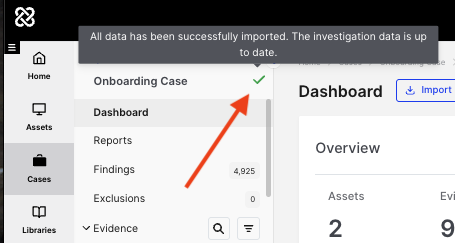
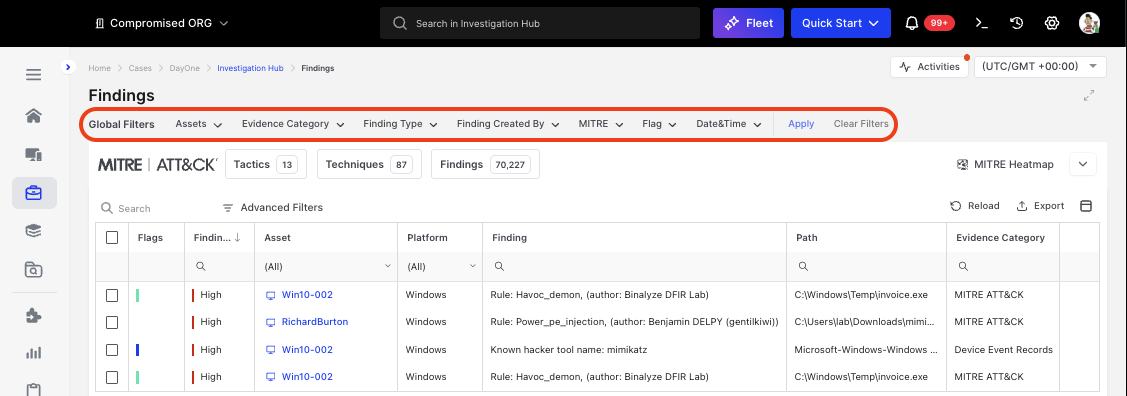
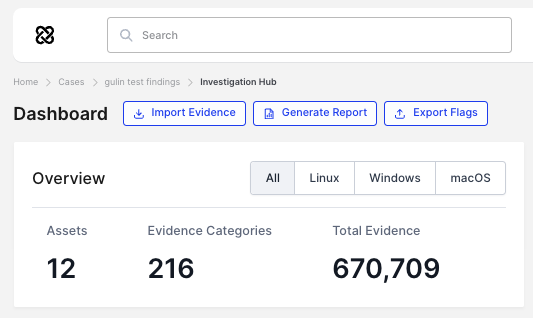
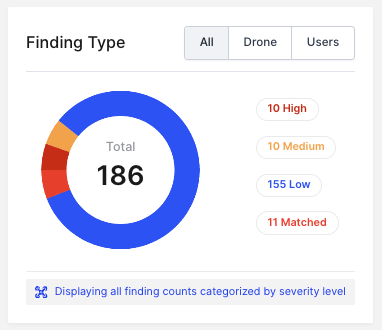
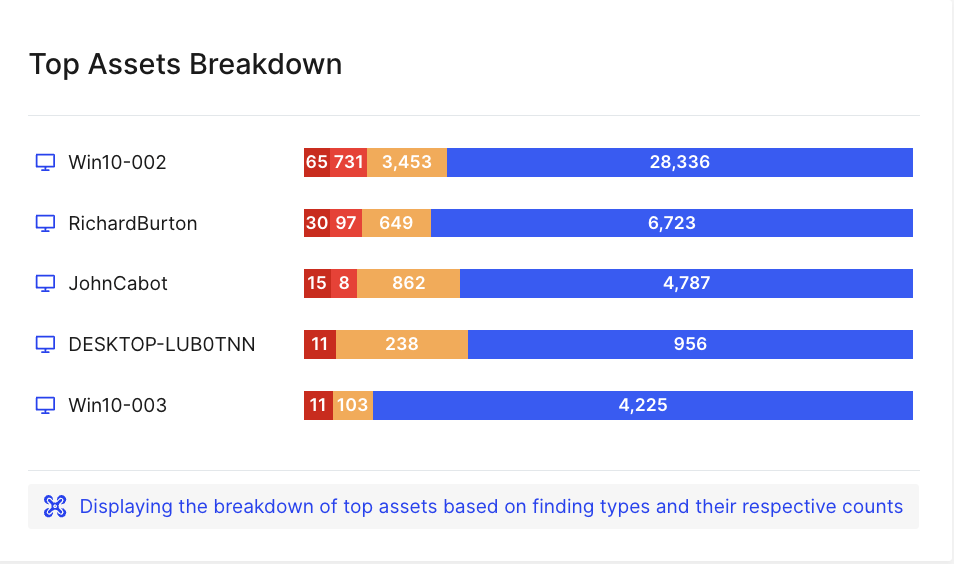
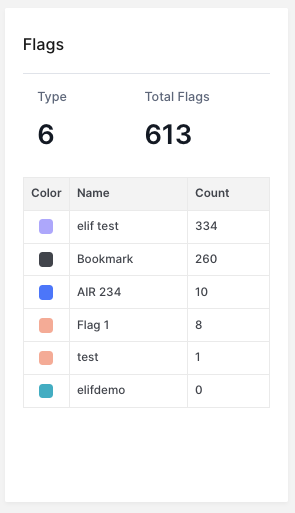
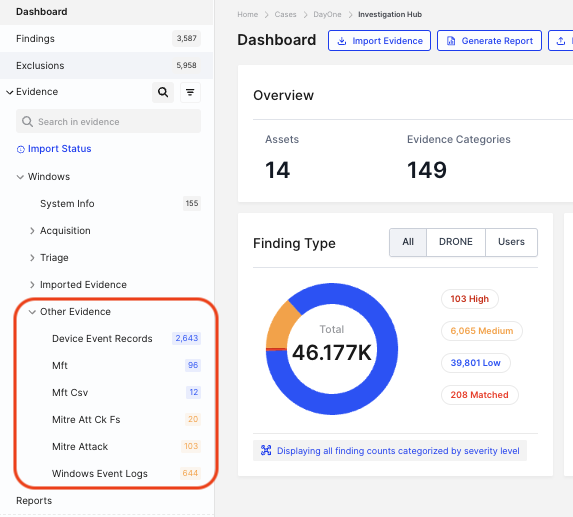
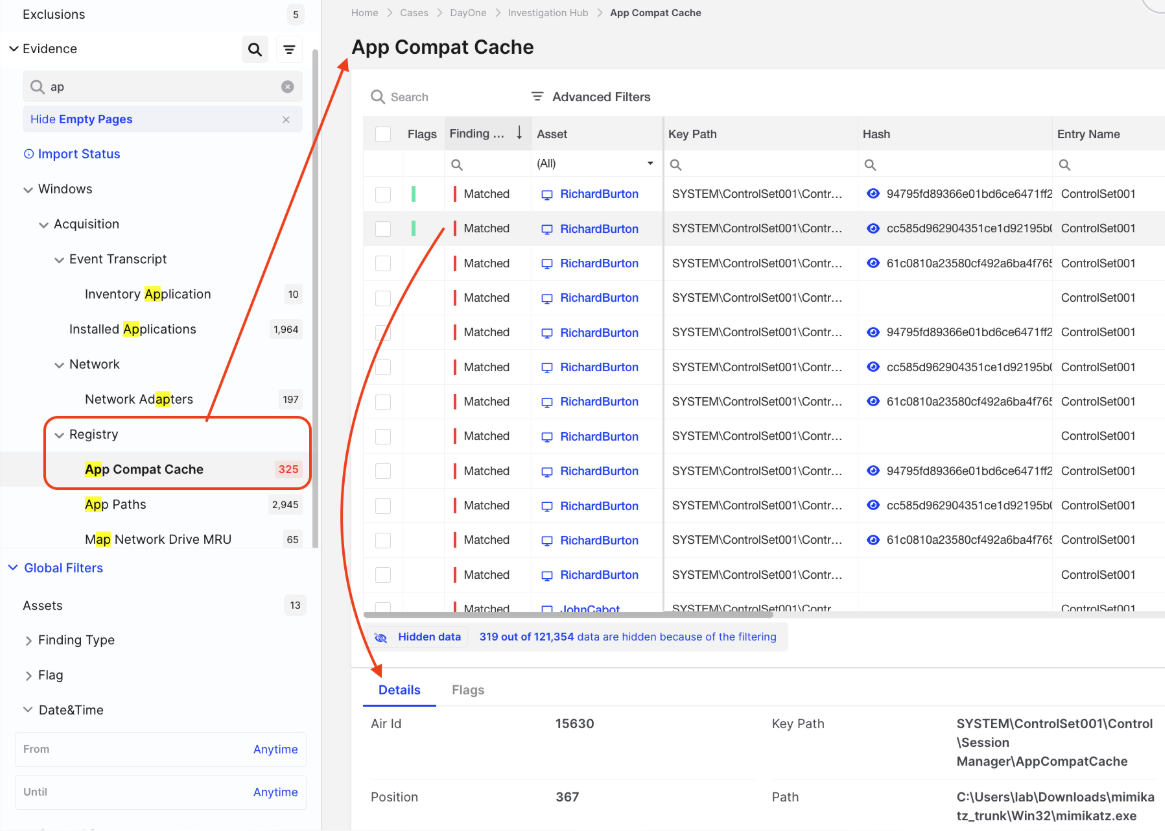
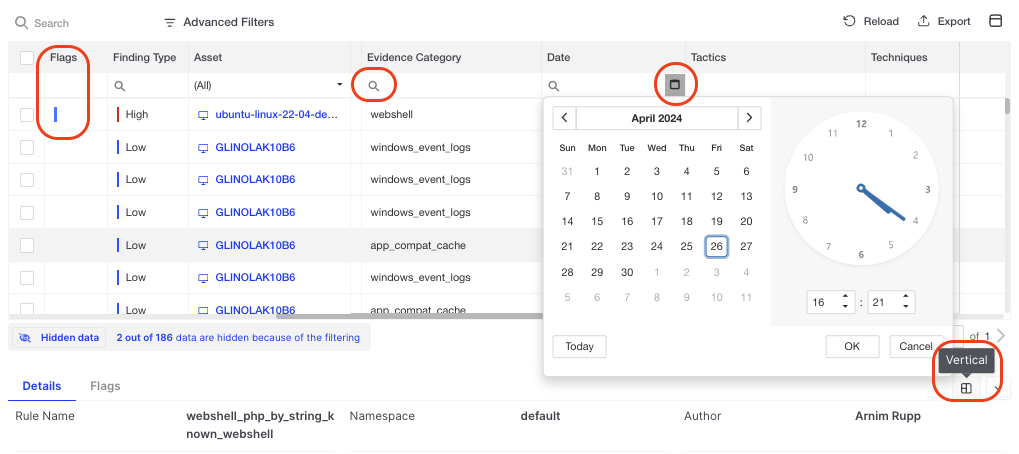
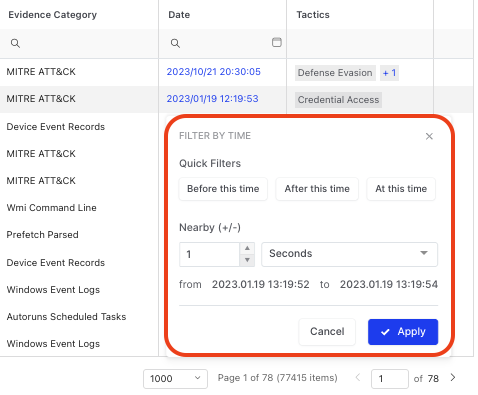
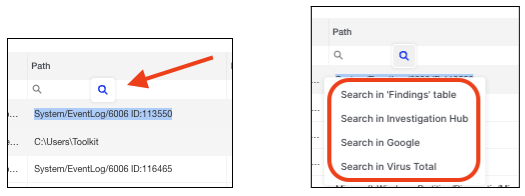
 **Sticky Column Headings:** The selection and position of columns will remain saved in your browser across all AIR sessions unless you clear your browser cookies. This ensures that your preferred layout and data organization remain consistent, enhancing both efficiency and the user experience.
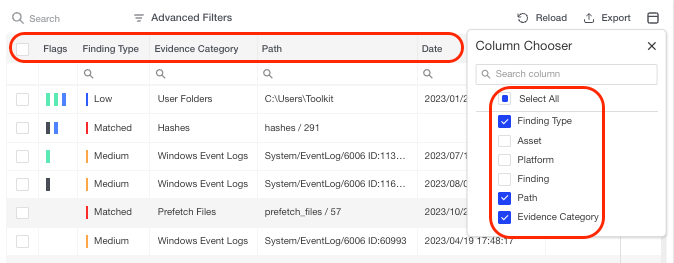
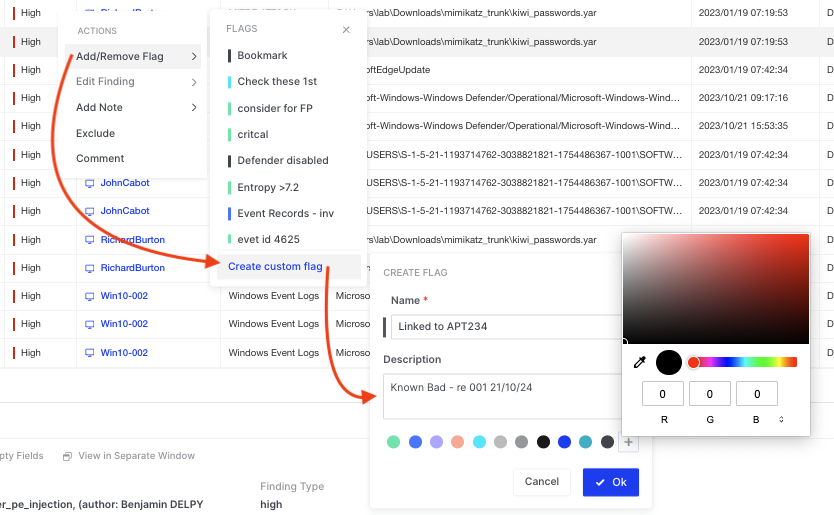
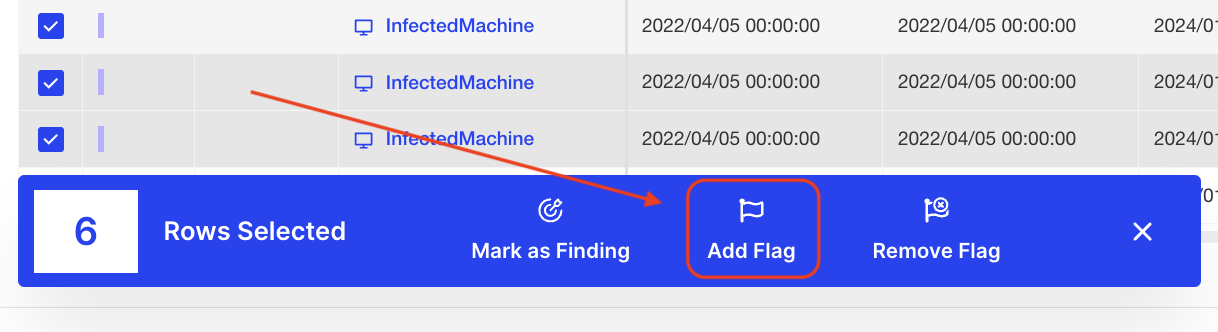
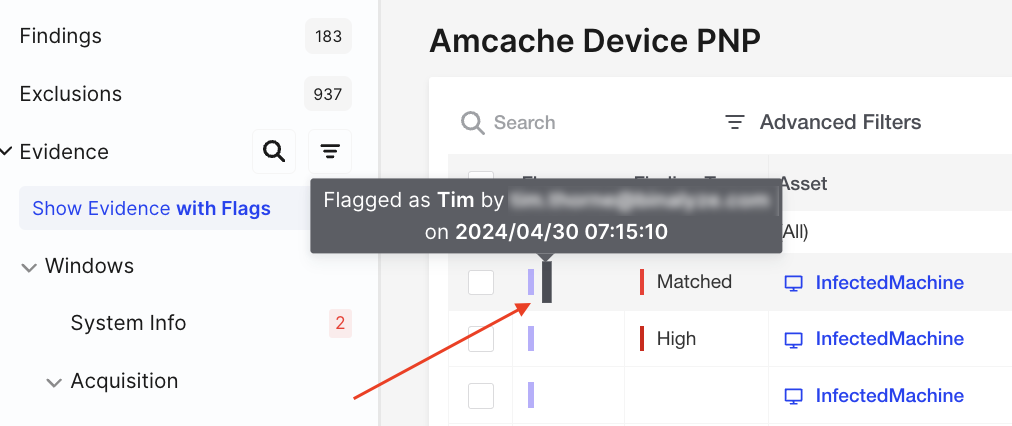
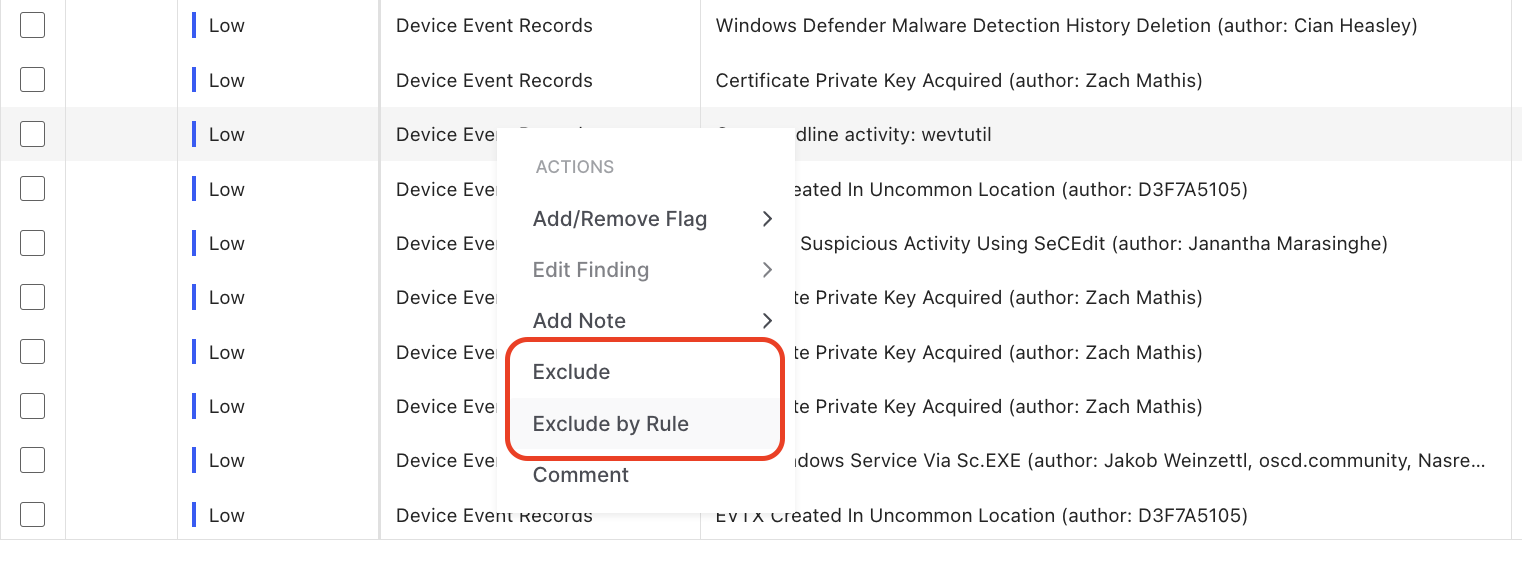
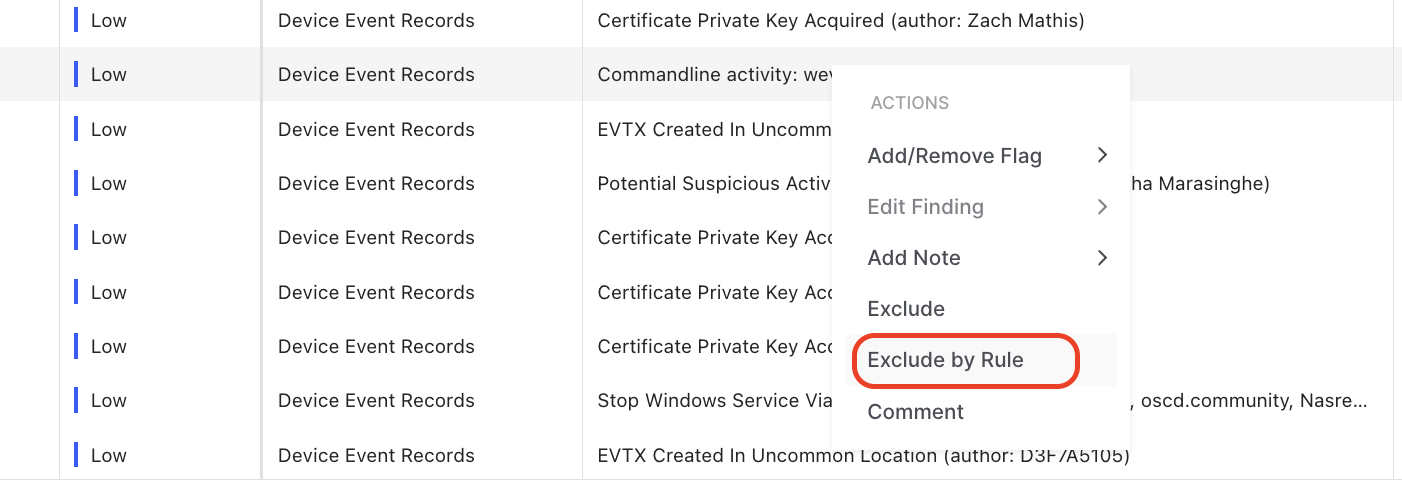
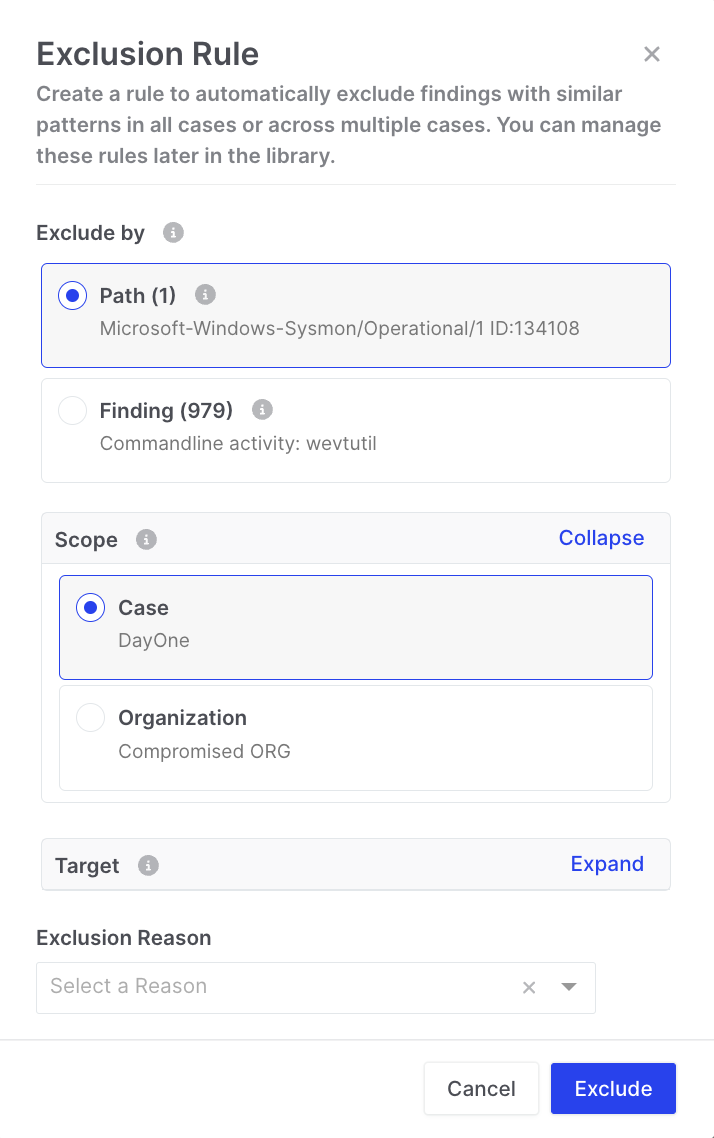
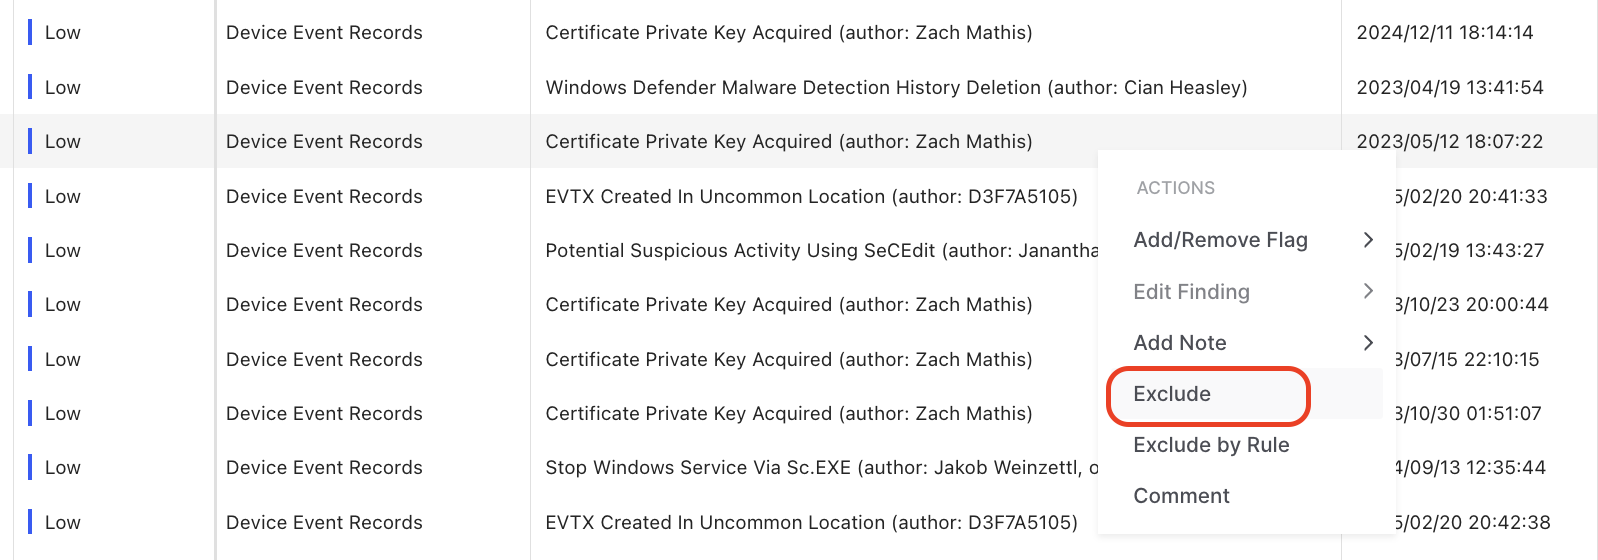
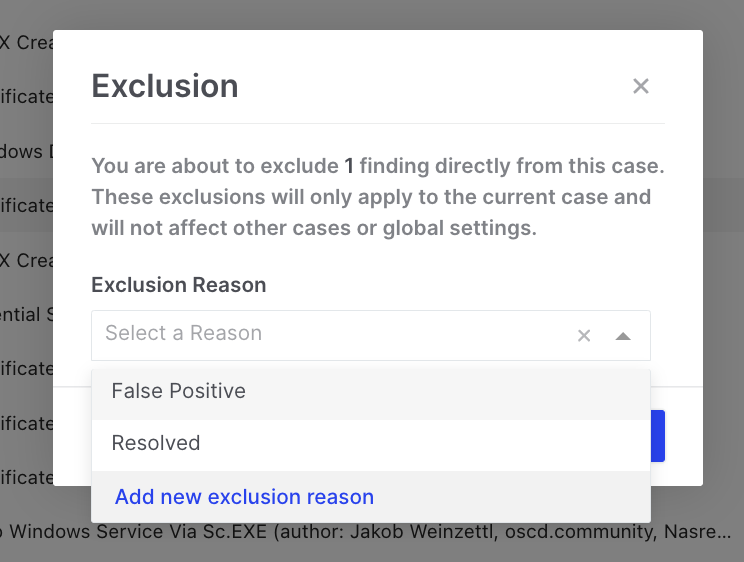
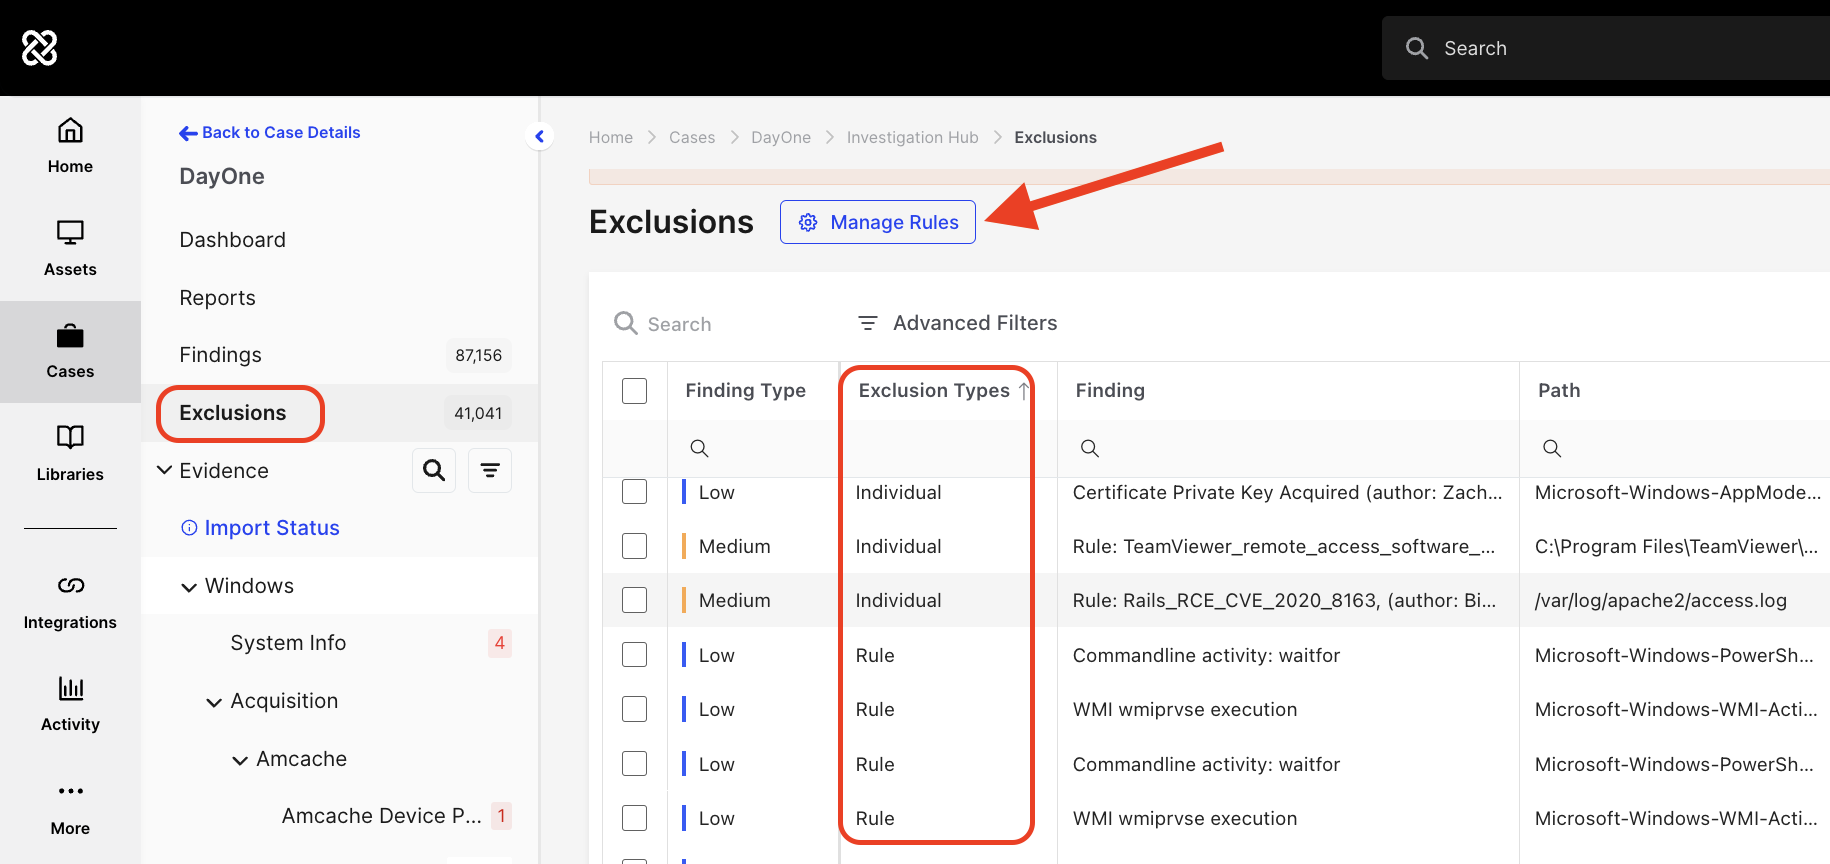
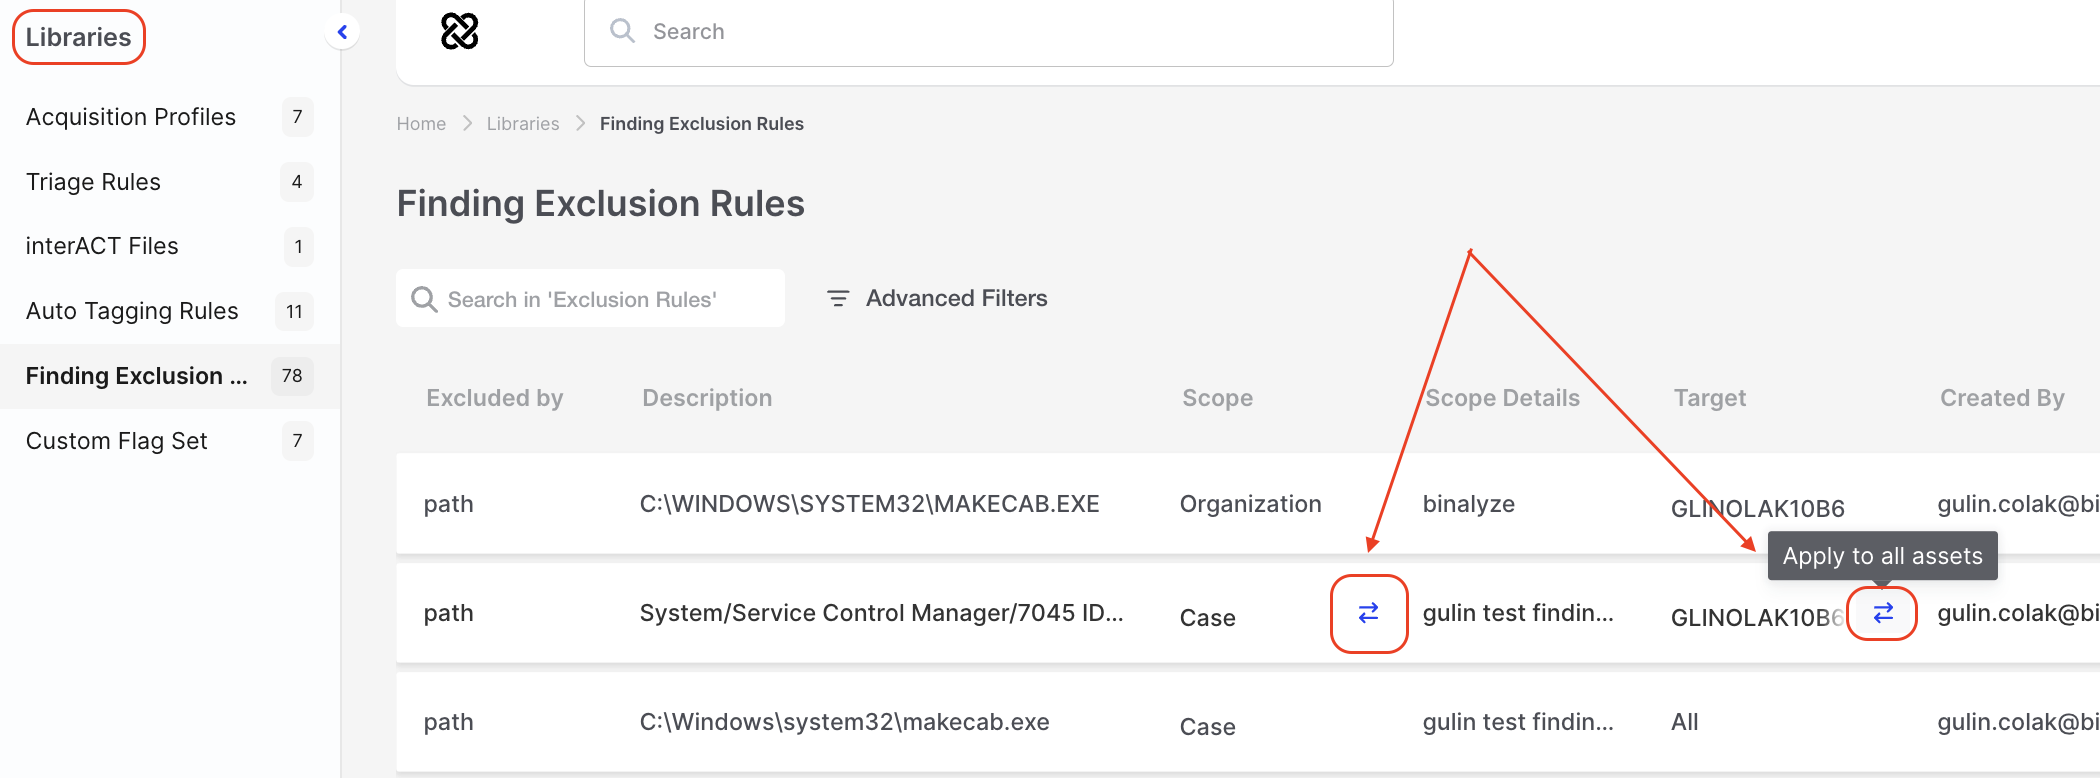
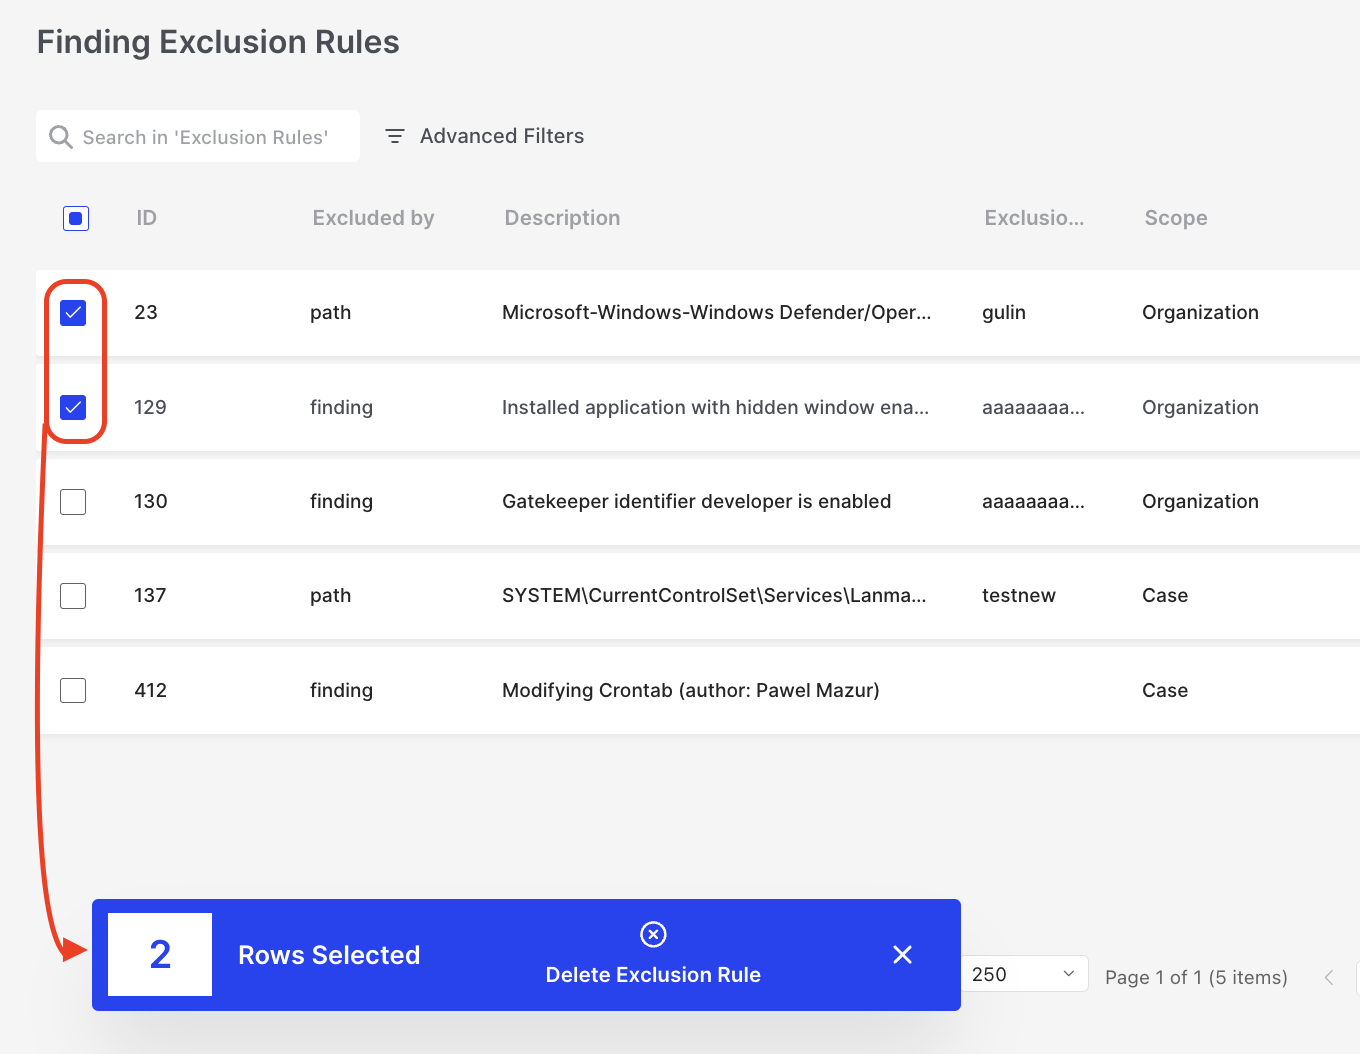
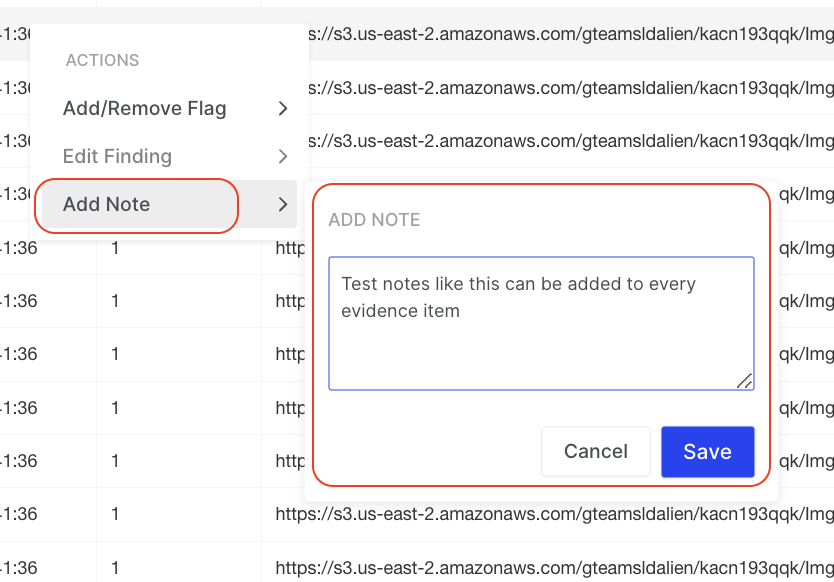
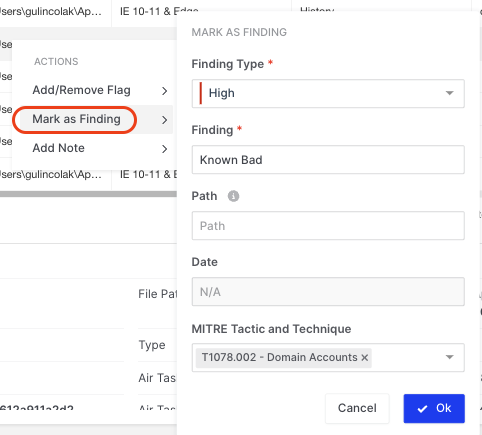
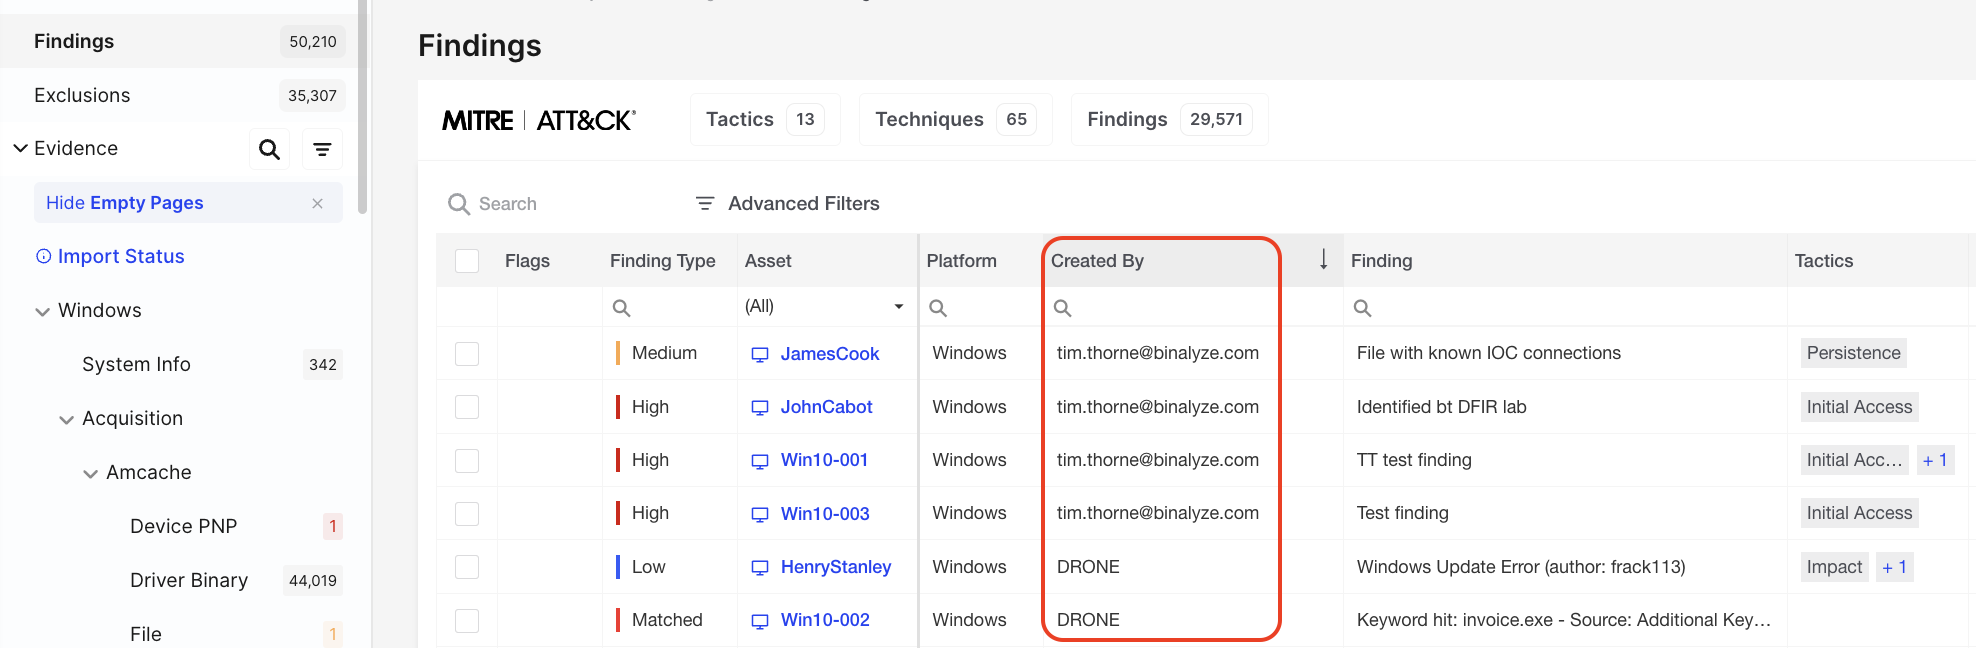
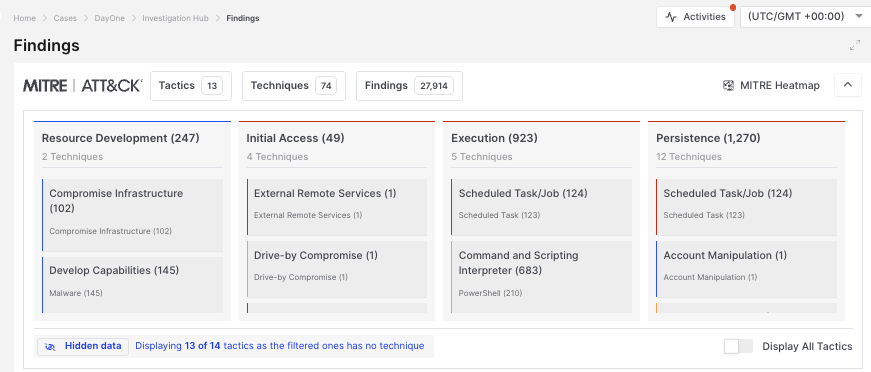
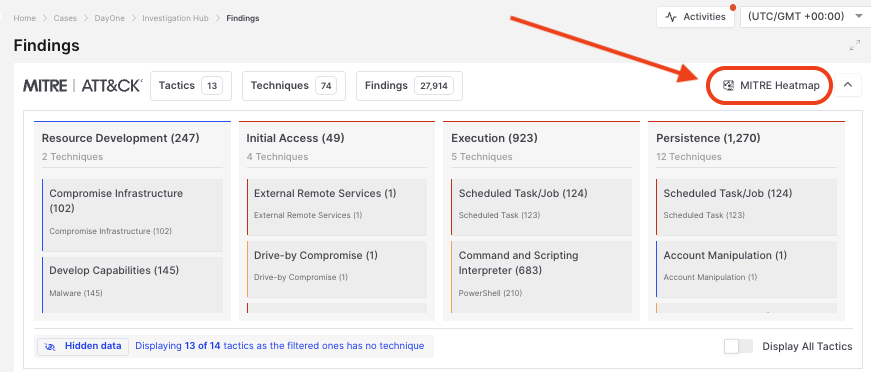
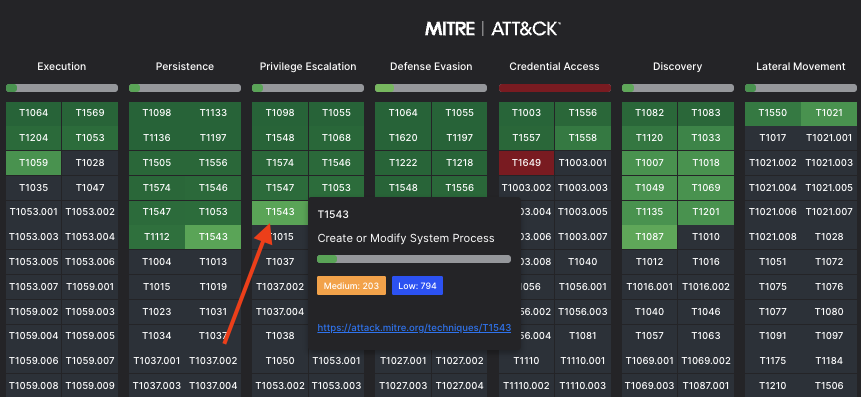
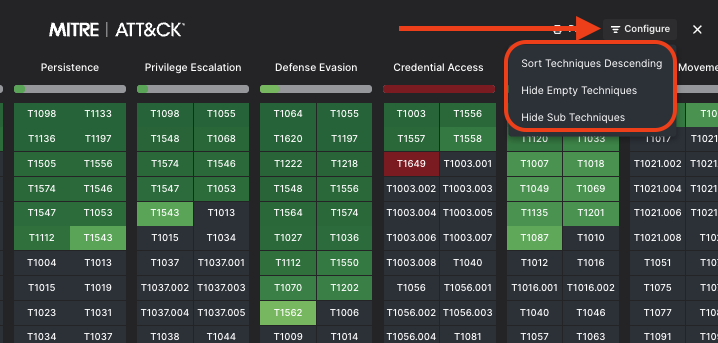
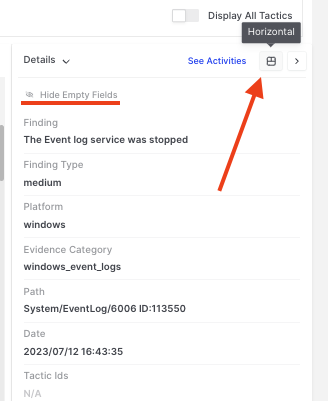
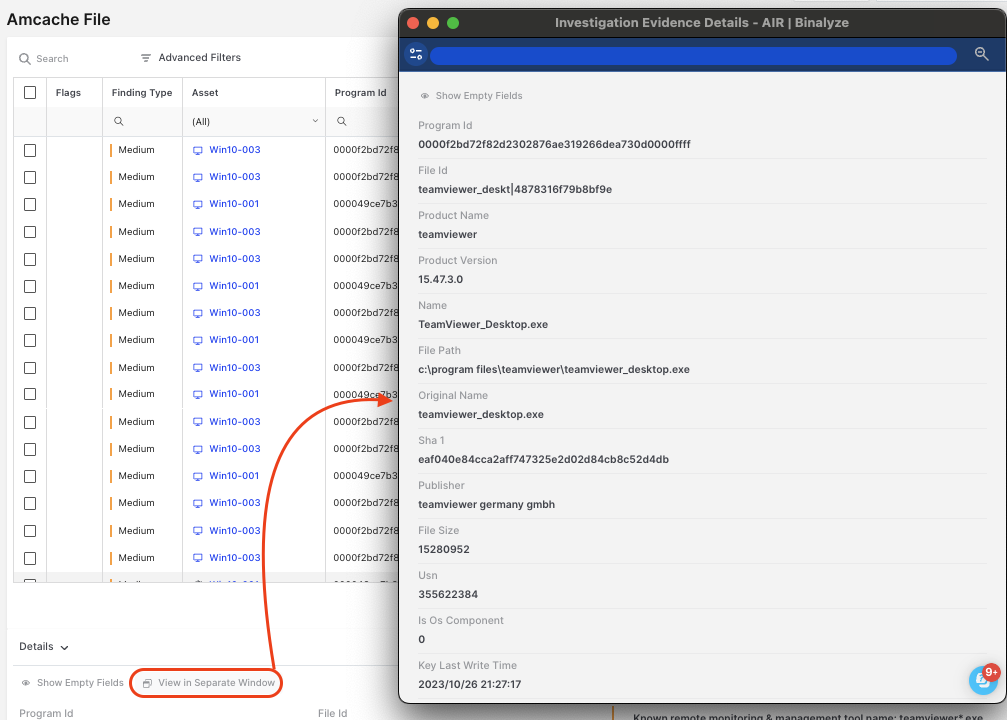 **Details View Example:**
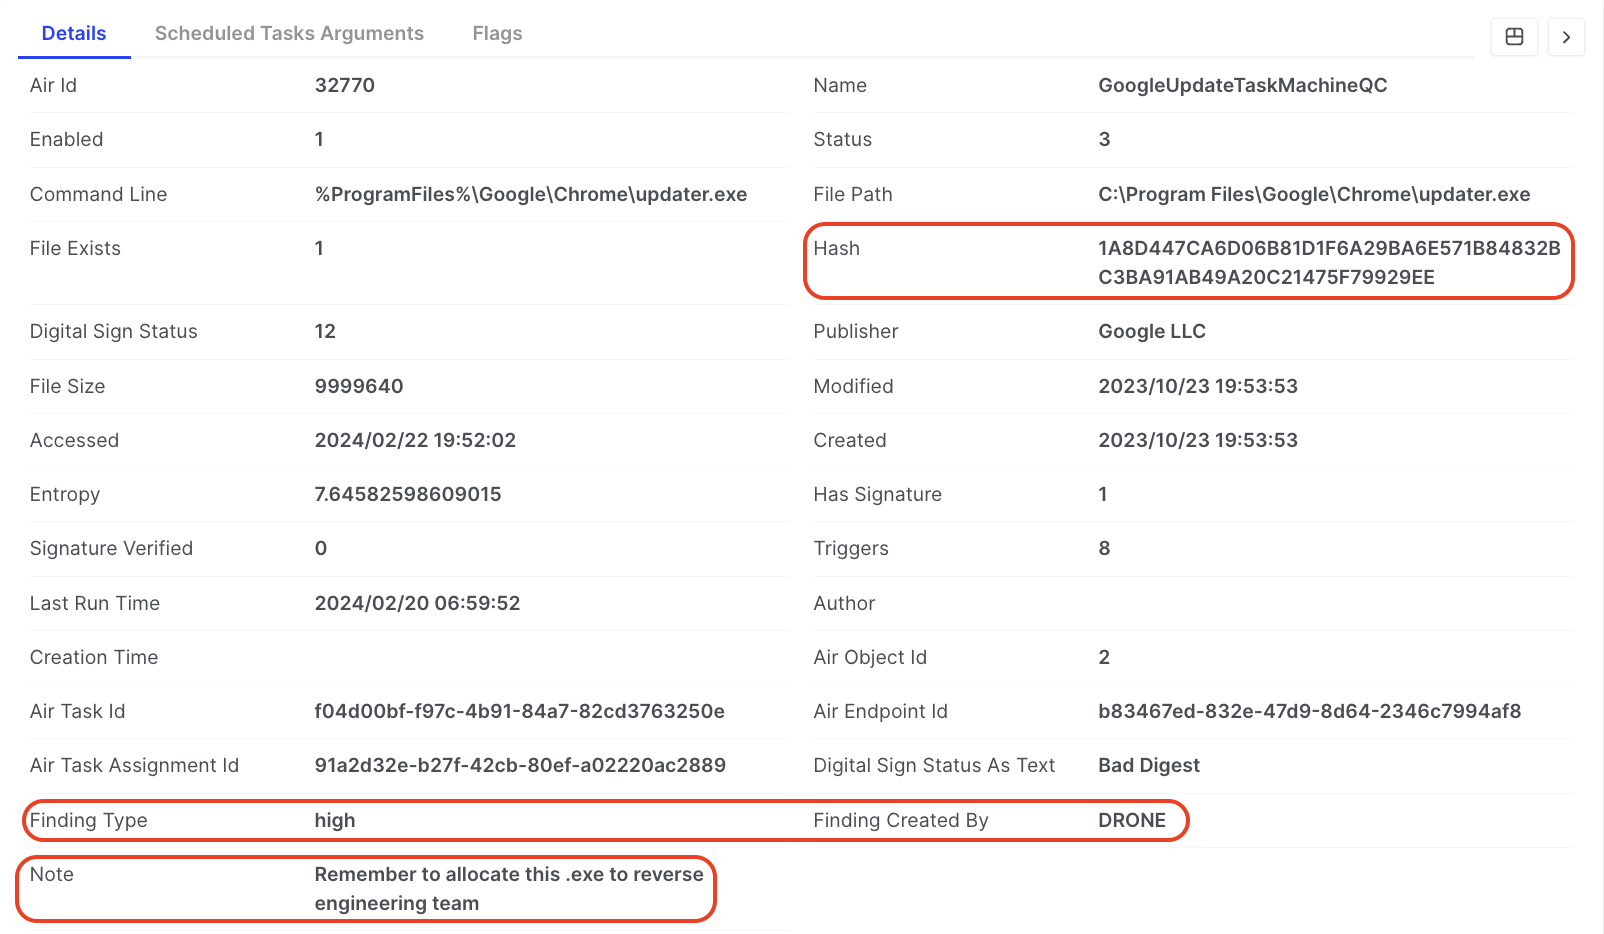
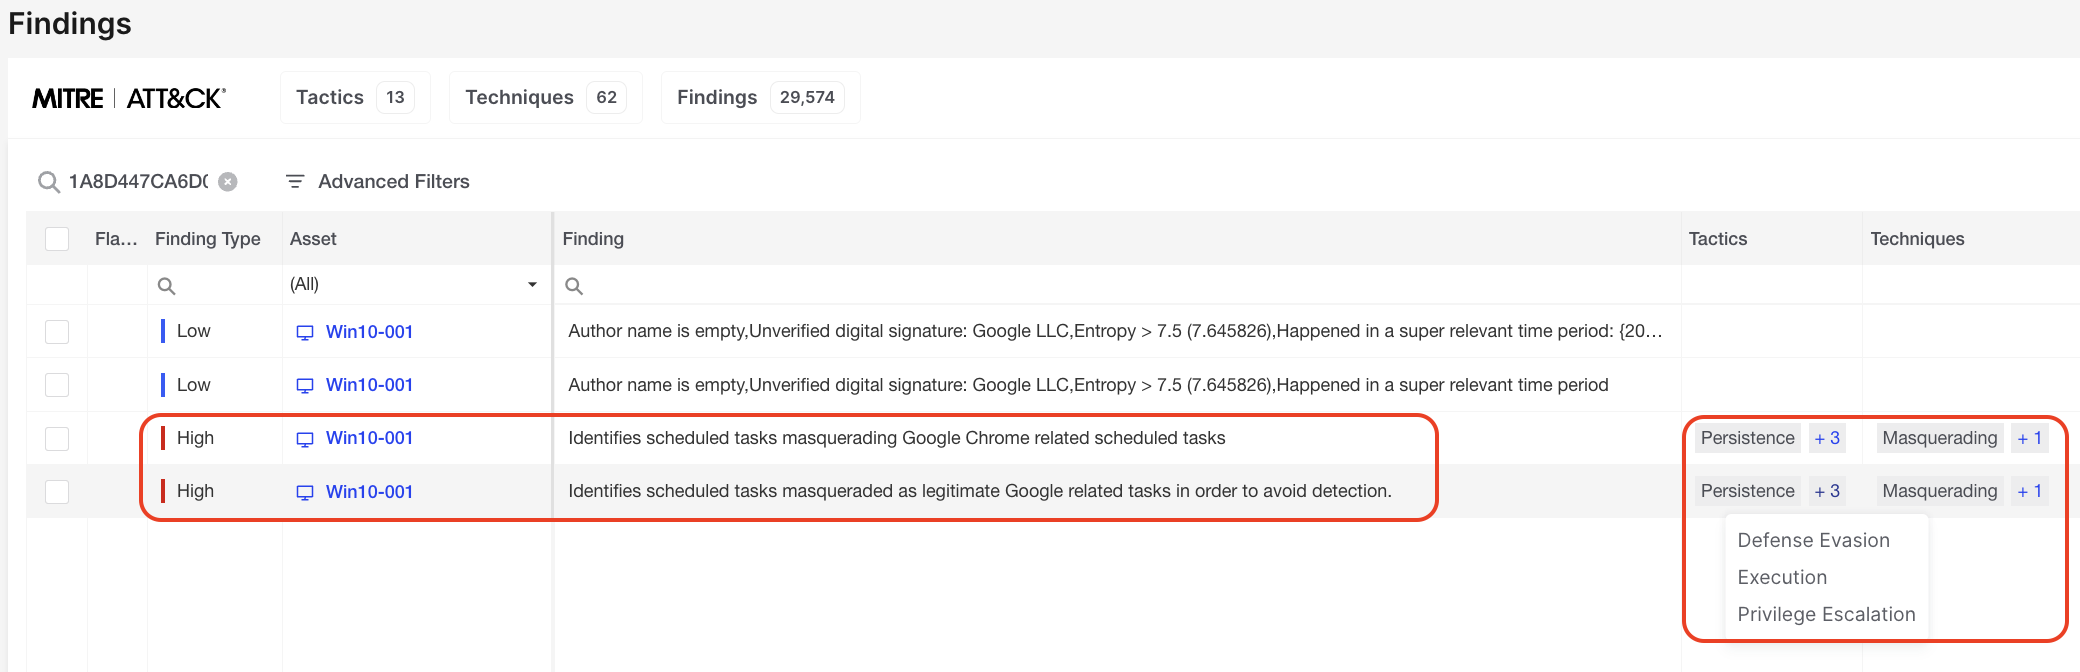


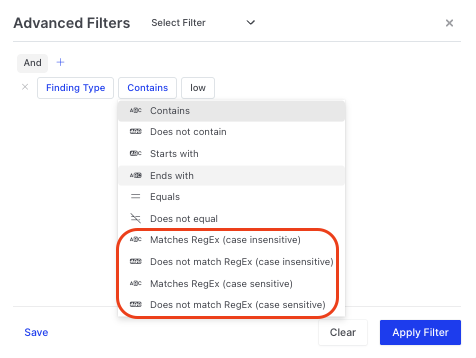
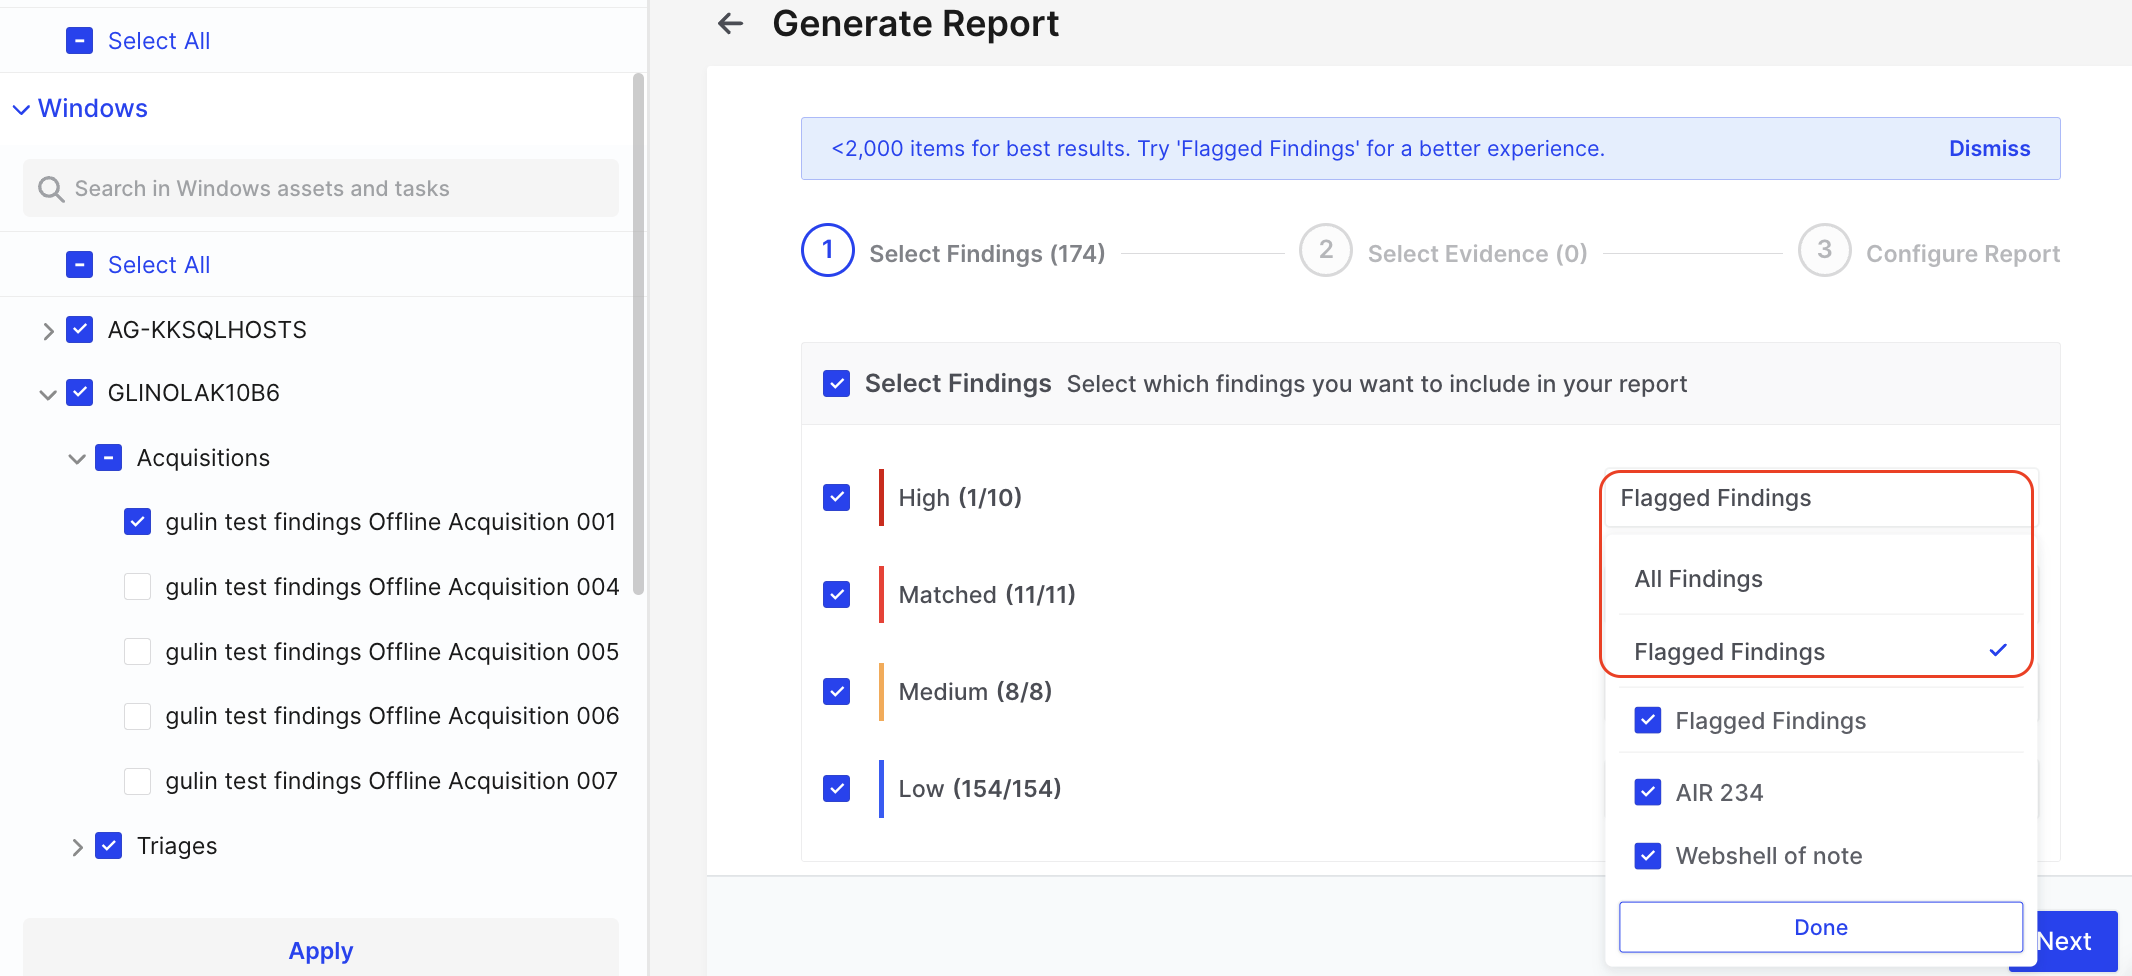
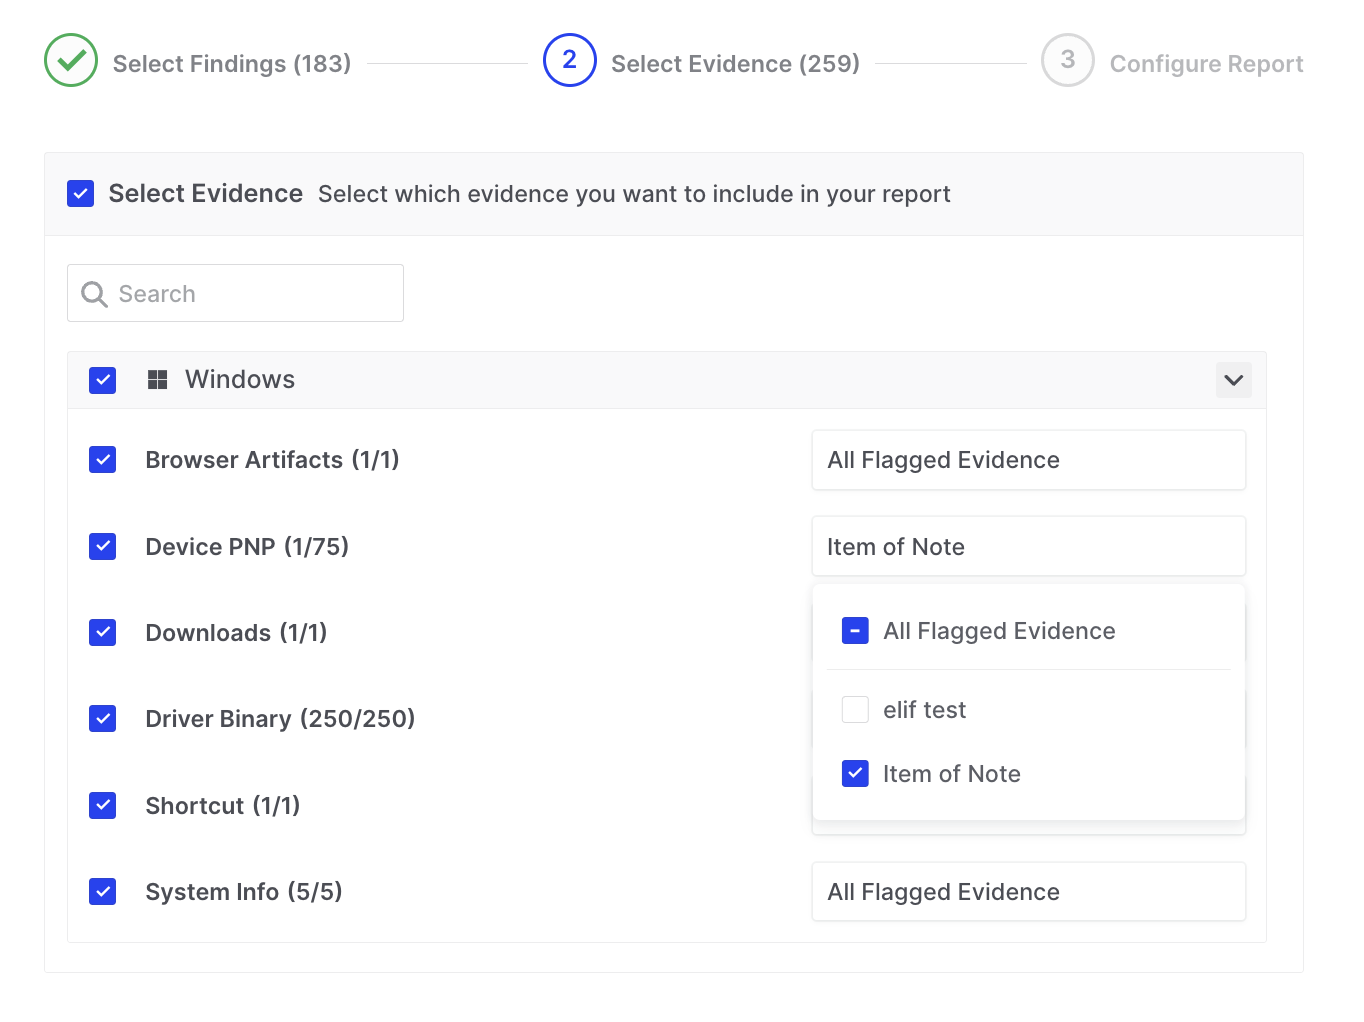


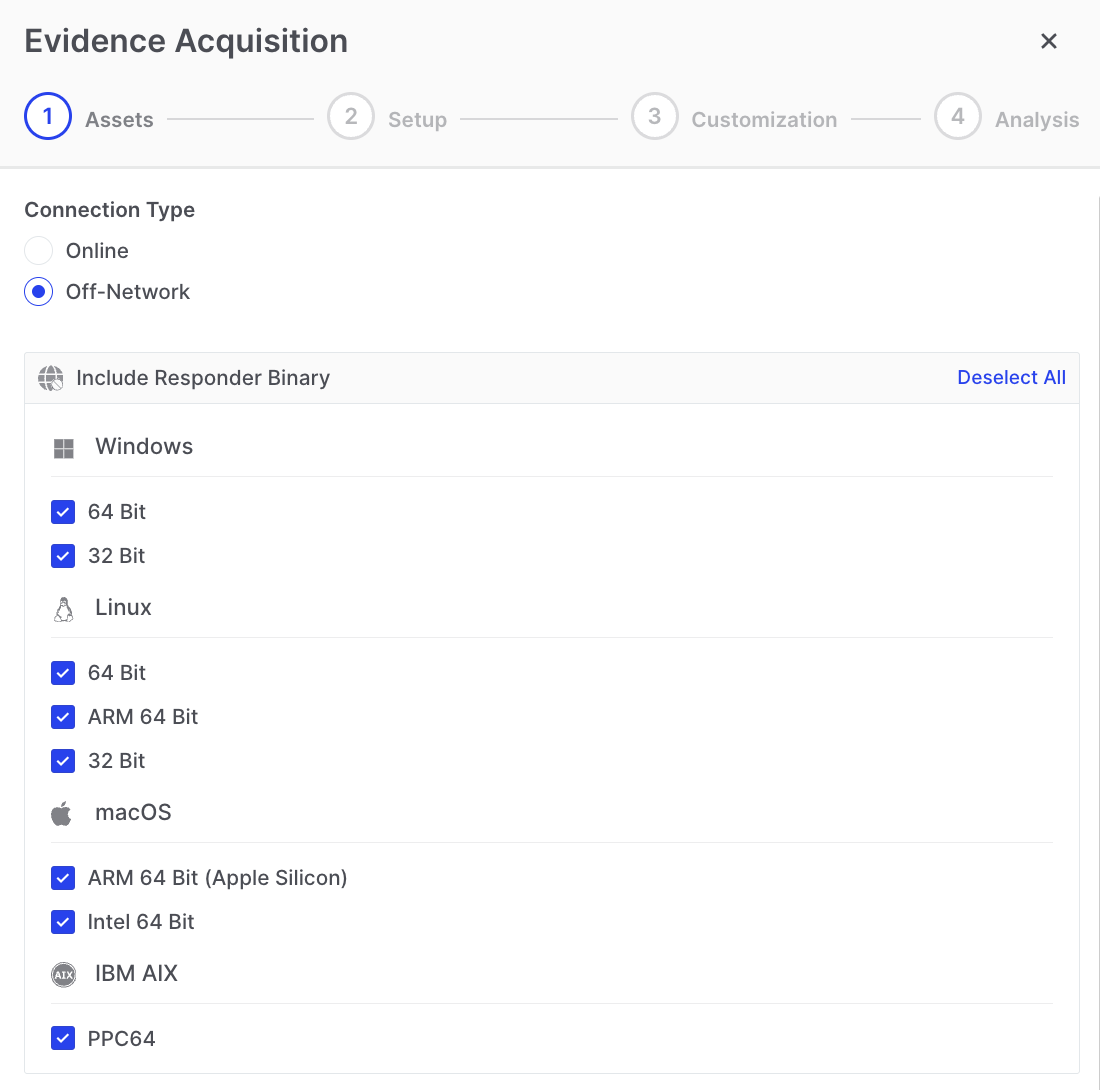
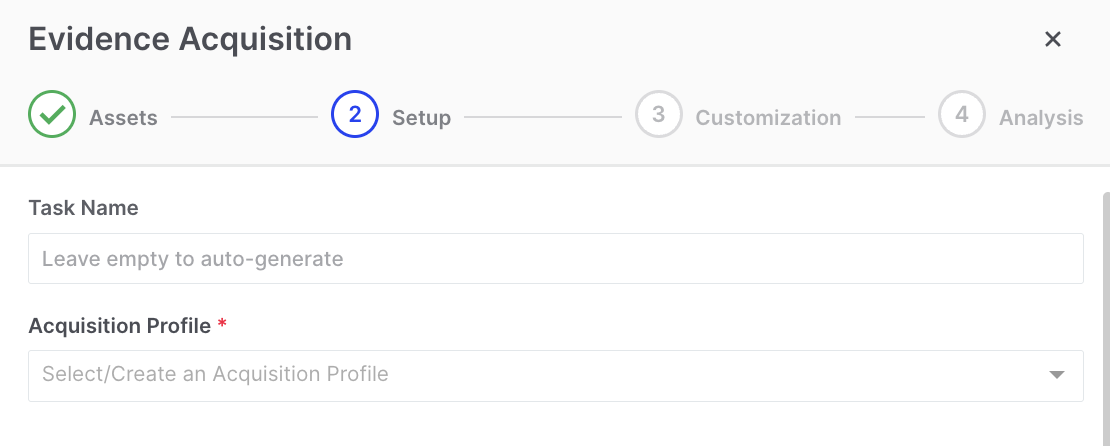
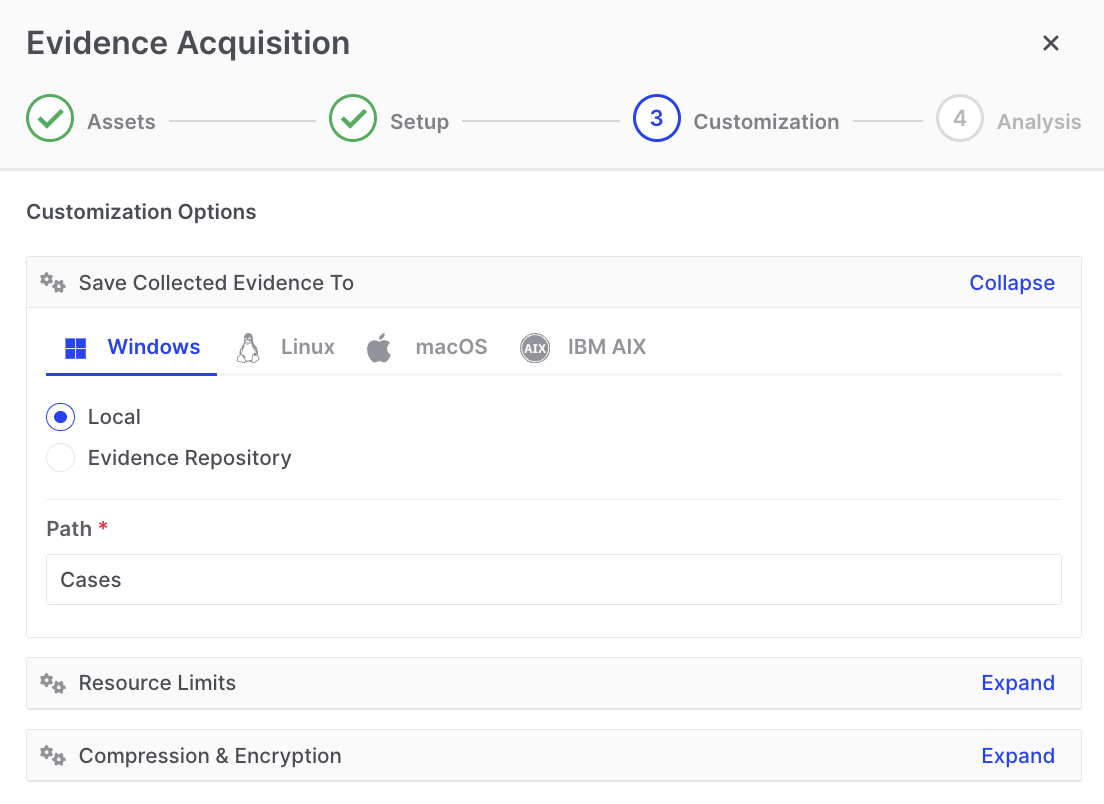
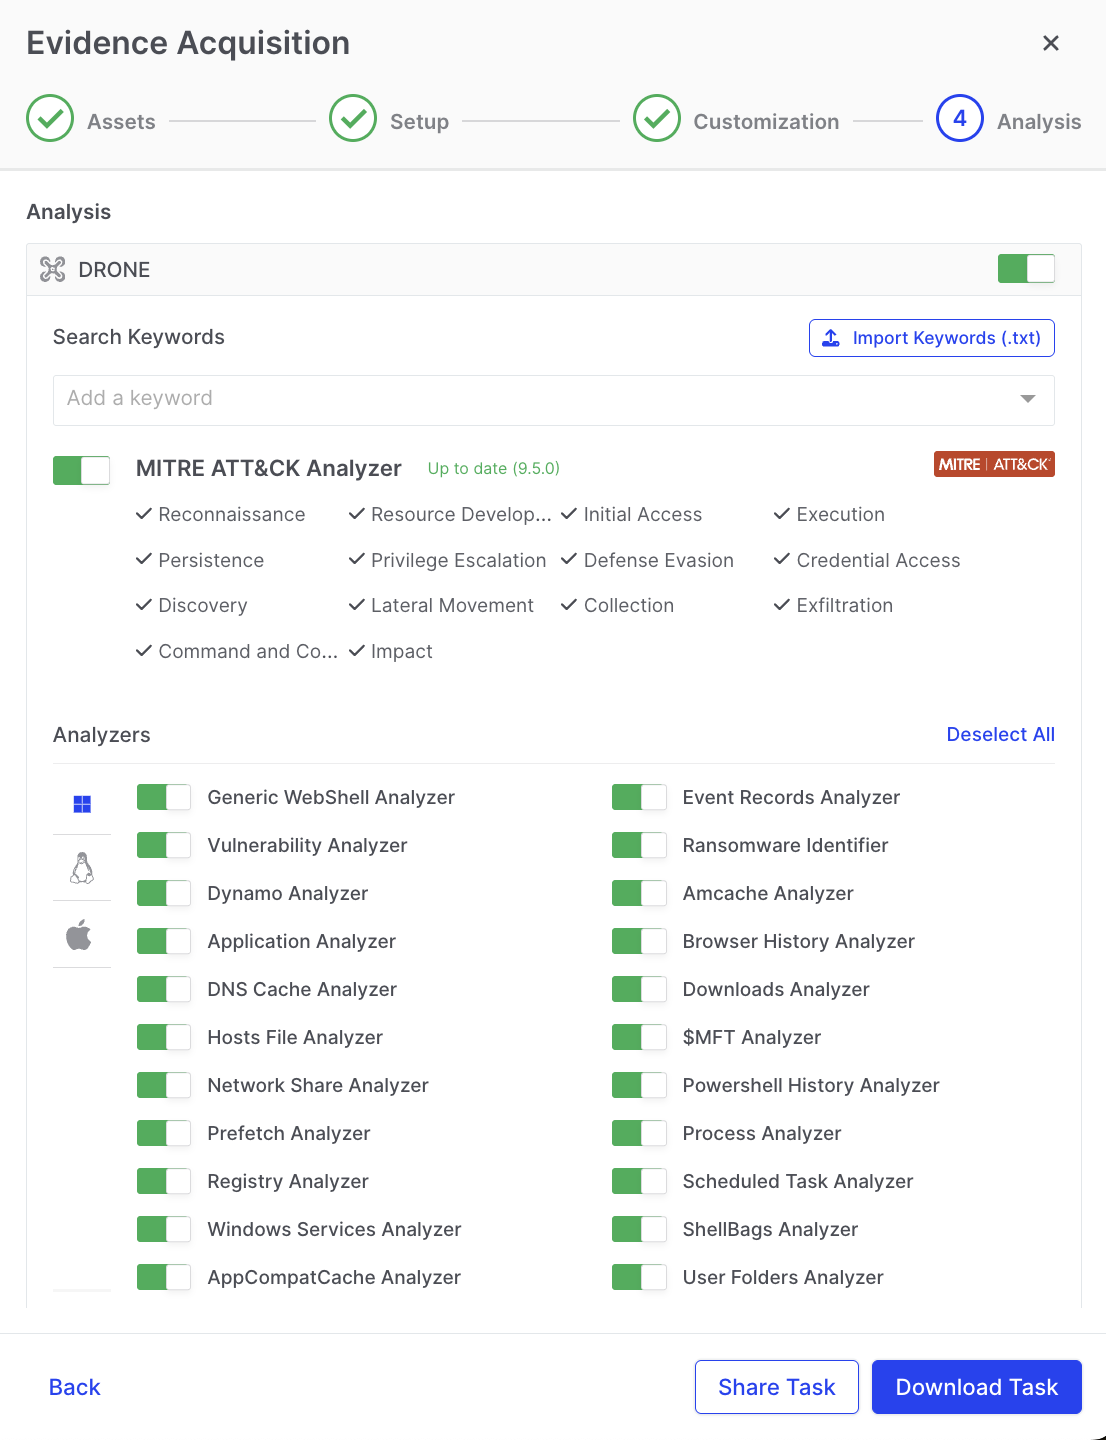
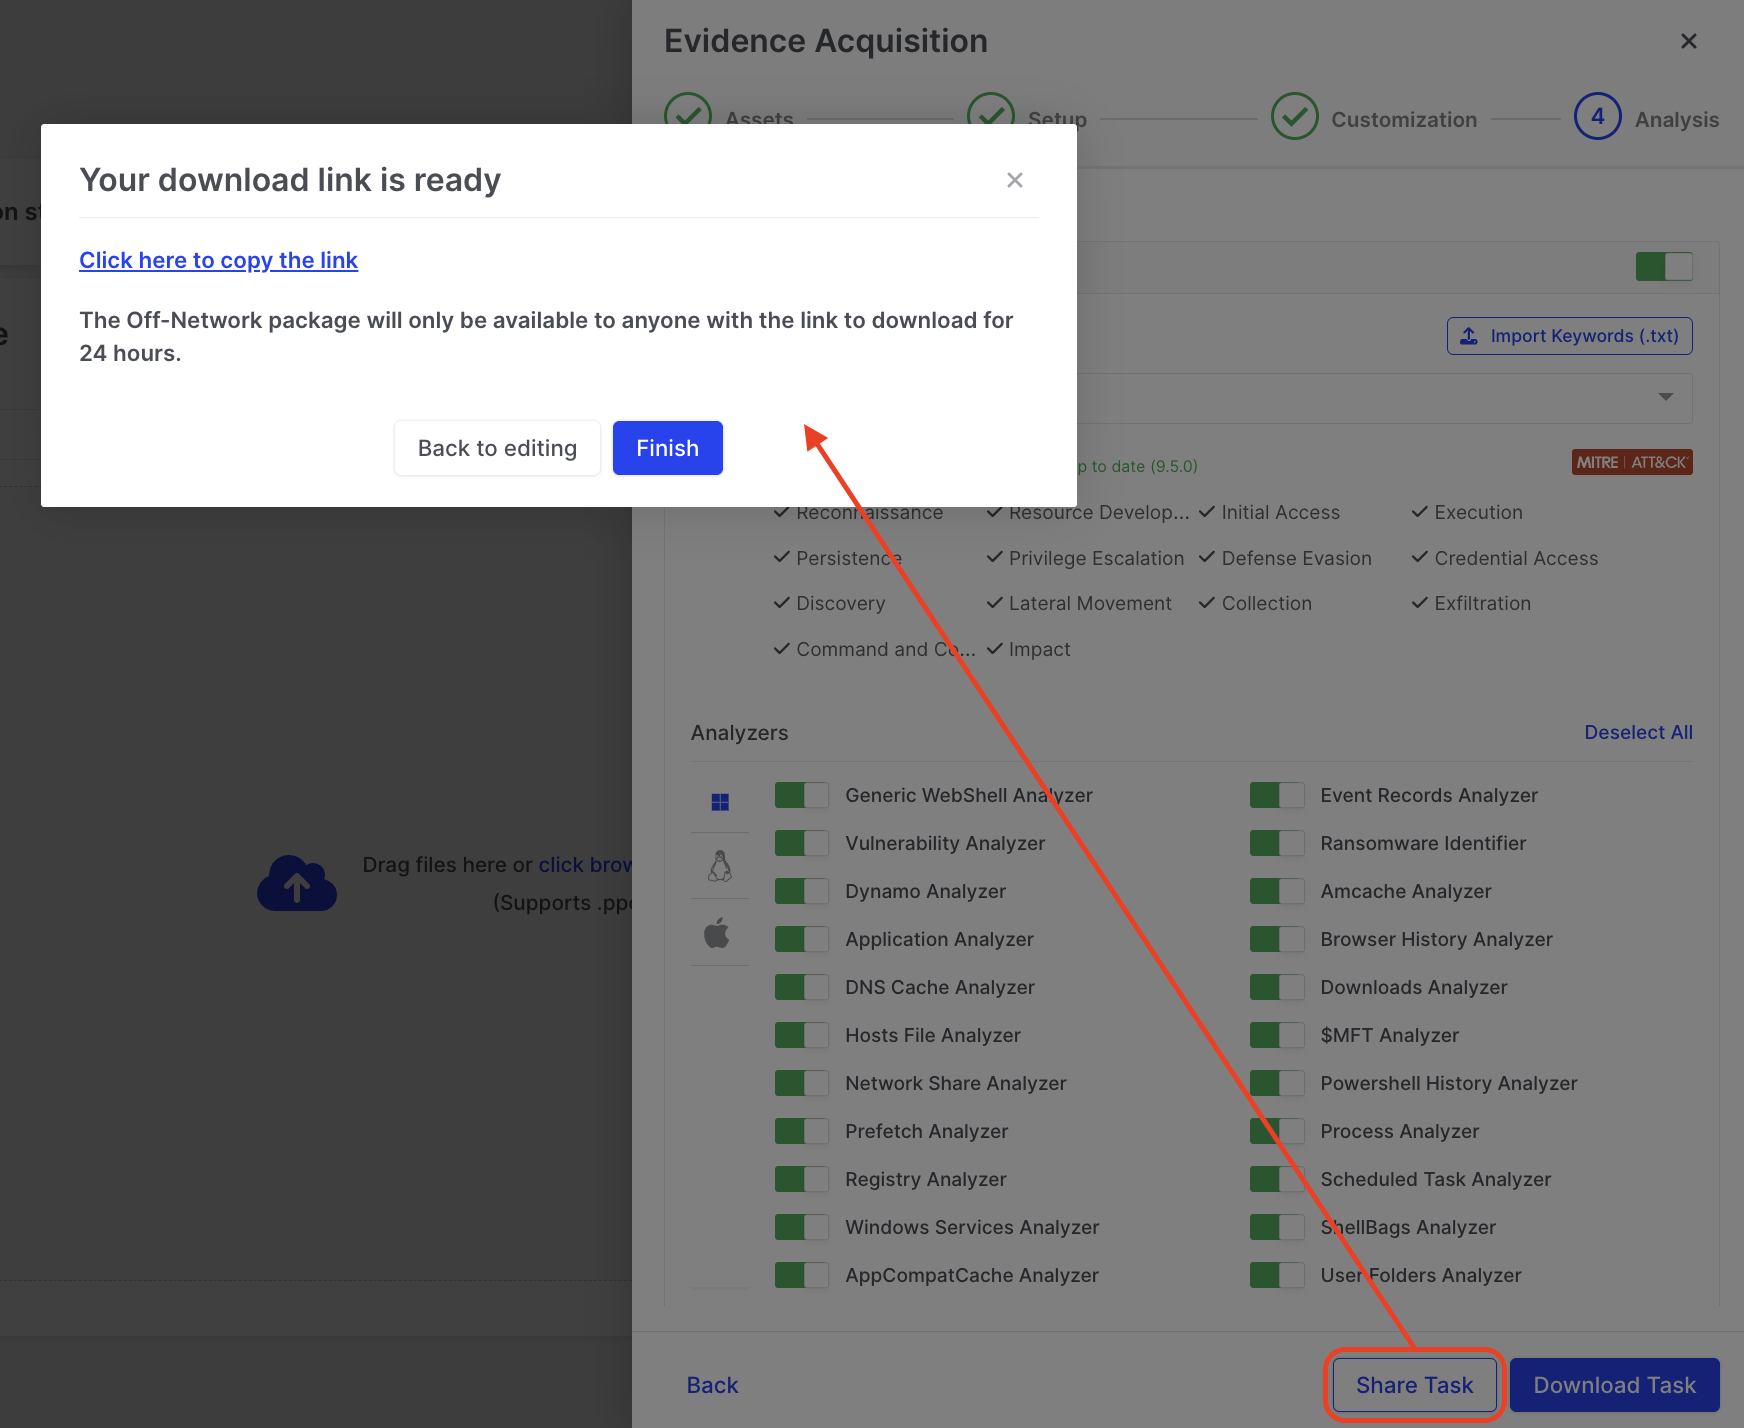


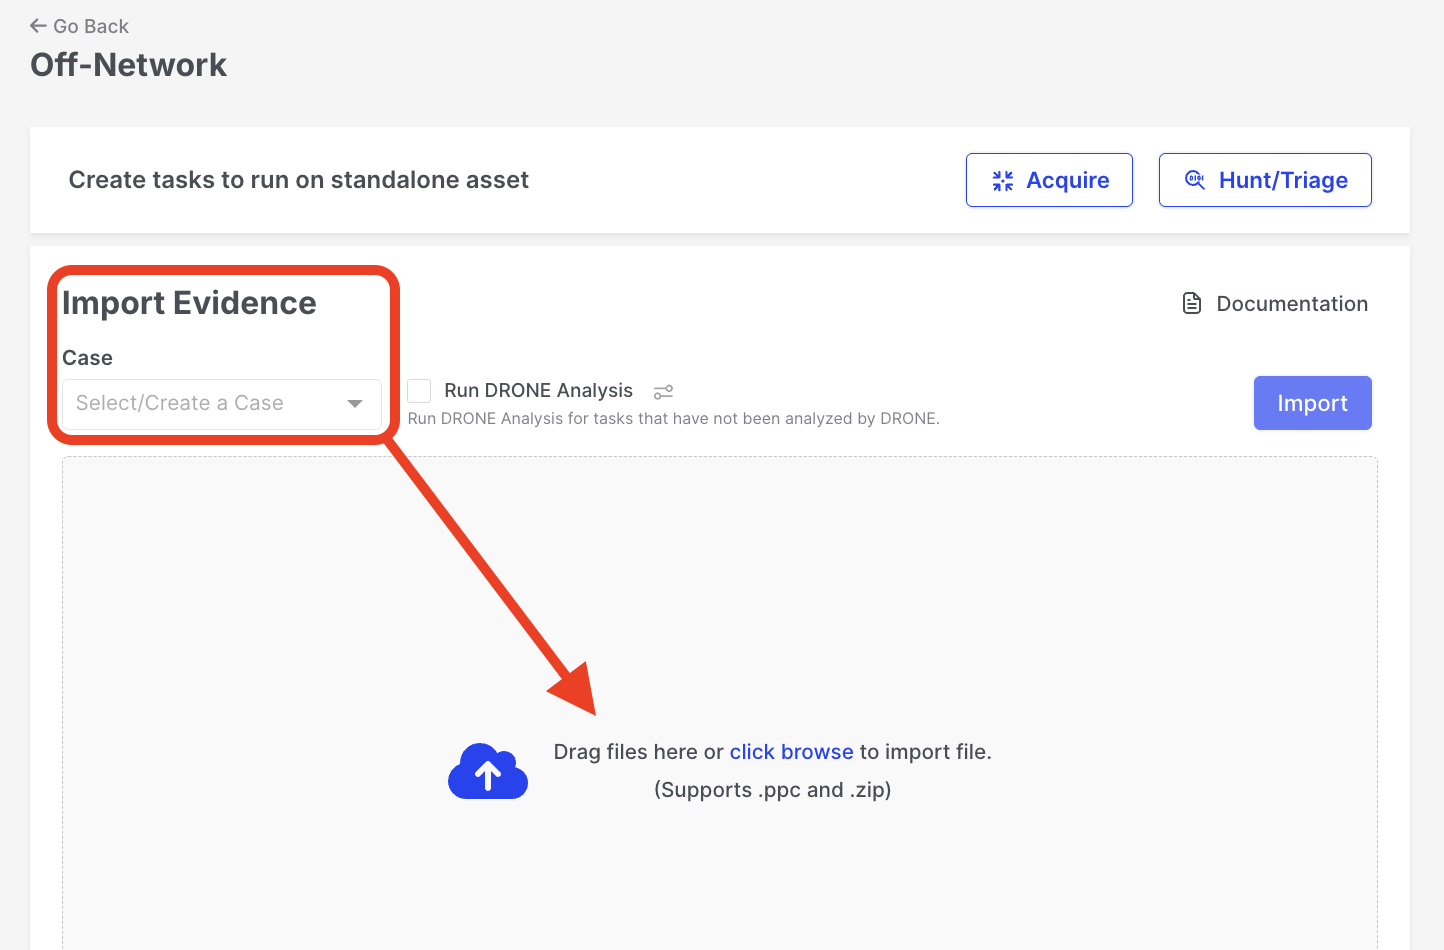
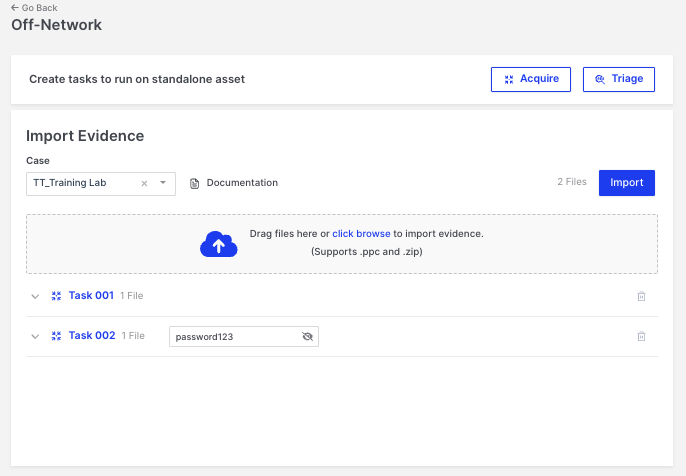
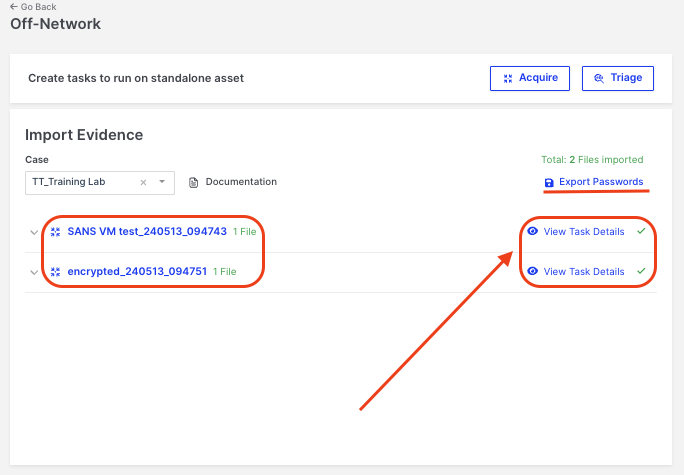
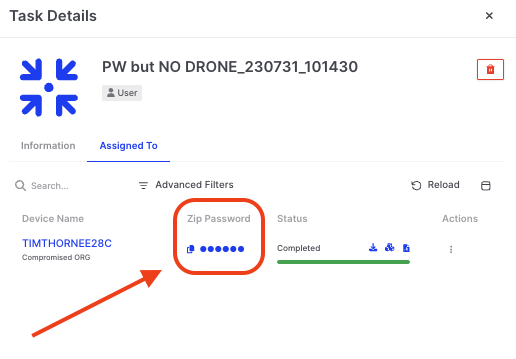
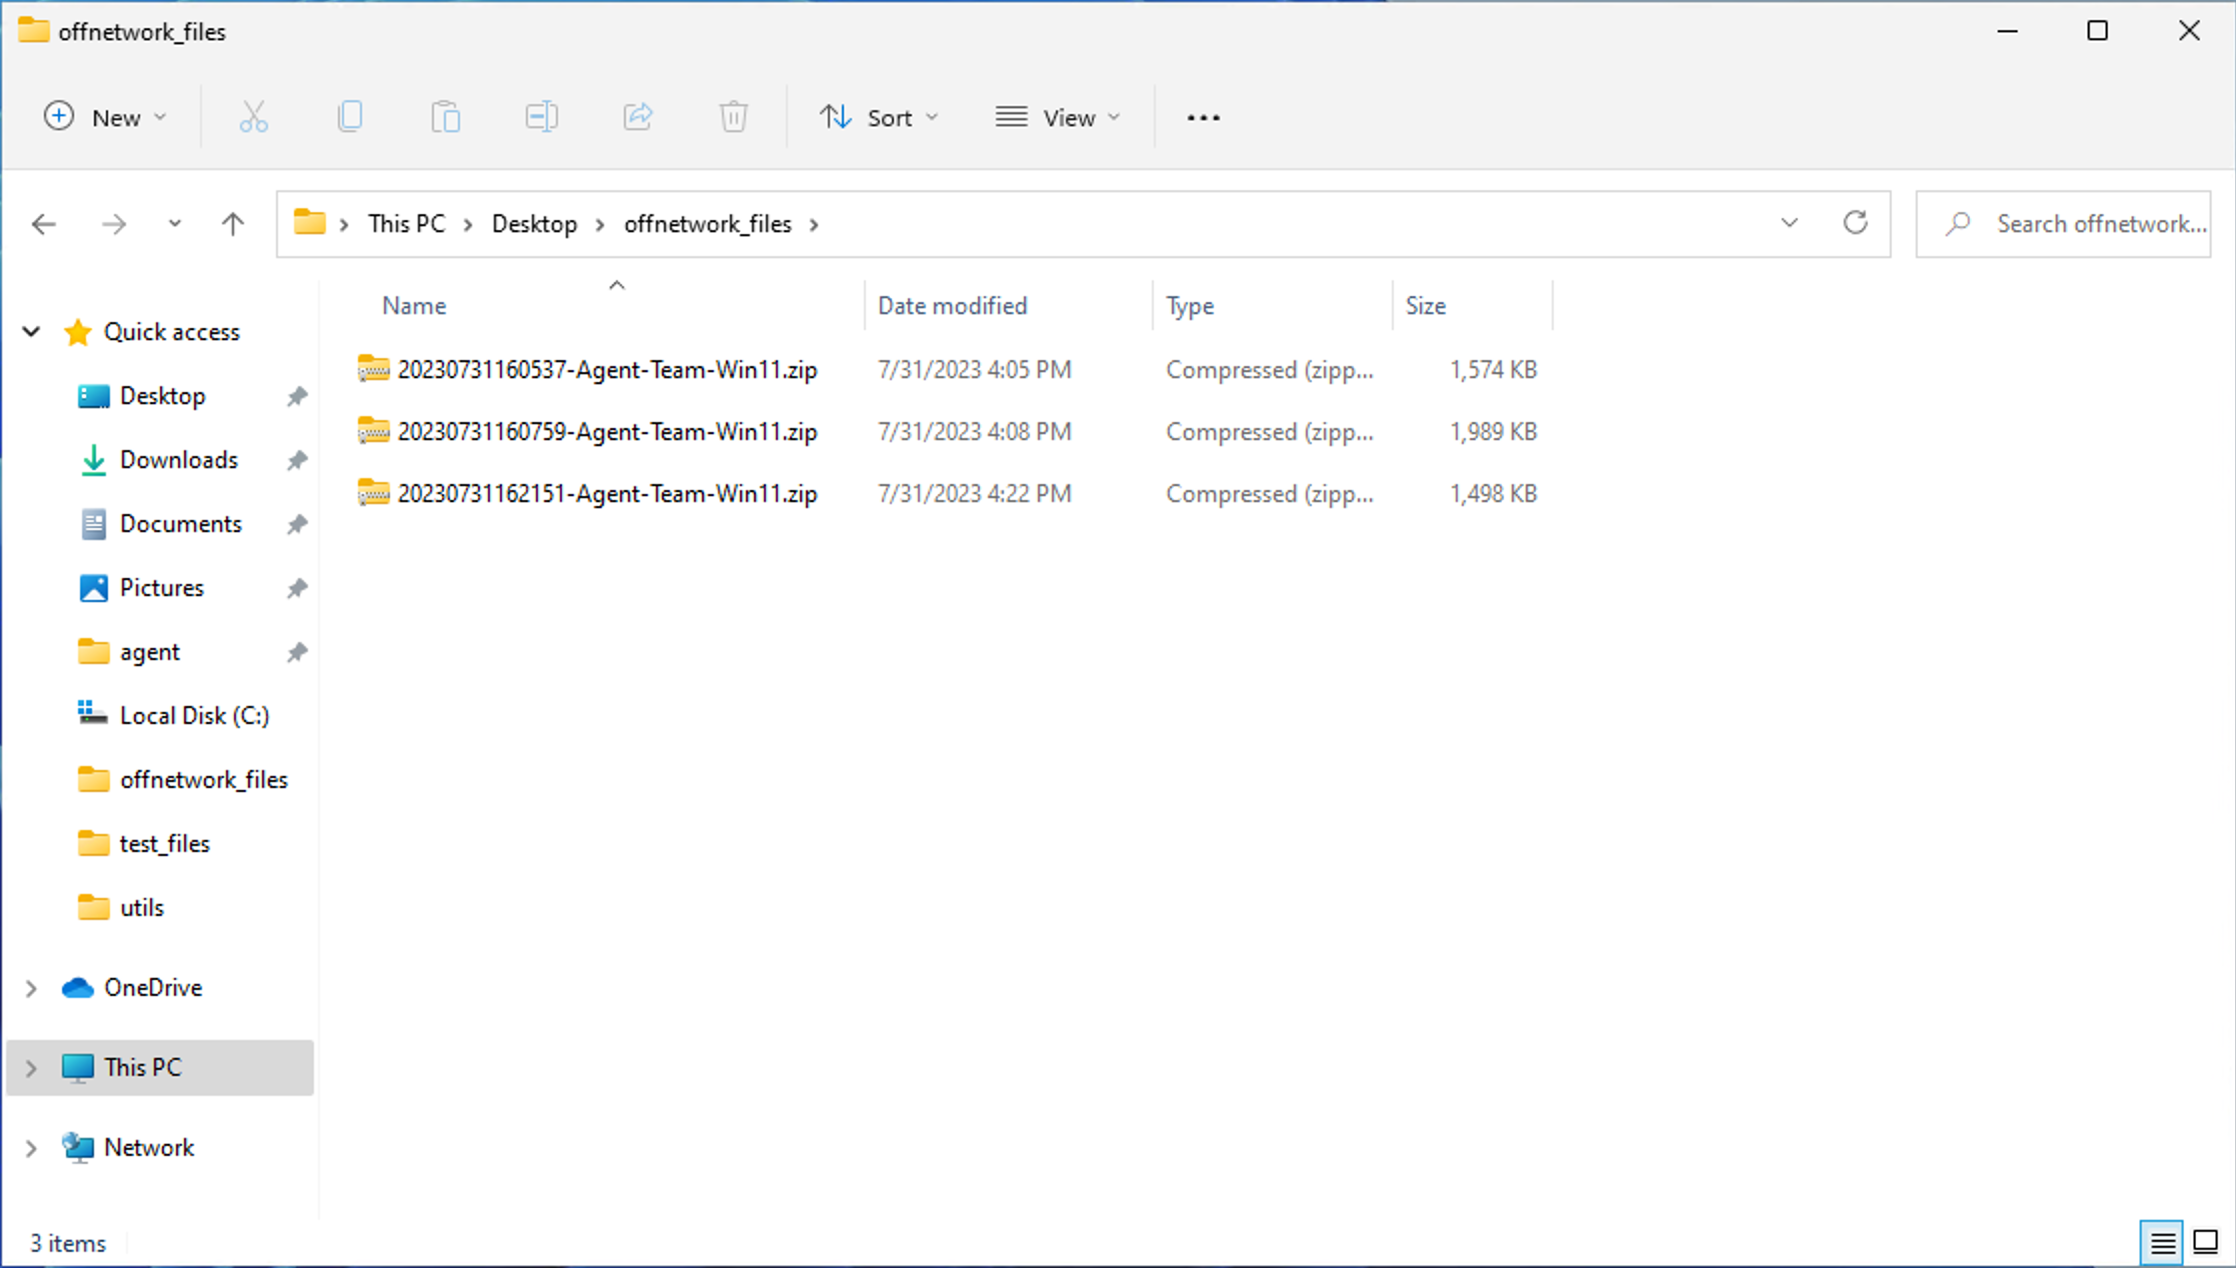
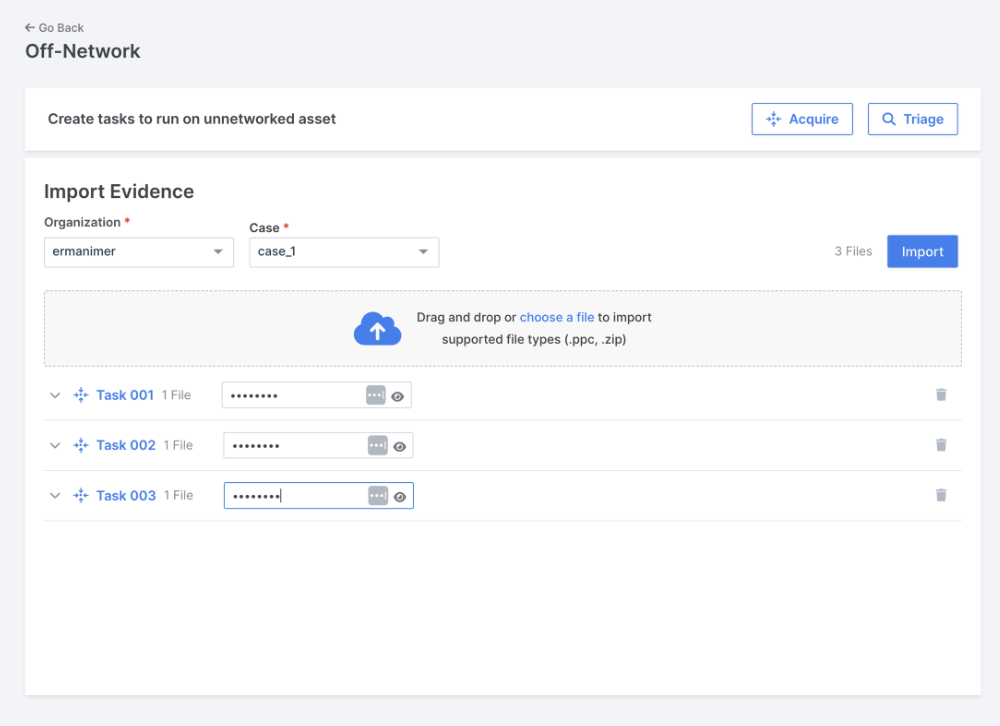
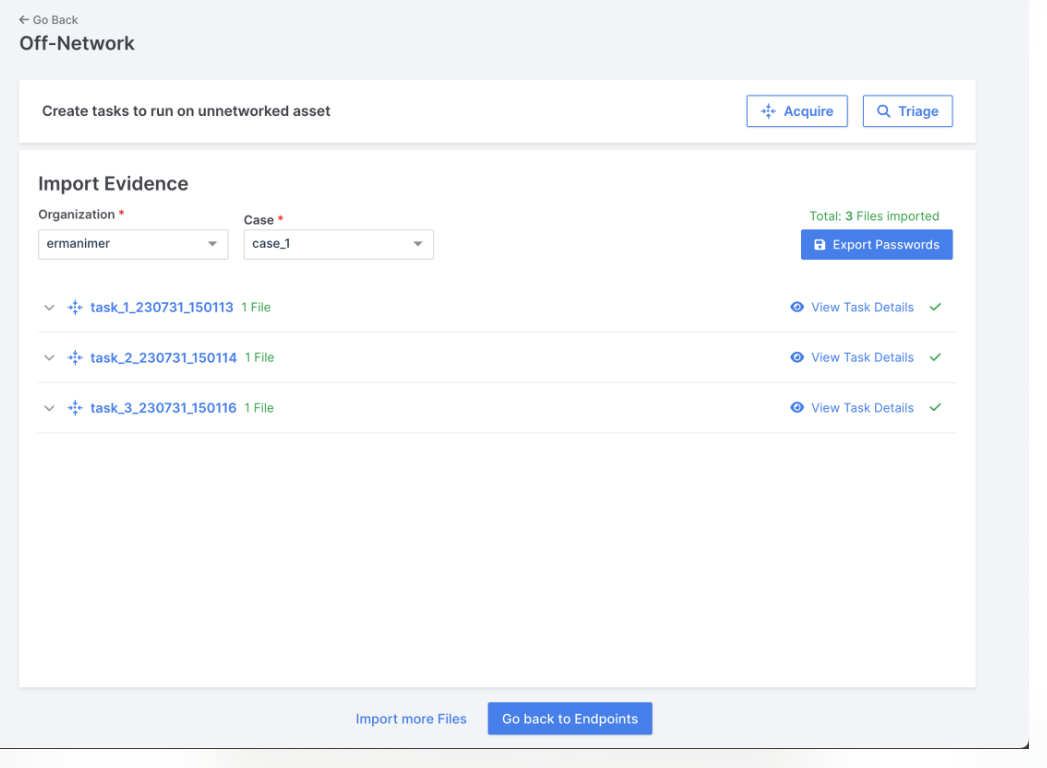
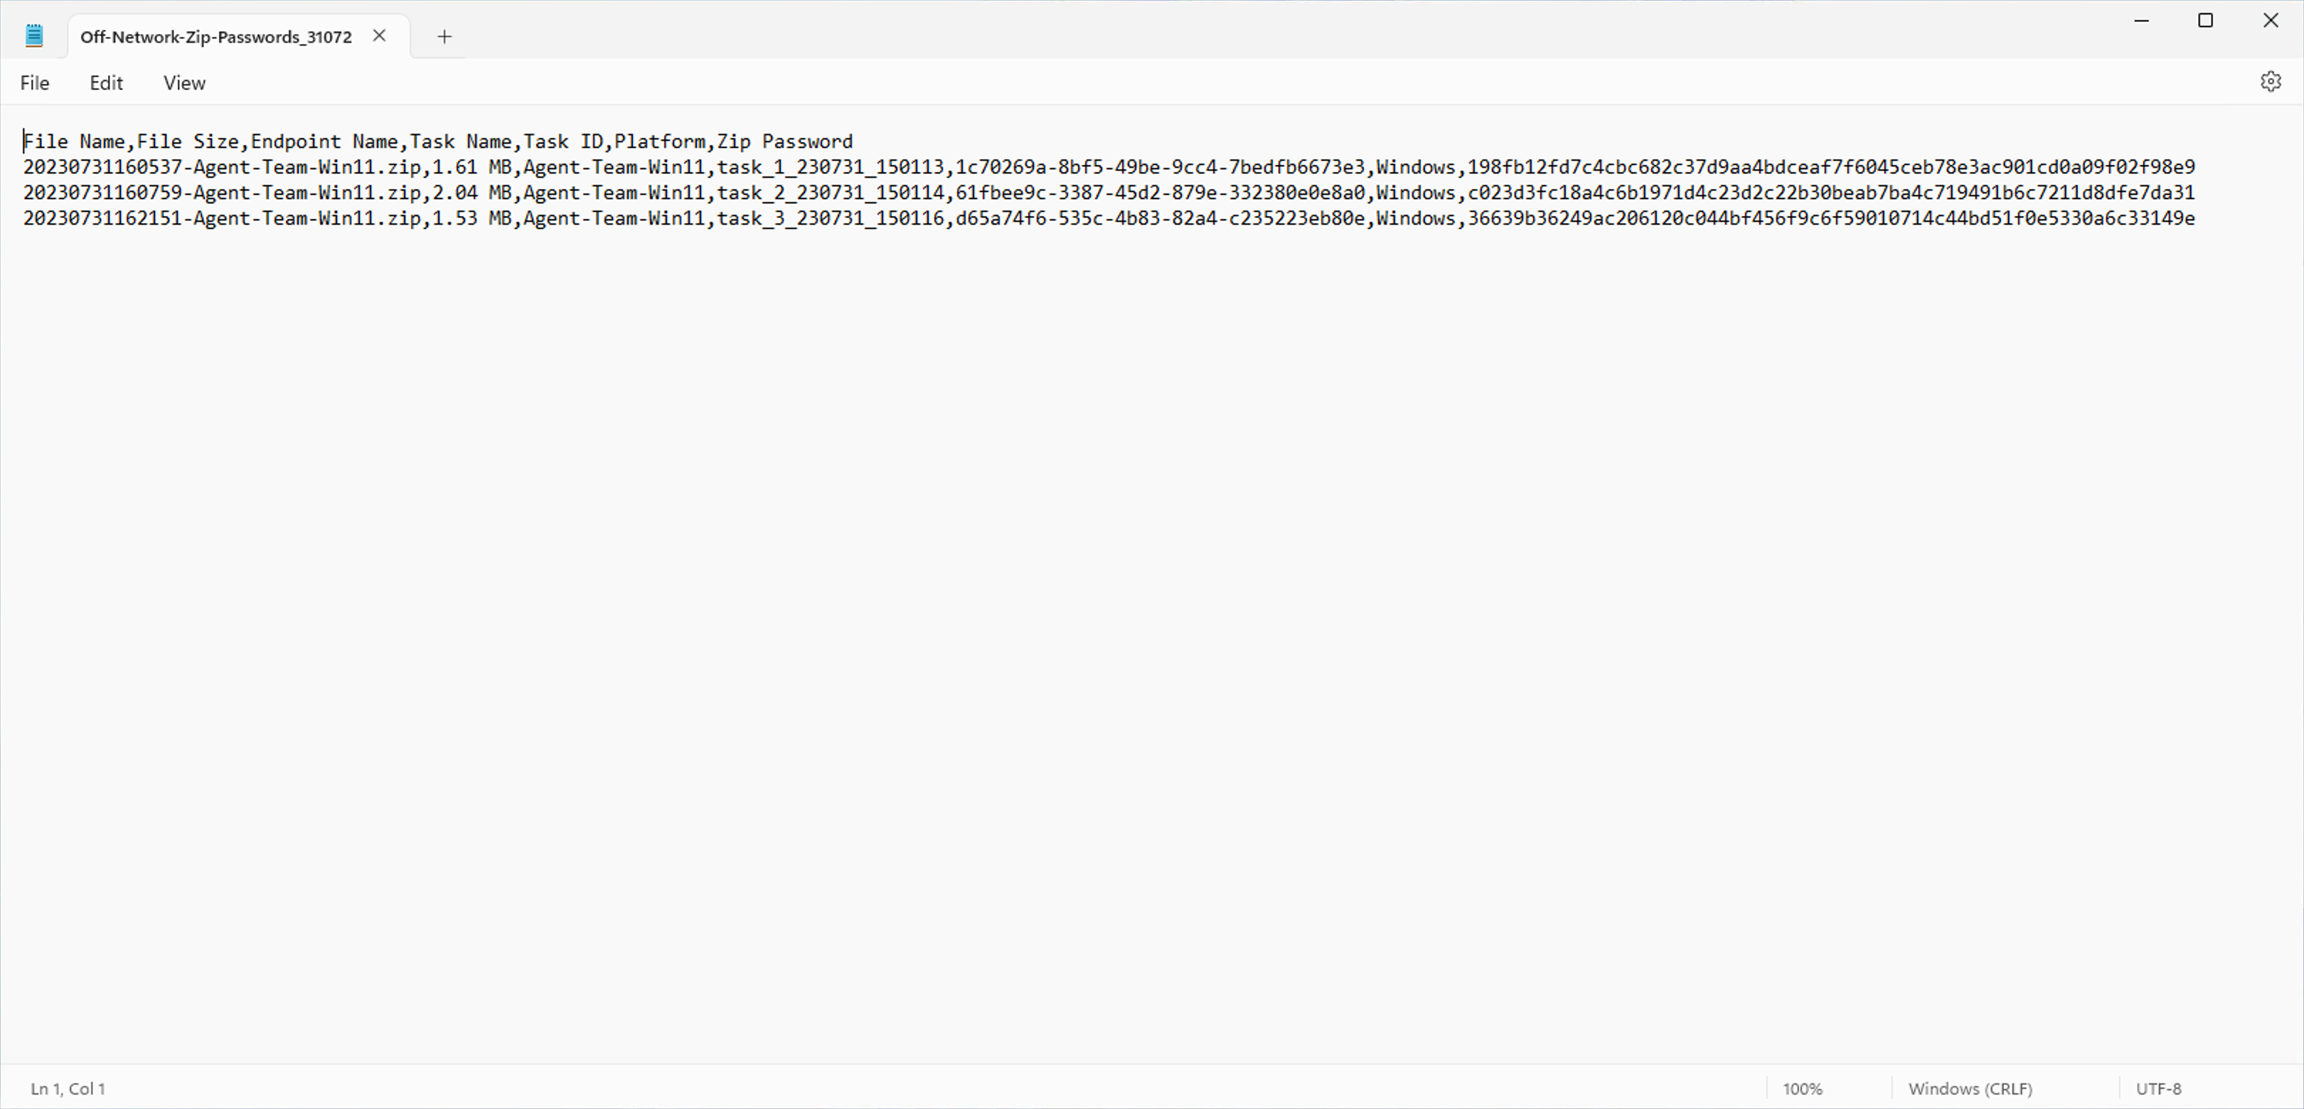
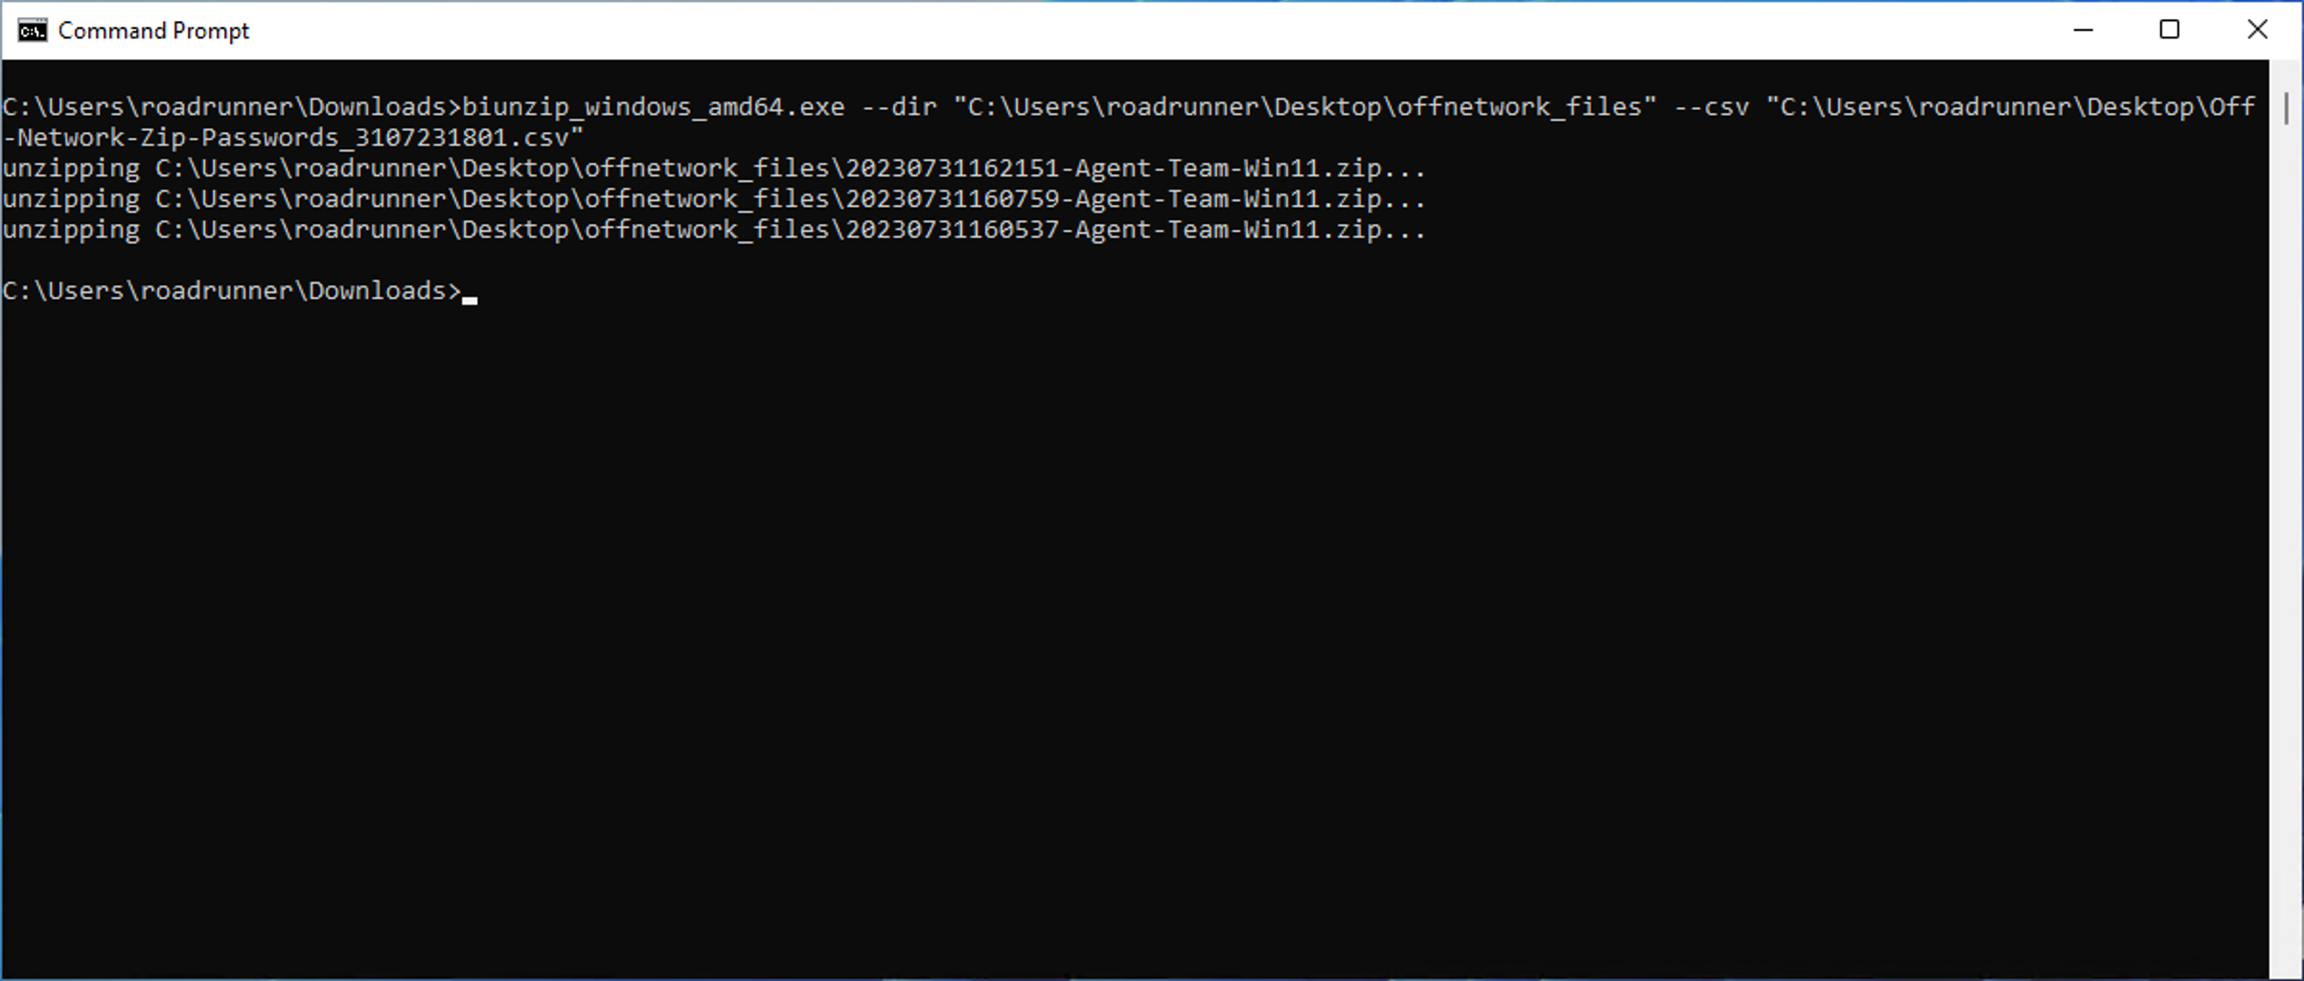
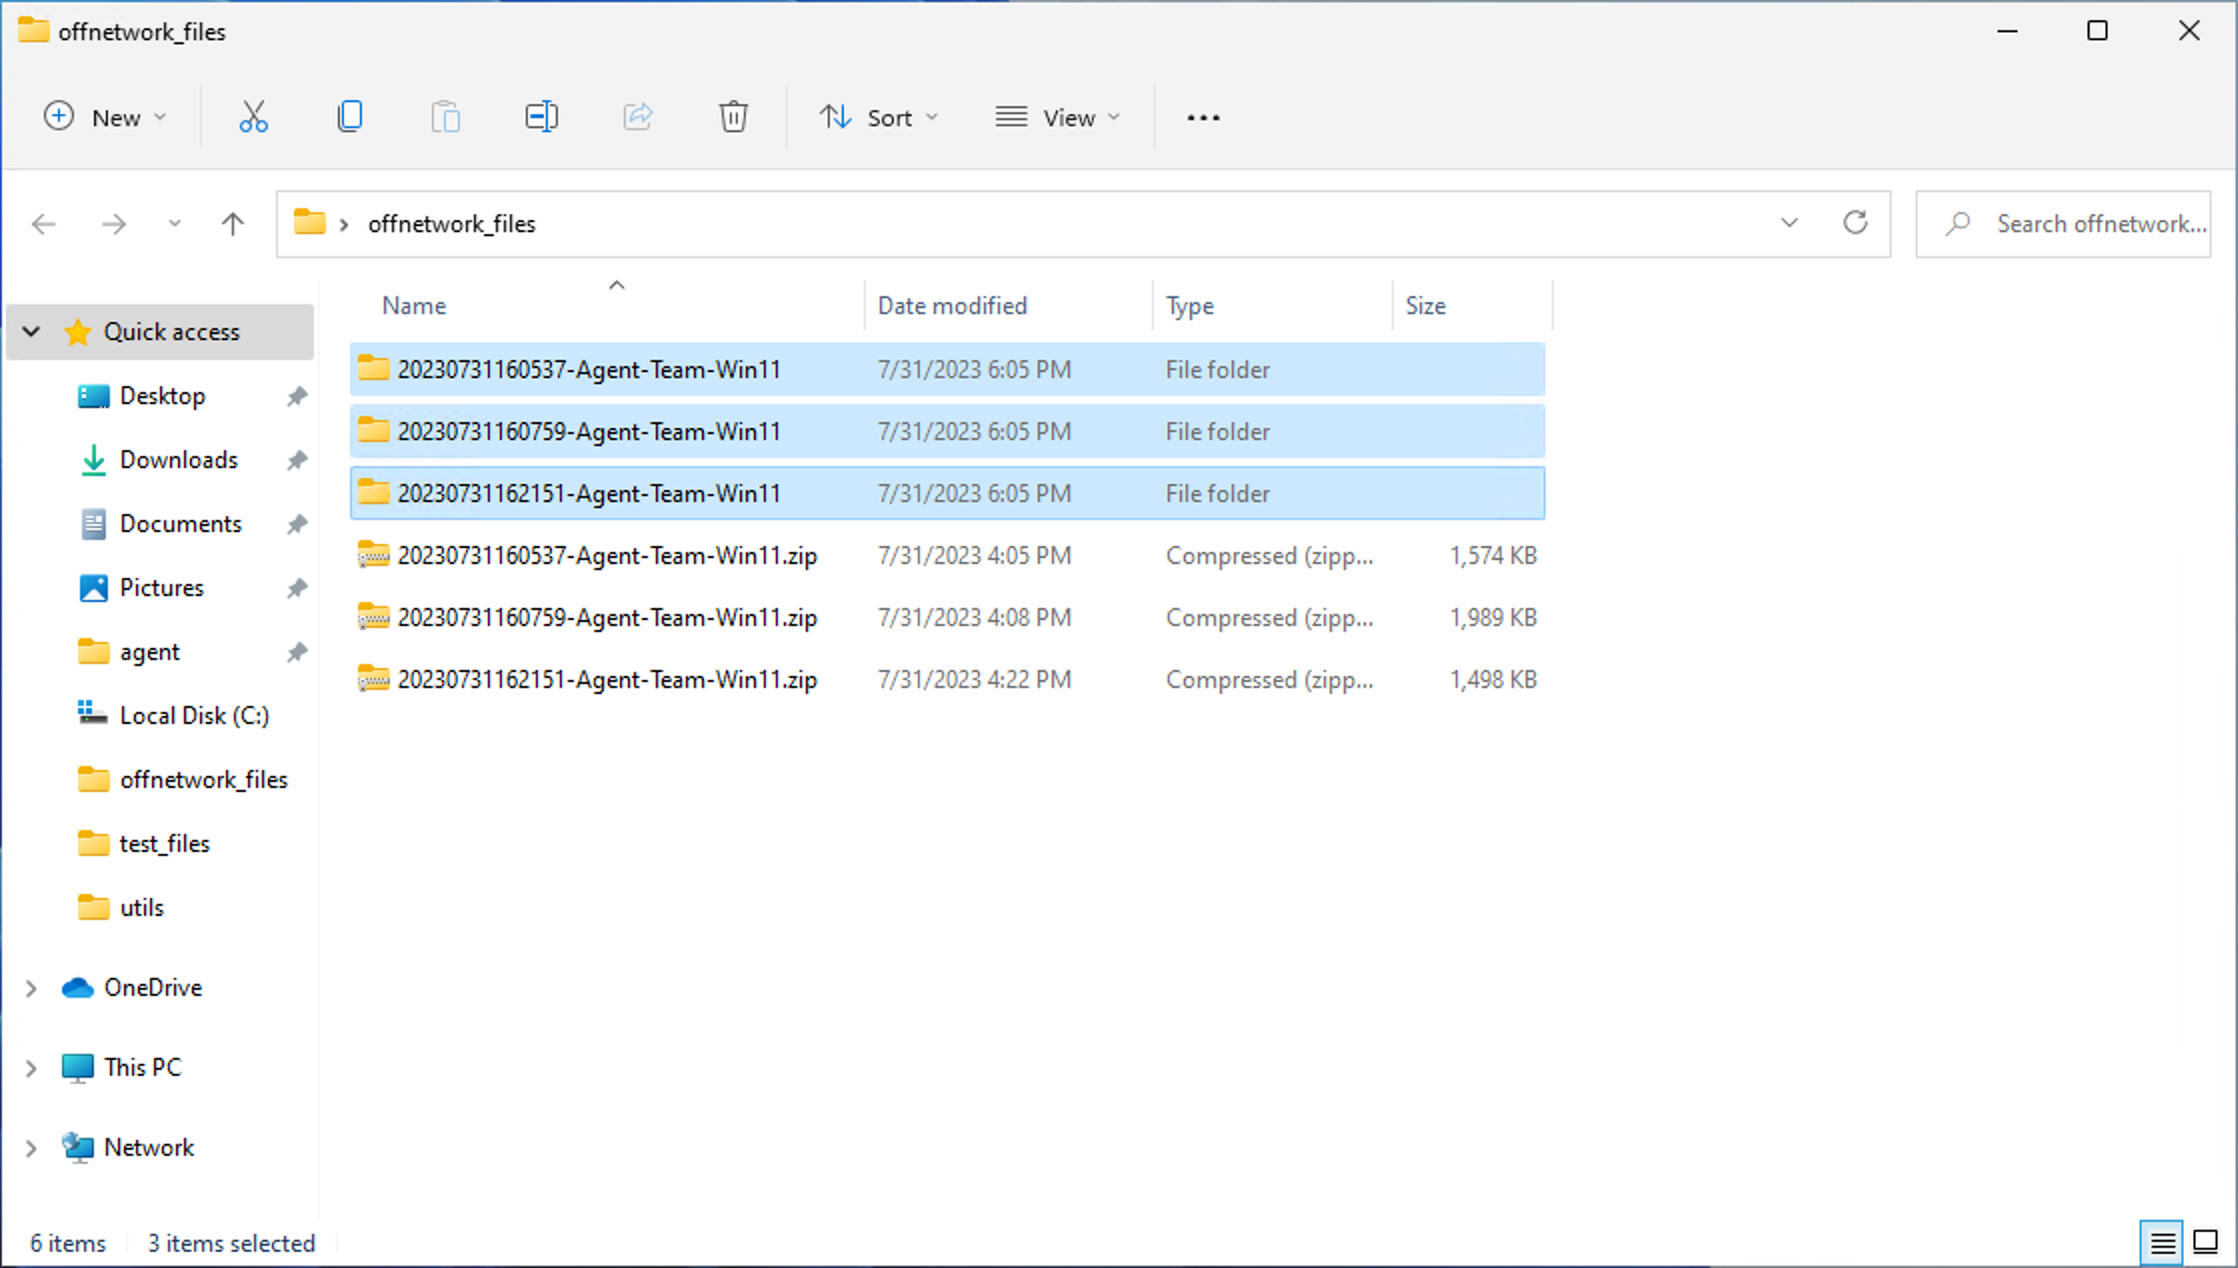

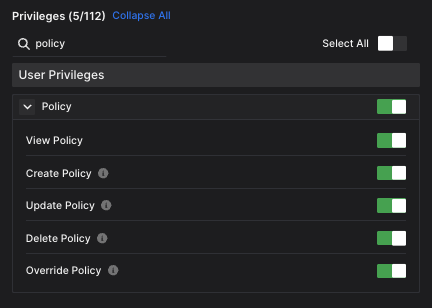
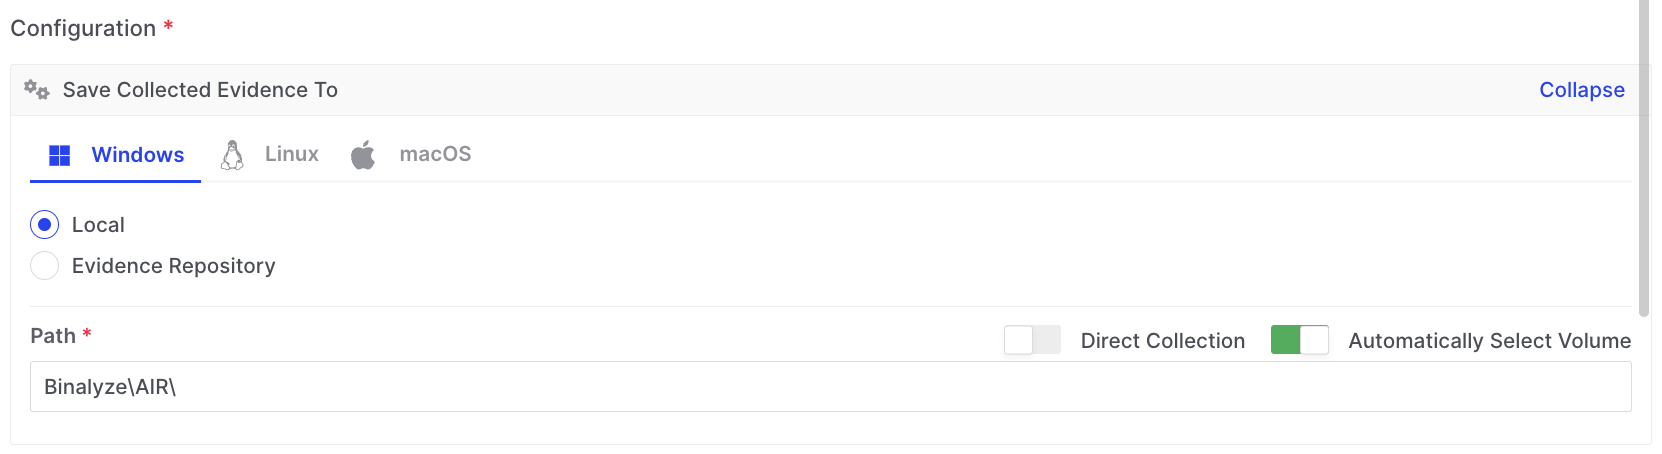

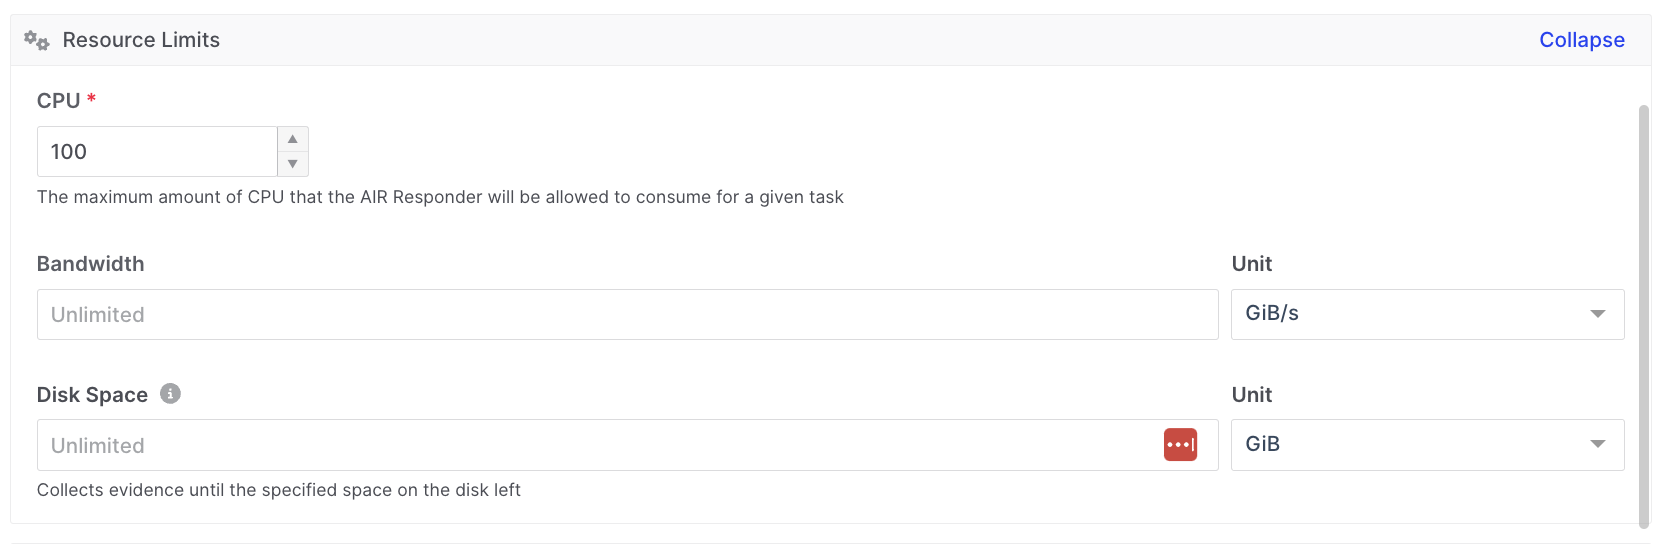
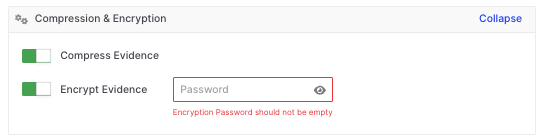
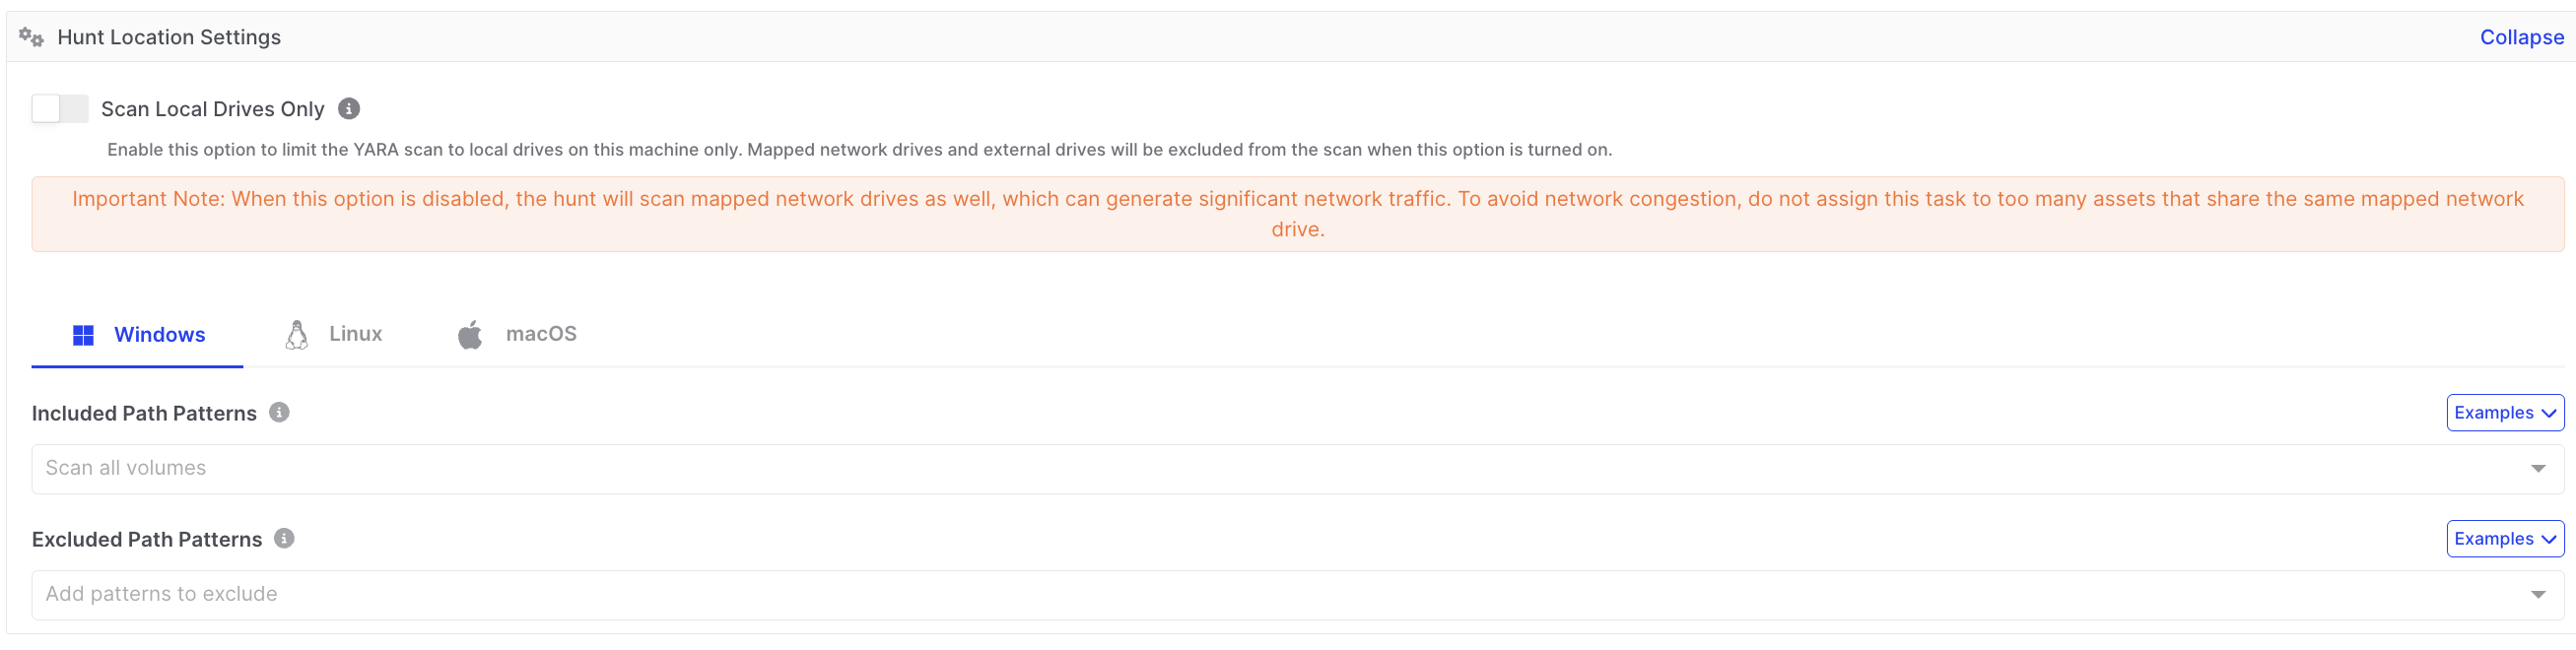
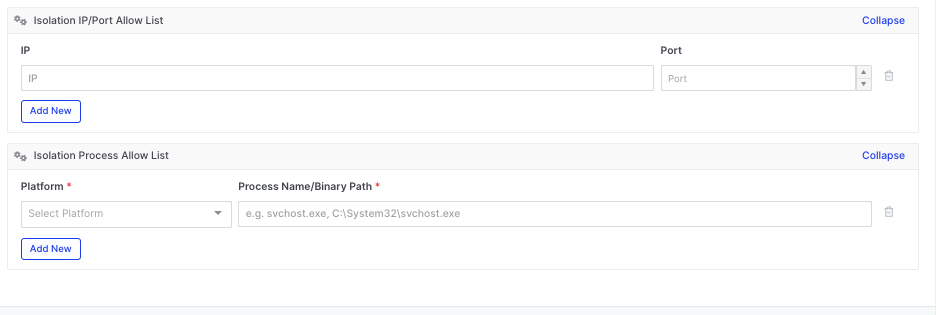
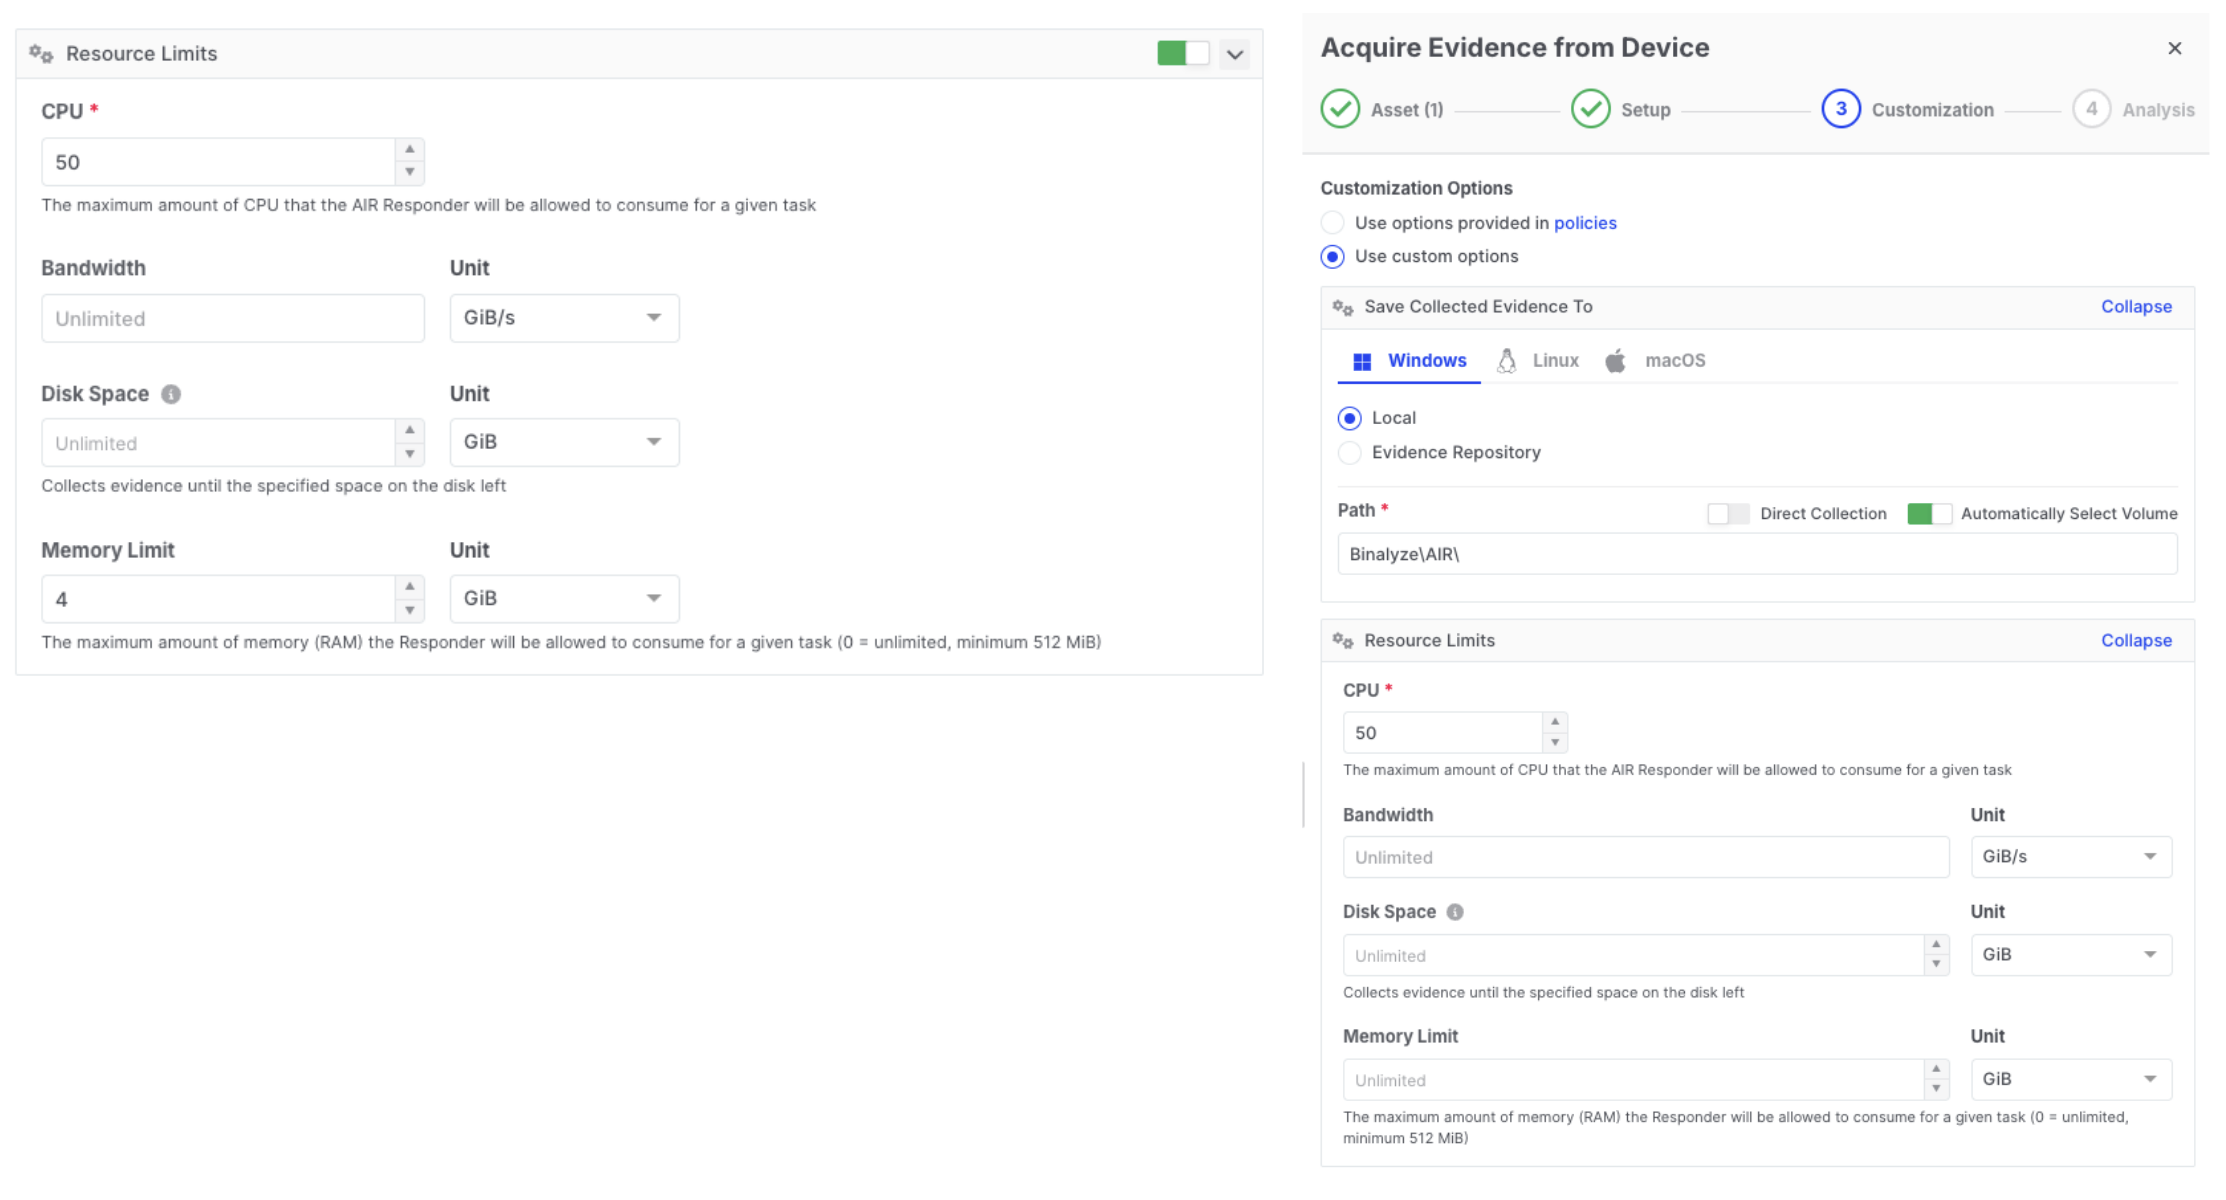
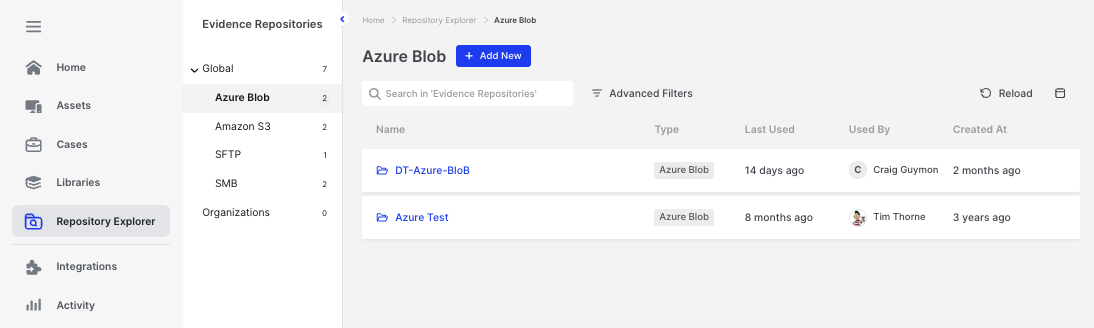
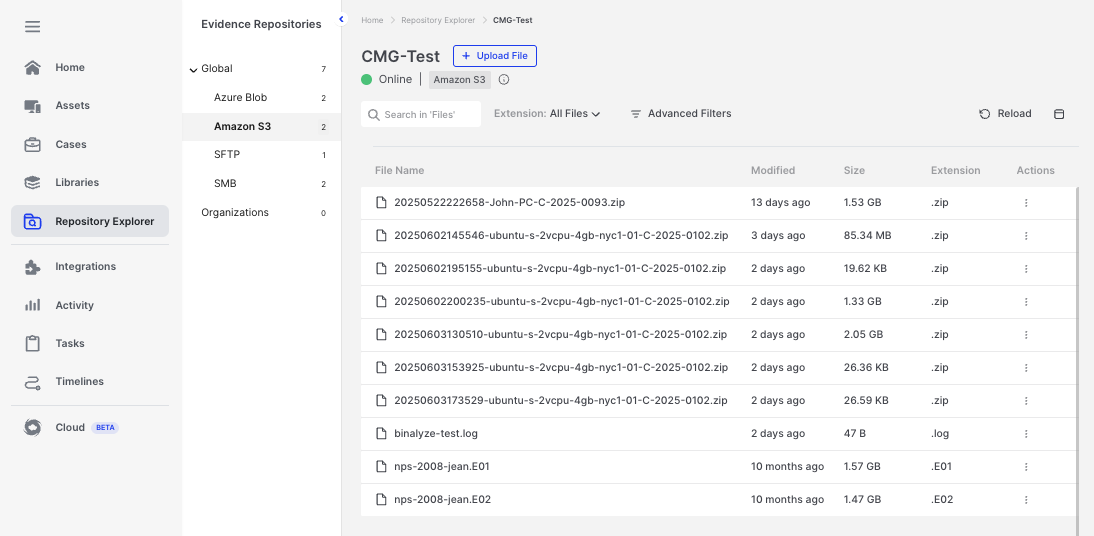
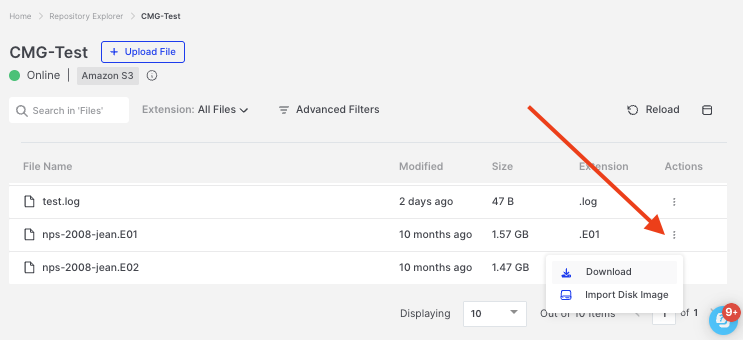
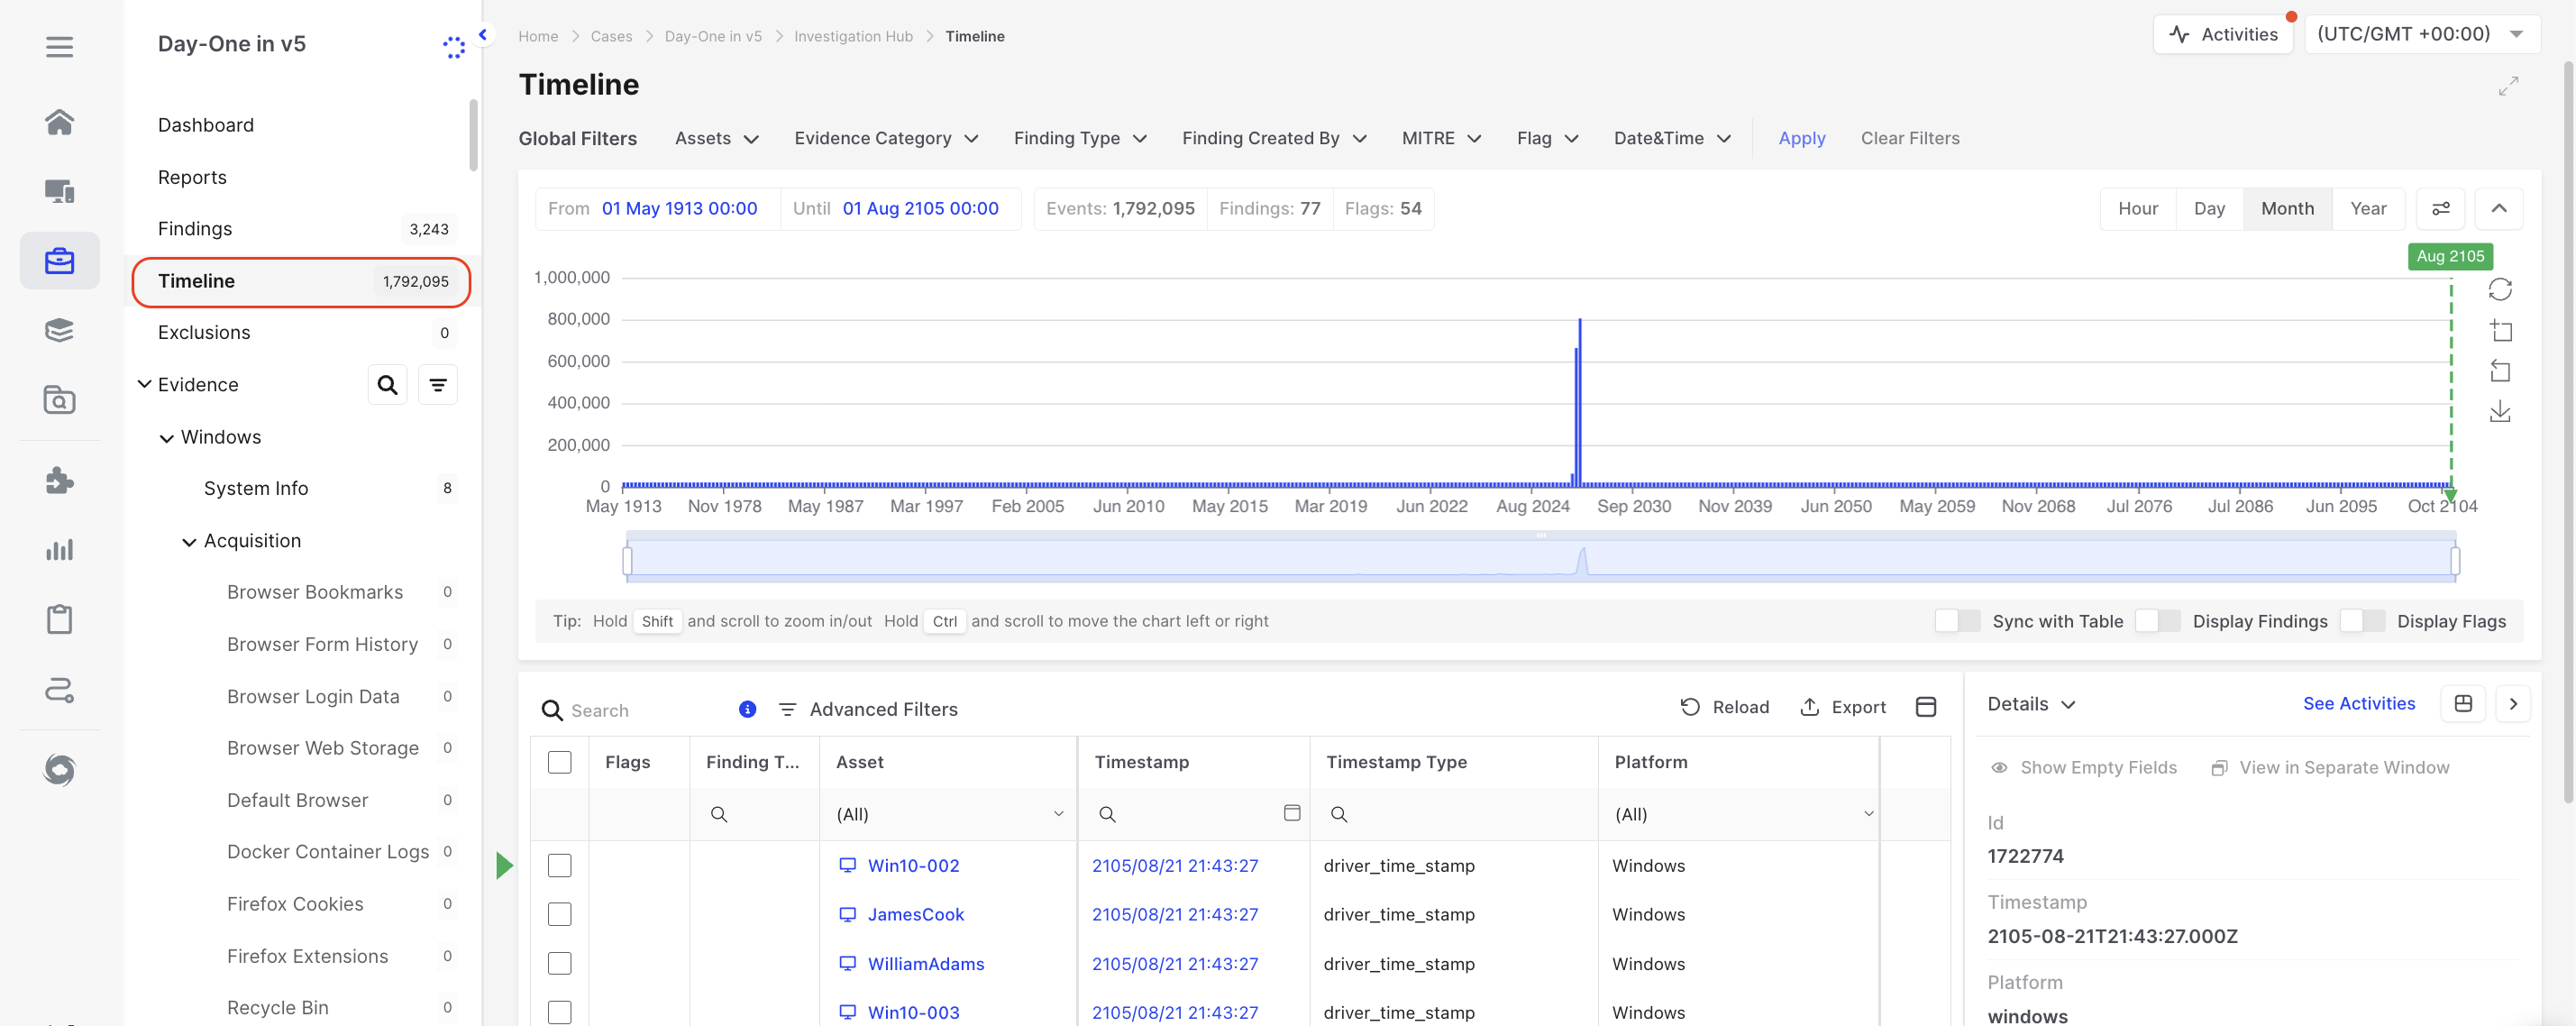
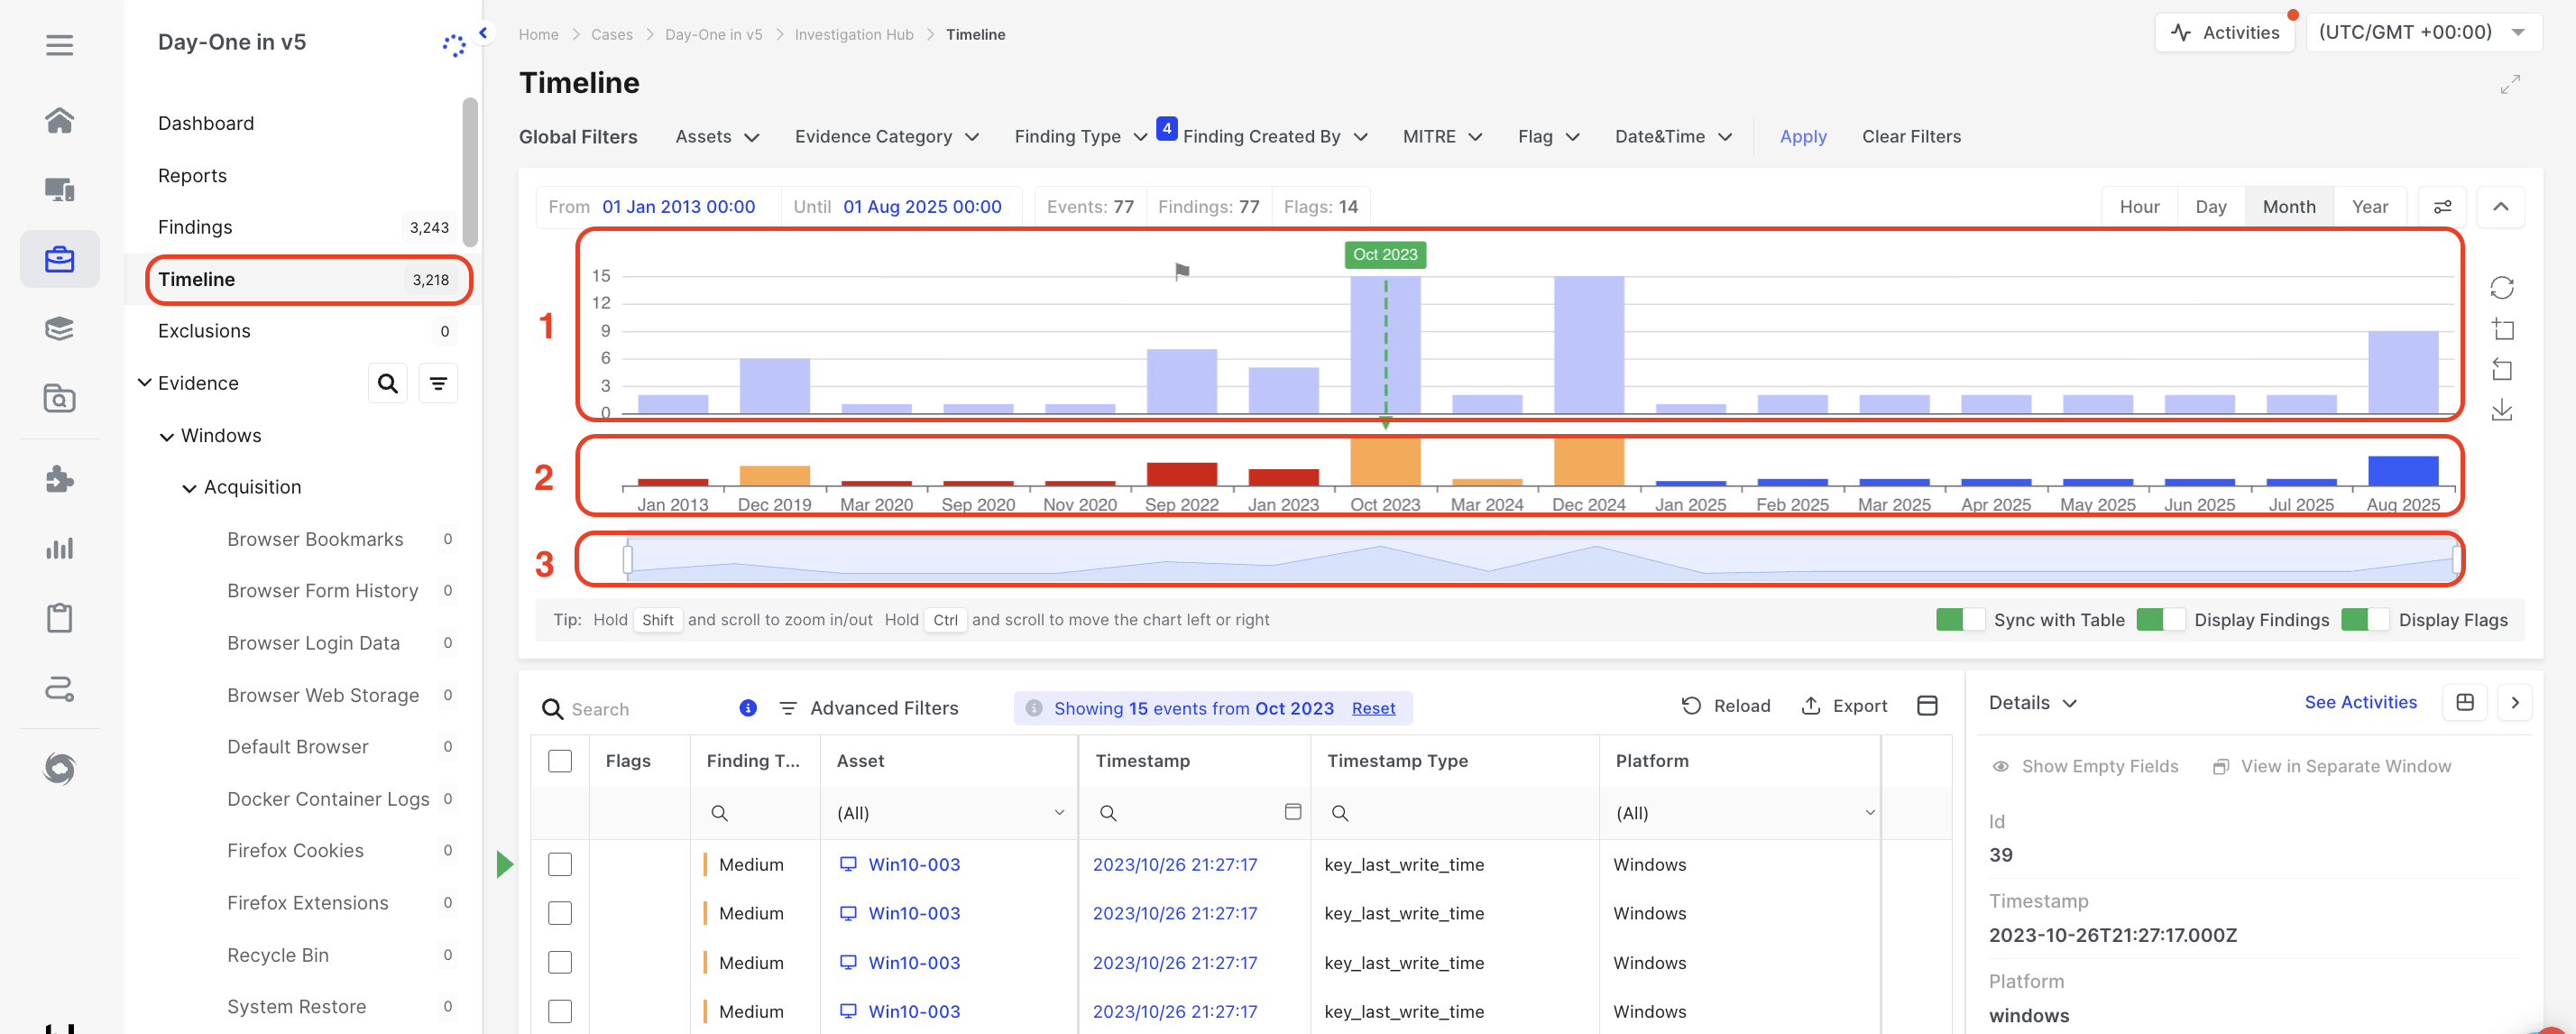
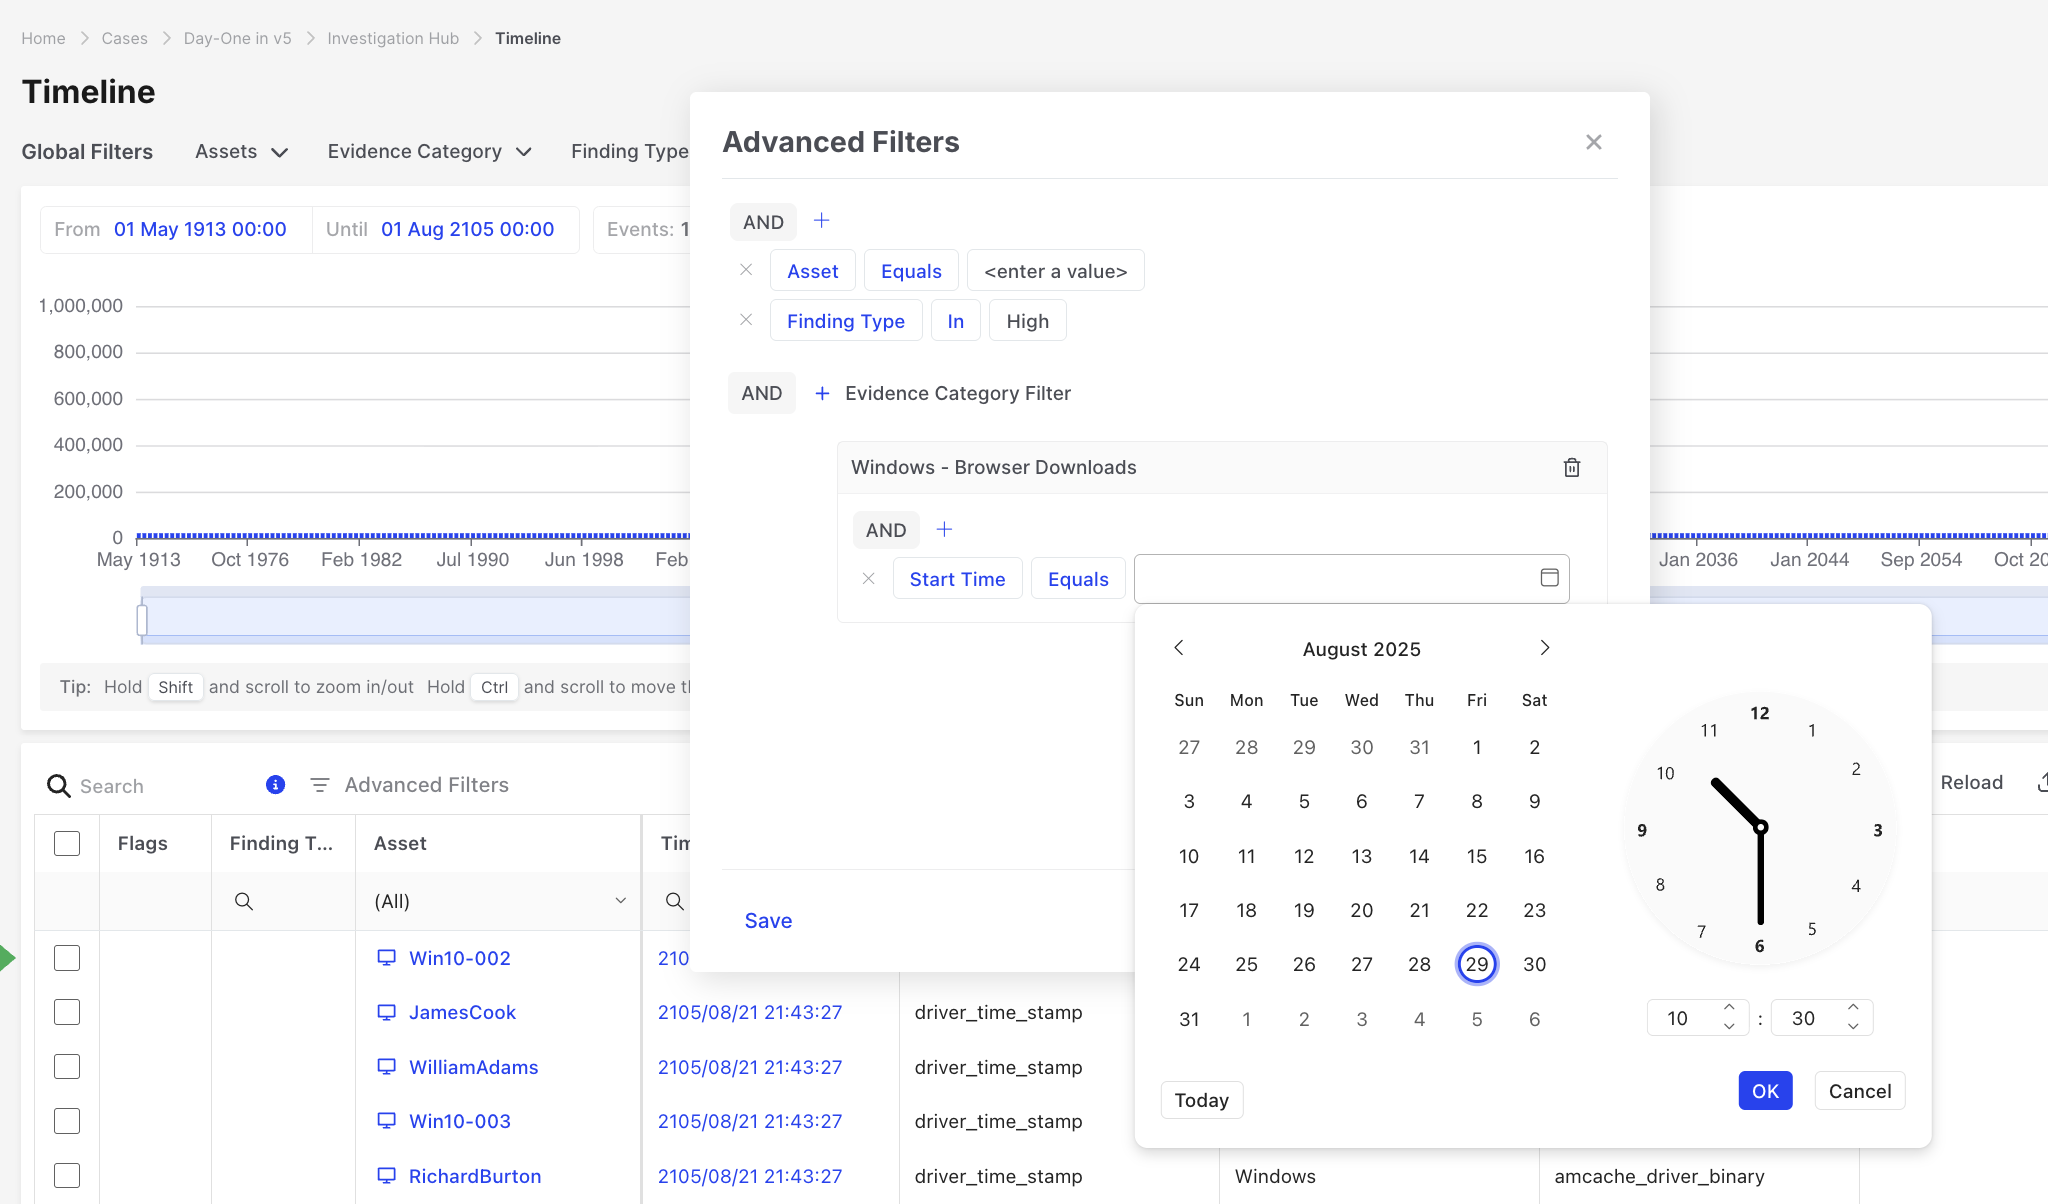
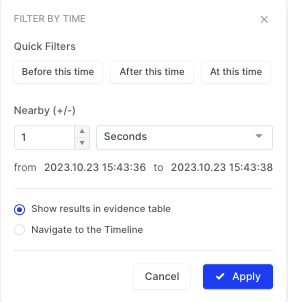
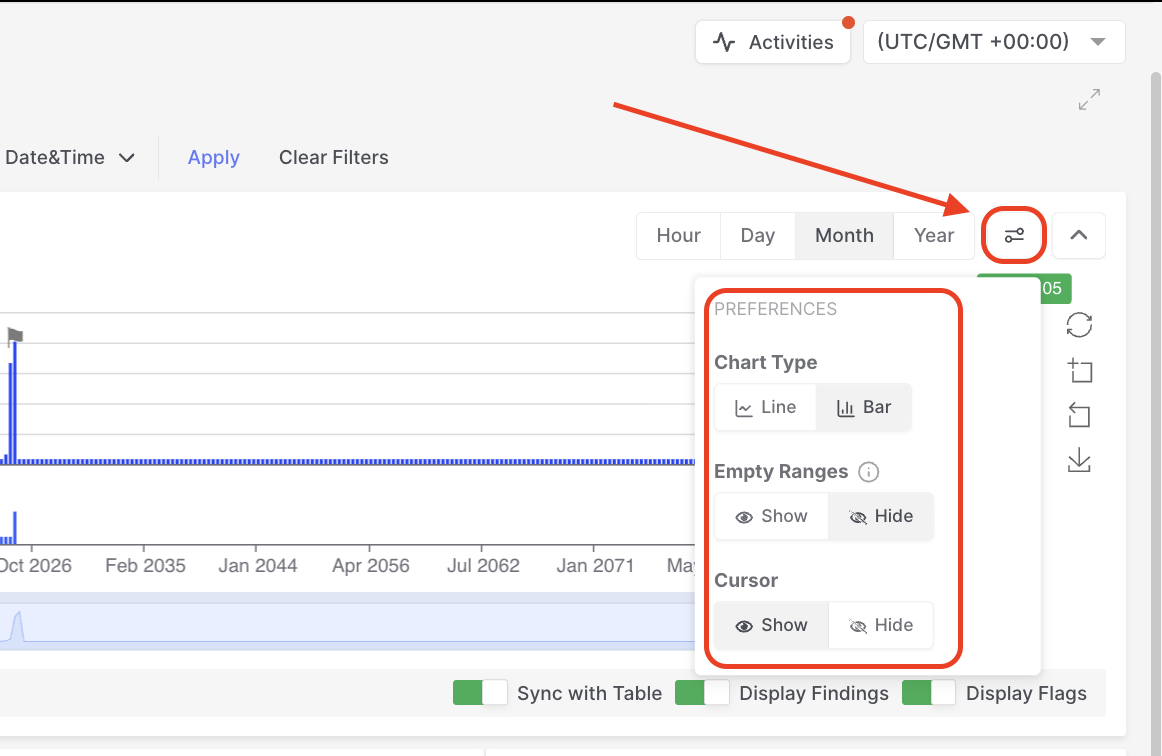
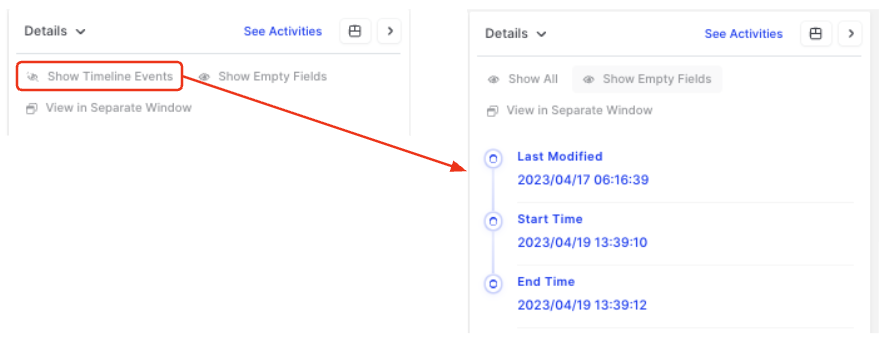
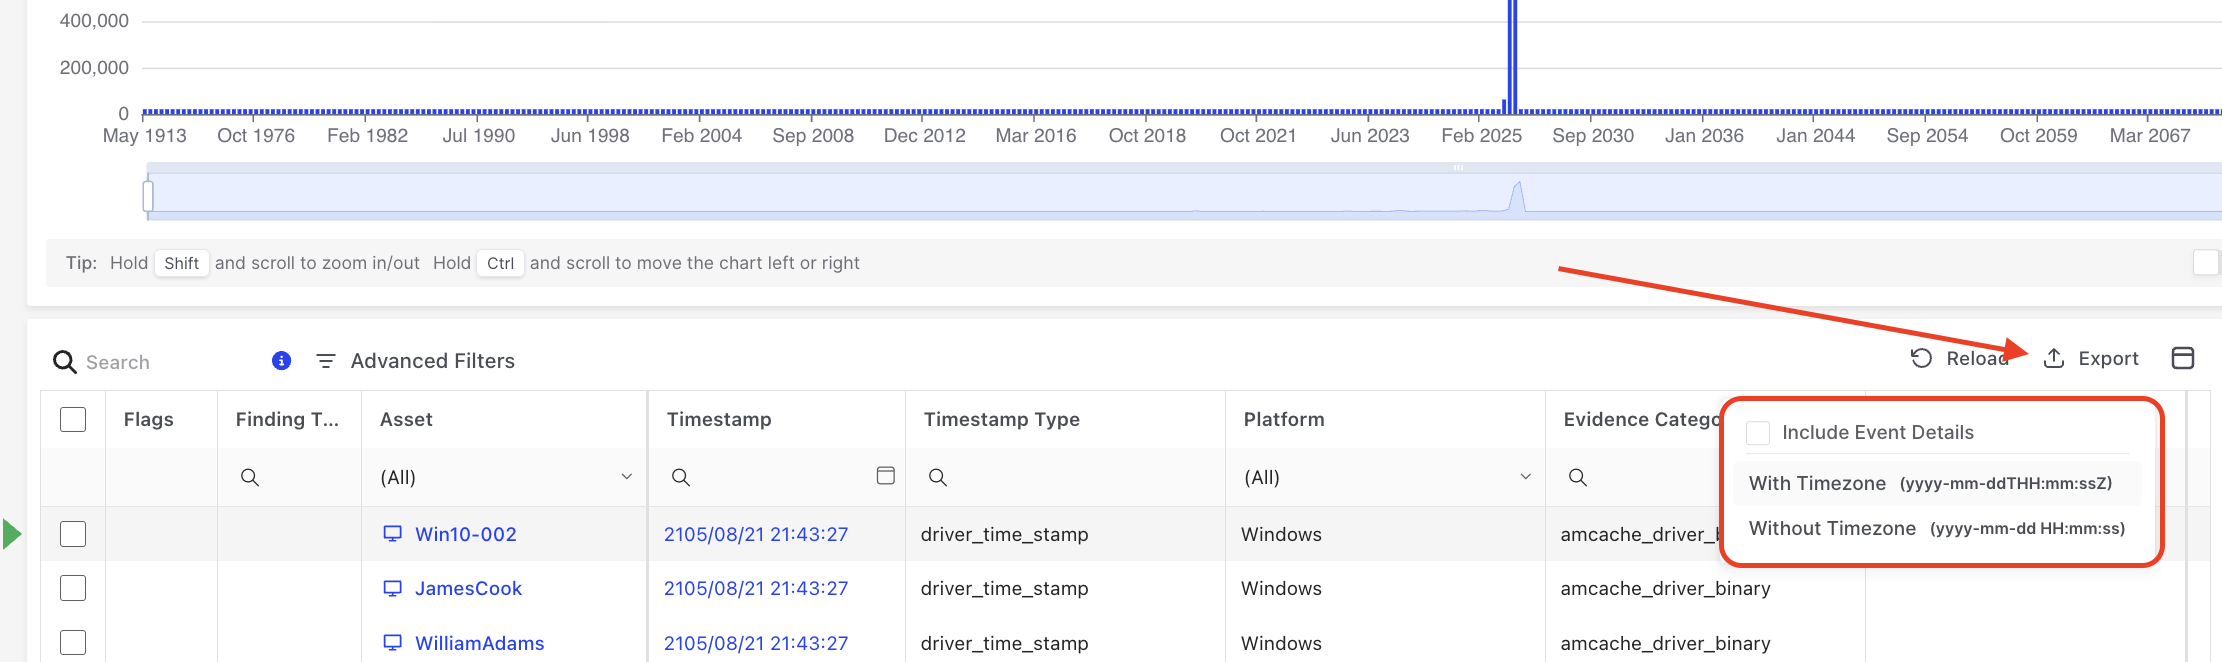
.png)

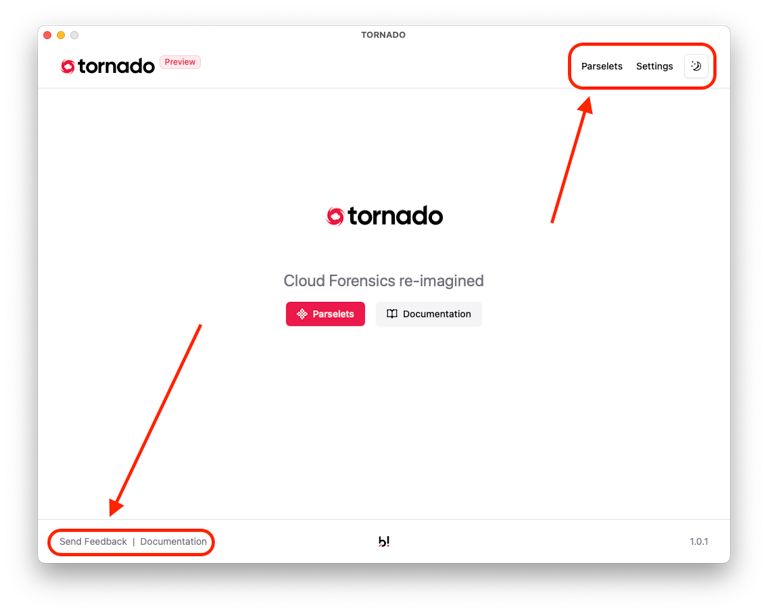
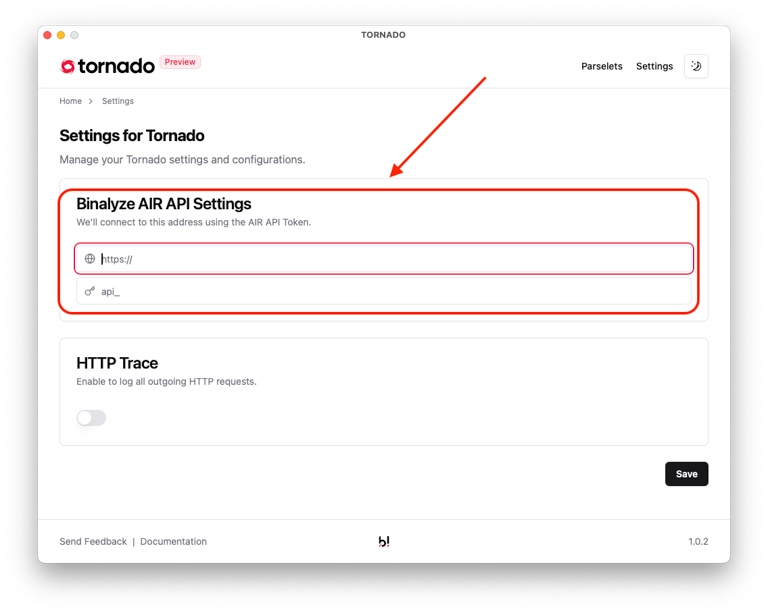

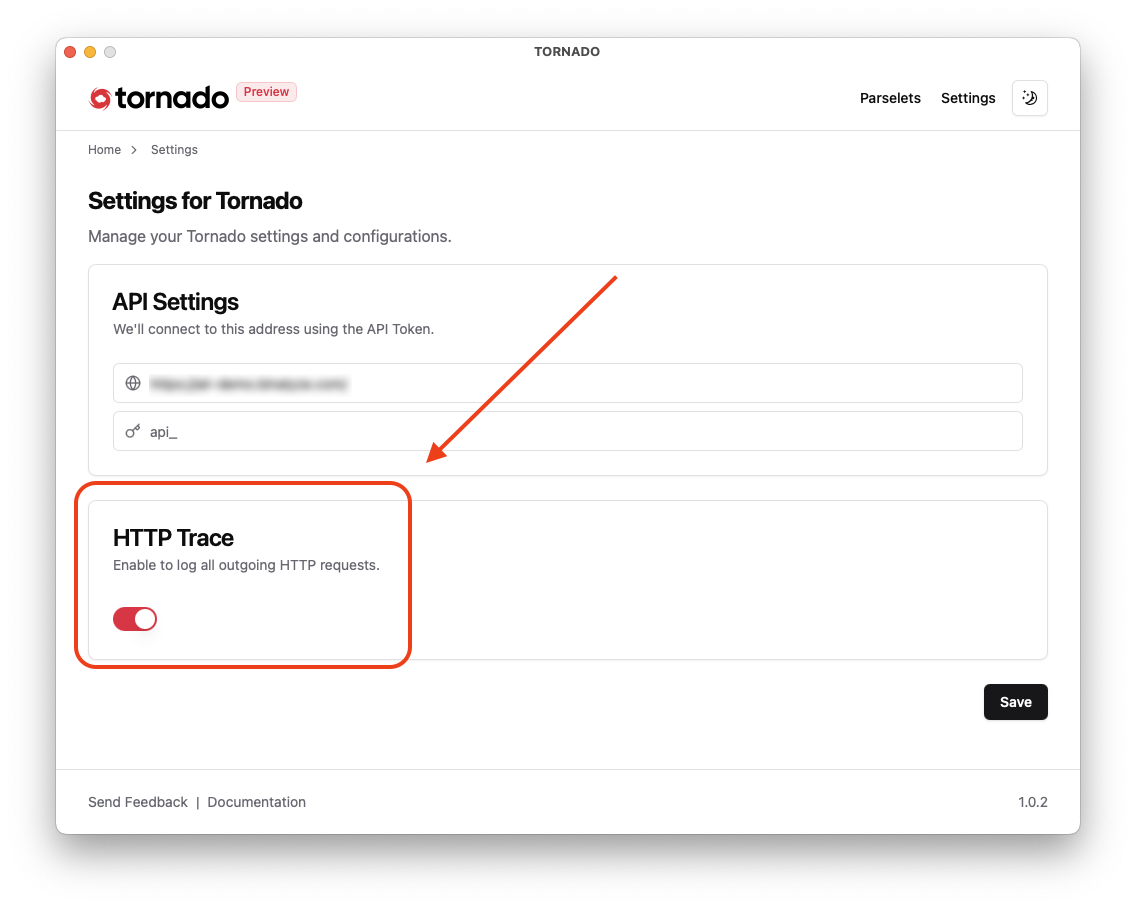
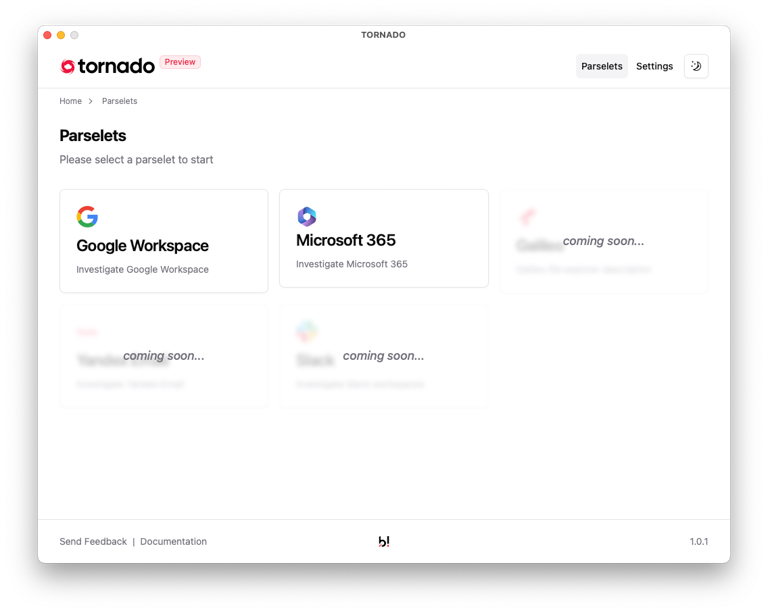
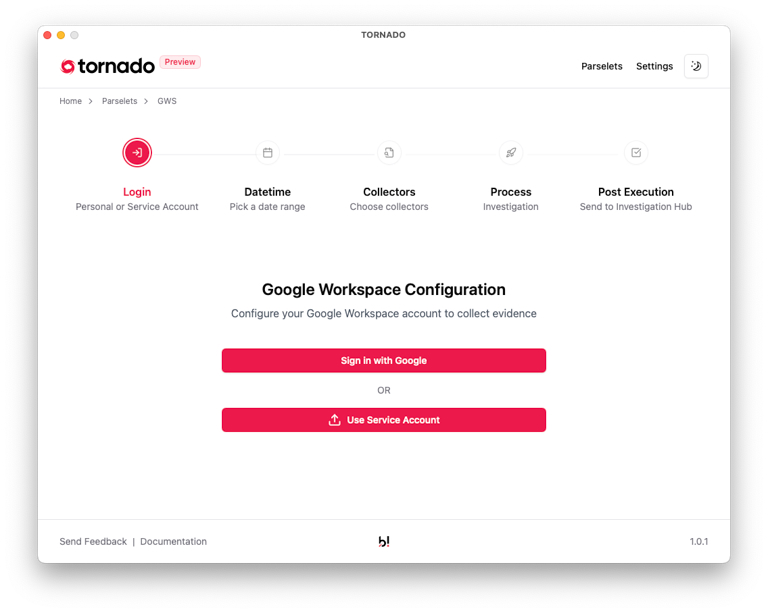
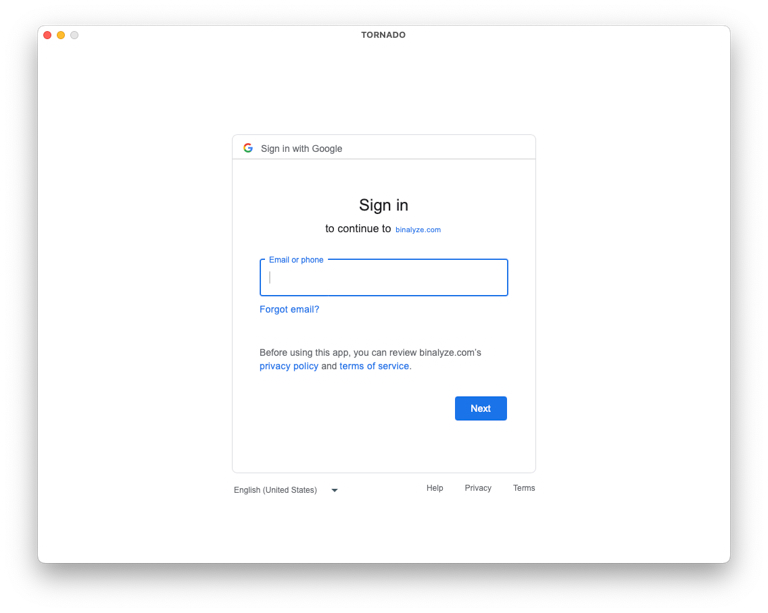
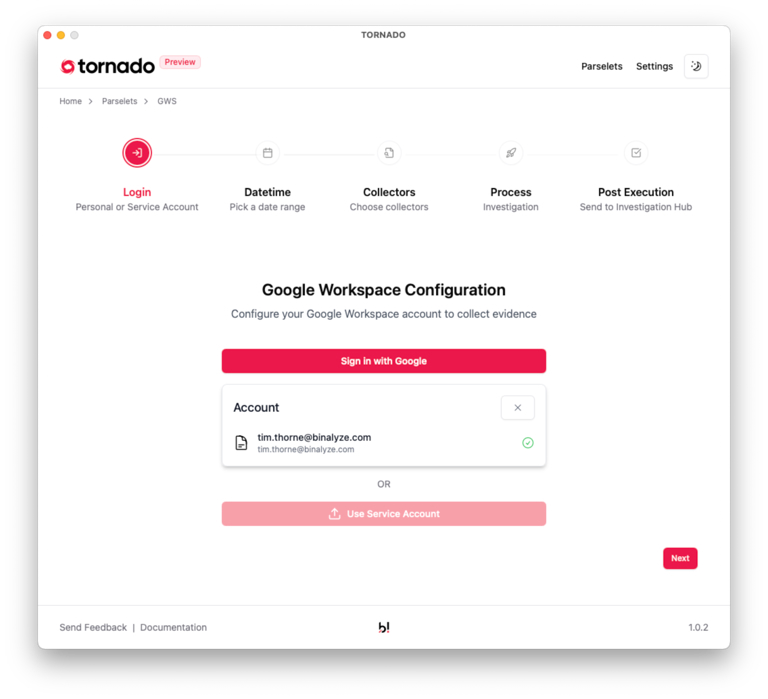
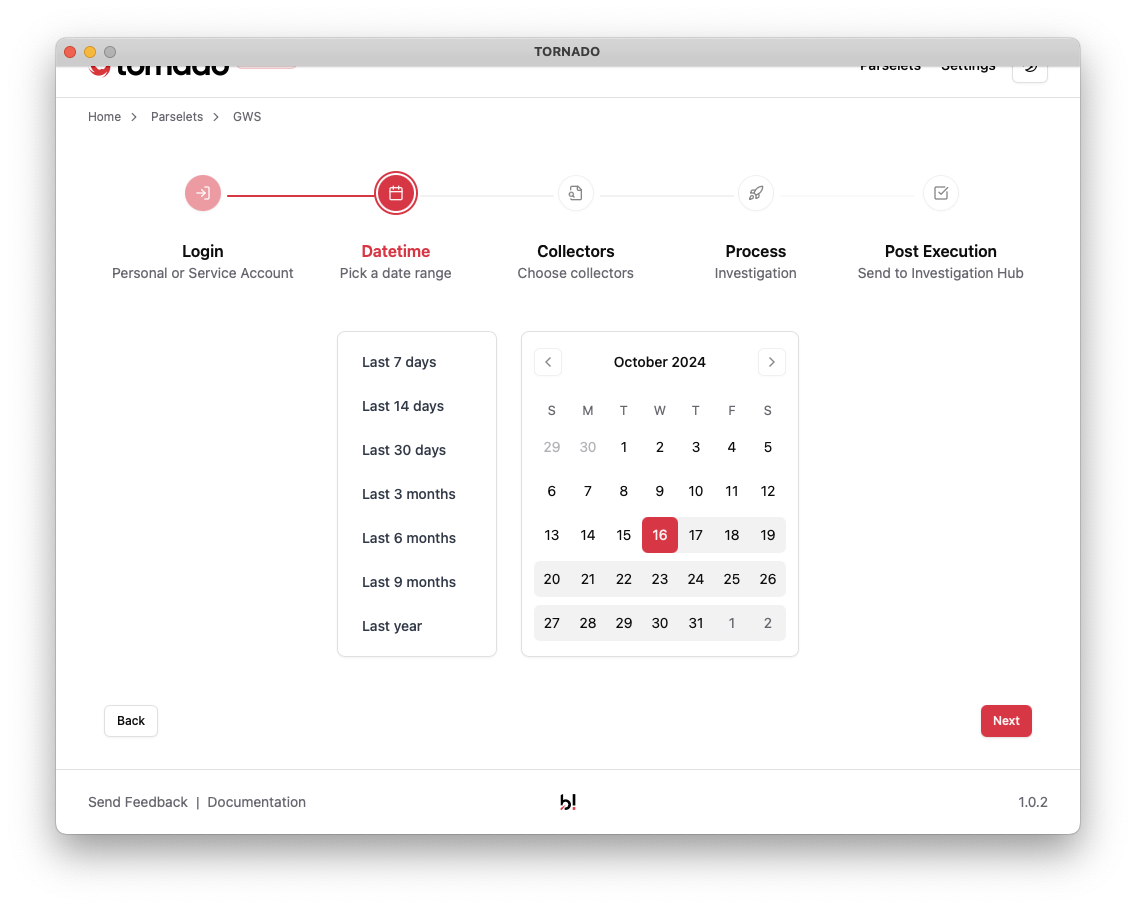
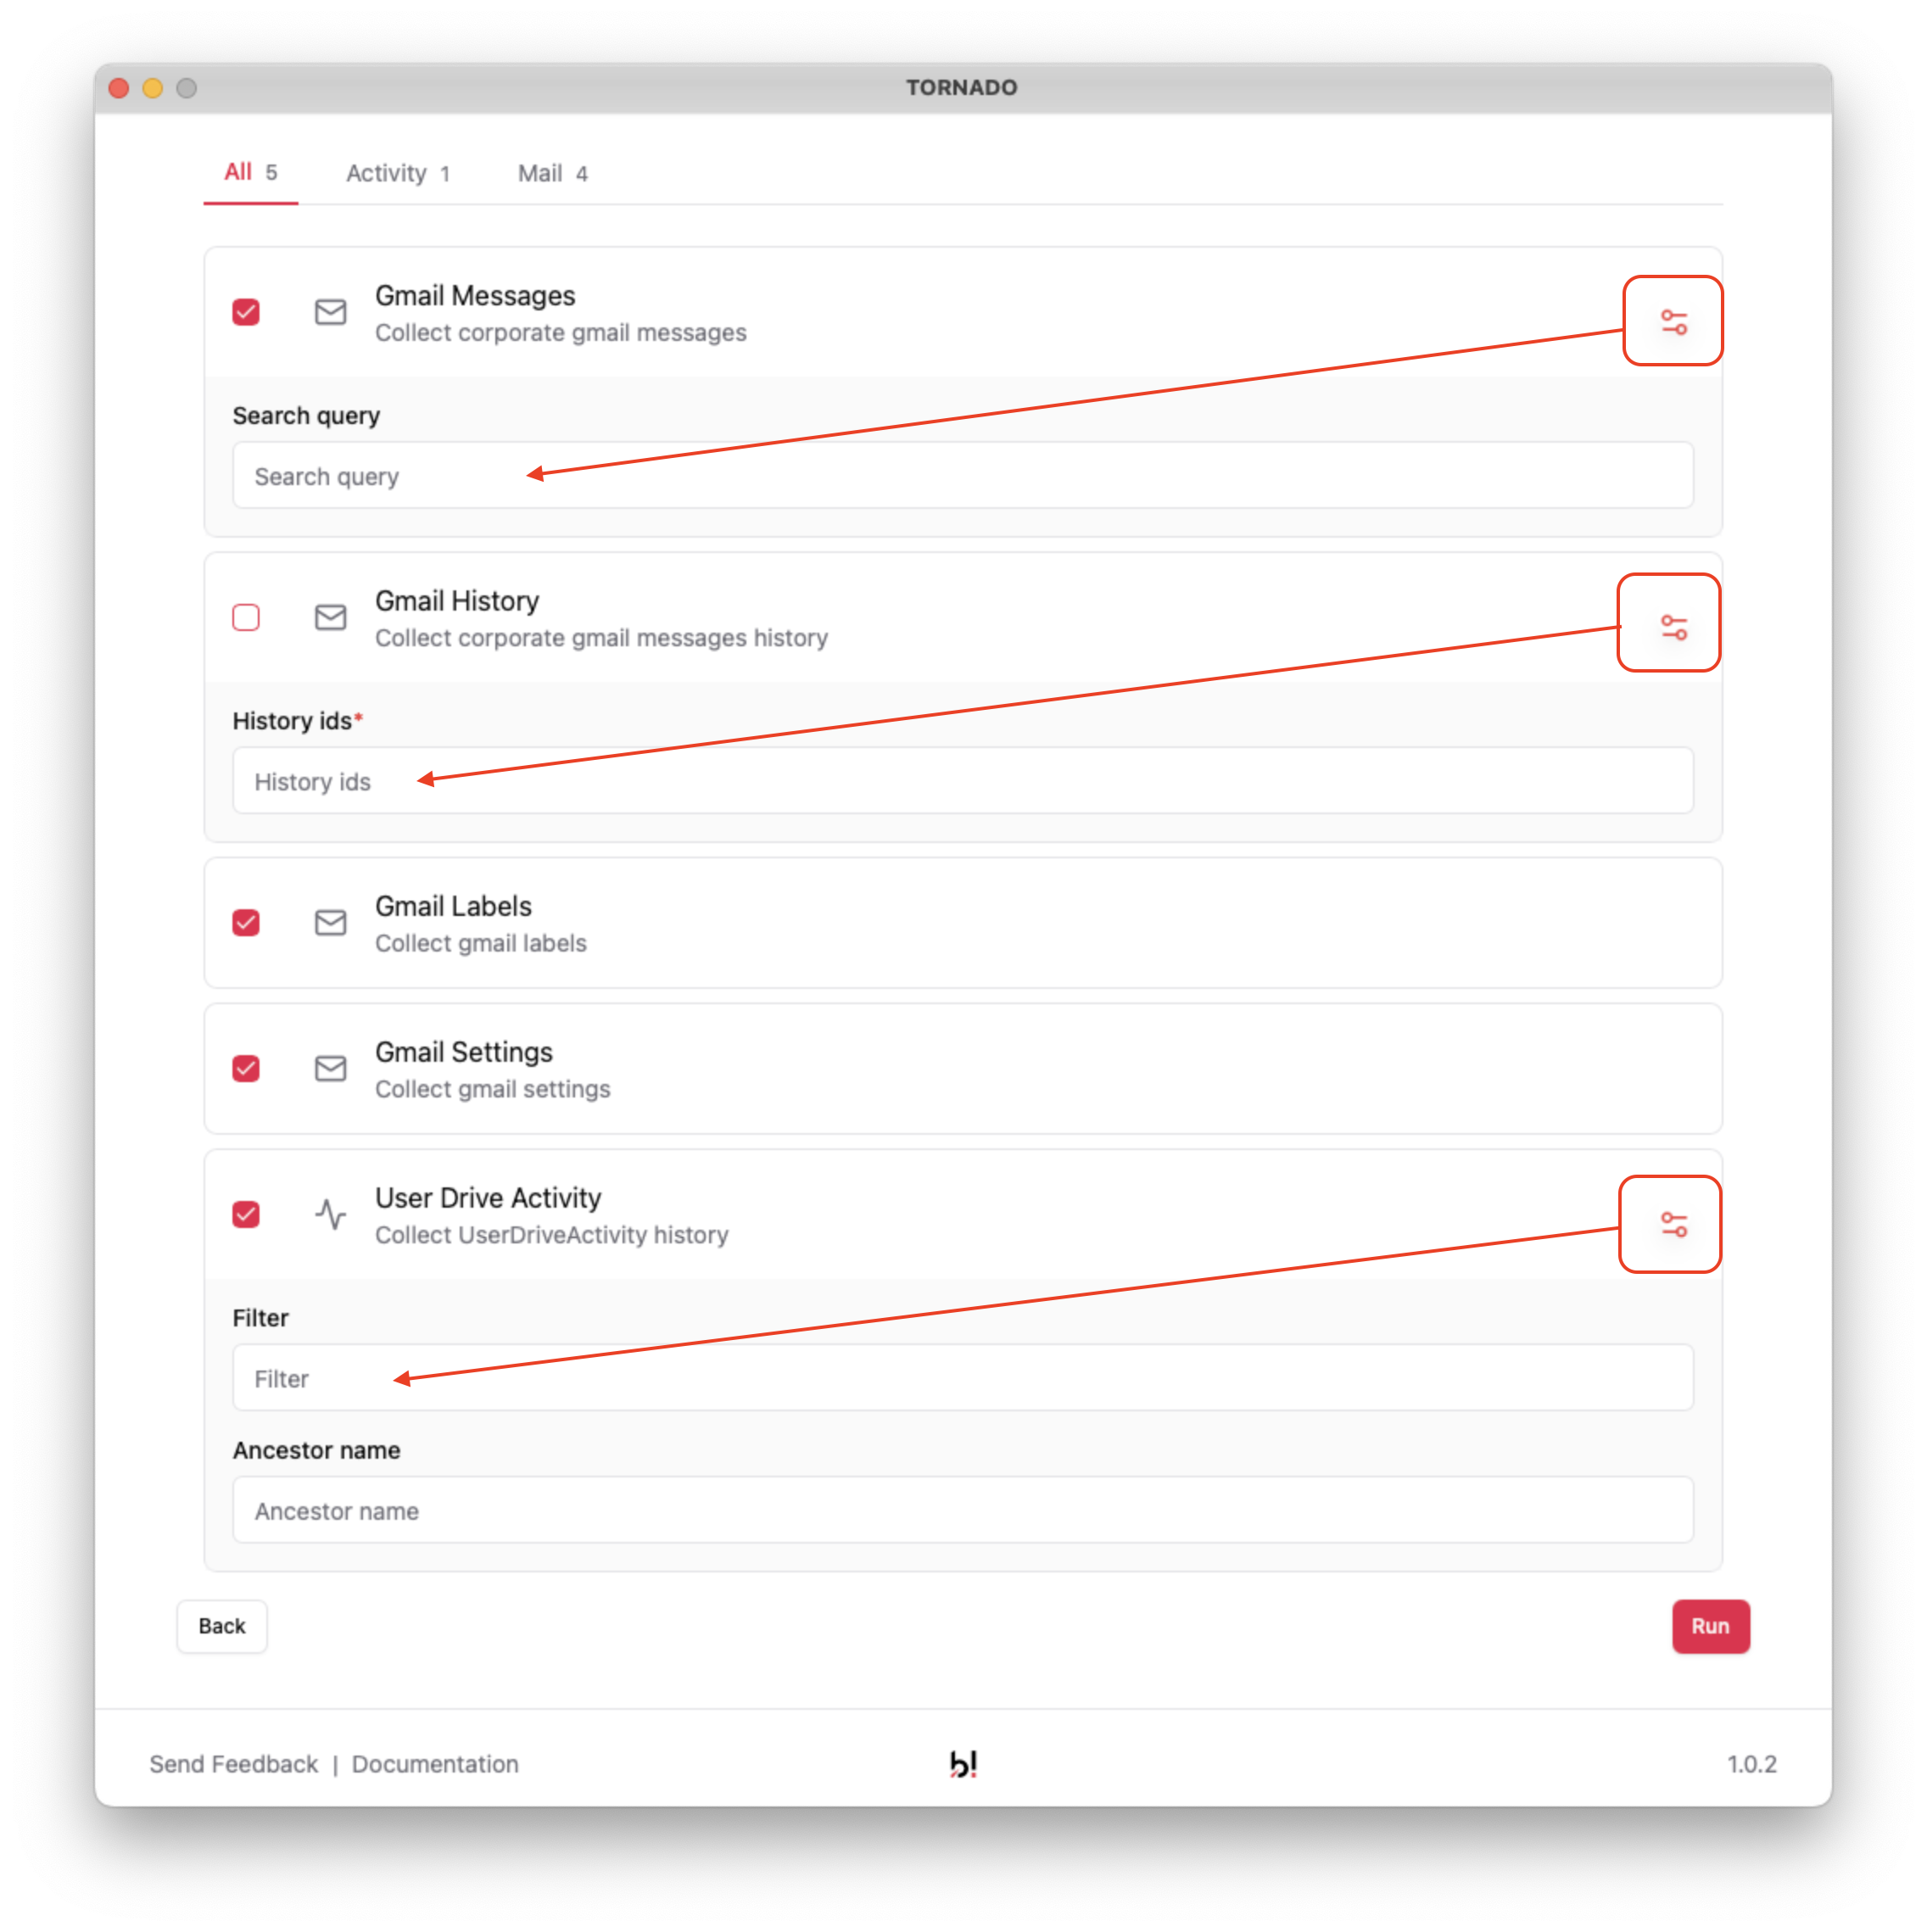
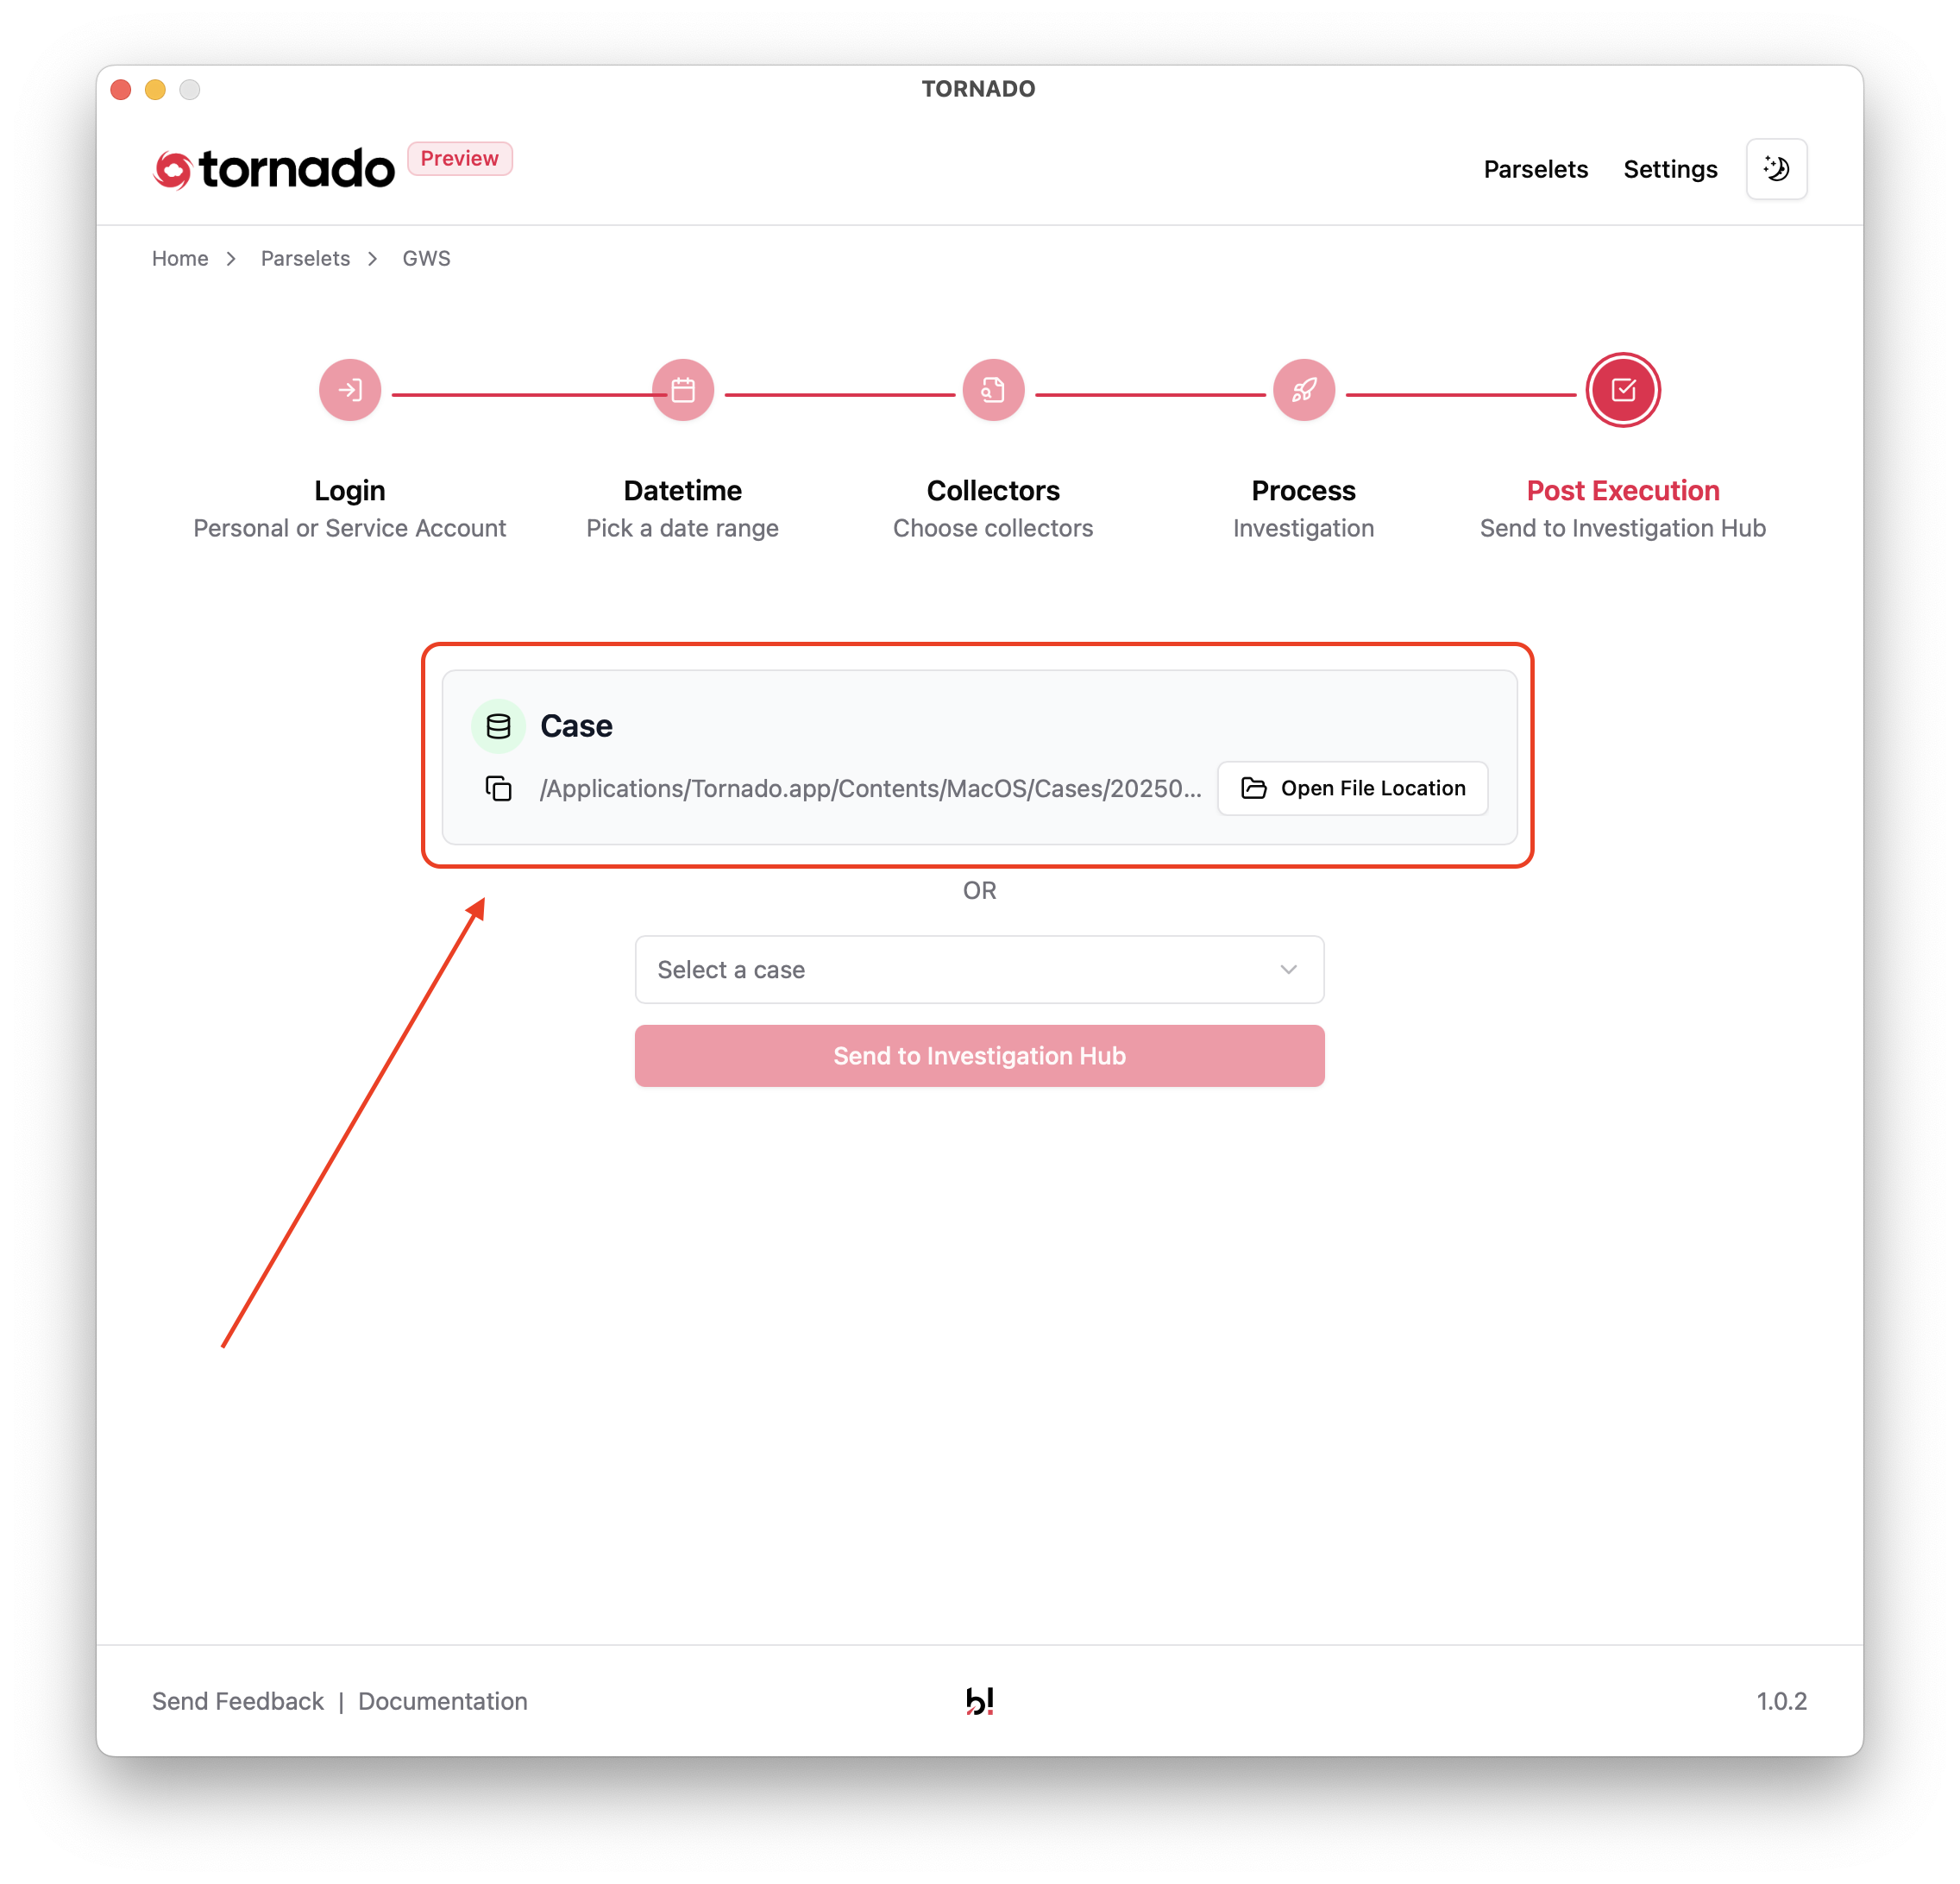
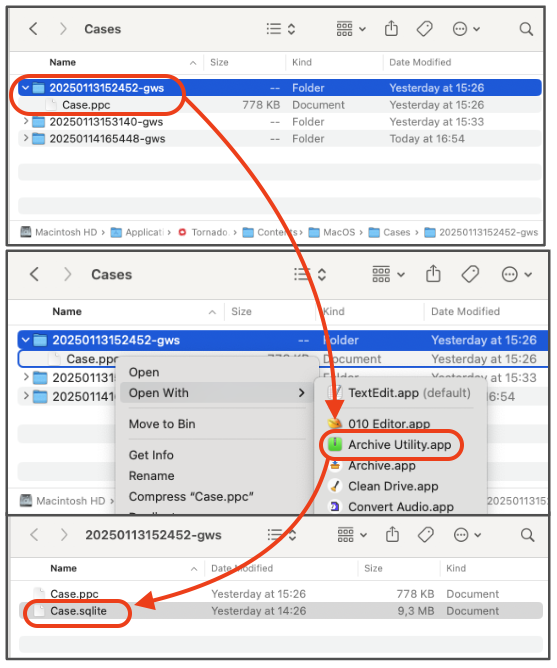
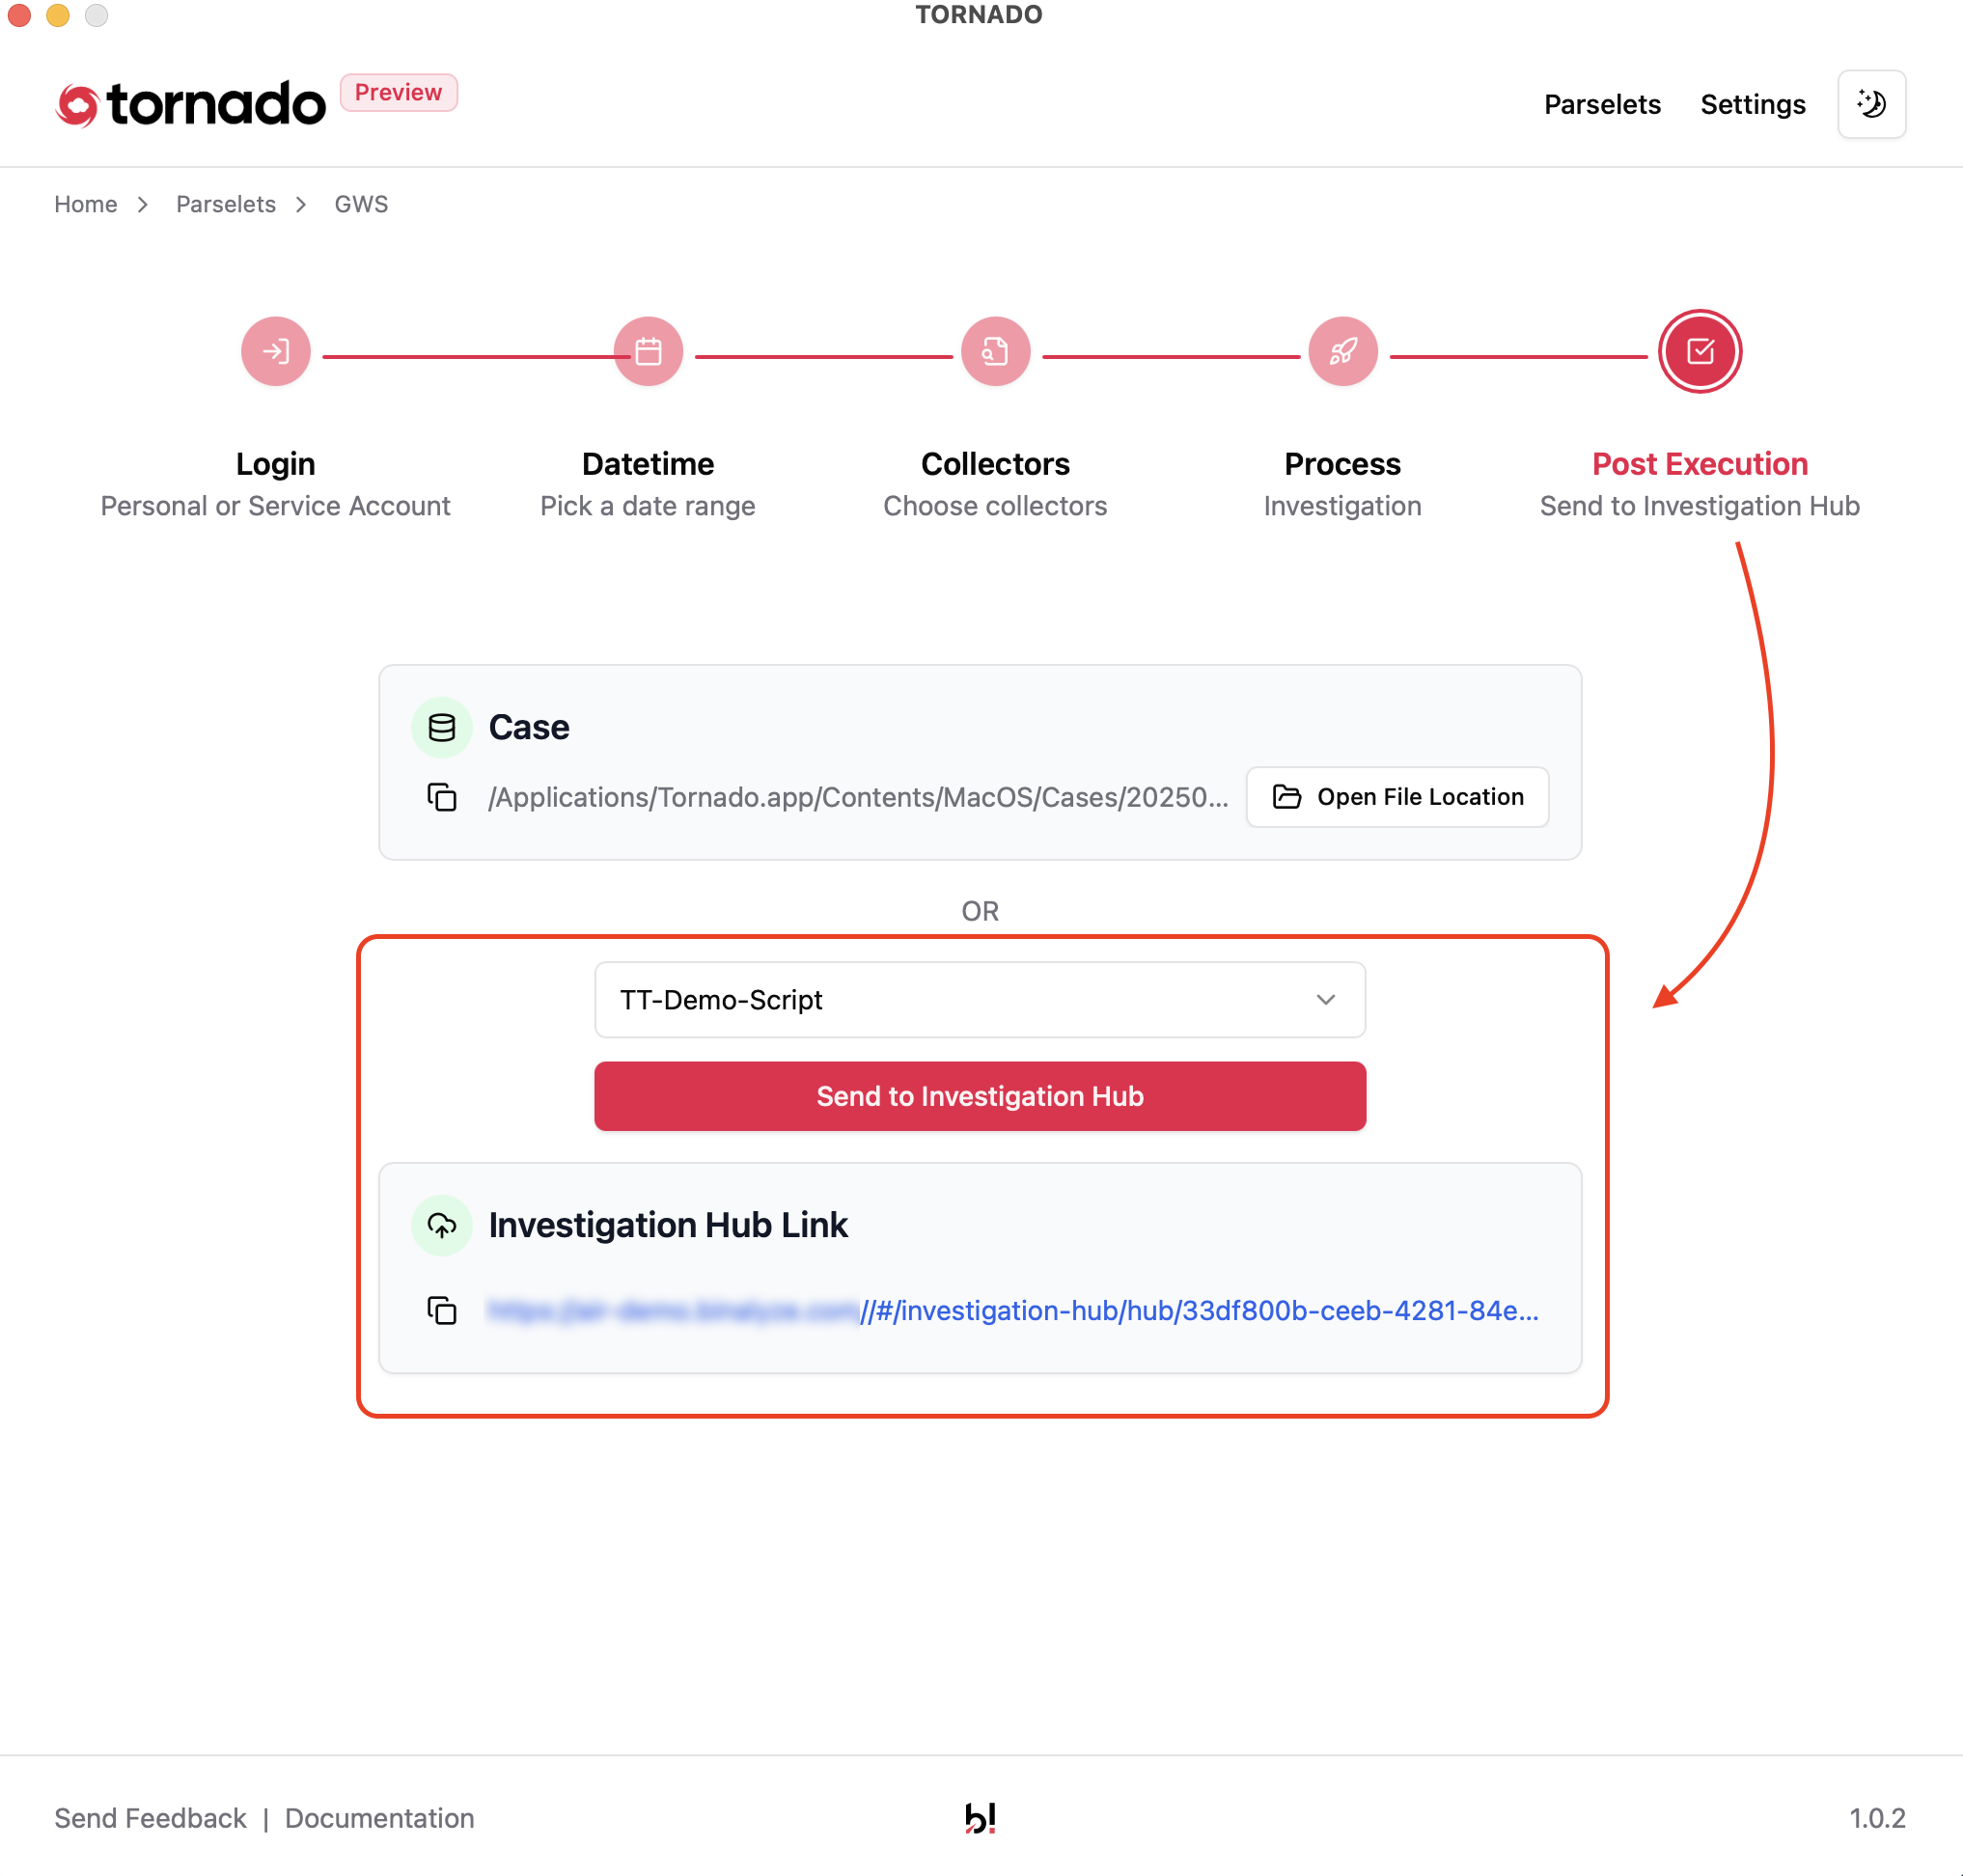
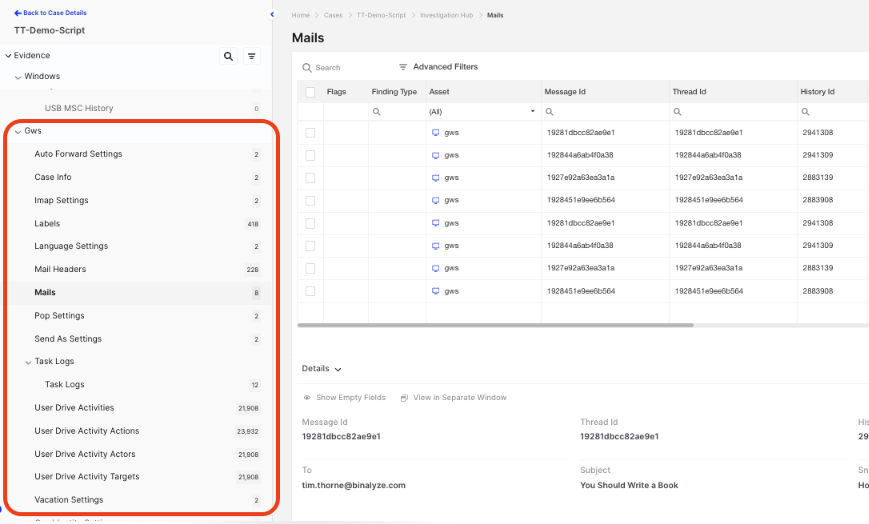
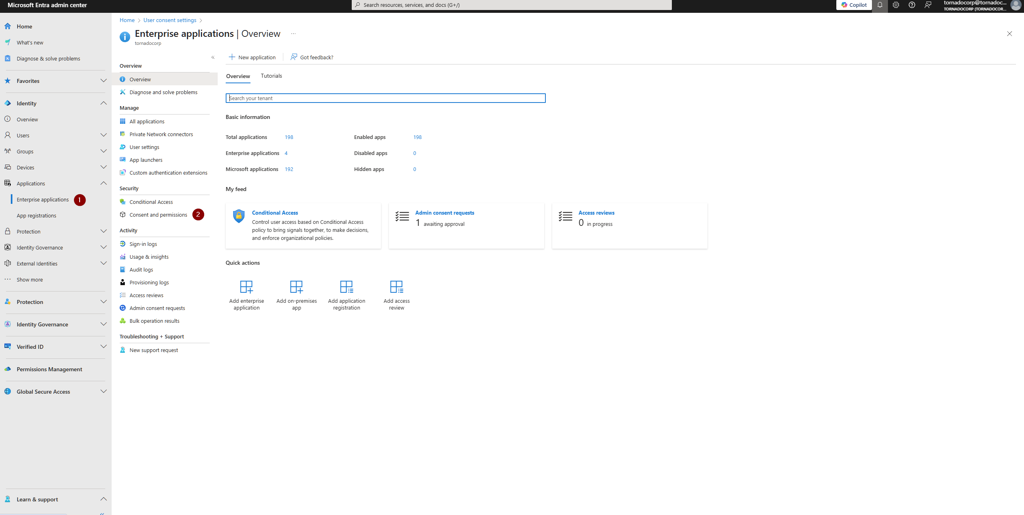
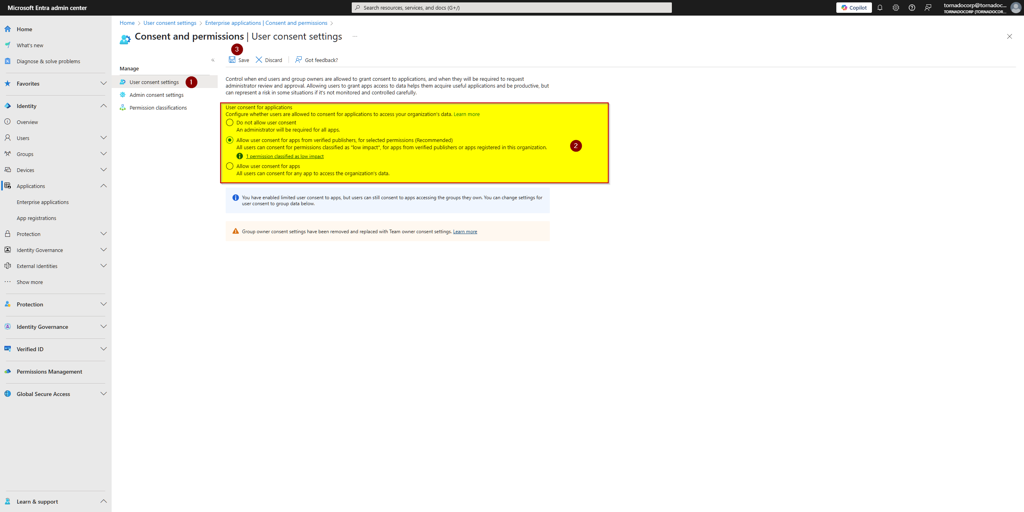
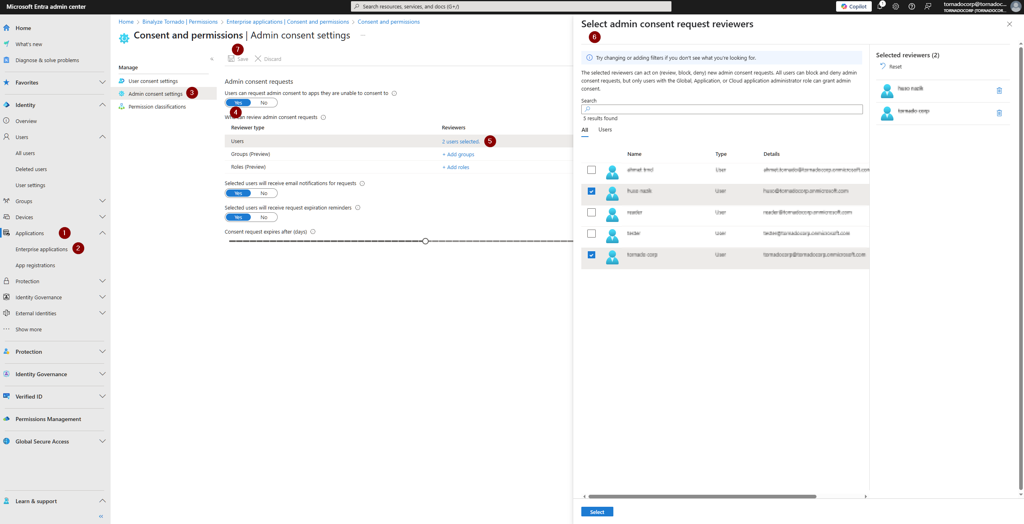
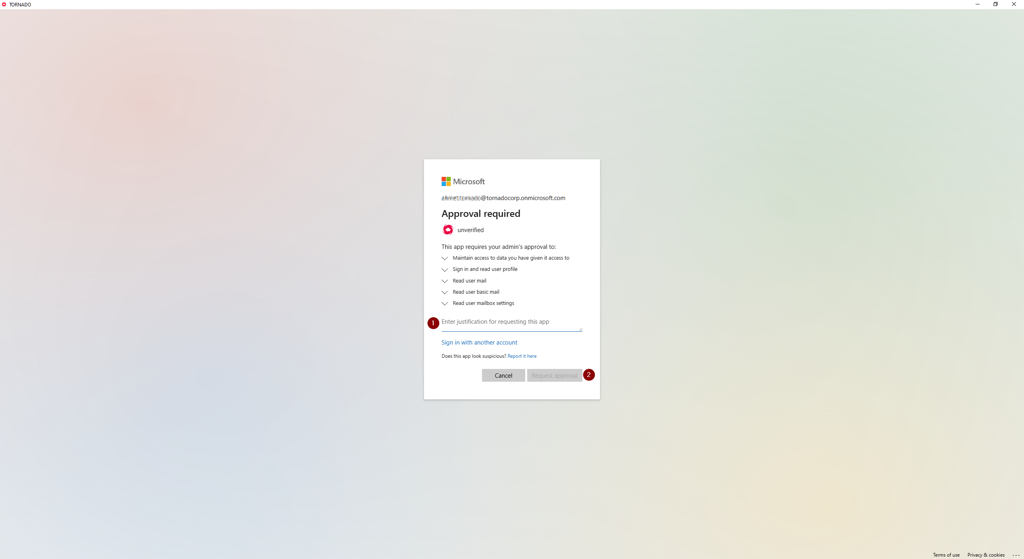
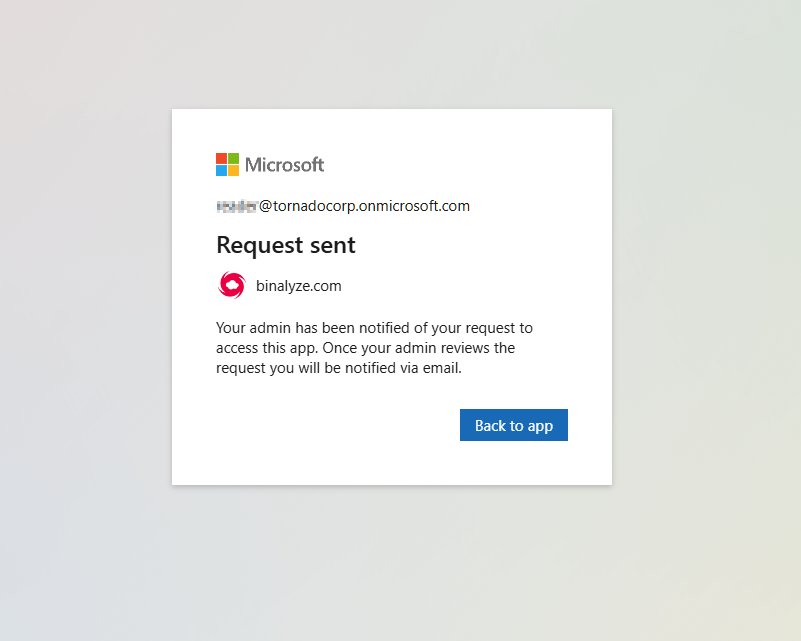
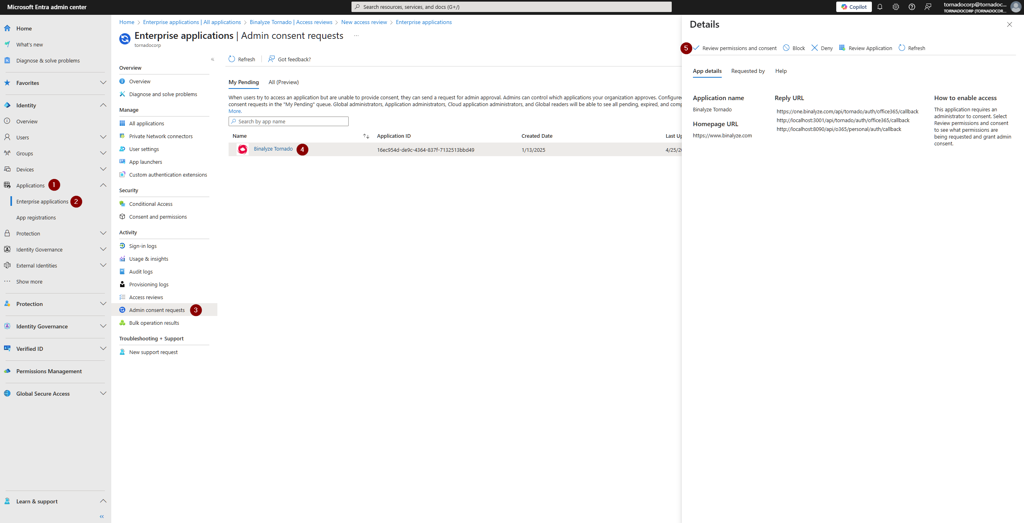
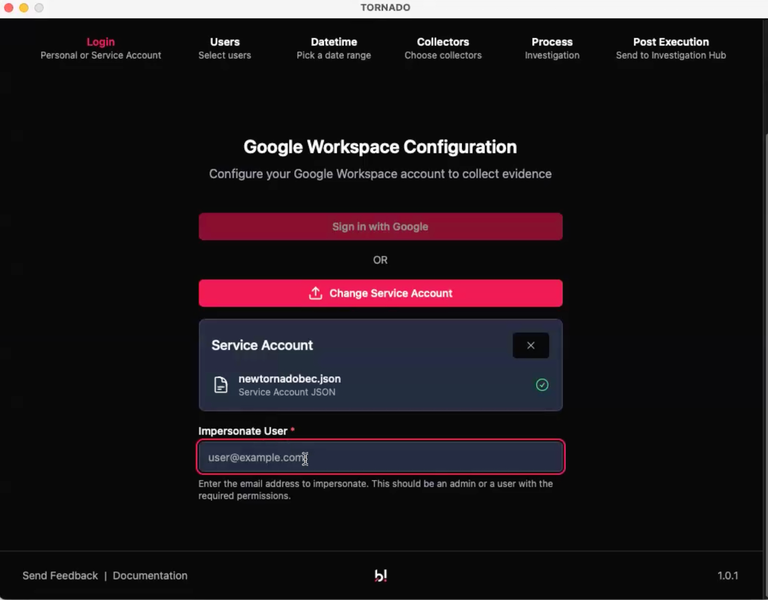
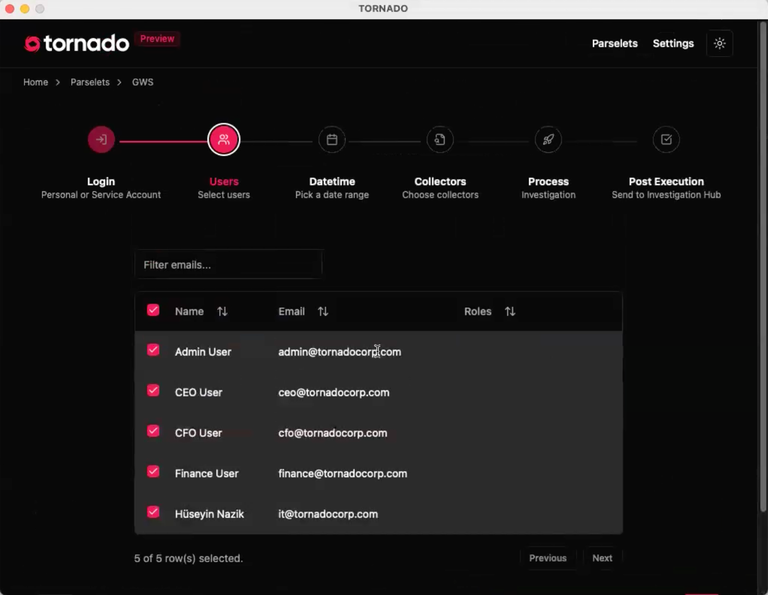
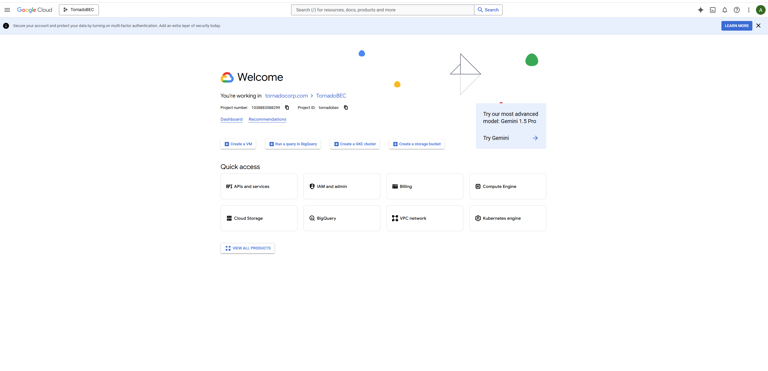
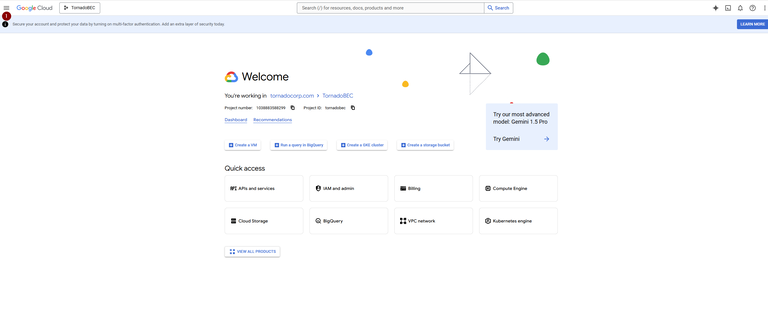
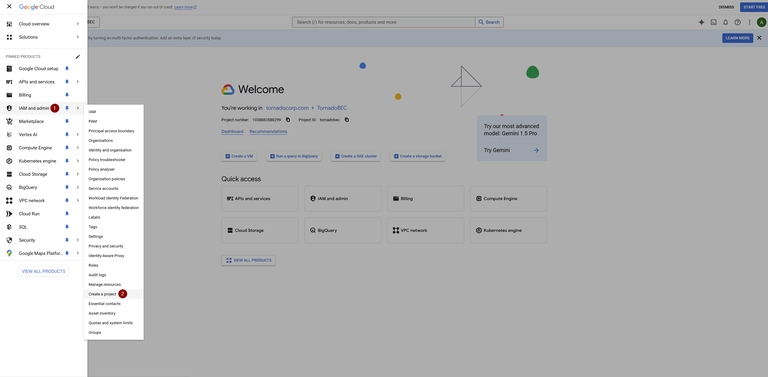
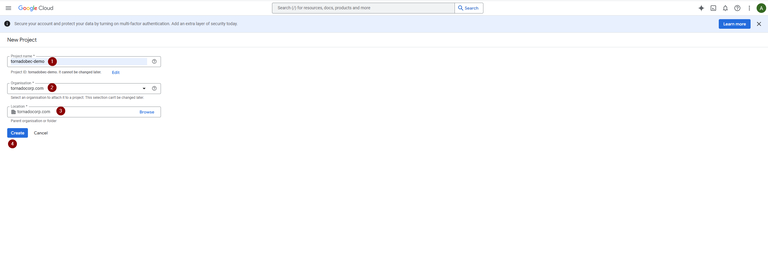
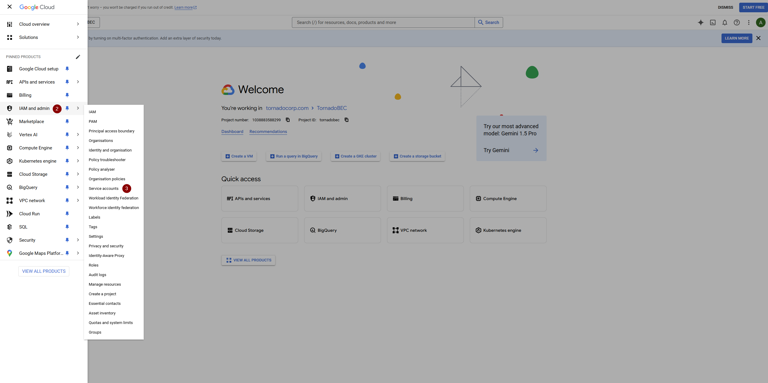
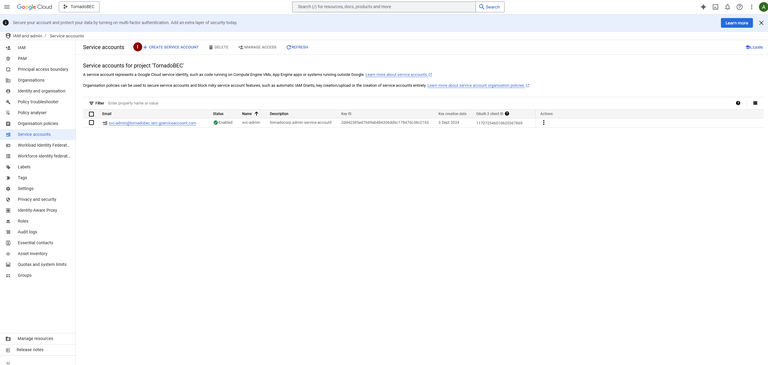
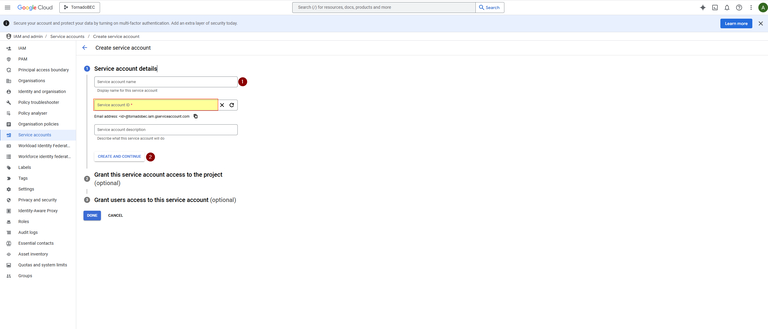
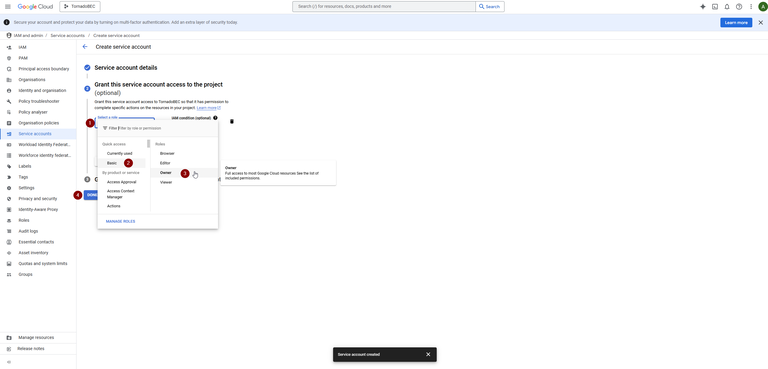
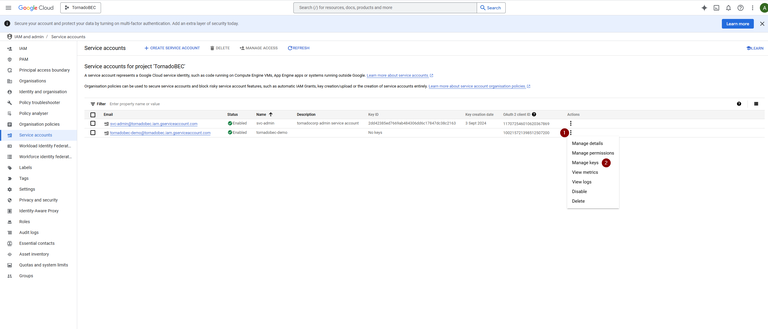
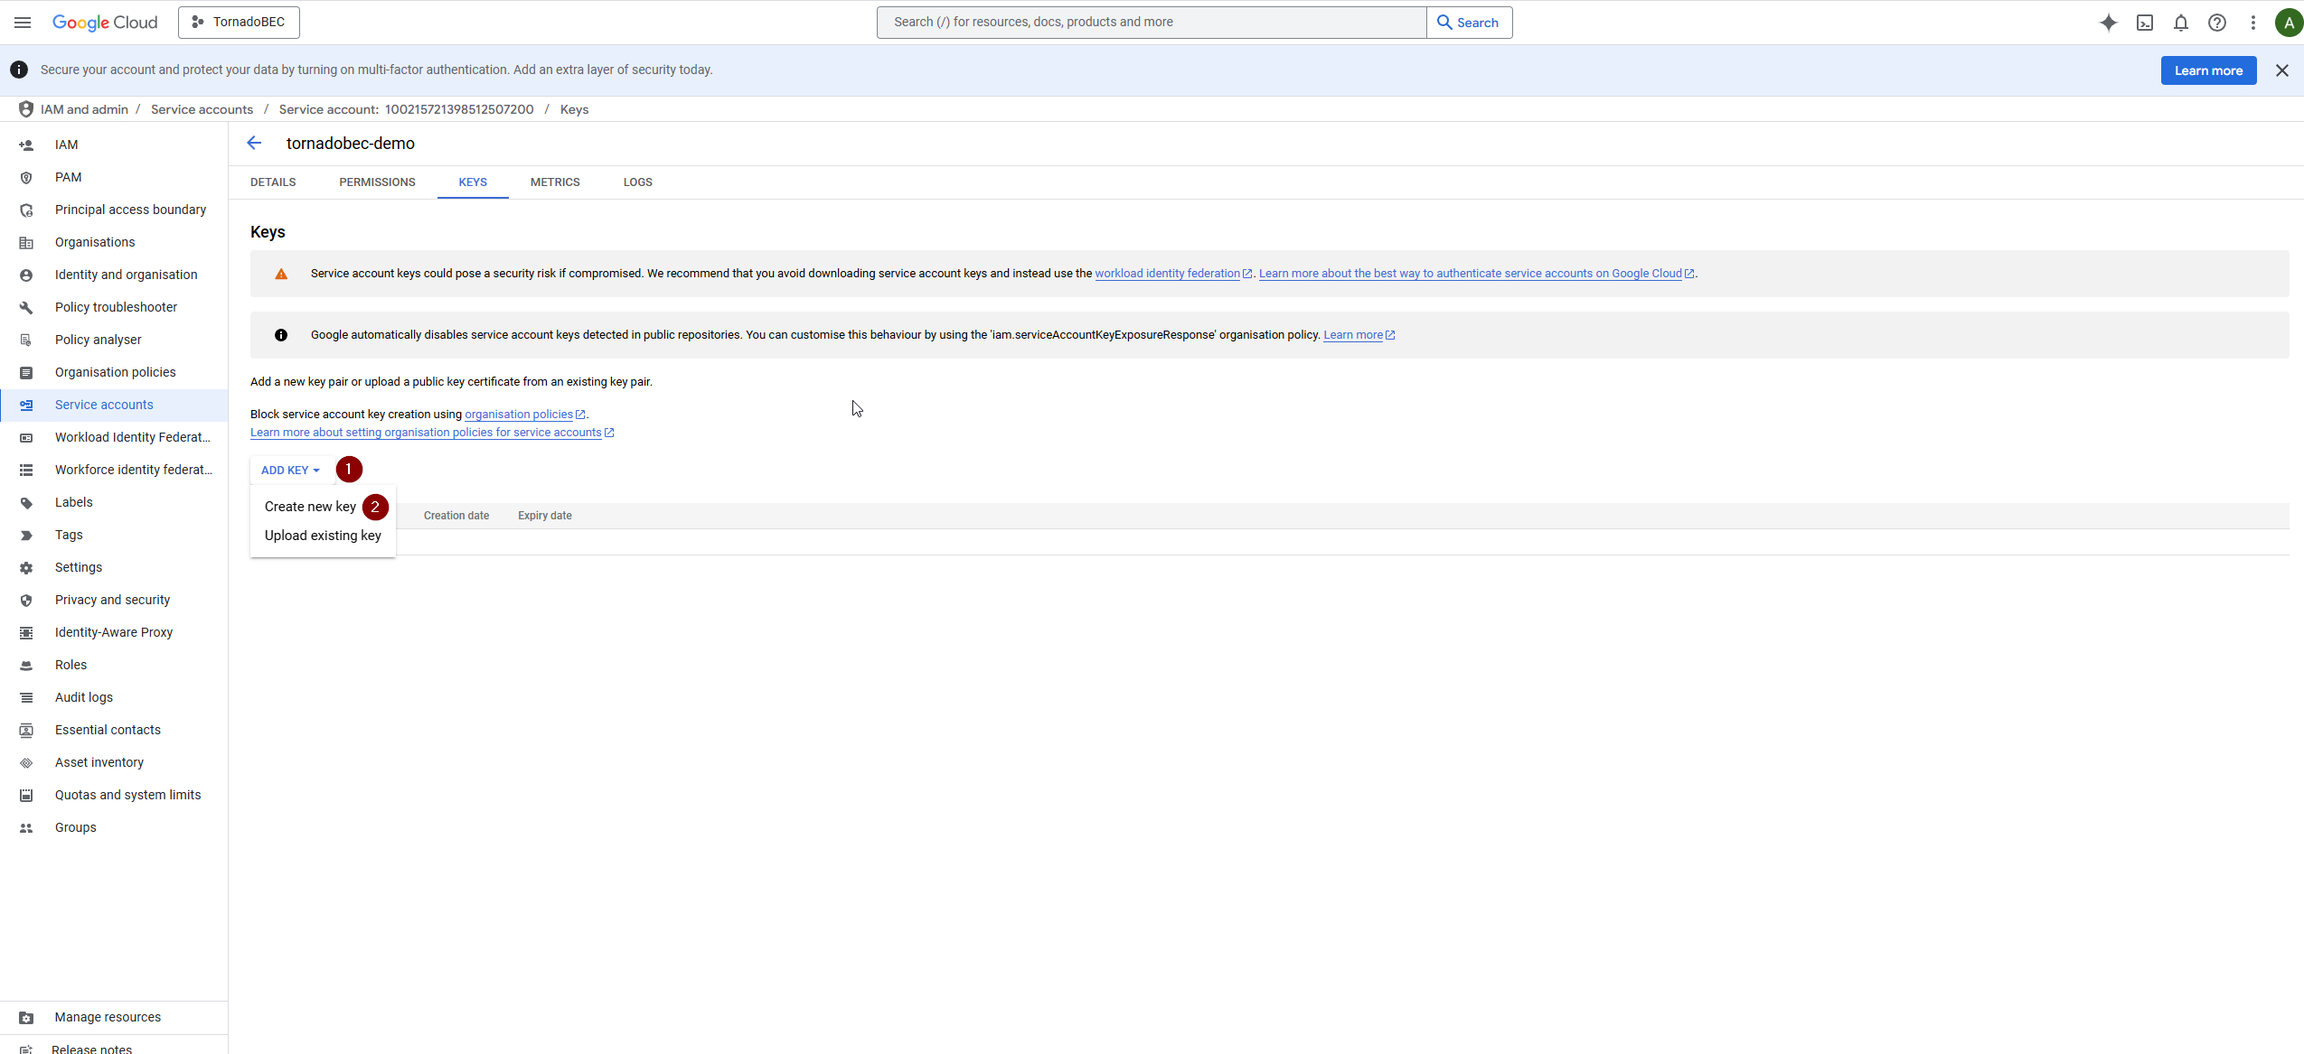
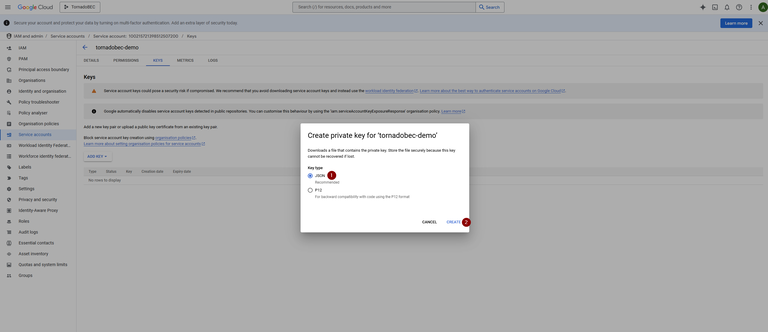
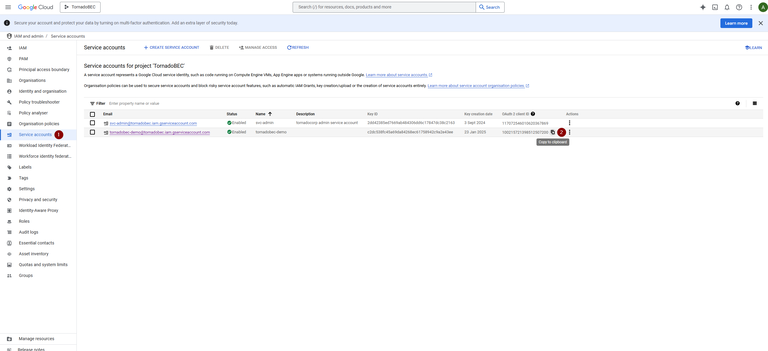
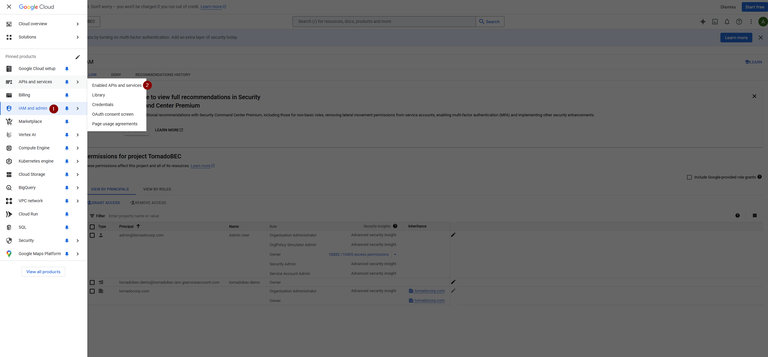
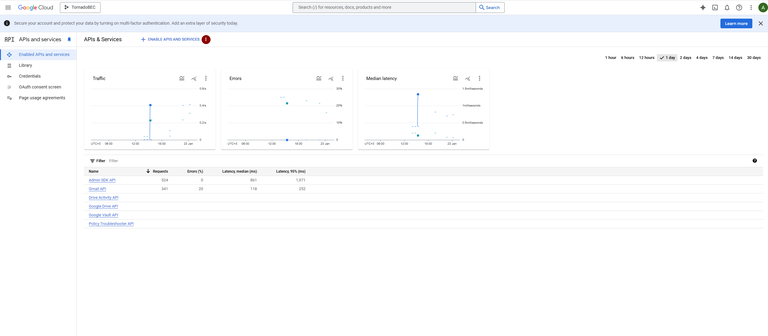
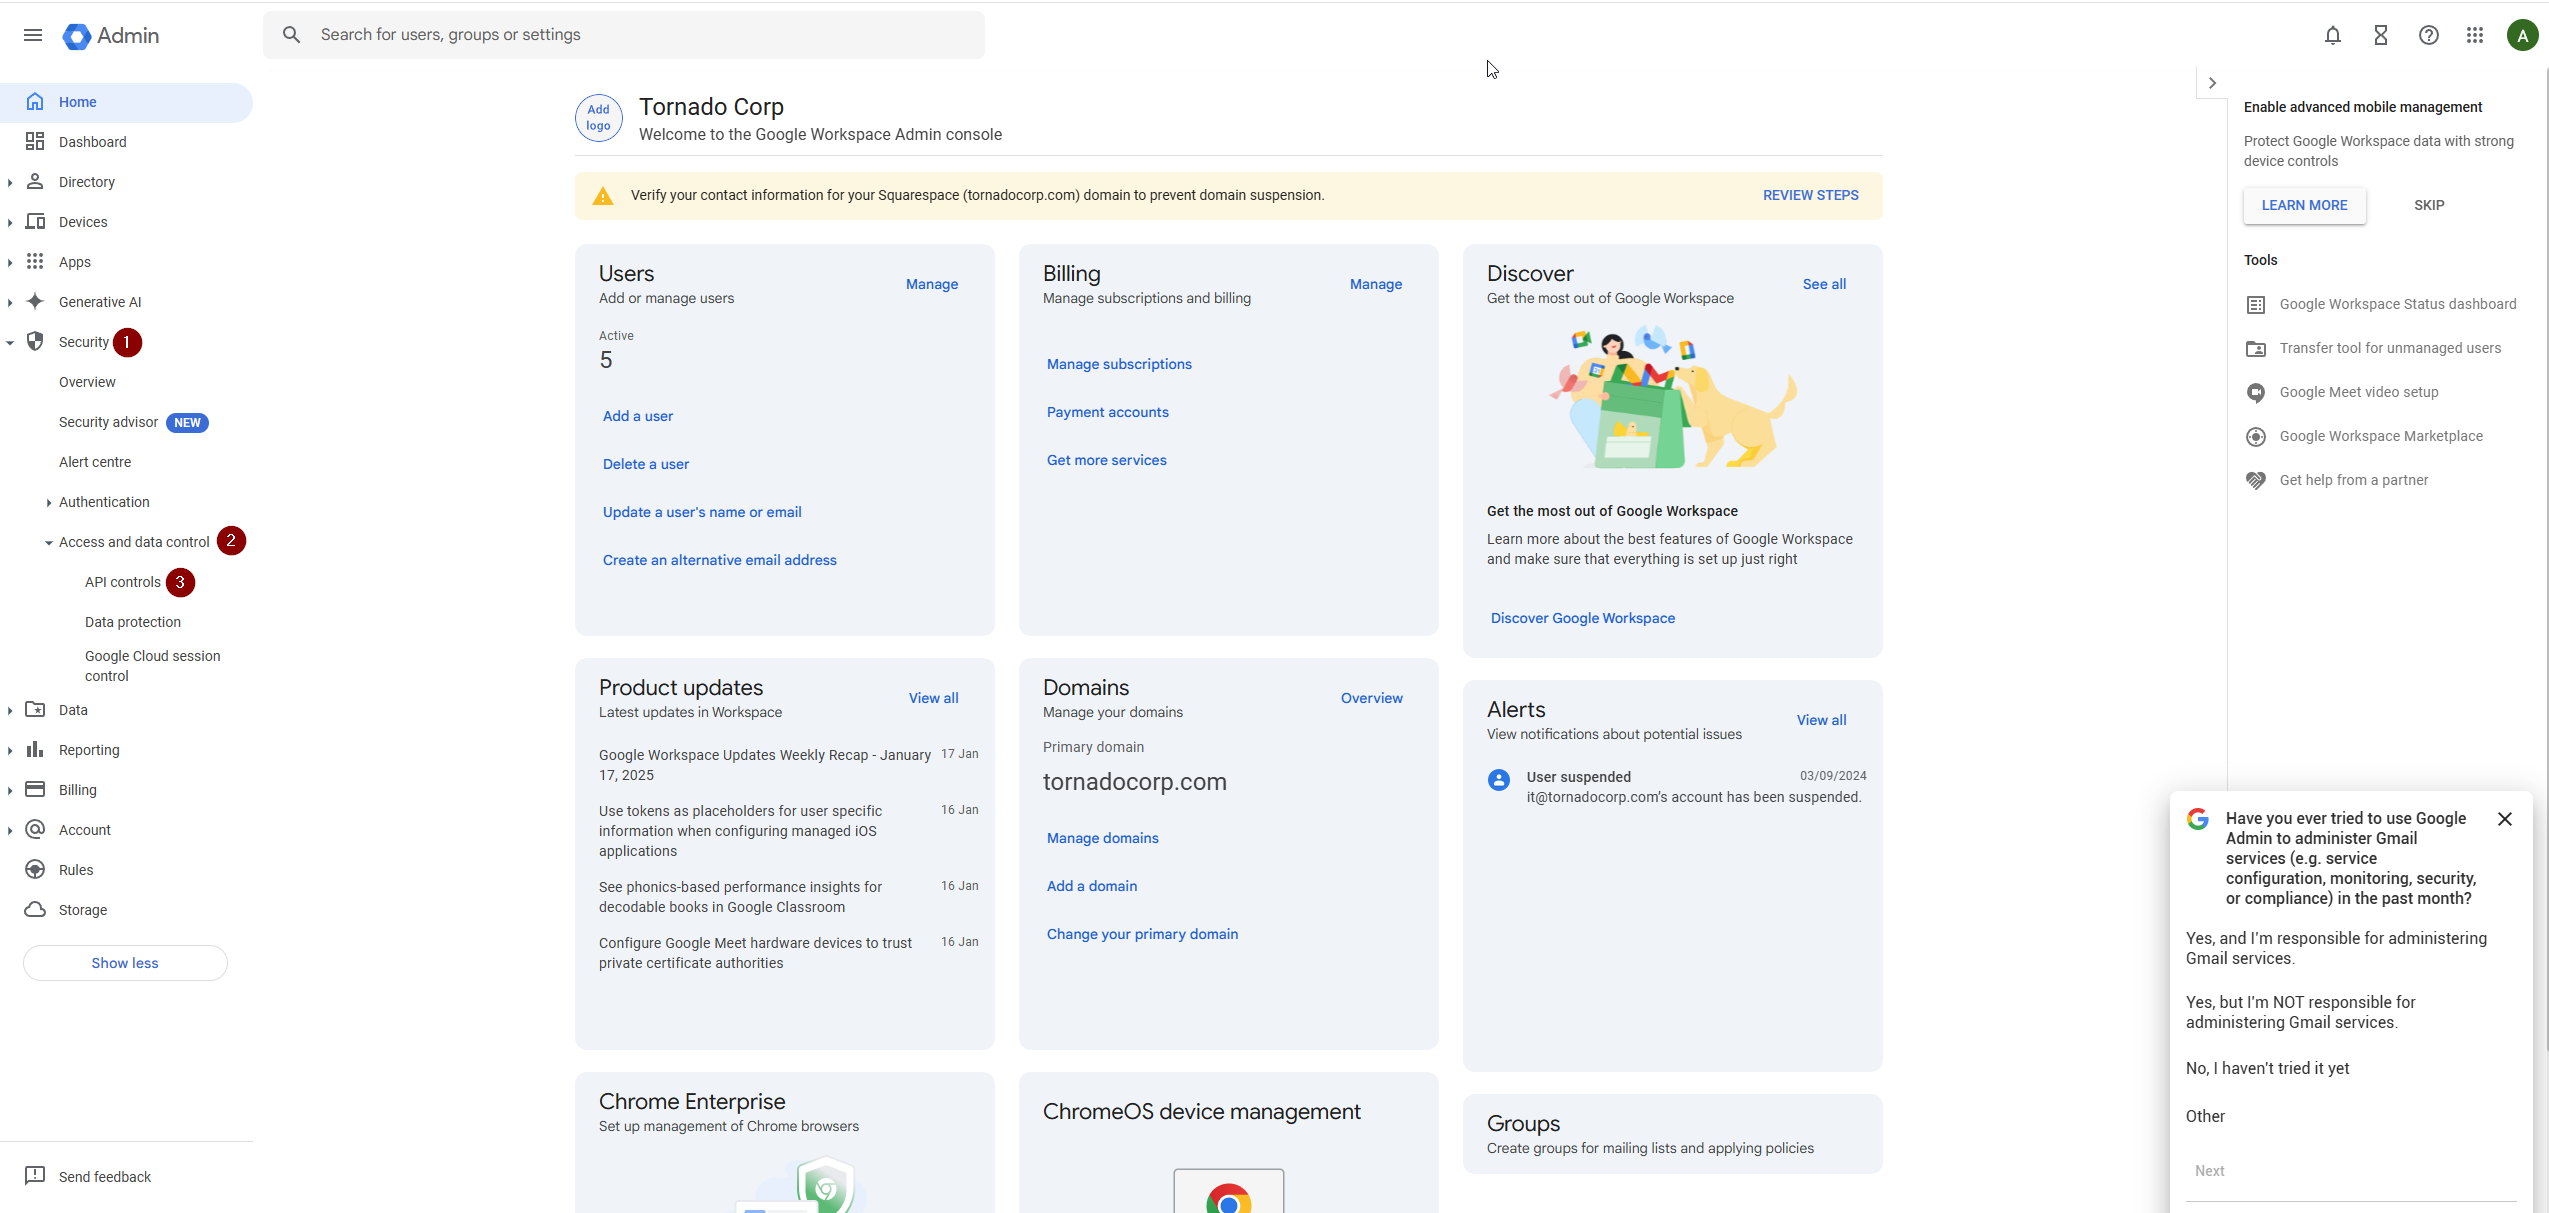
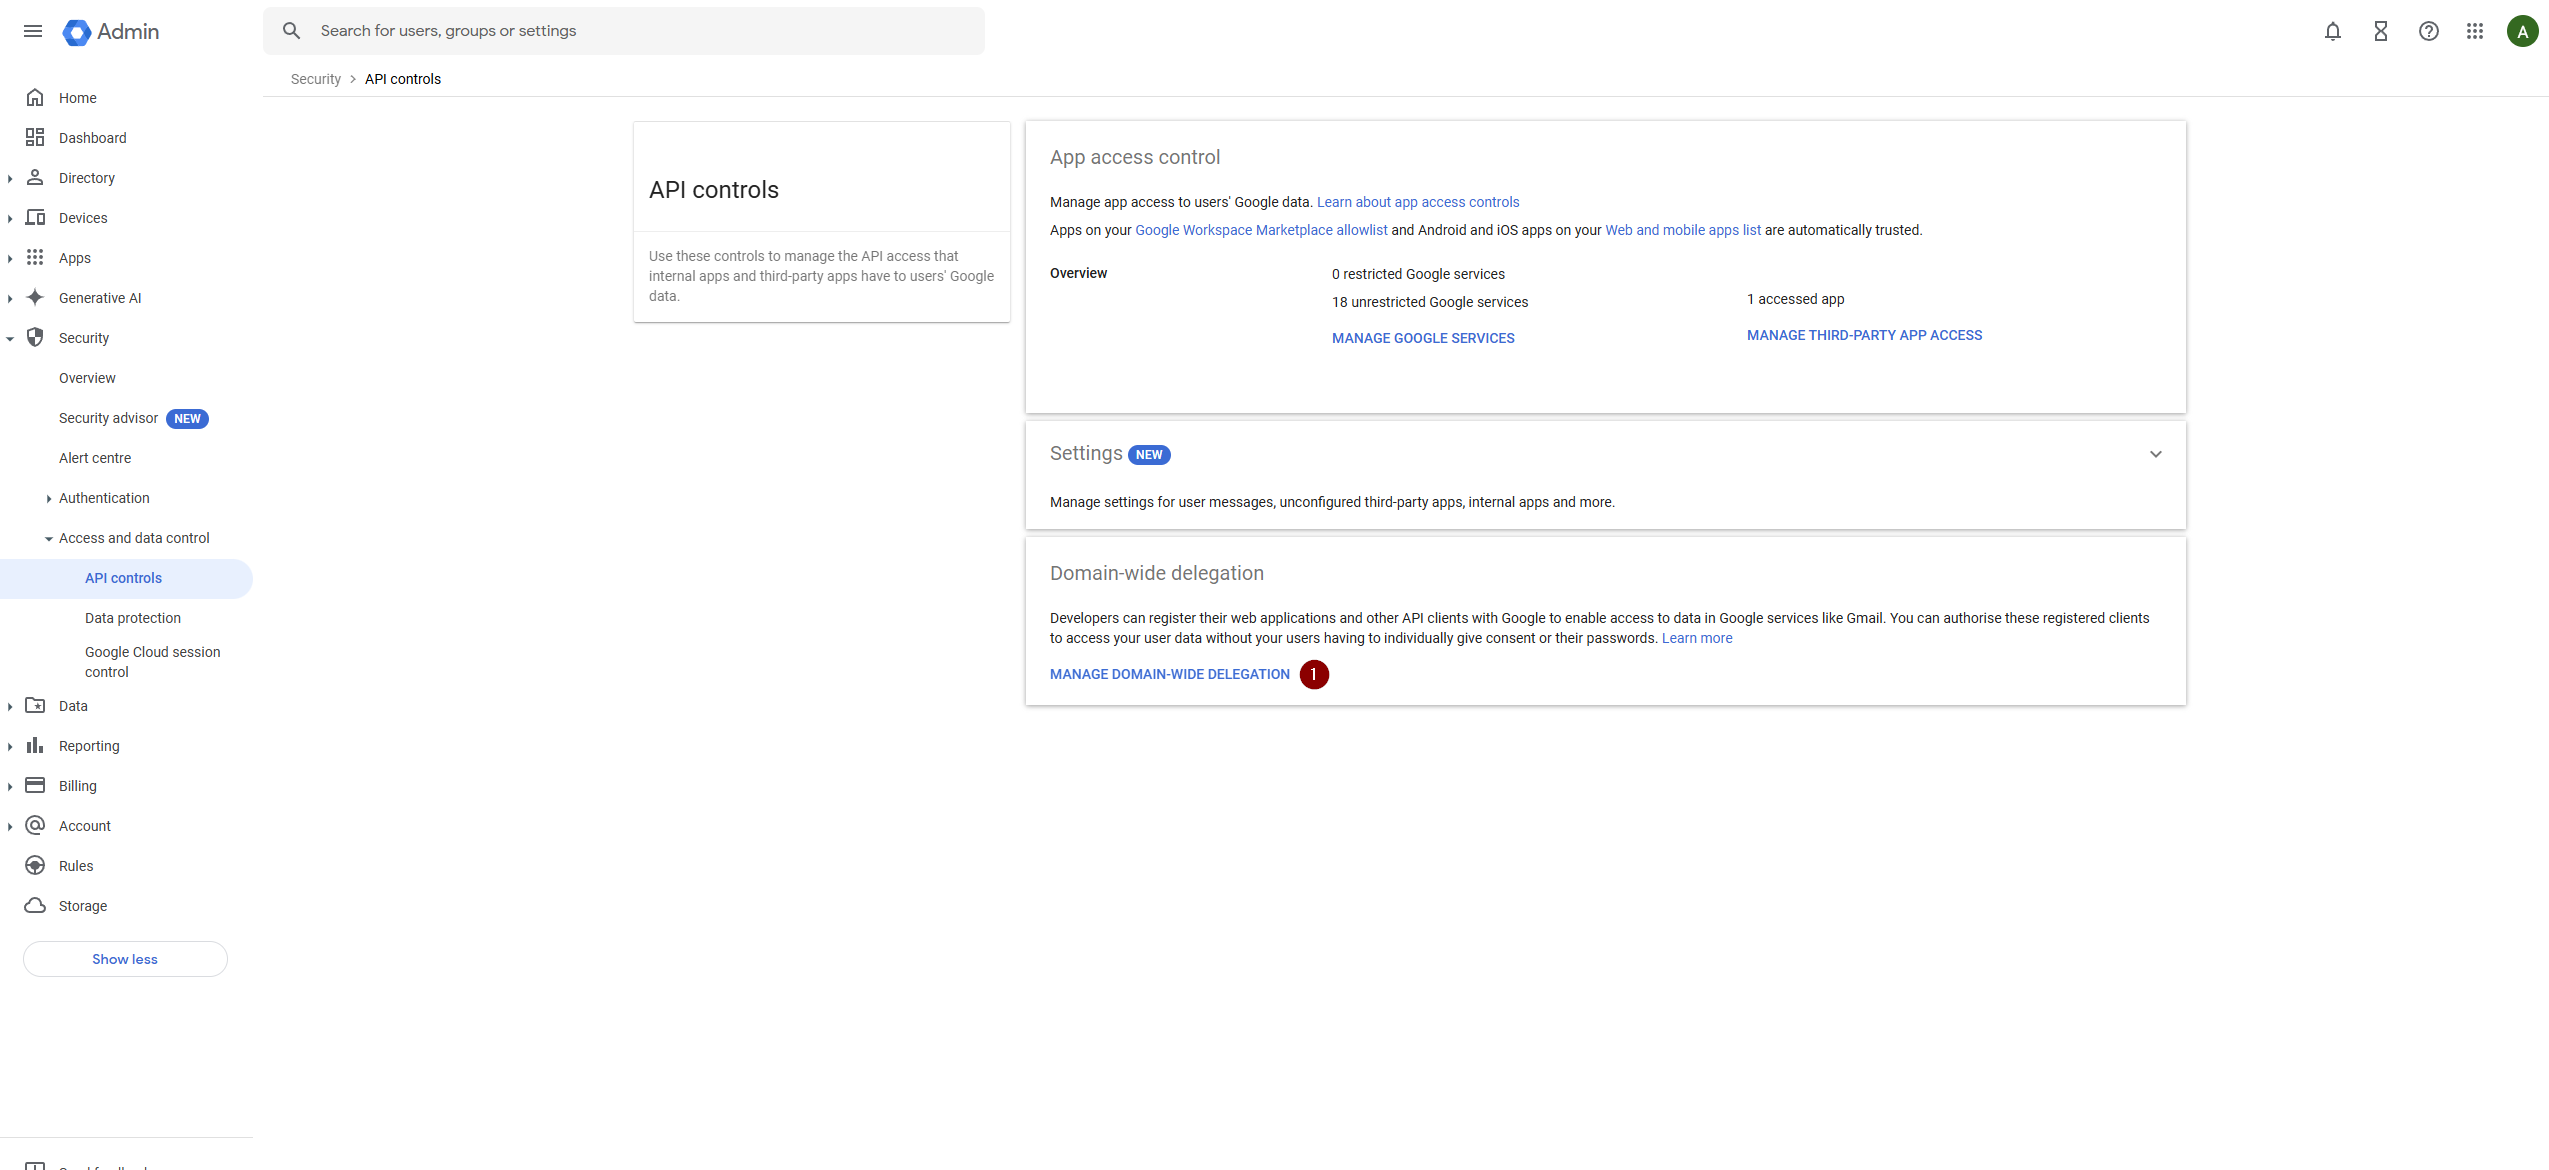
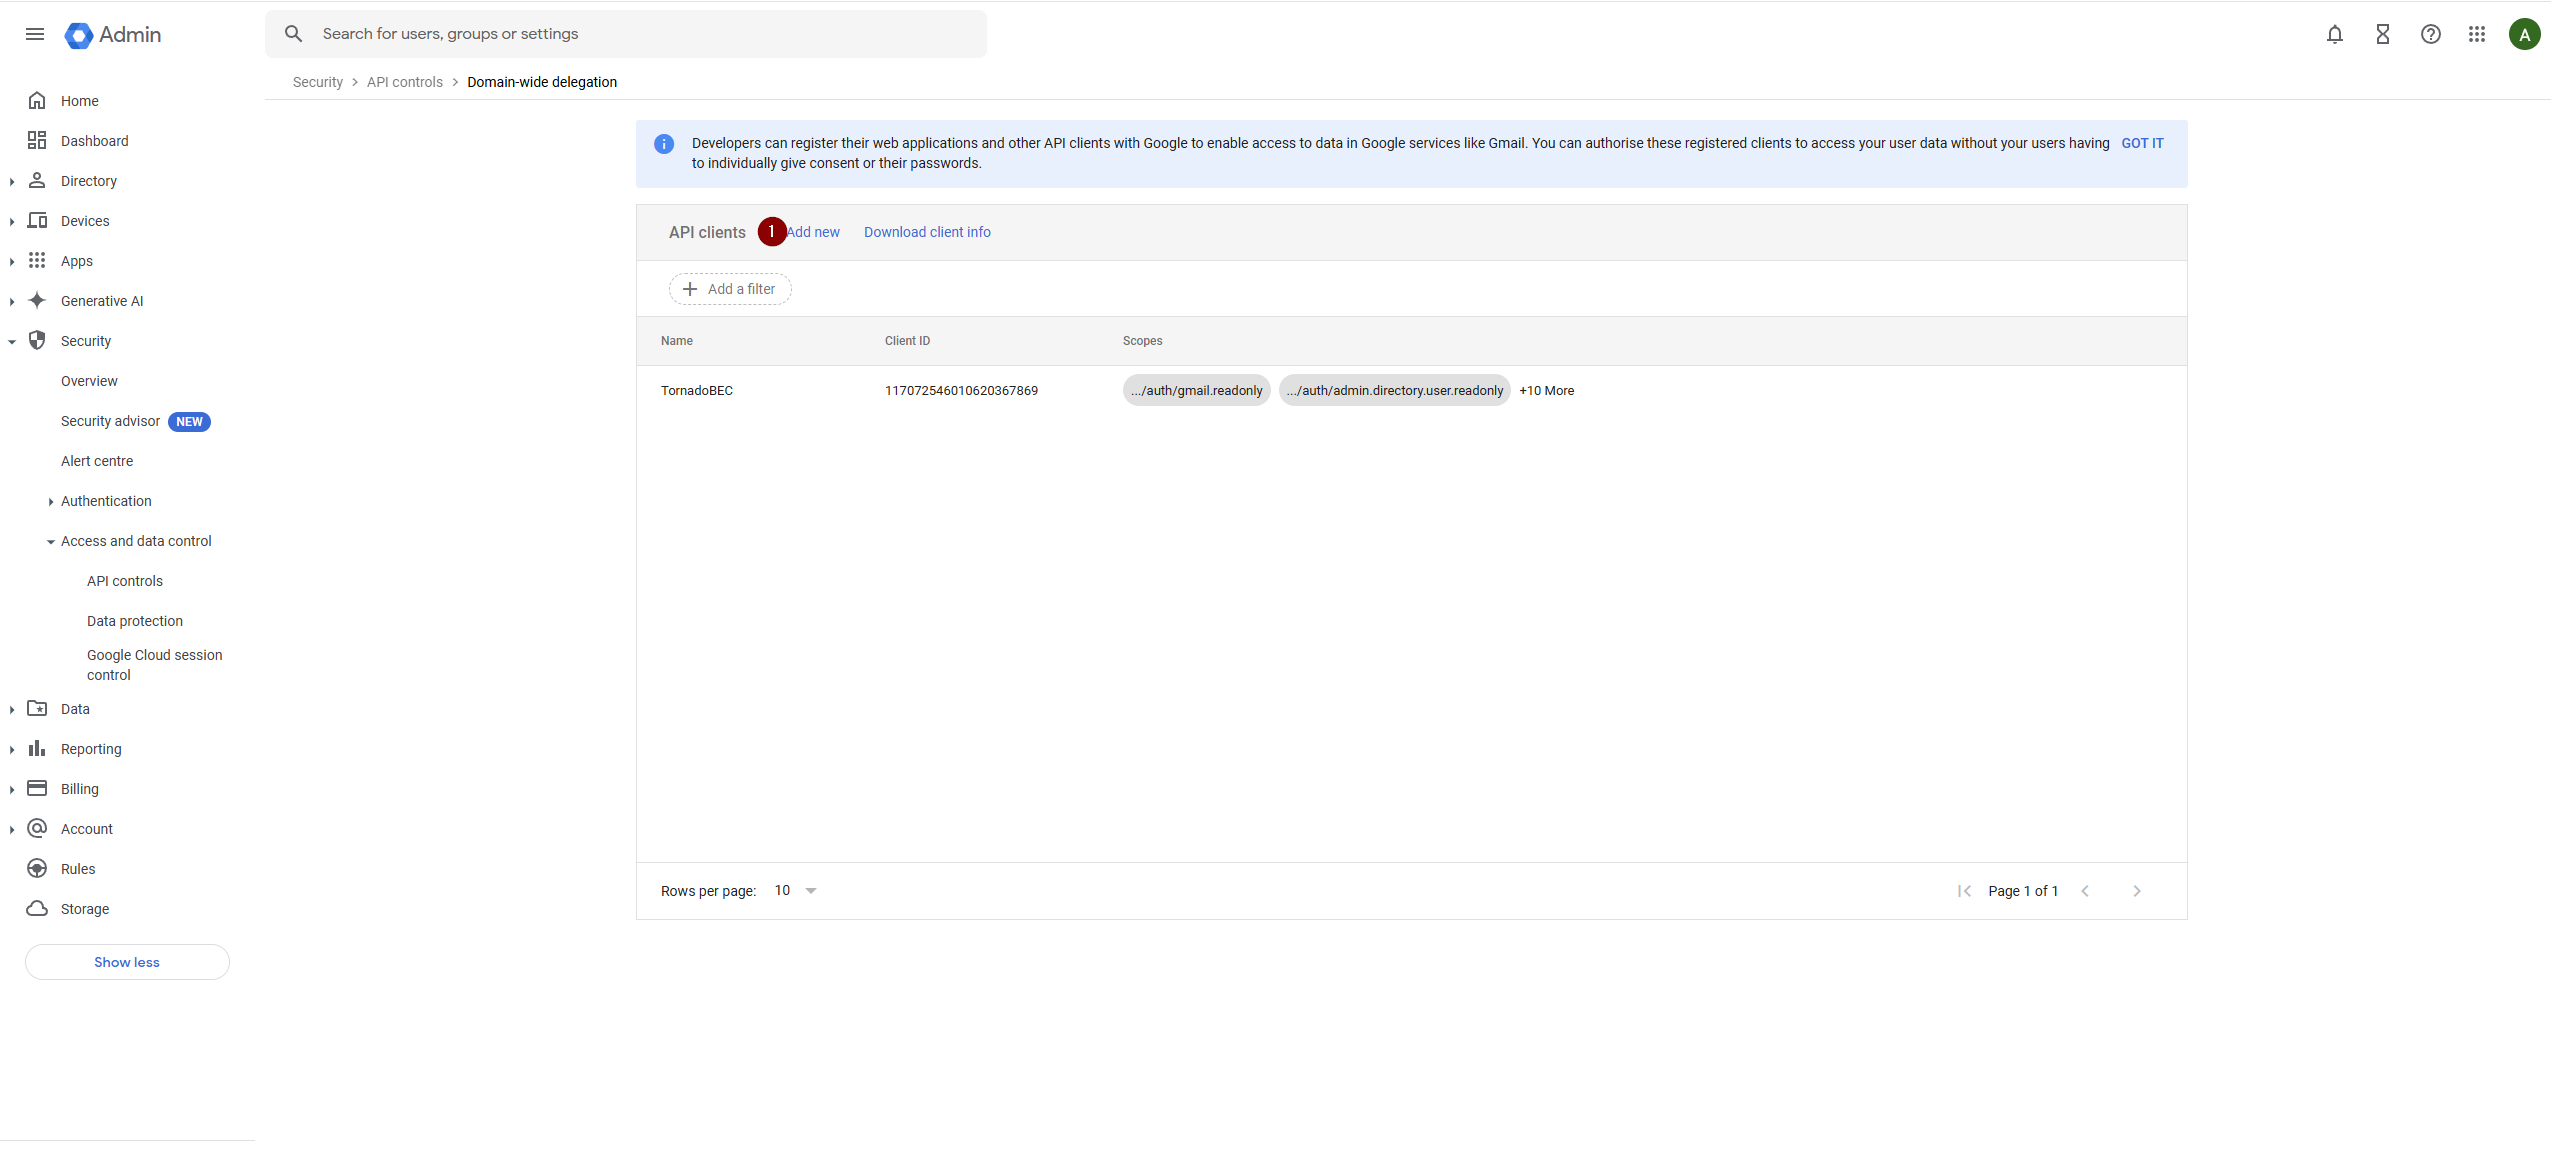
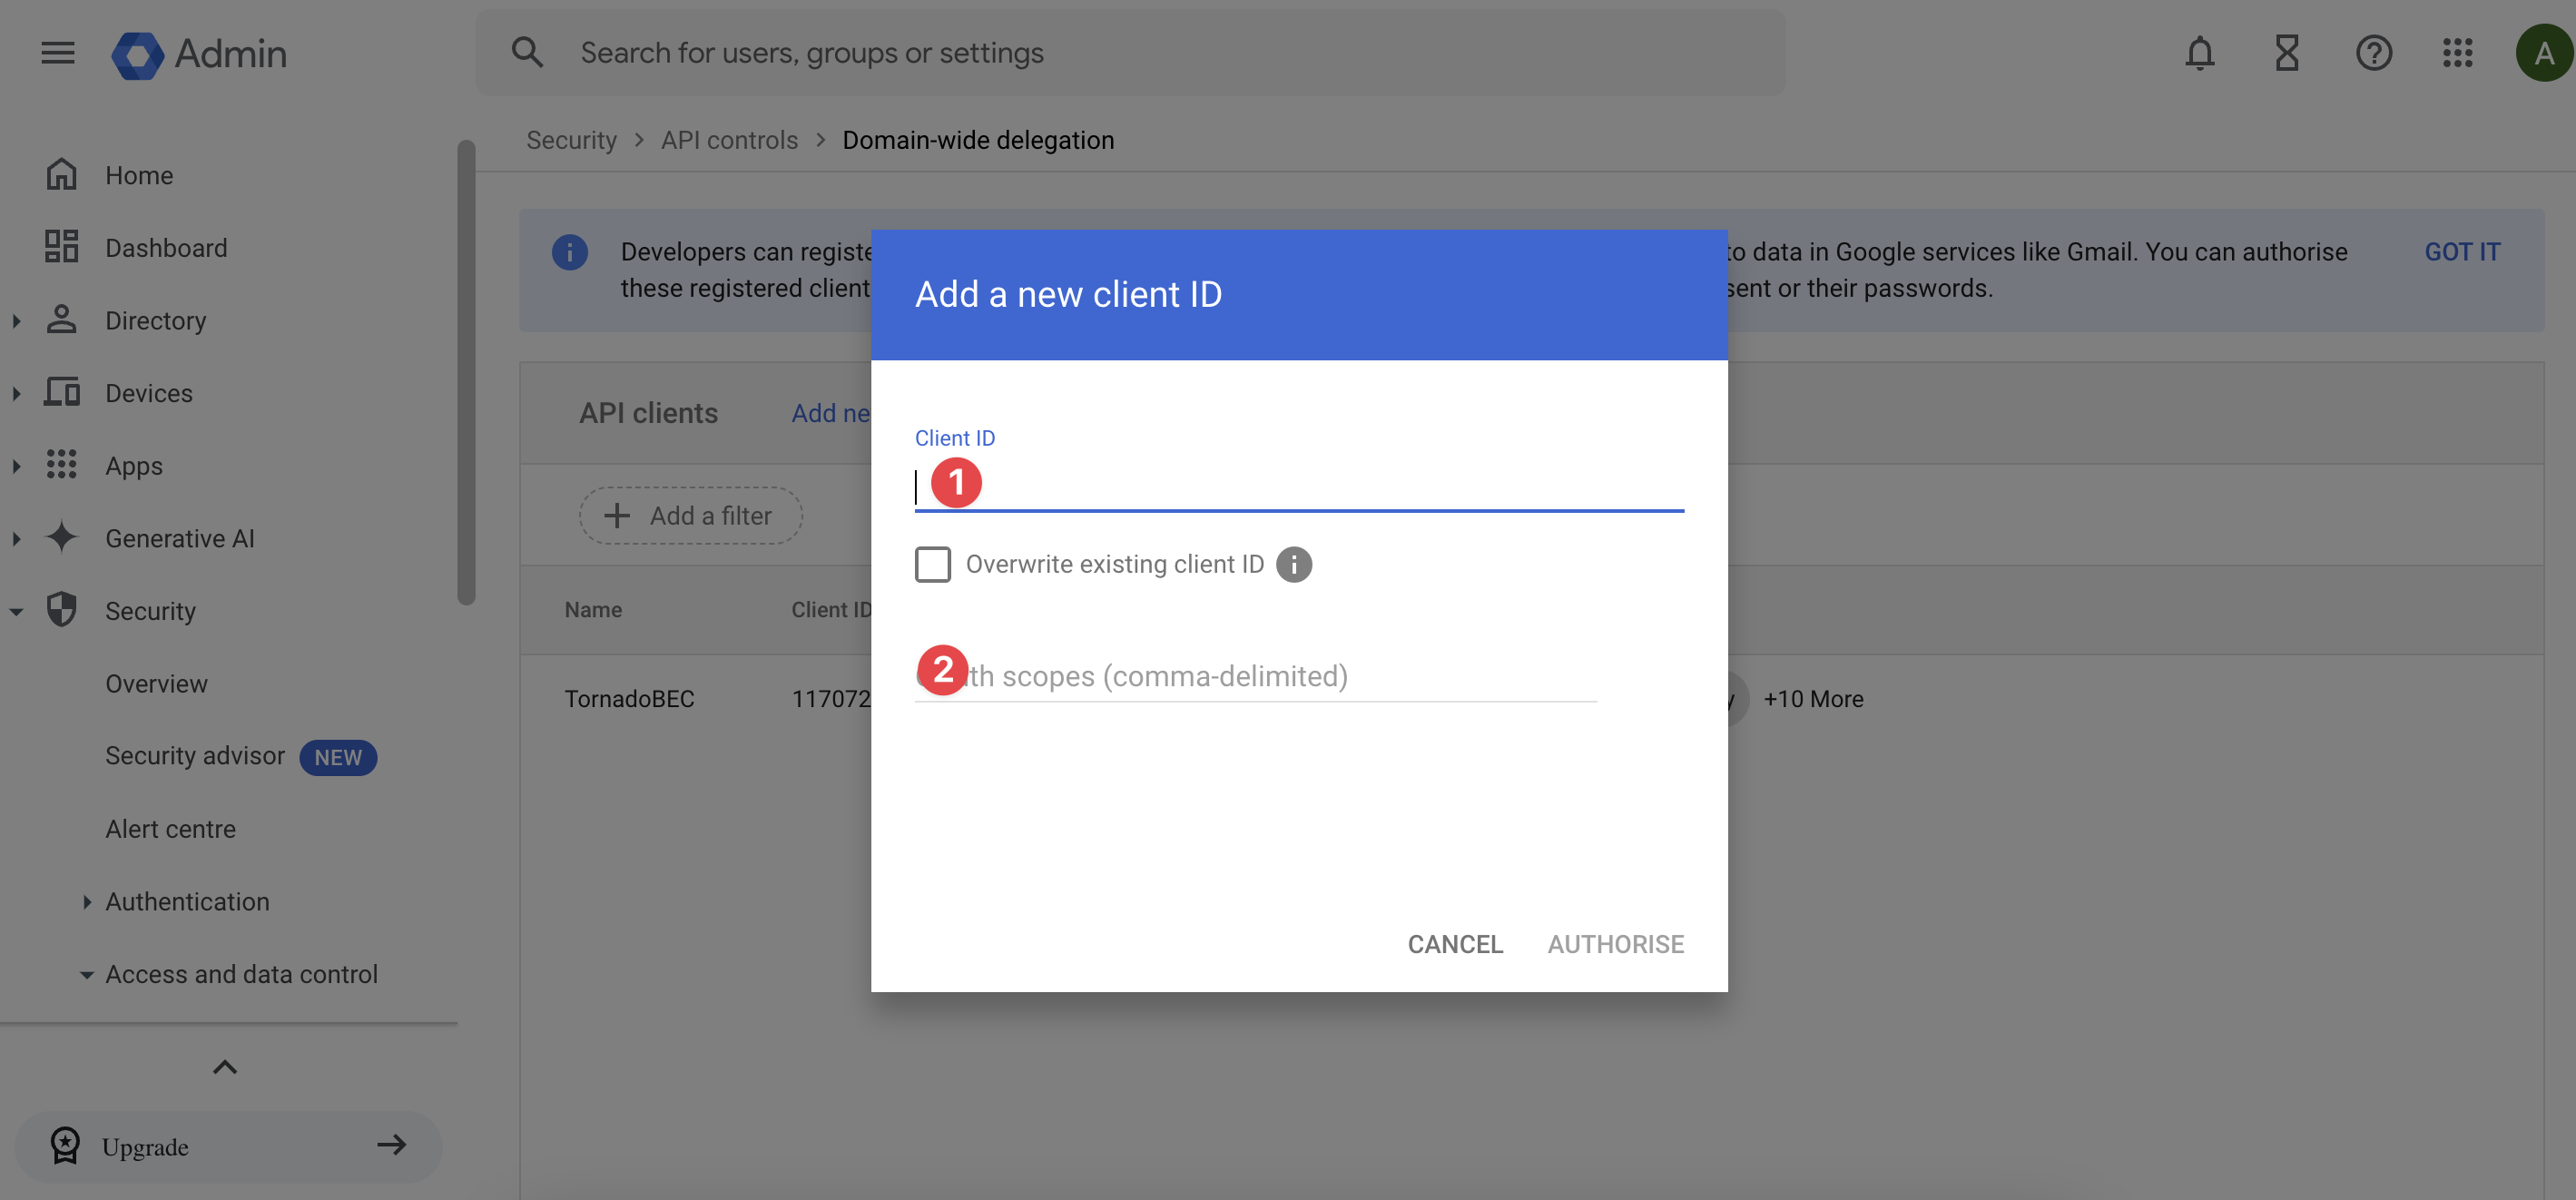
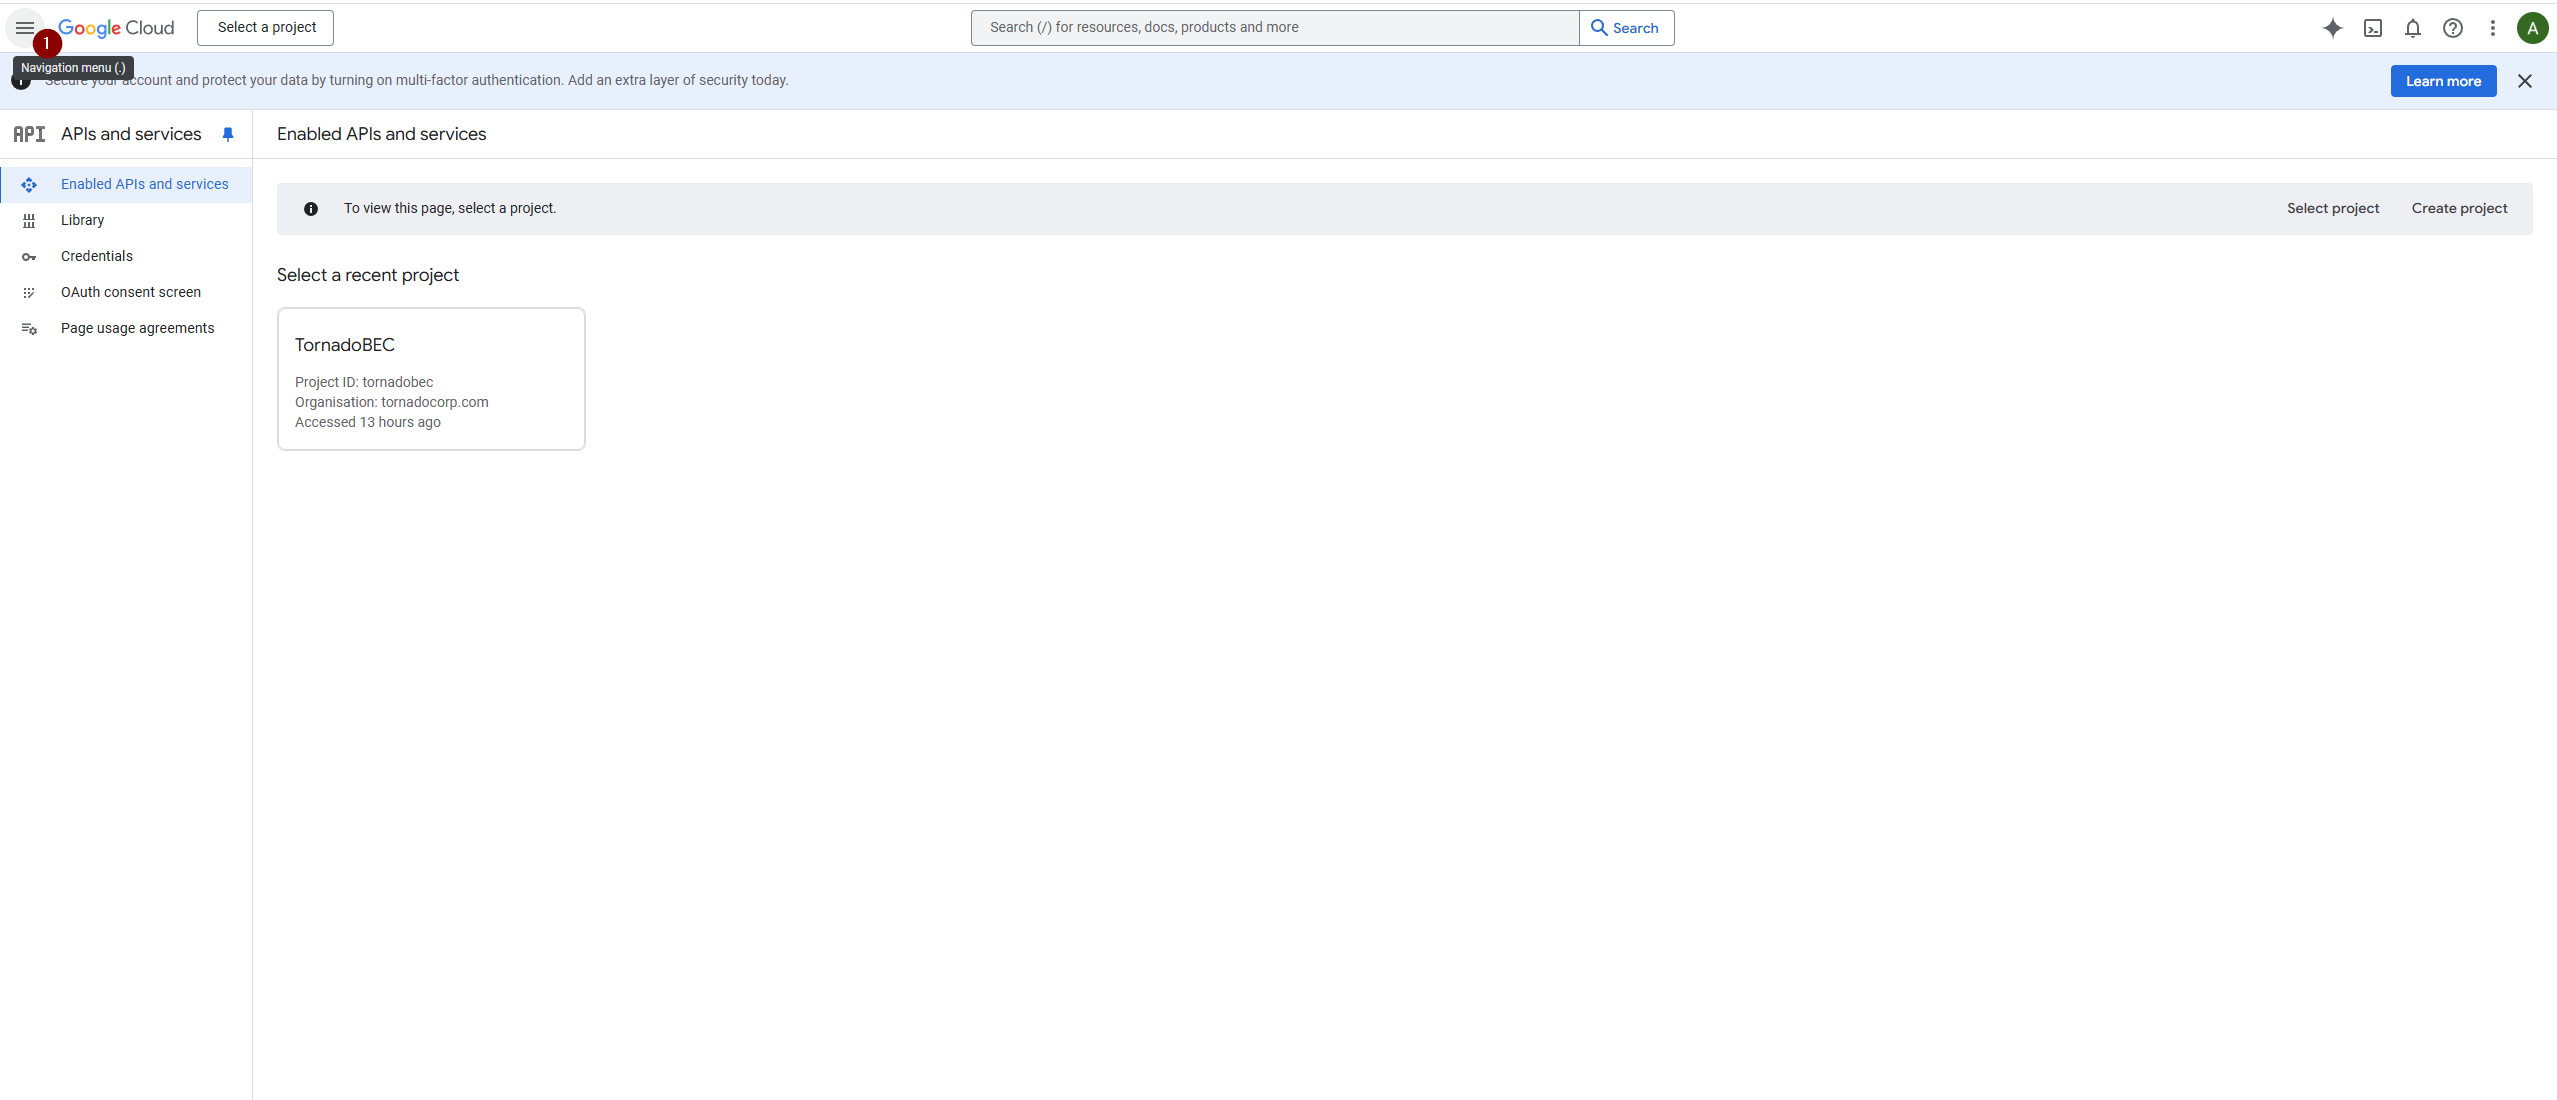
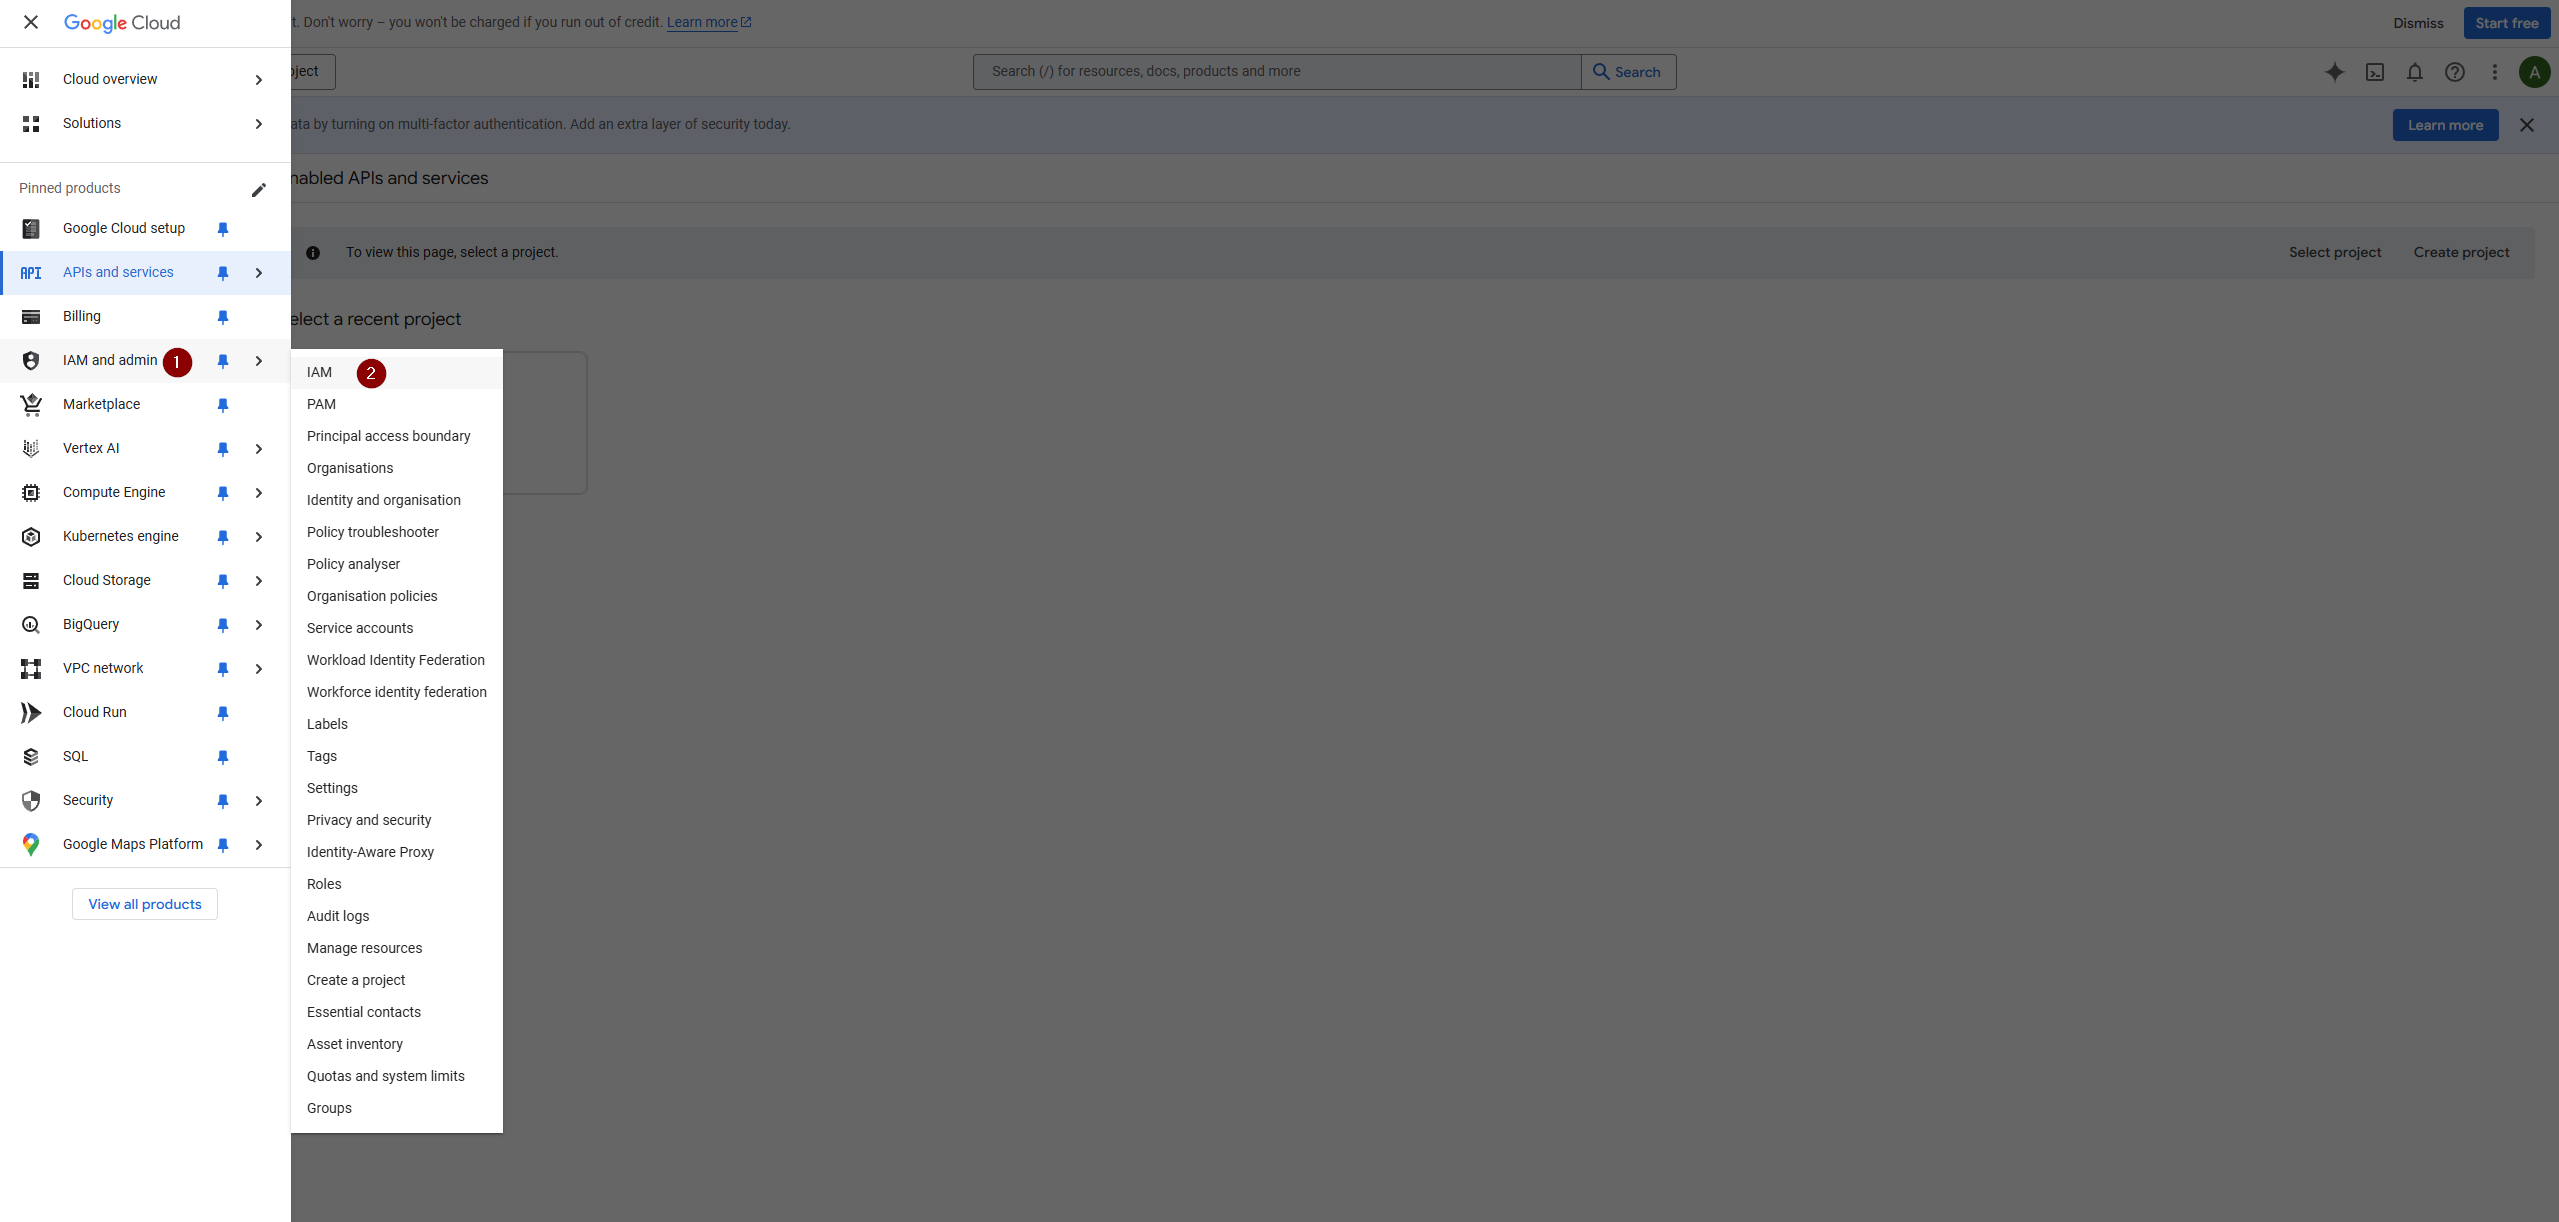
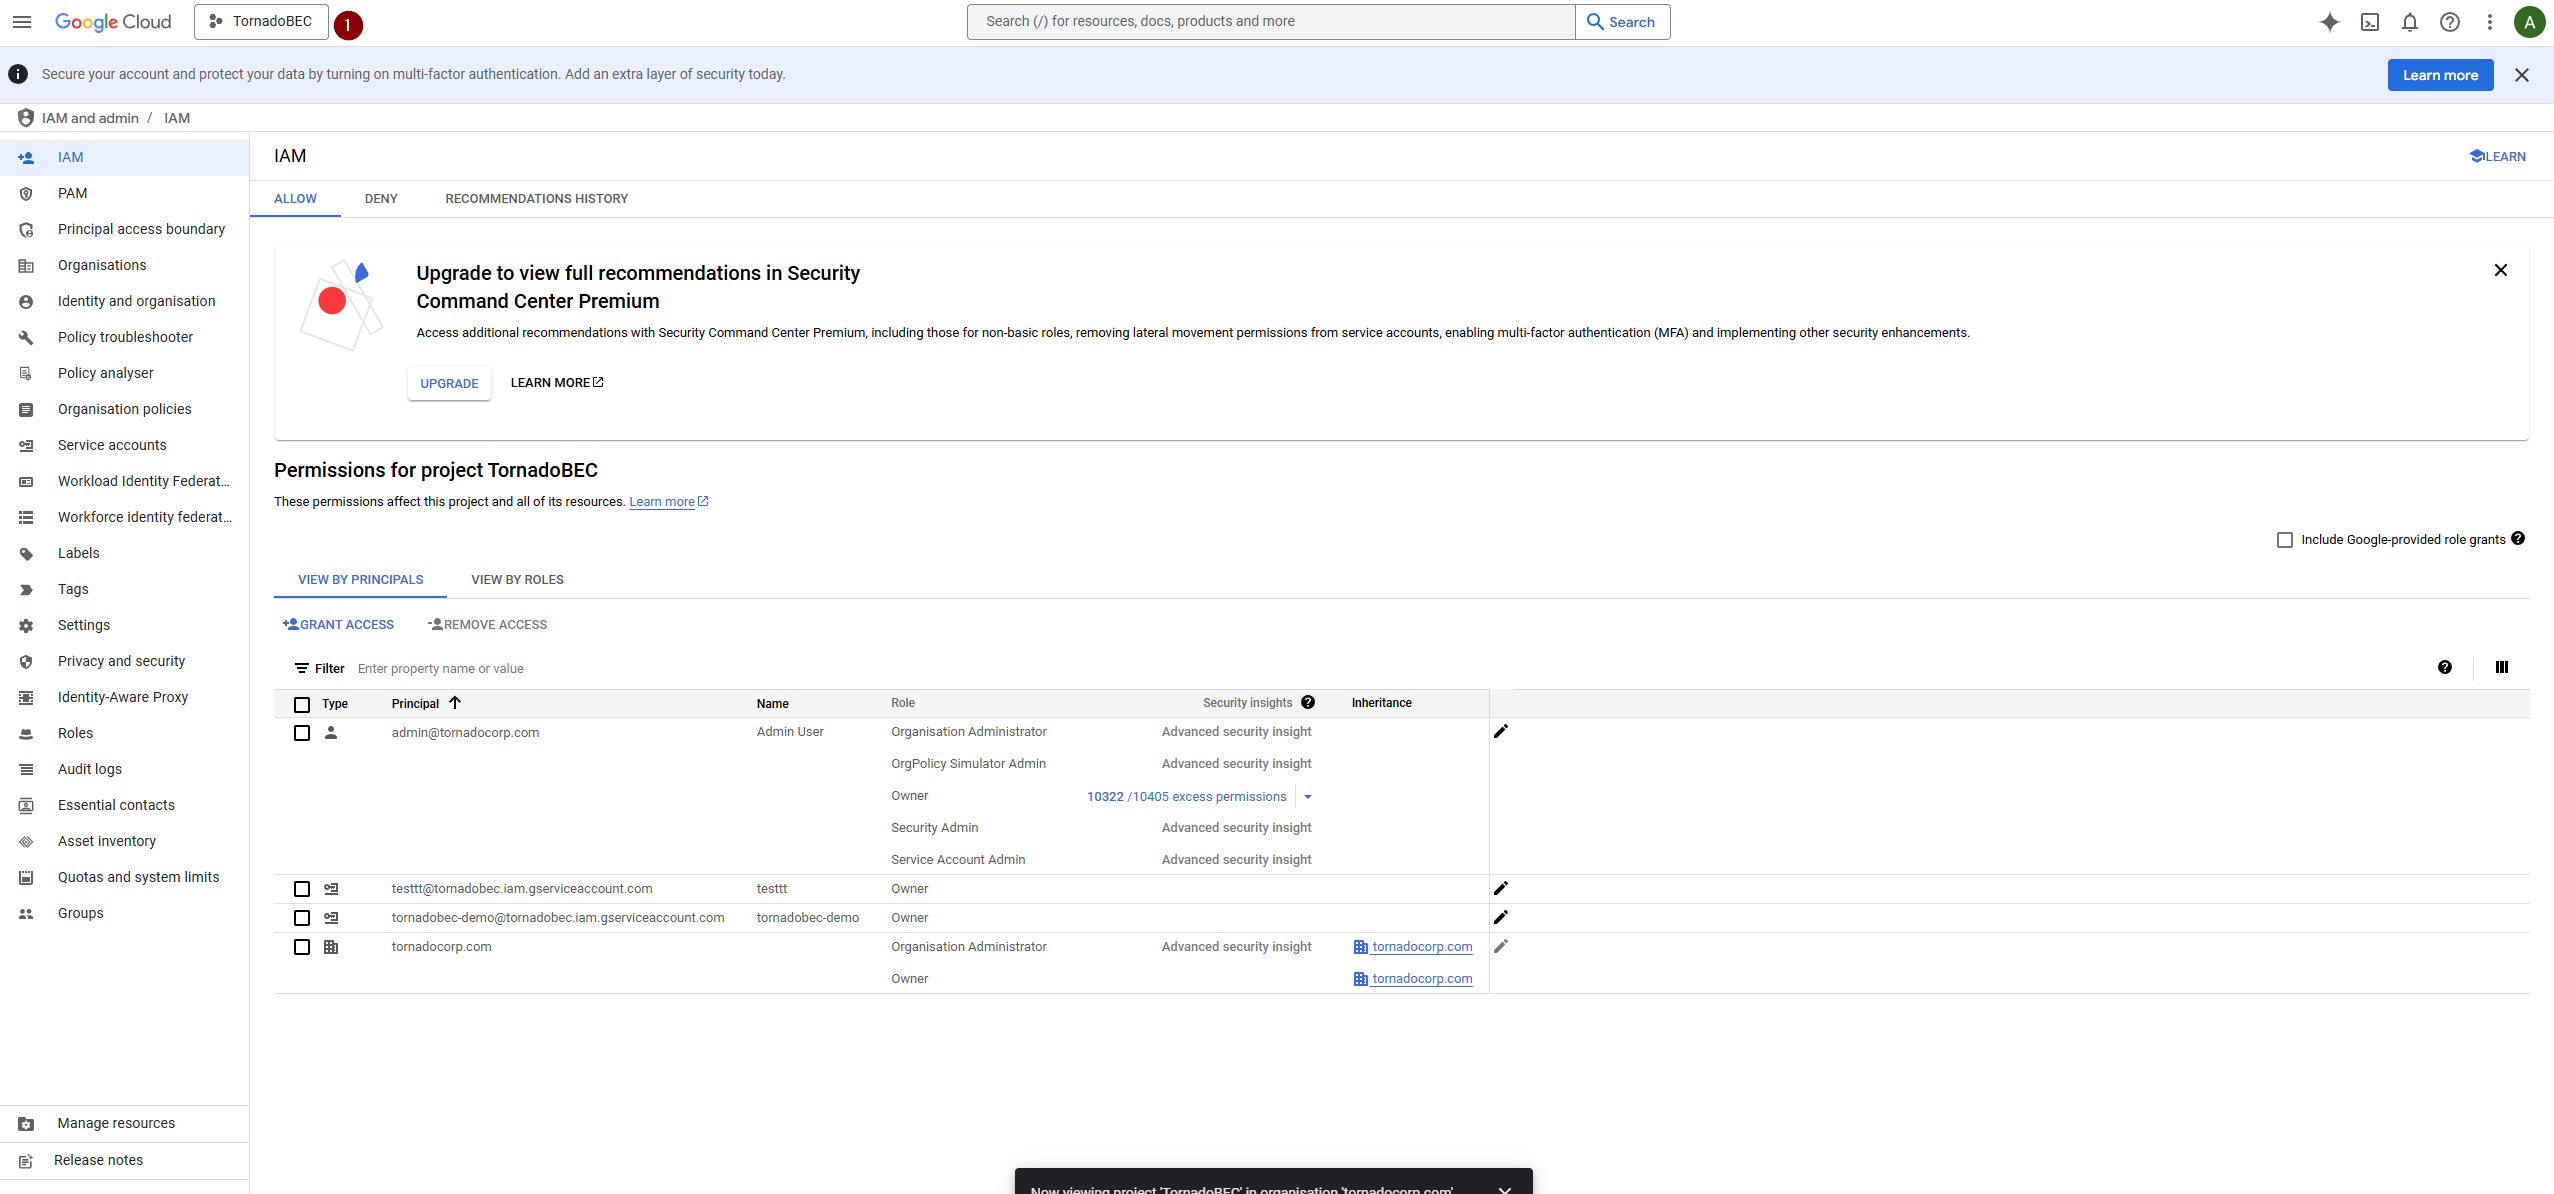
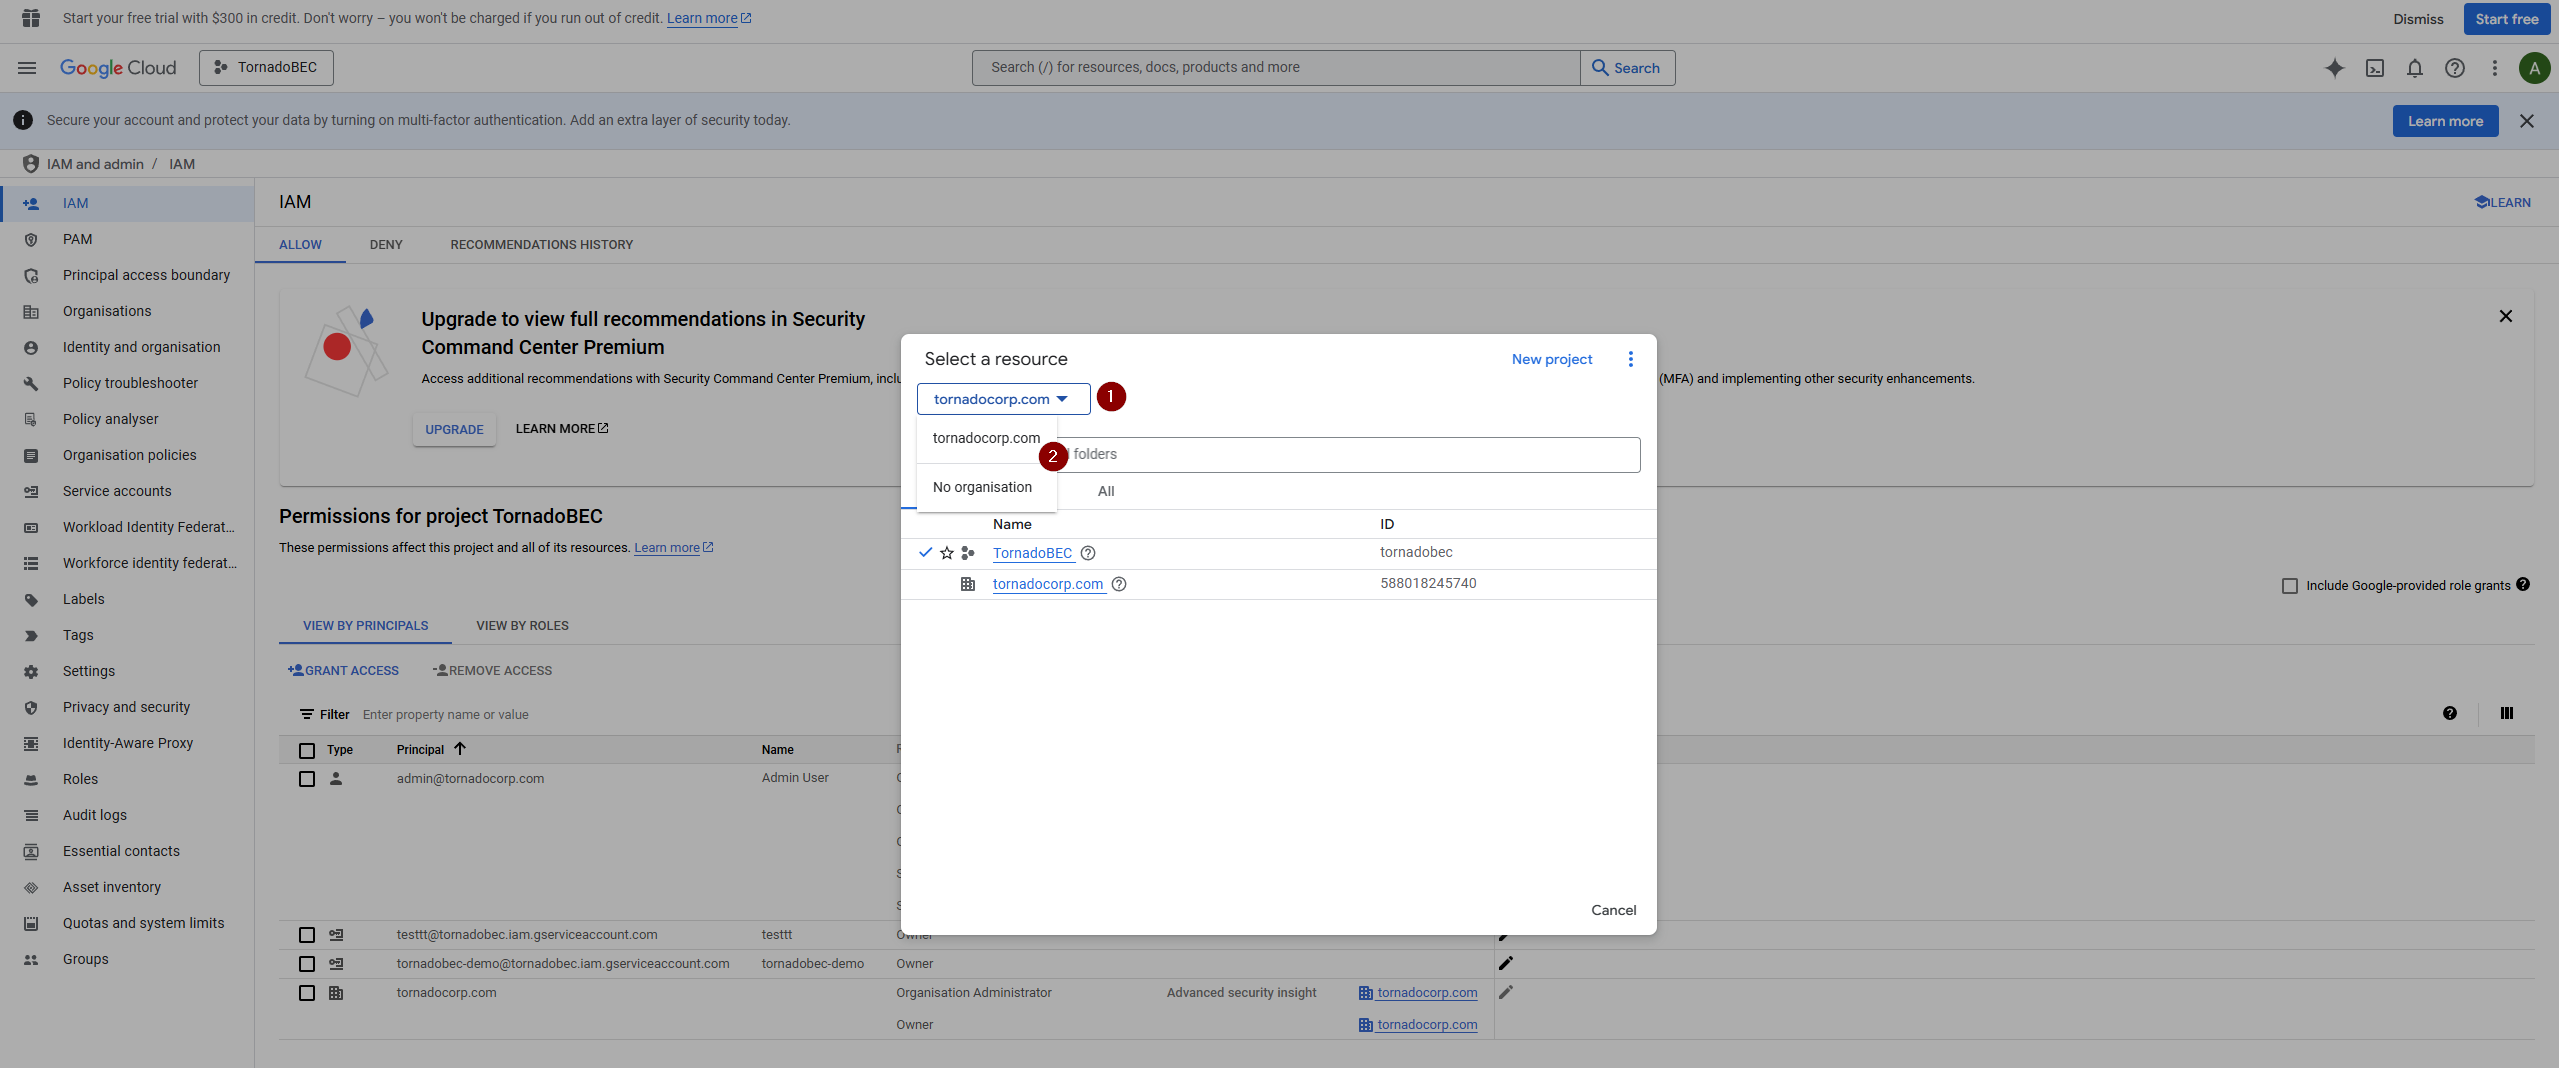
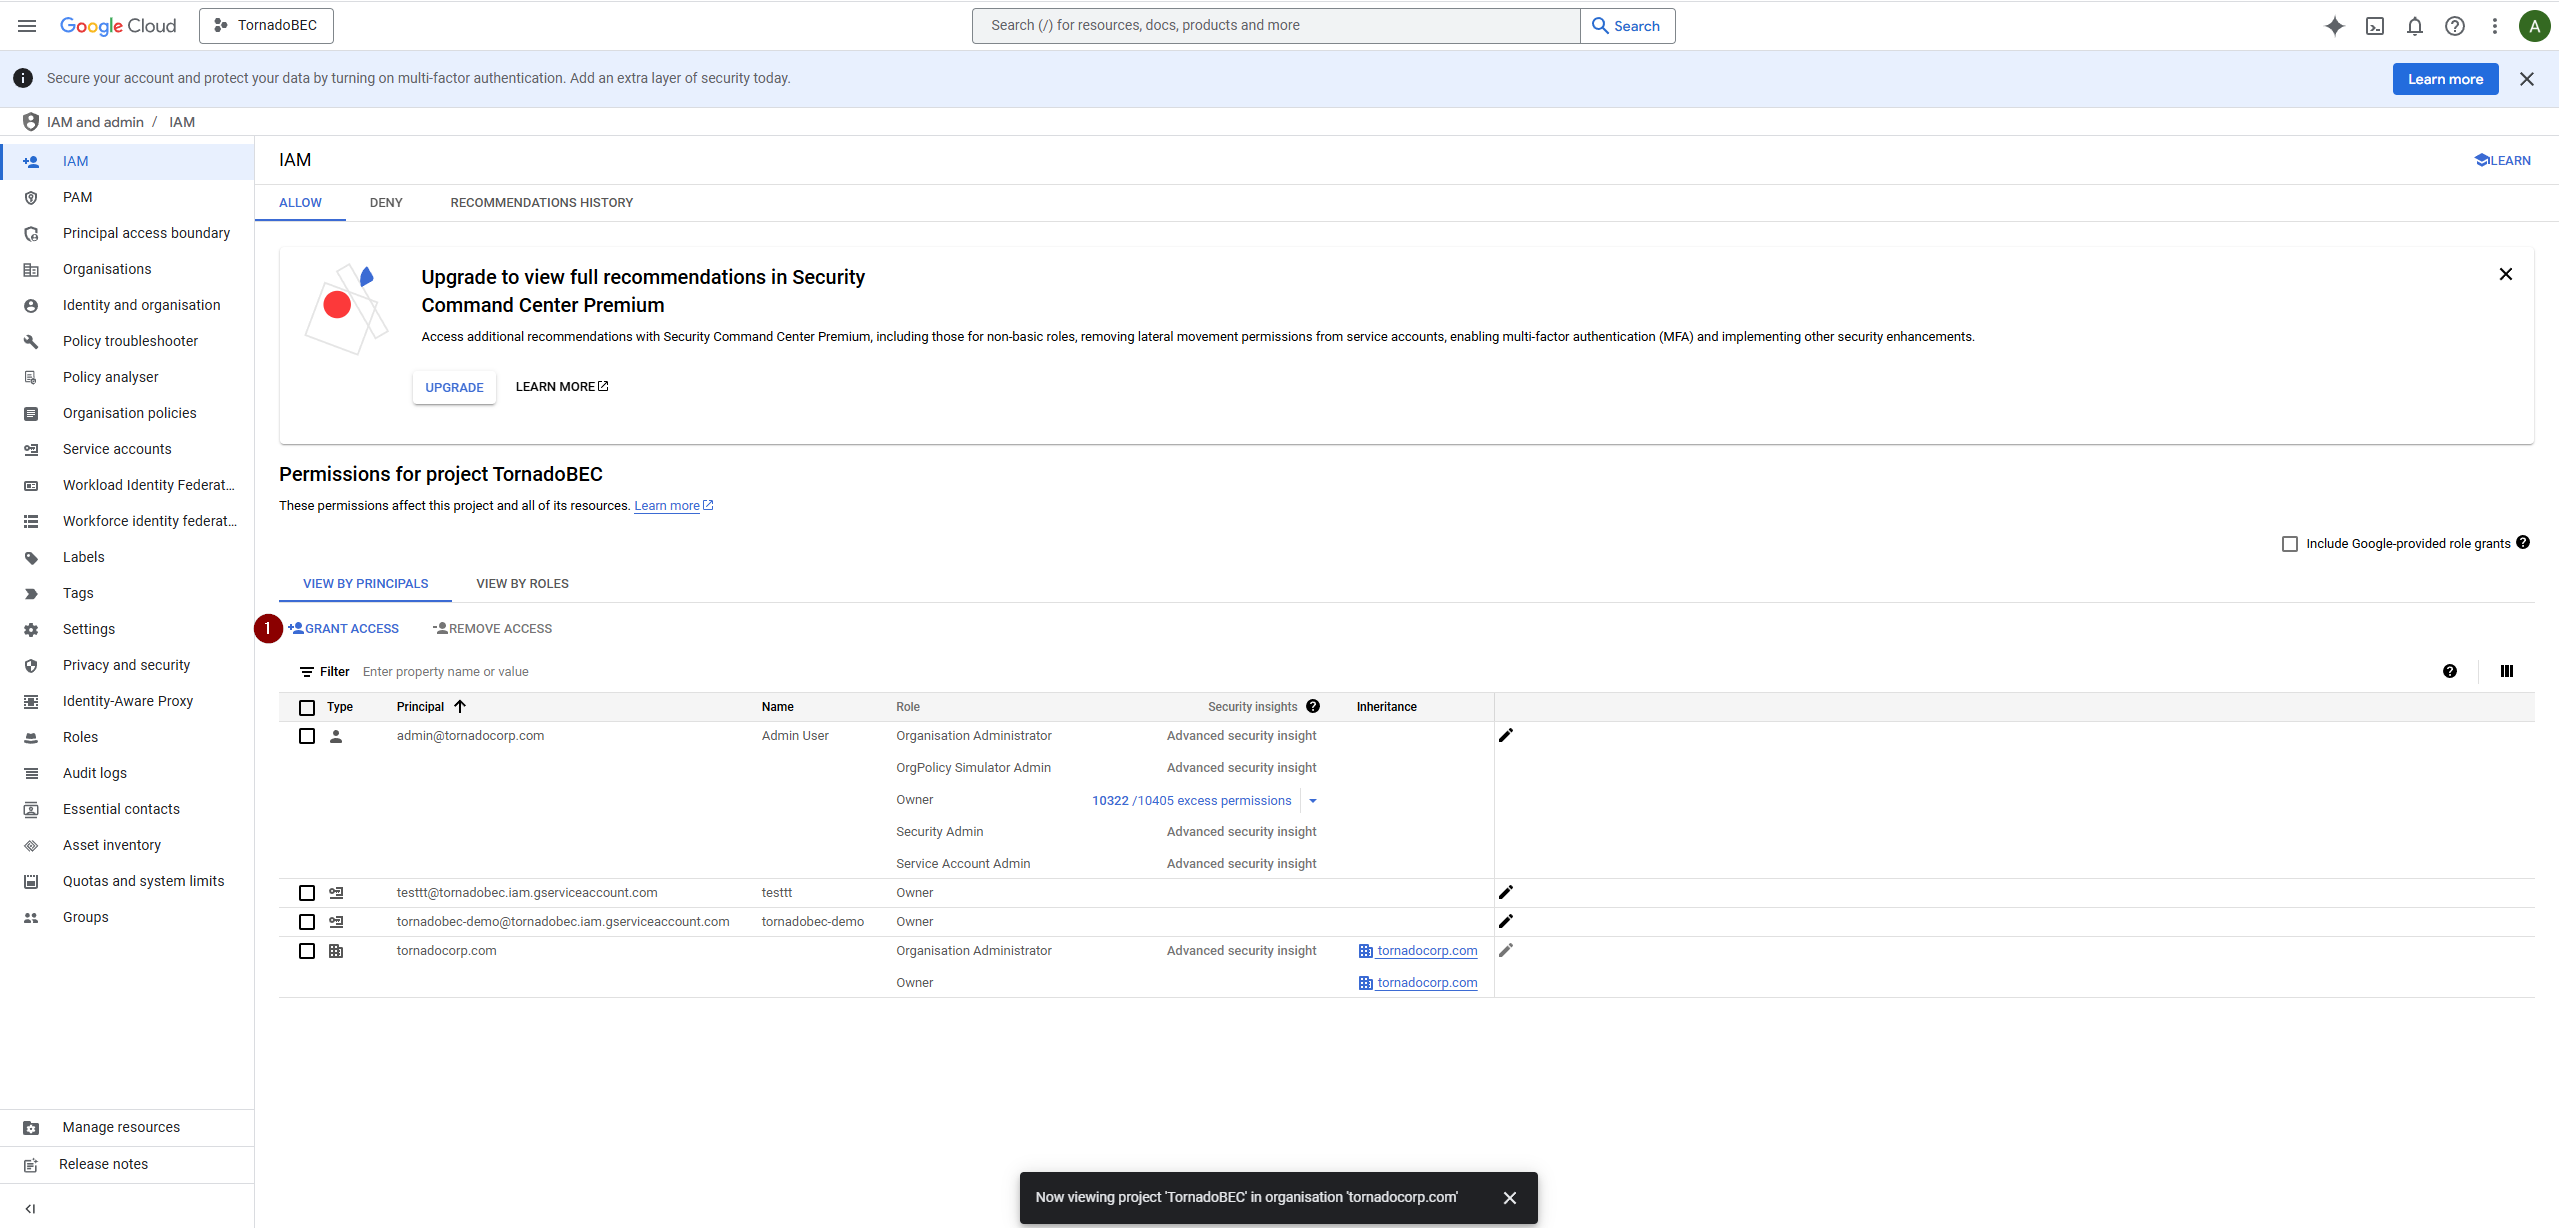
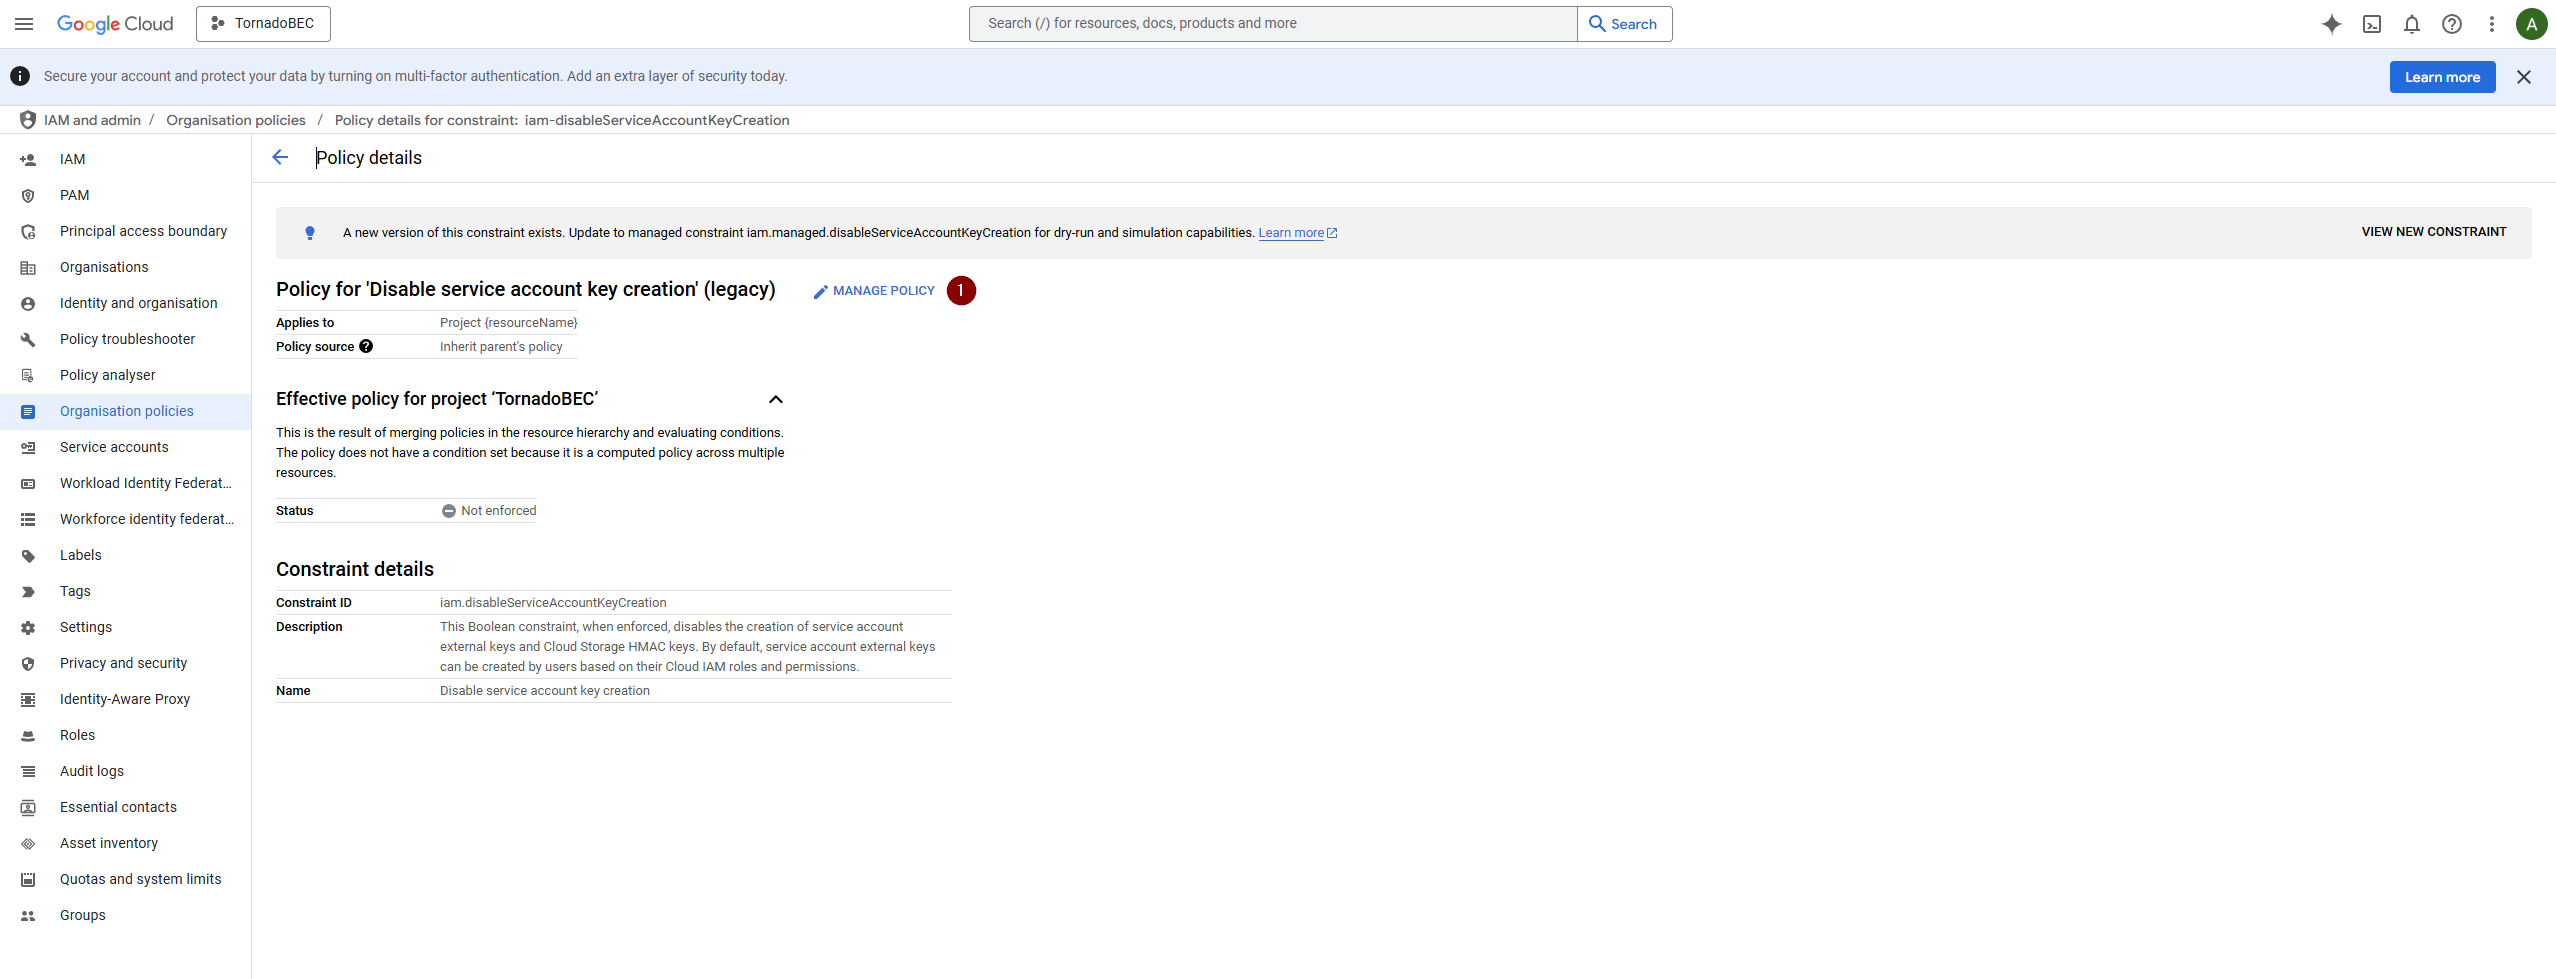
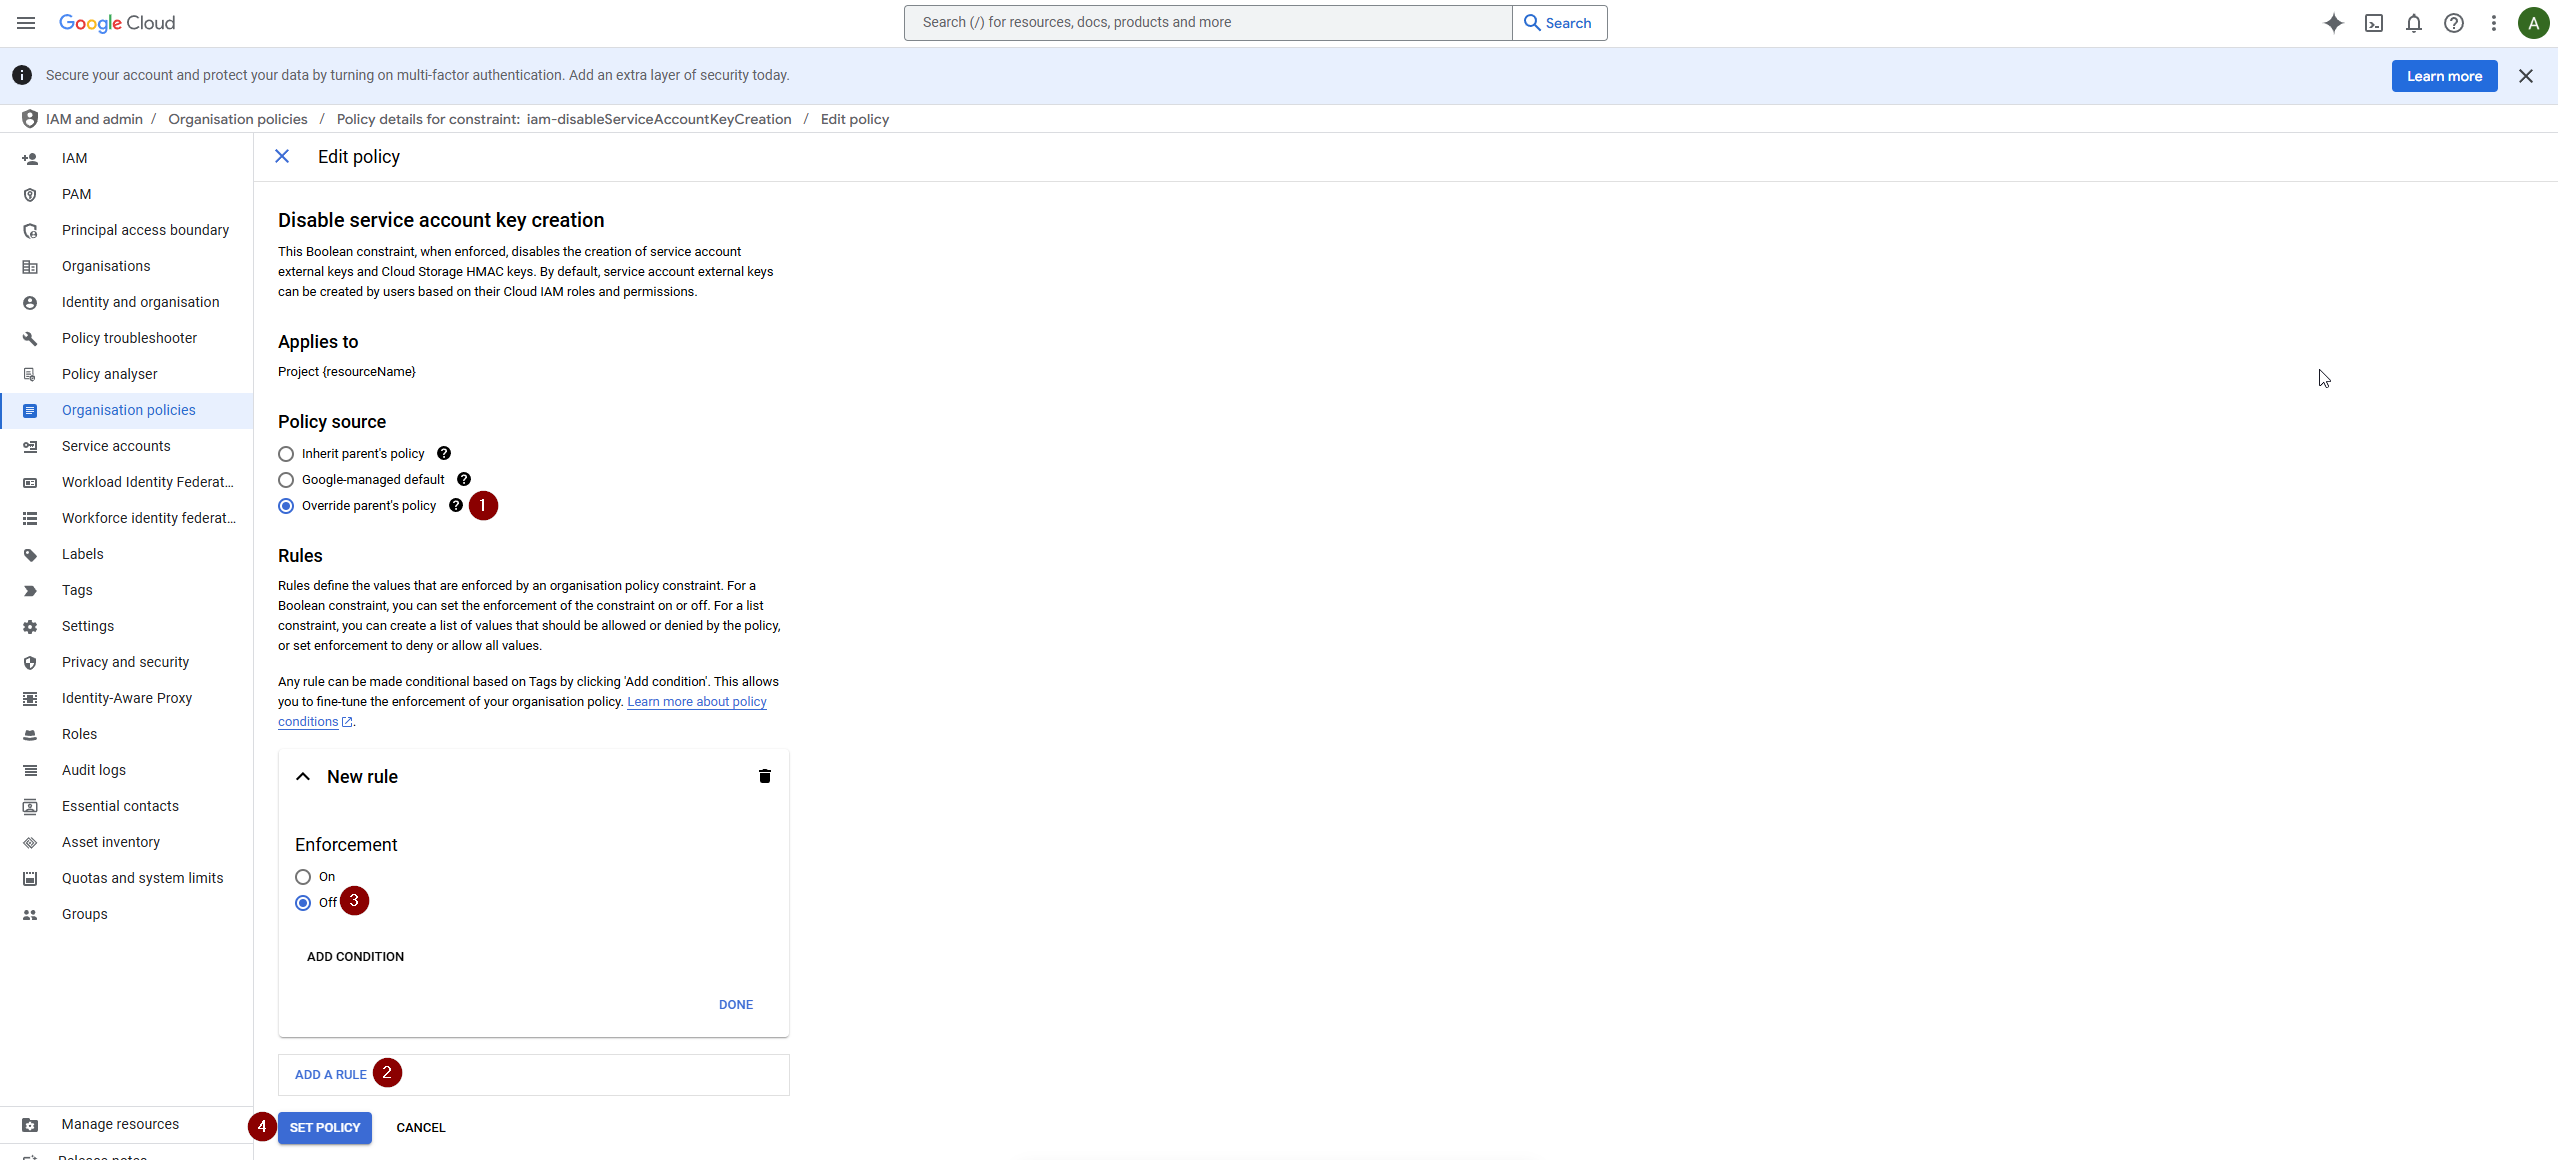
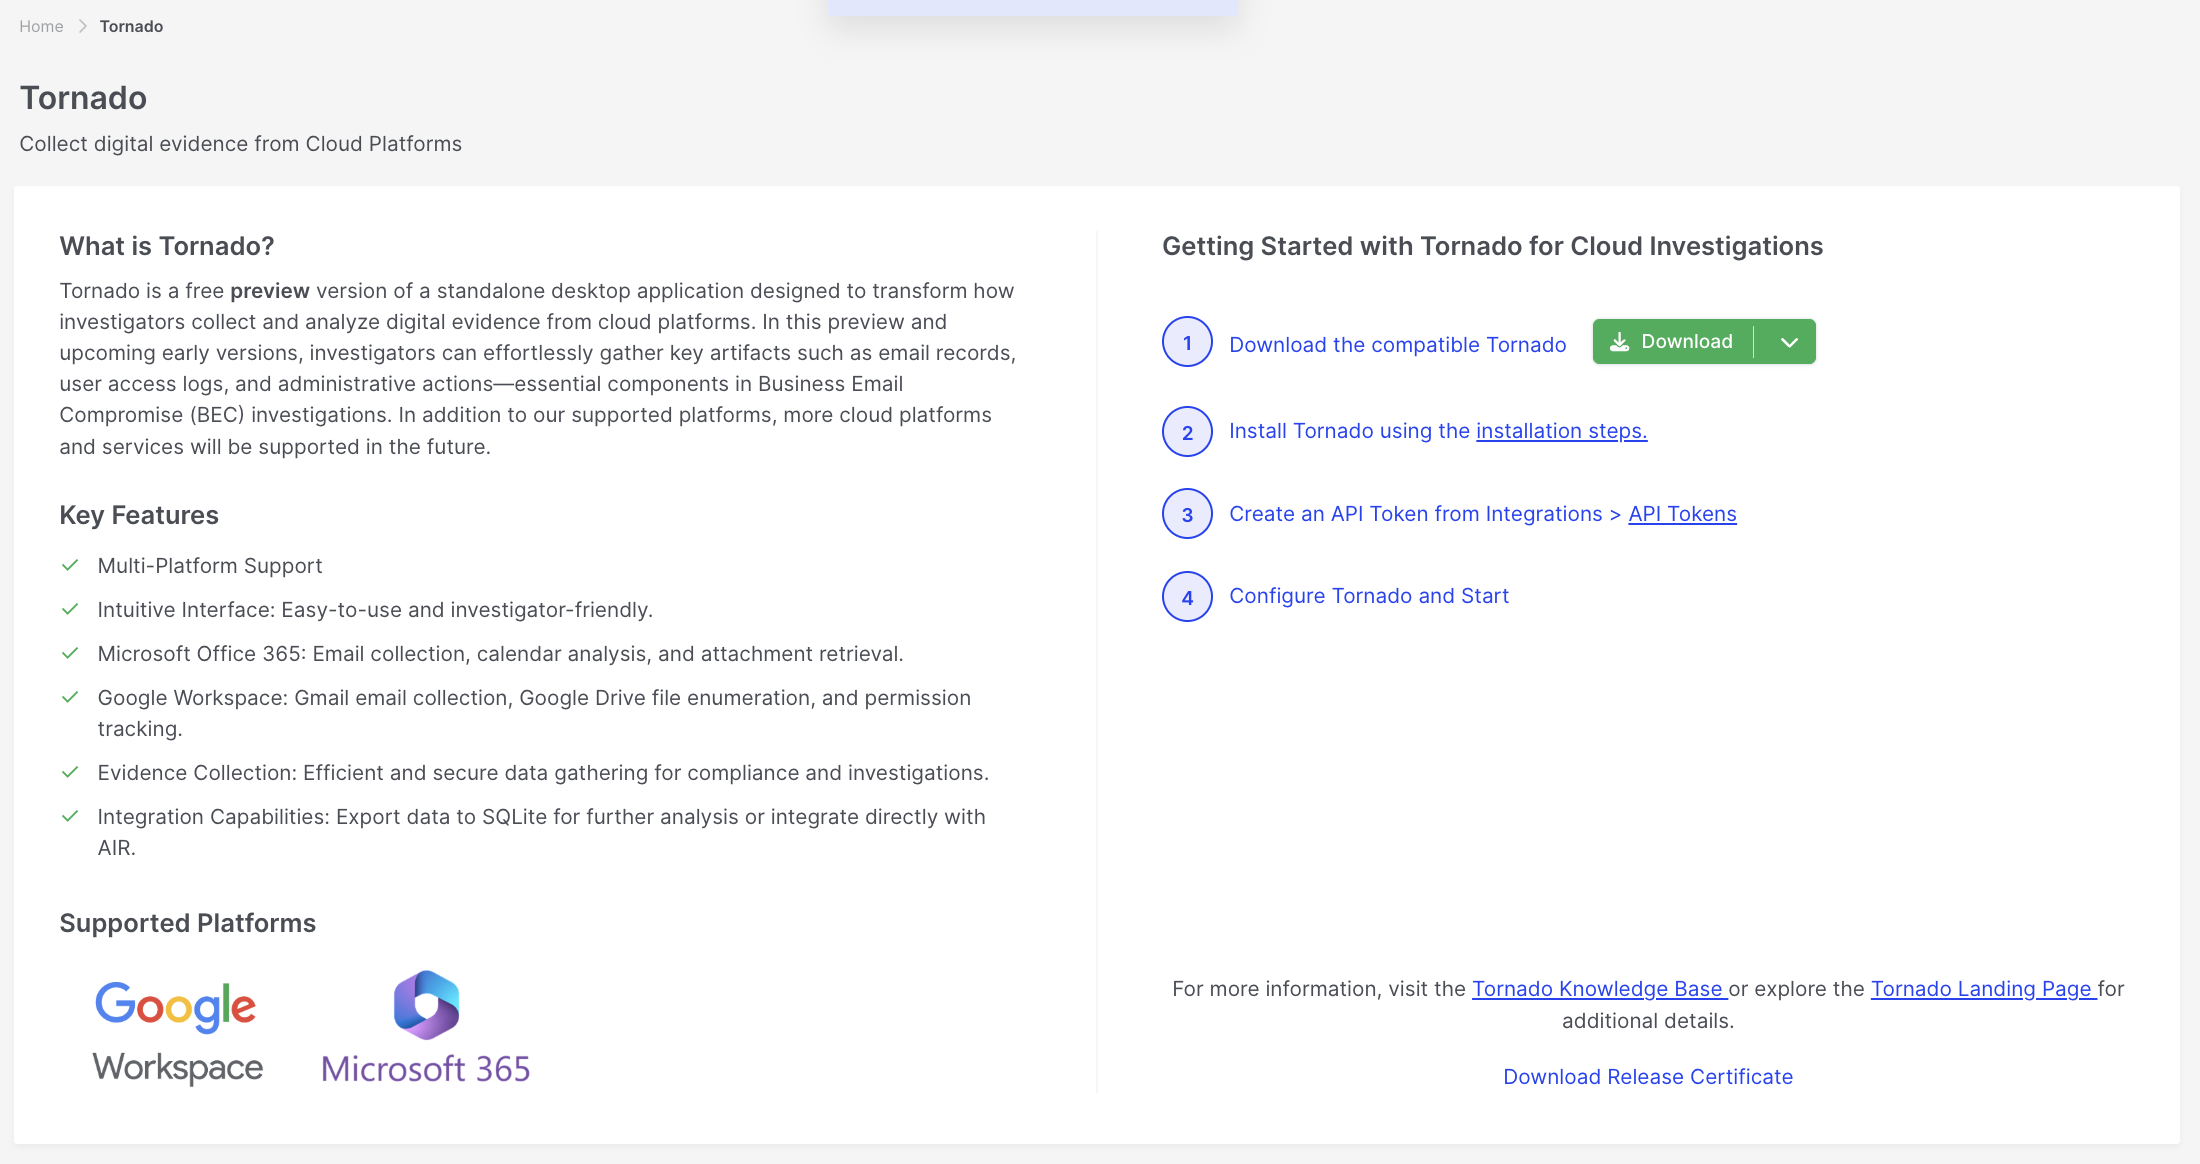
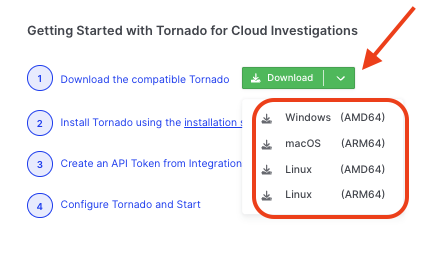
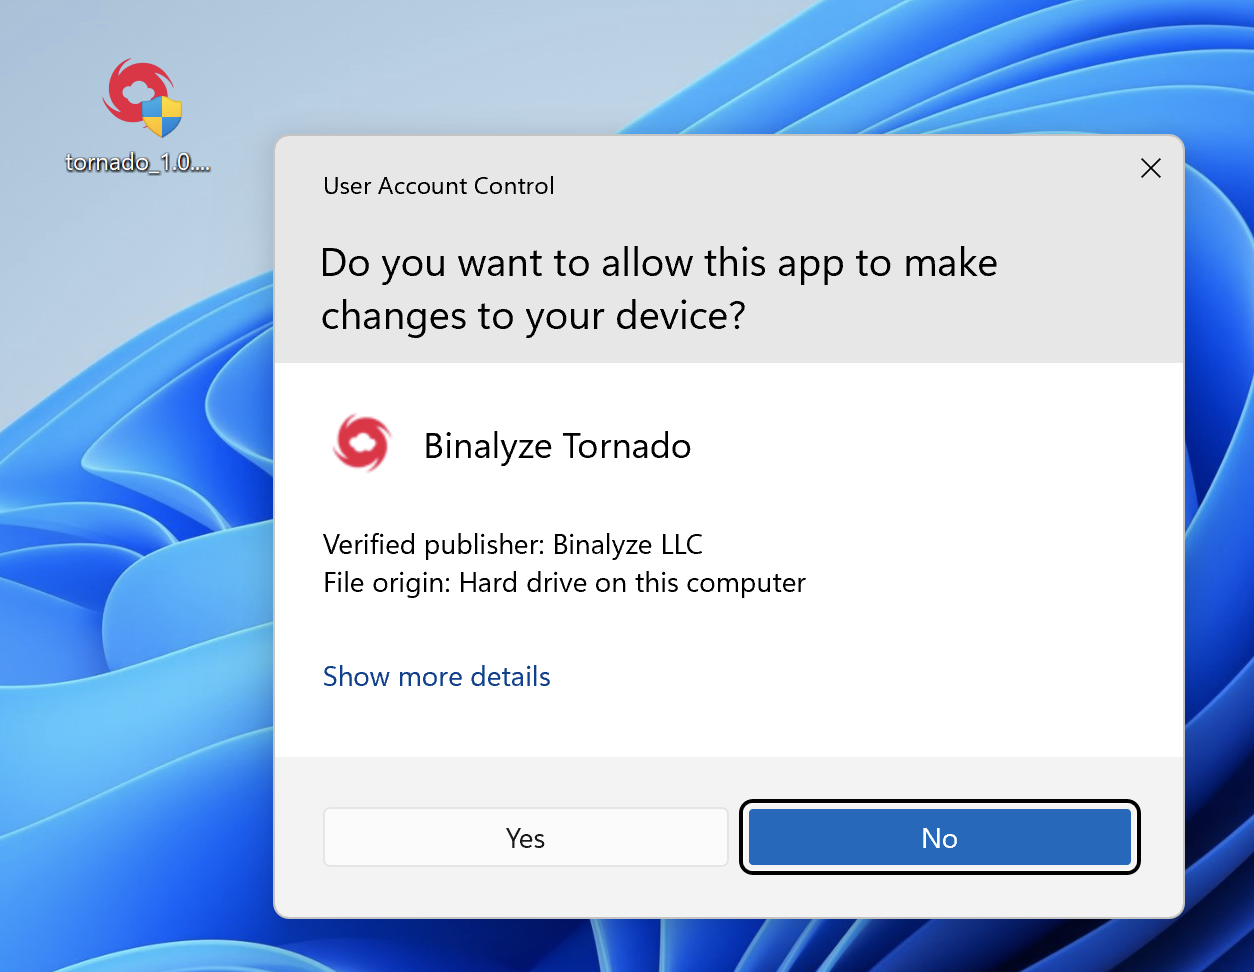
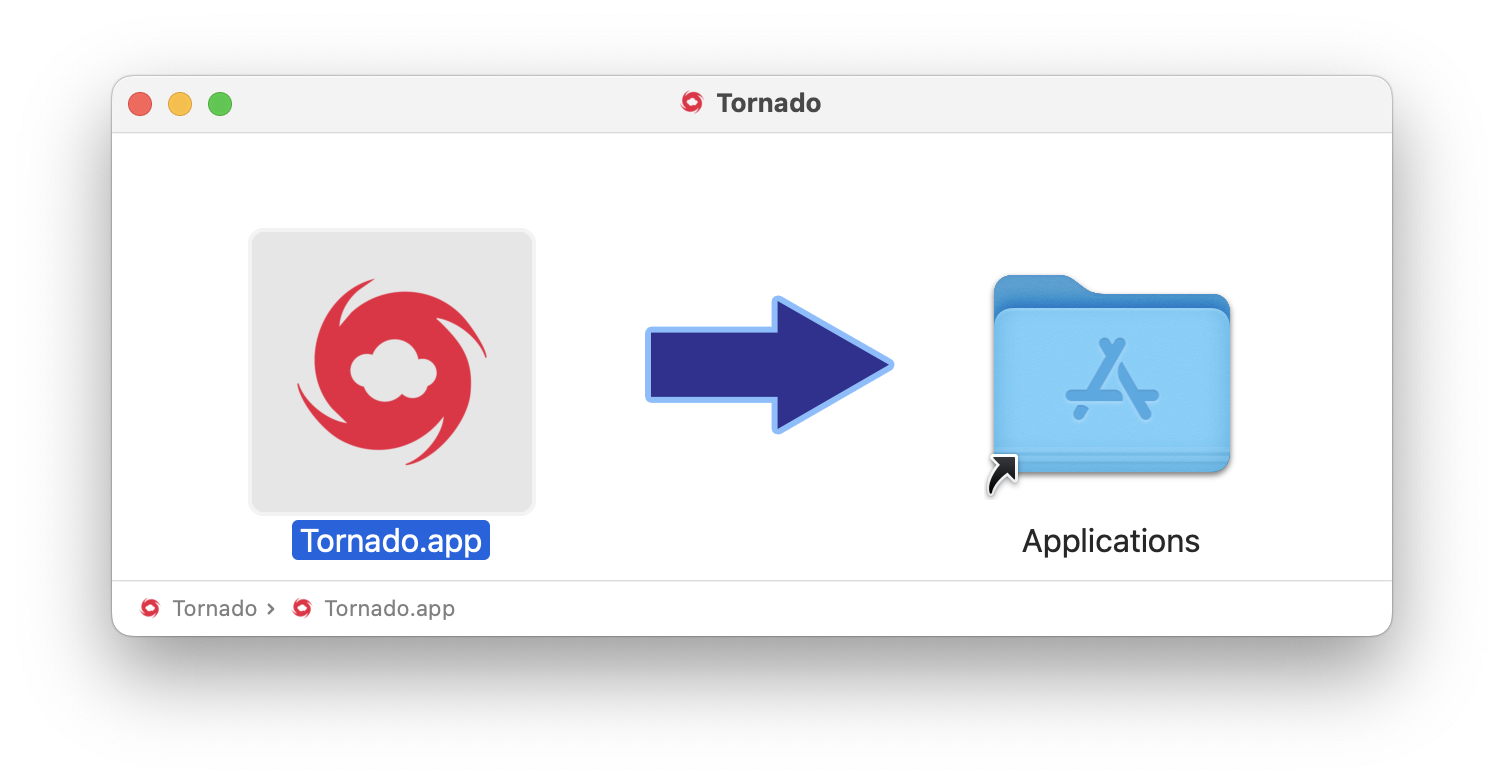
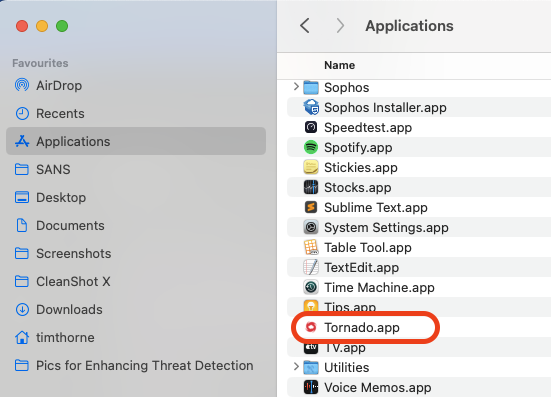
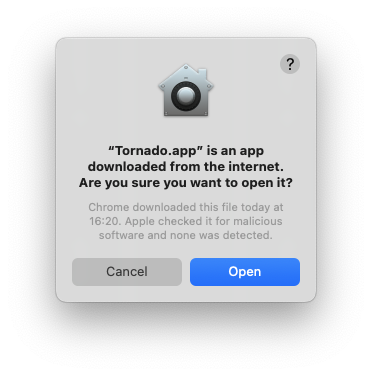
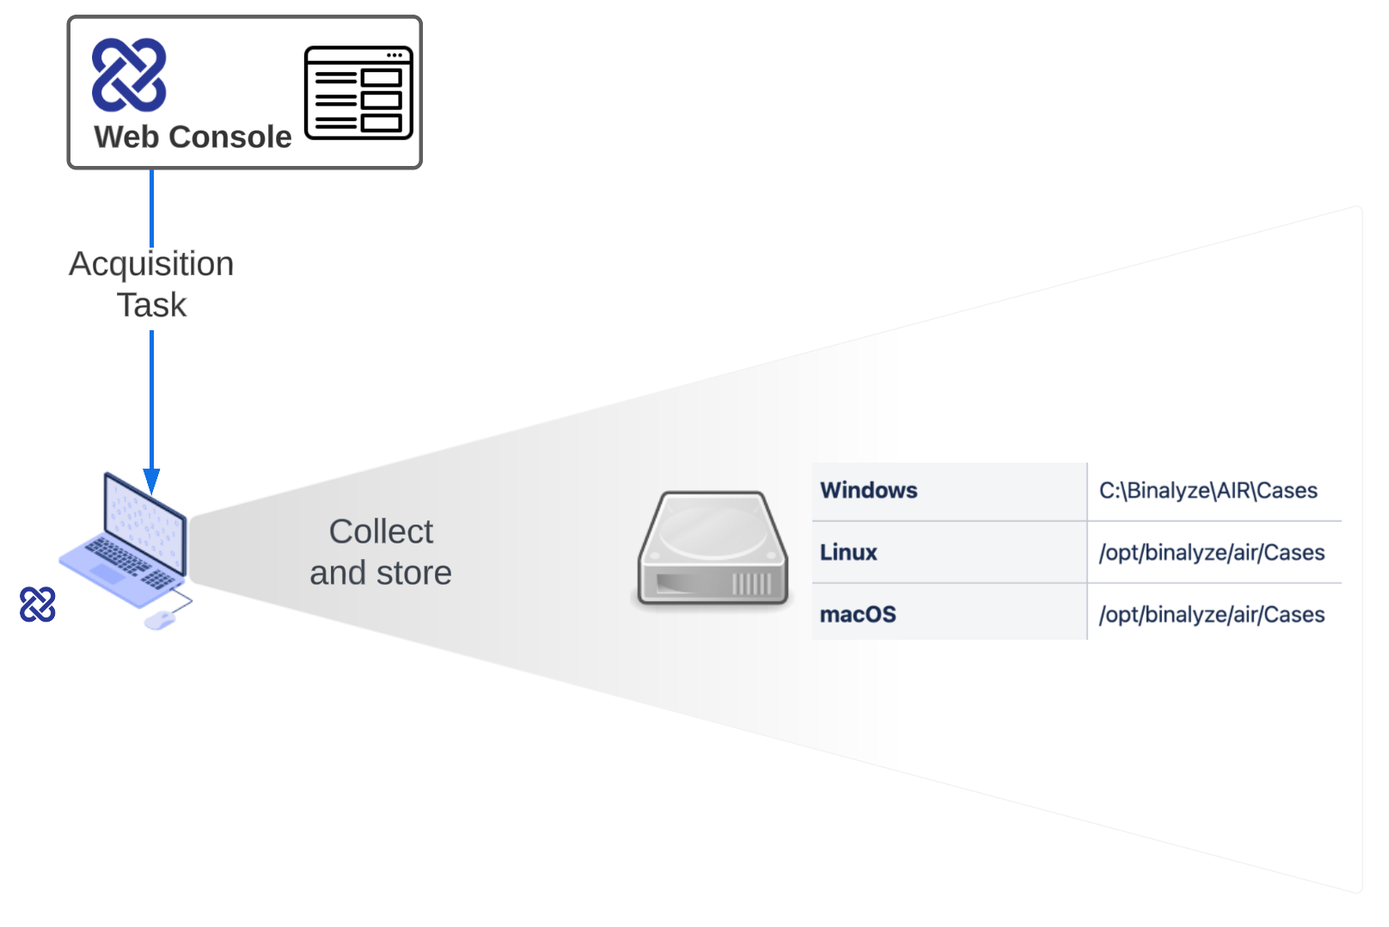
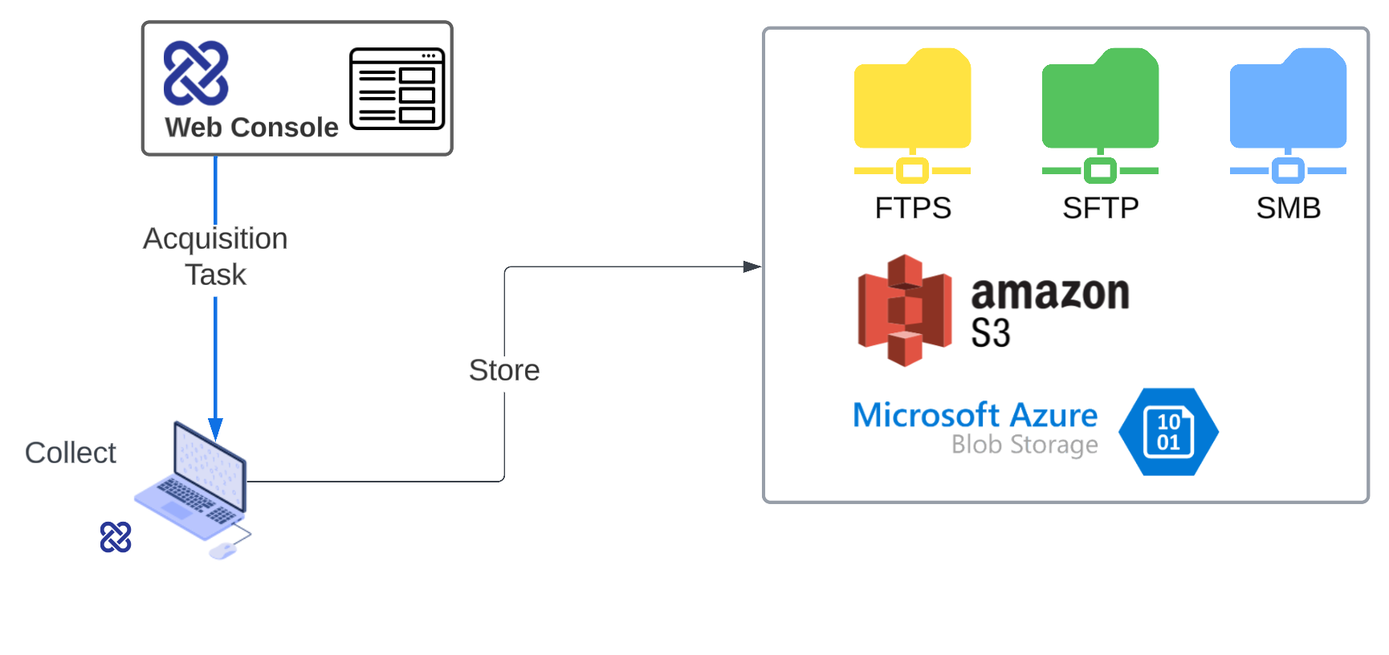

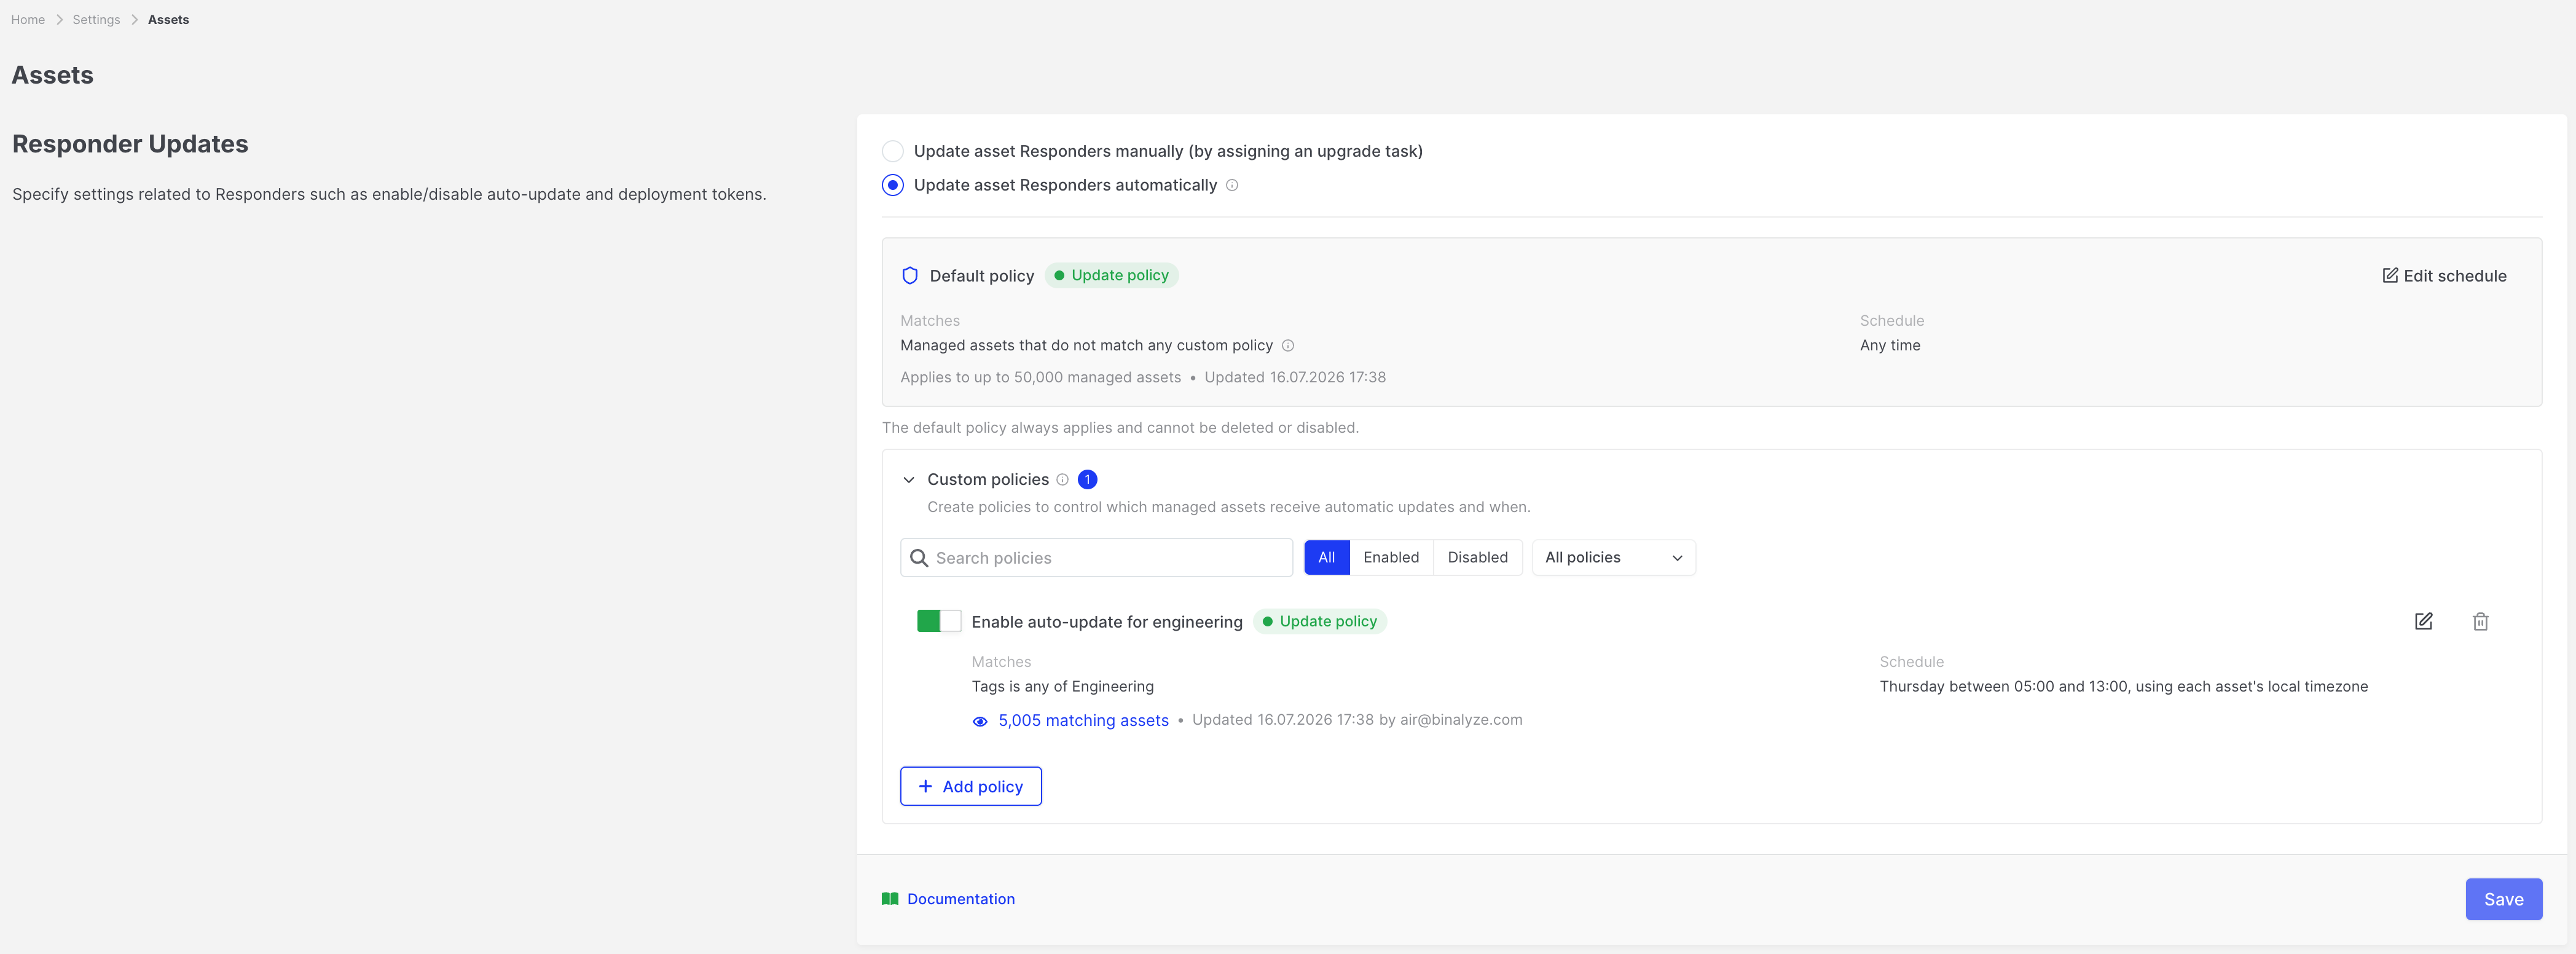 ## Manual Responder updates
Use Manual Updates (or assign a task even when Automatic Updates are on) when you want to update specific assets yourself.
### Before you start
- You need permission to assign Responder version update tasks.
- Only assets that **require** a Responder update can be selected in the update drawer.
- If an asset is **manually excluded from updates**, include it in updates again before you expect an assigned update task to run on that asset.
### Update a single asset
The fastest path for one asset is **Update now** on the **Version update** card:
1. Open the asset detail page.
2. Expand **Version update**.
3. Choose **Update now** (shown when a manual update is allowed).
4. Confirm if AIR warns that running tasks would be stopped.
To schedule the update, or to use the full task drawer:
1. Open the asset detail page.
2. Choose **Update Responder Version** (from the update actions, or from **Responder Update Status → Assign an update task manually**).
3. The **Update Responder Version** drawer opens.
4. On **Setup**:
- Optionally enter a **task name** (leave empty to auto-generate).
- Choose **Now** or **Schedule for later**.
- If scheduling, choose the timezone (asset timezone or a selected timezone) and the **start time**.
5. Start / confirm the task.
## Manual Responder updates
Use Manual Updates (or assign a task even when Automatic Updates are on) when you want to update specific assets yourself.
### Before you start
- You need permission to assign Responder version update tasks.
- Only assets that **require** a Responder update can be selected in the update drawer.
- If an asset is **manually excluded from updates**, include it in updates again before you expect an assigned update task to run on that asset.
### Update a single asset
The fastest path for one asset is **Update now** on the **Version update** card:
1. Open the asset detail page.
2. Expand **Version update**.
3. Choose **Update now** (shown when a manual update is allowed).
4. Confirm if AIR warns that running tasks would be stopped.
To schedule the update, or to use the full task drawer:
1. Open the asset detail page.
2. Choose **Update Responder Version** (from the update actions, or from **Responder Update Status → Assign an update task manually**).
3. The **Update Responder Version** drawer opens.
4. On **Setup**:
- Optionally enter a **task name** (leave empty to auto-generate).
- Choose **Now** or **Schedule for later**.
- If scheduling, choose the timezone (asset timezone or a selected timezone) and the **start time**.
5. Start / confirm the task.
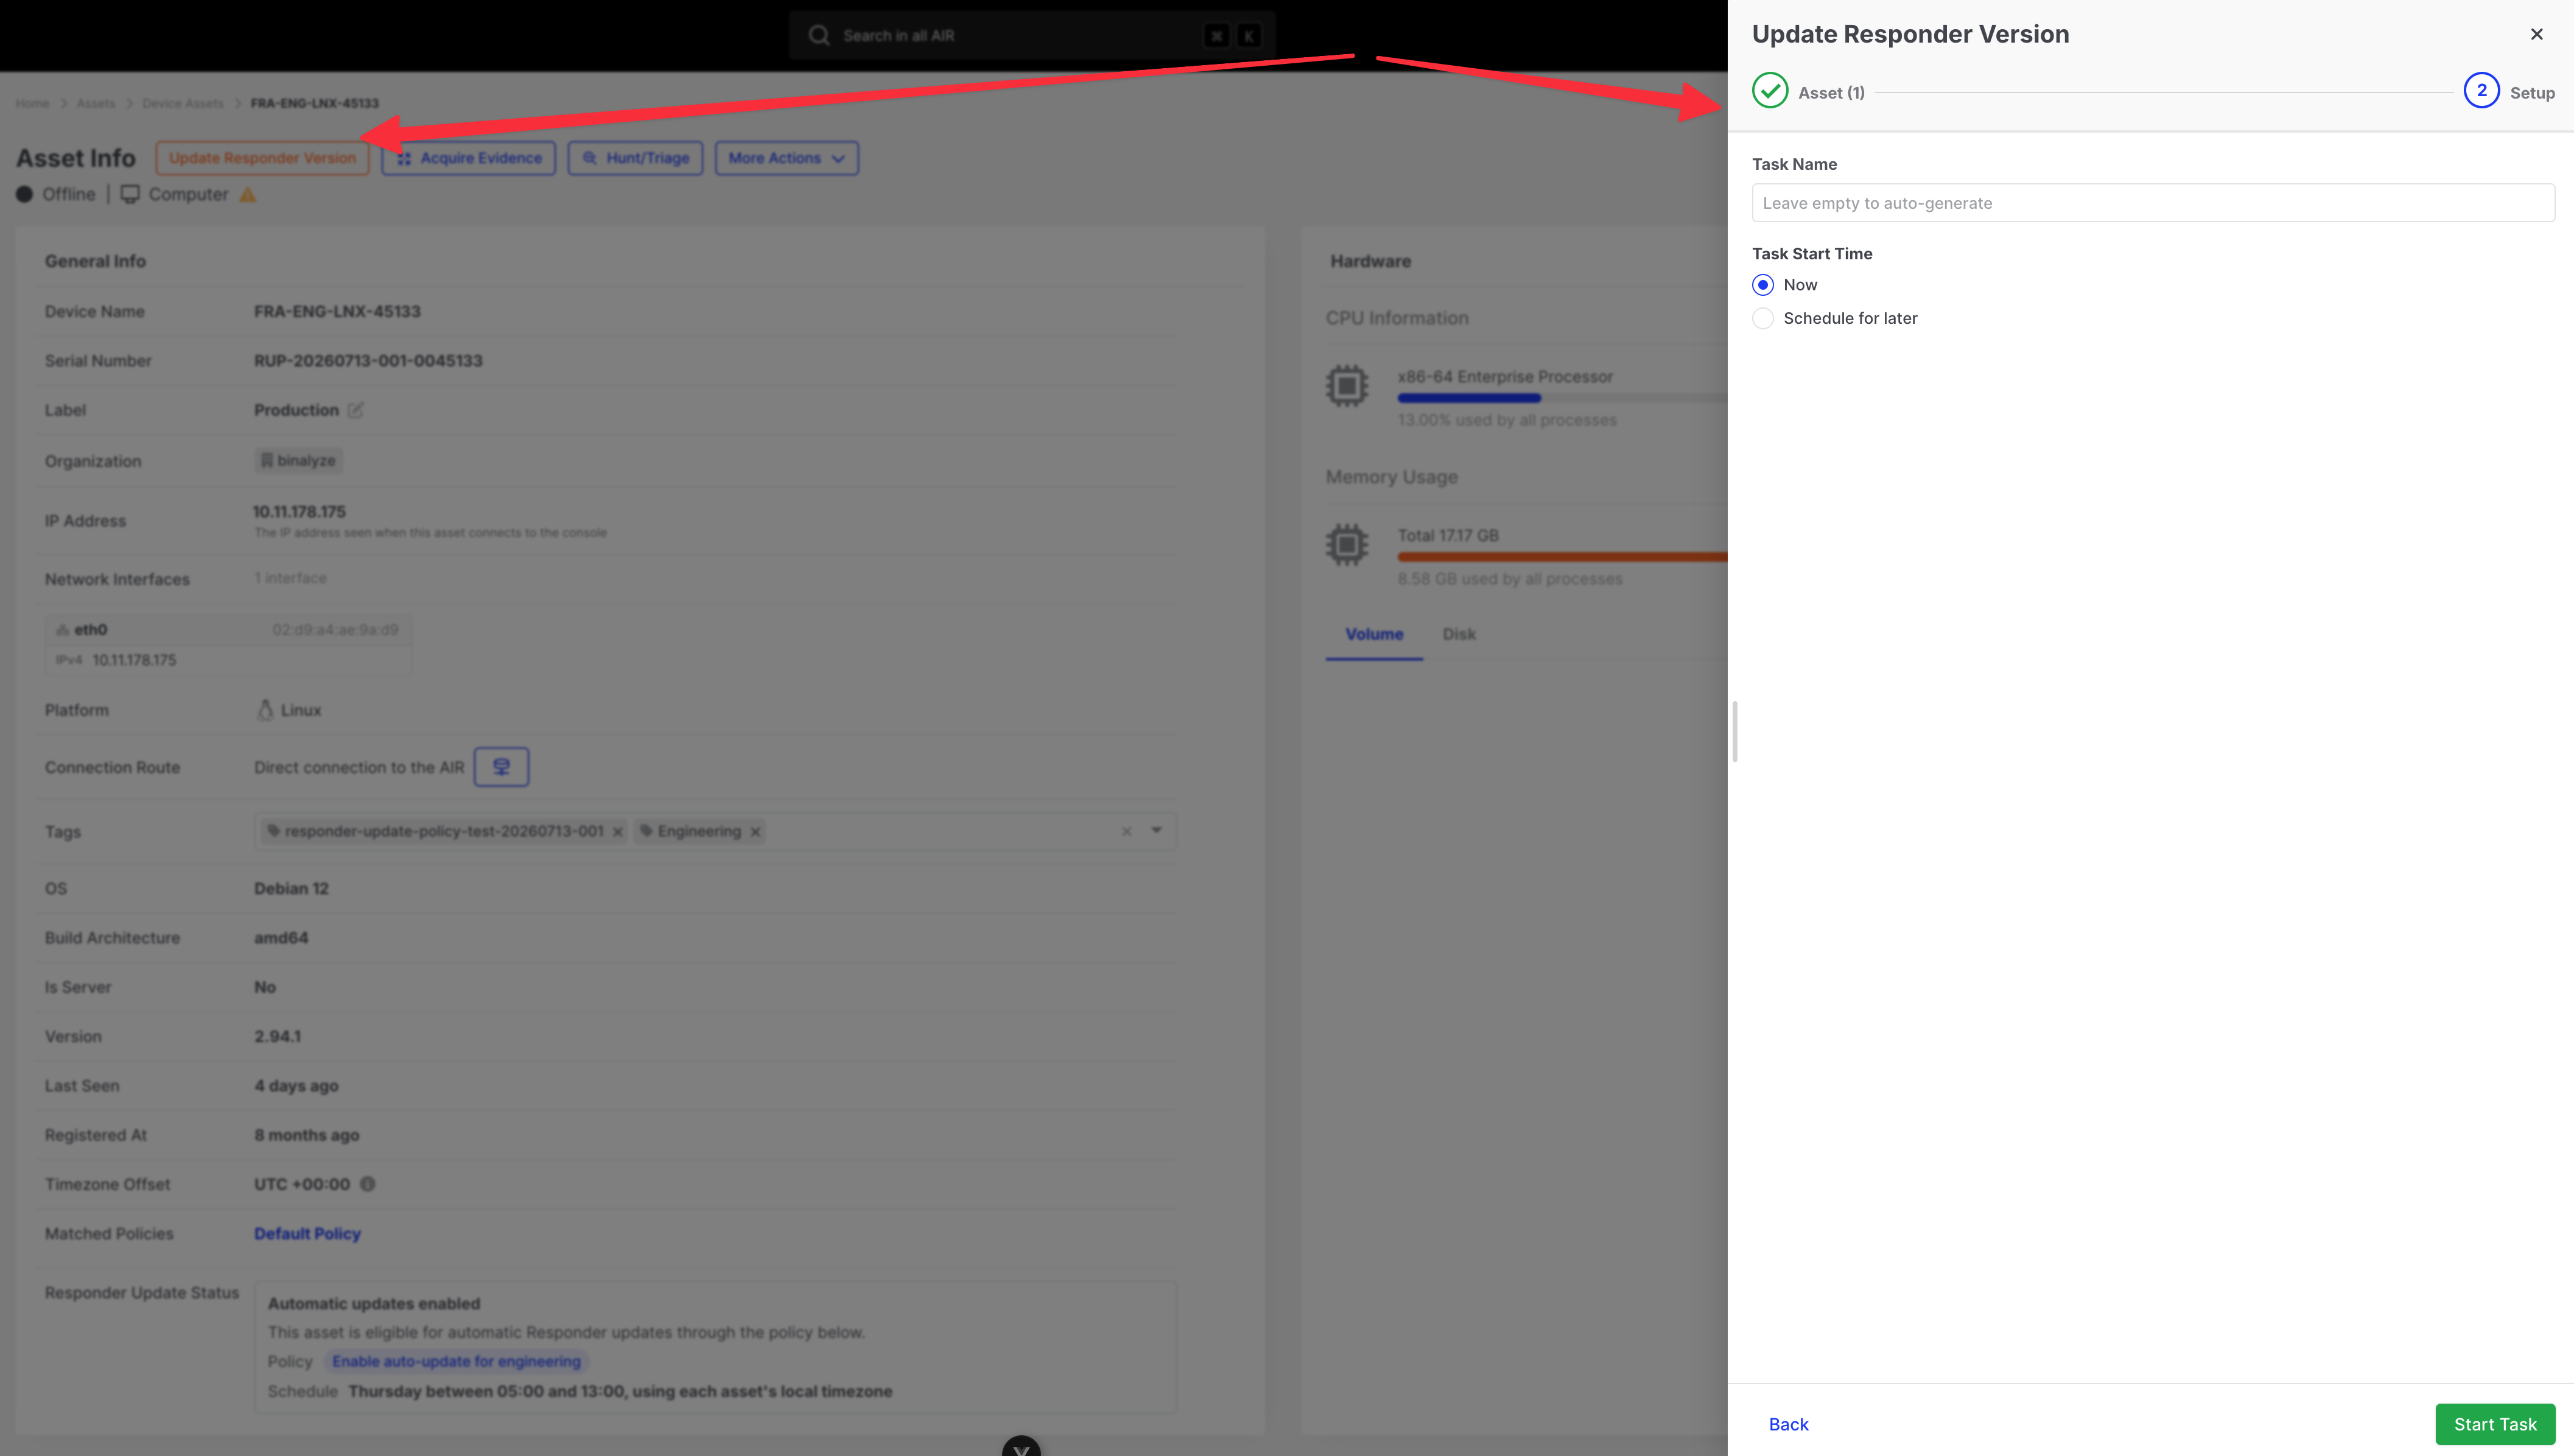 :::note
If an update is already scheduled for the asset, assigning a new scheduled update **replaces** the previous schedule.
:::
### Update multiple assets
1. In the assets list, select the assets (or use filters and bulk selection).
2. Open the bulk actions menu and choose **Update Responder Version**.
3. In the drawer, confirm the asset selection step if shown, then complete **Setup** (Now or Schedule for later) as above.
4. Confirm if prompted for a large selection.
You can also start **Update Responder Version** from group or tag actions where that action is available.
:::note
If an update is already scheduled for the asset, assigning a new scheduled update **replaces** the previous schedule.
:::
### Update multiple assets
1. In the assets list, select the assets (or use filters and bulk selection).
2. Open the bulk actions menu and choose **Update Responder Version**.
3. In the drawer, confirm the asset selection step if shown, then complete **Setup** (Now or Schedule for later) as above.
4. Confirm if prompted for a large selection.
You can also start **Update Responder Version** from group or tag actions where that action is available.
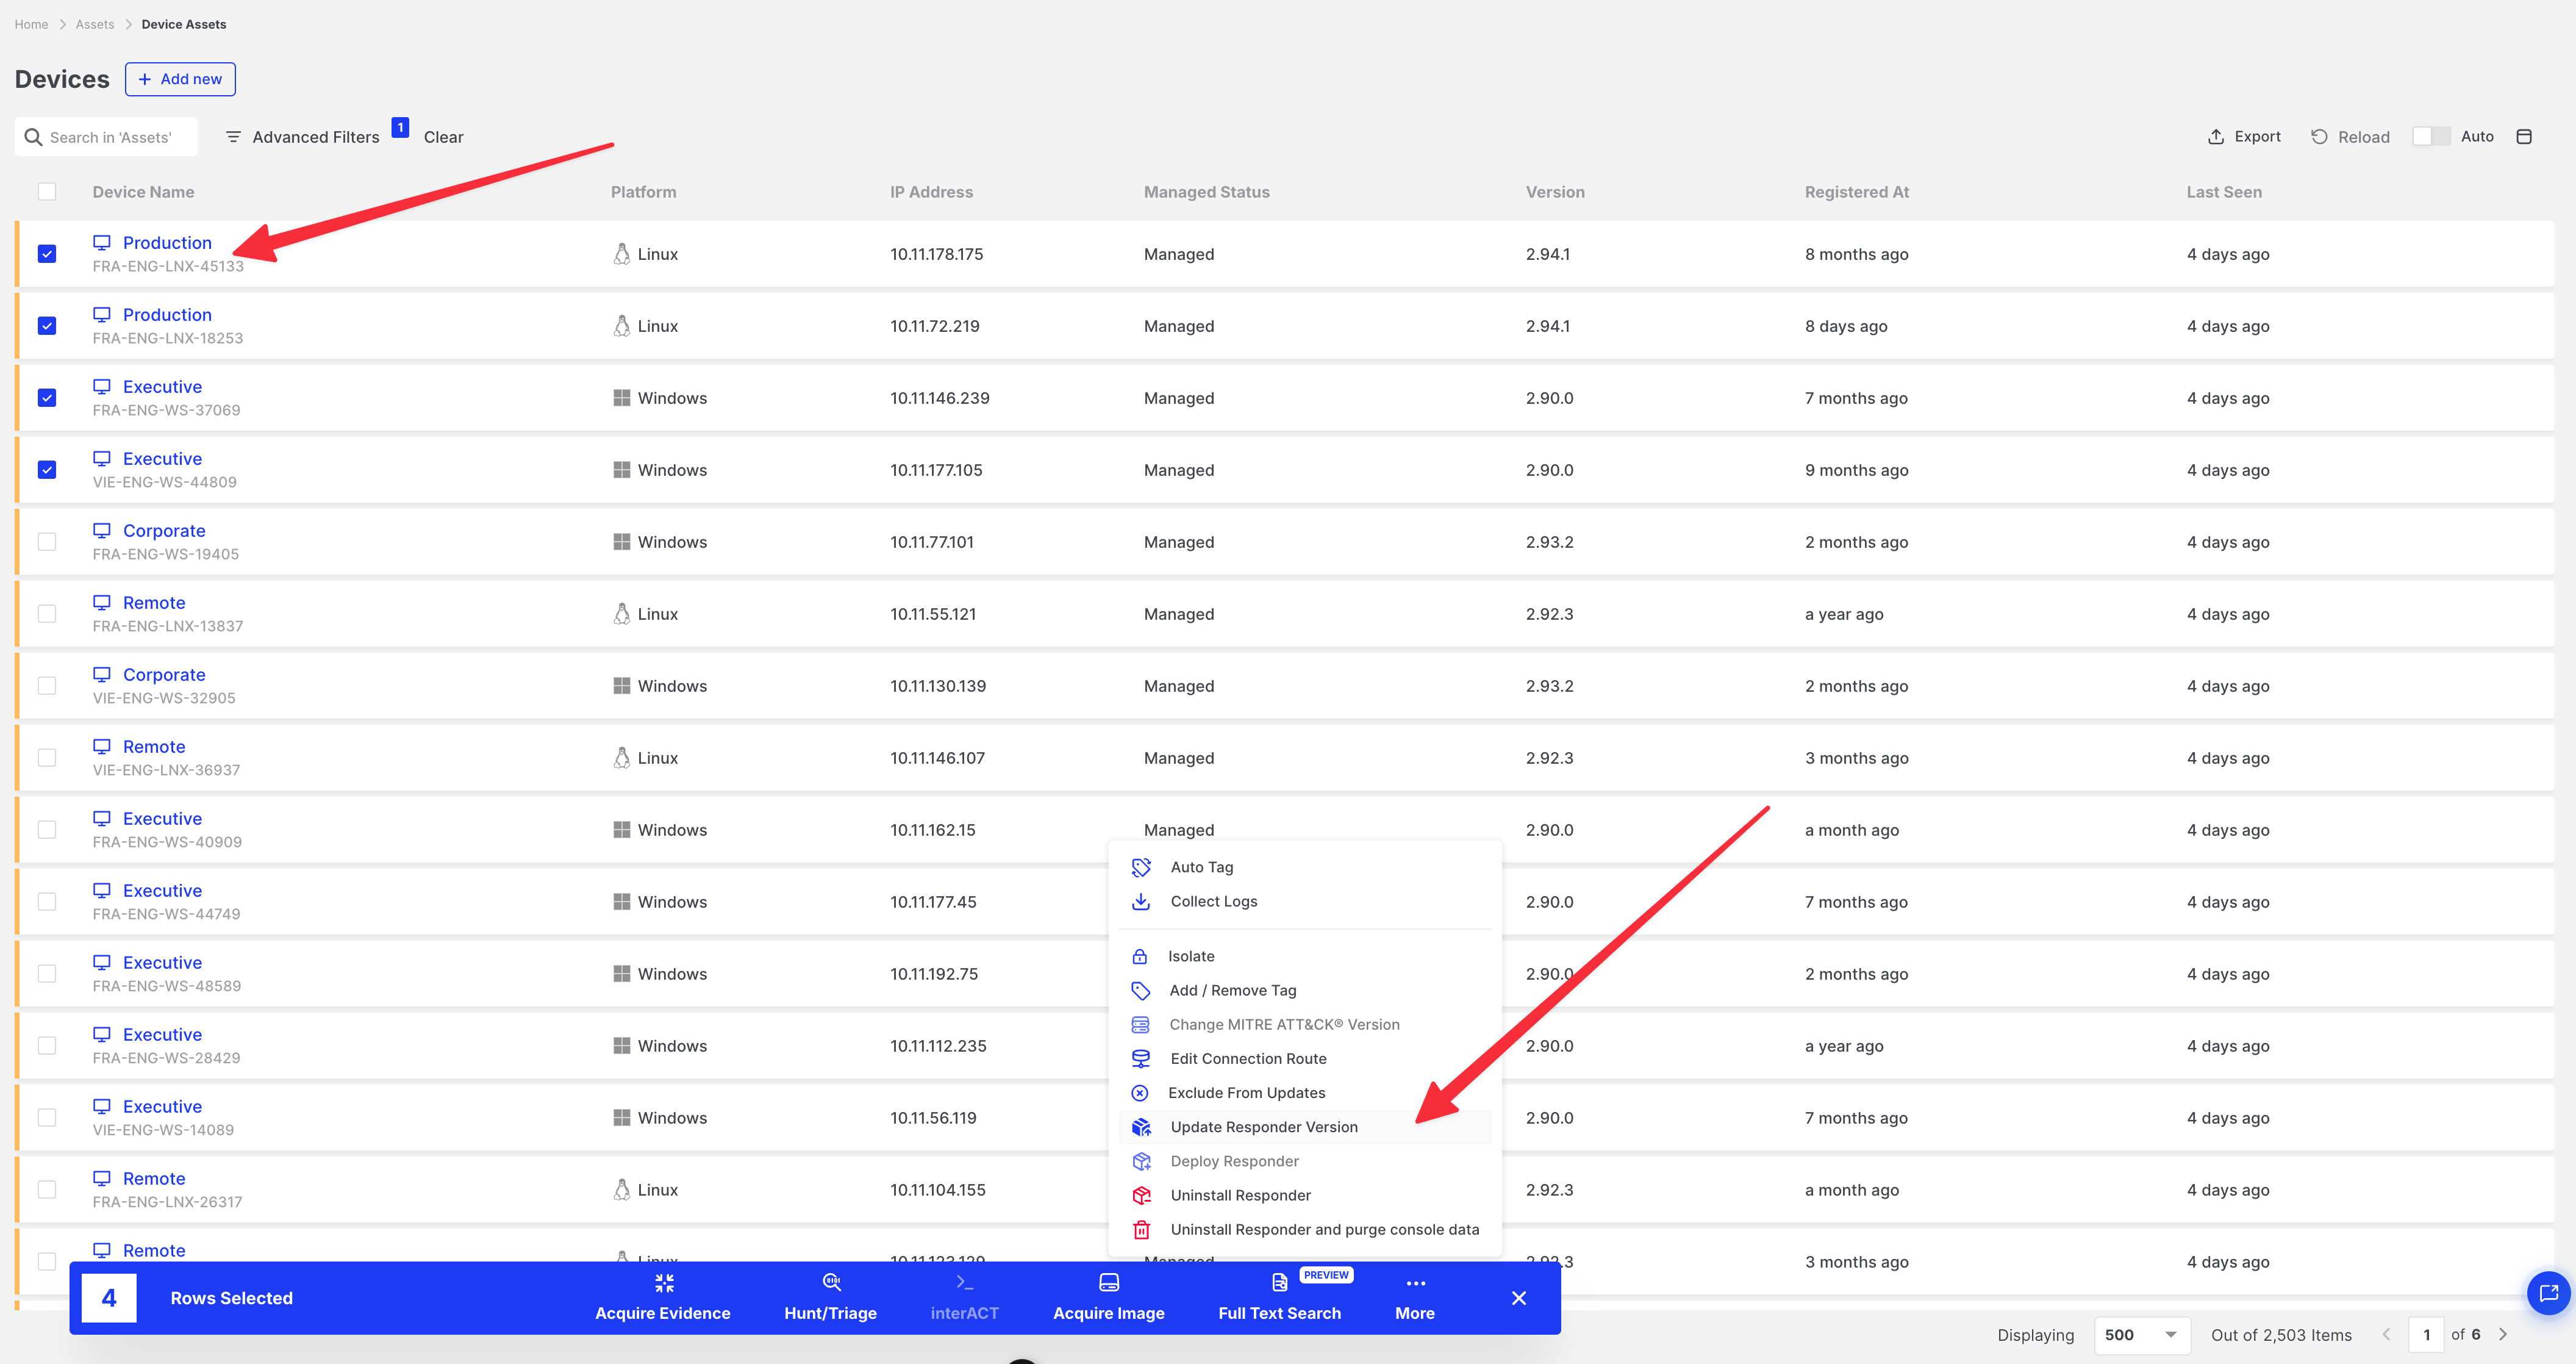 ### Schedule for later (drawer options)
When you select **Schedule for later** in the **Update Responder Version** drawer:
- Choose **Use asset's timezone** or **Select timezone**.
- Set the **start time**.
- Review the warning that an existing scheduled update for the selected asset(s) will be replaced.
### Schedule for later (drawer options)
When you select **Schedule for later** in the **Update Responder Version** drawer:
- Choose **Use asset's timezone** or **Select timezone**.
- Set the **start time**.
- Review the warning that an existing scheduled update for the selected asset(s) will be replaced.
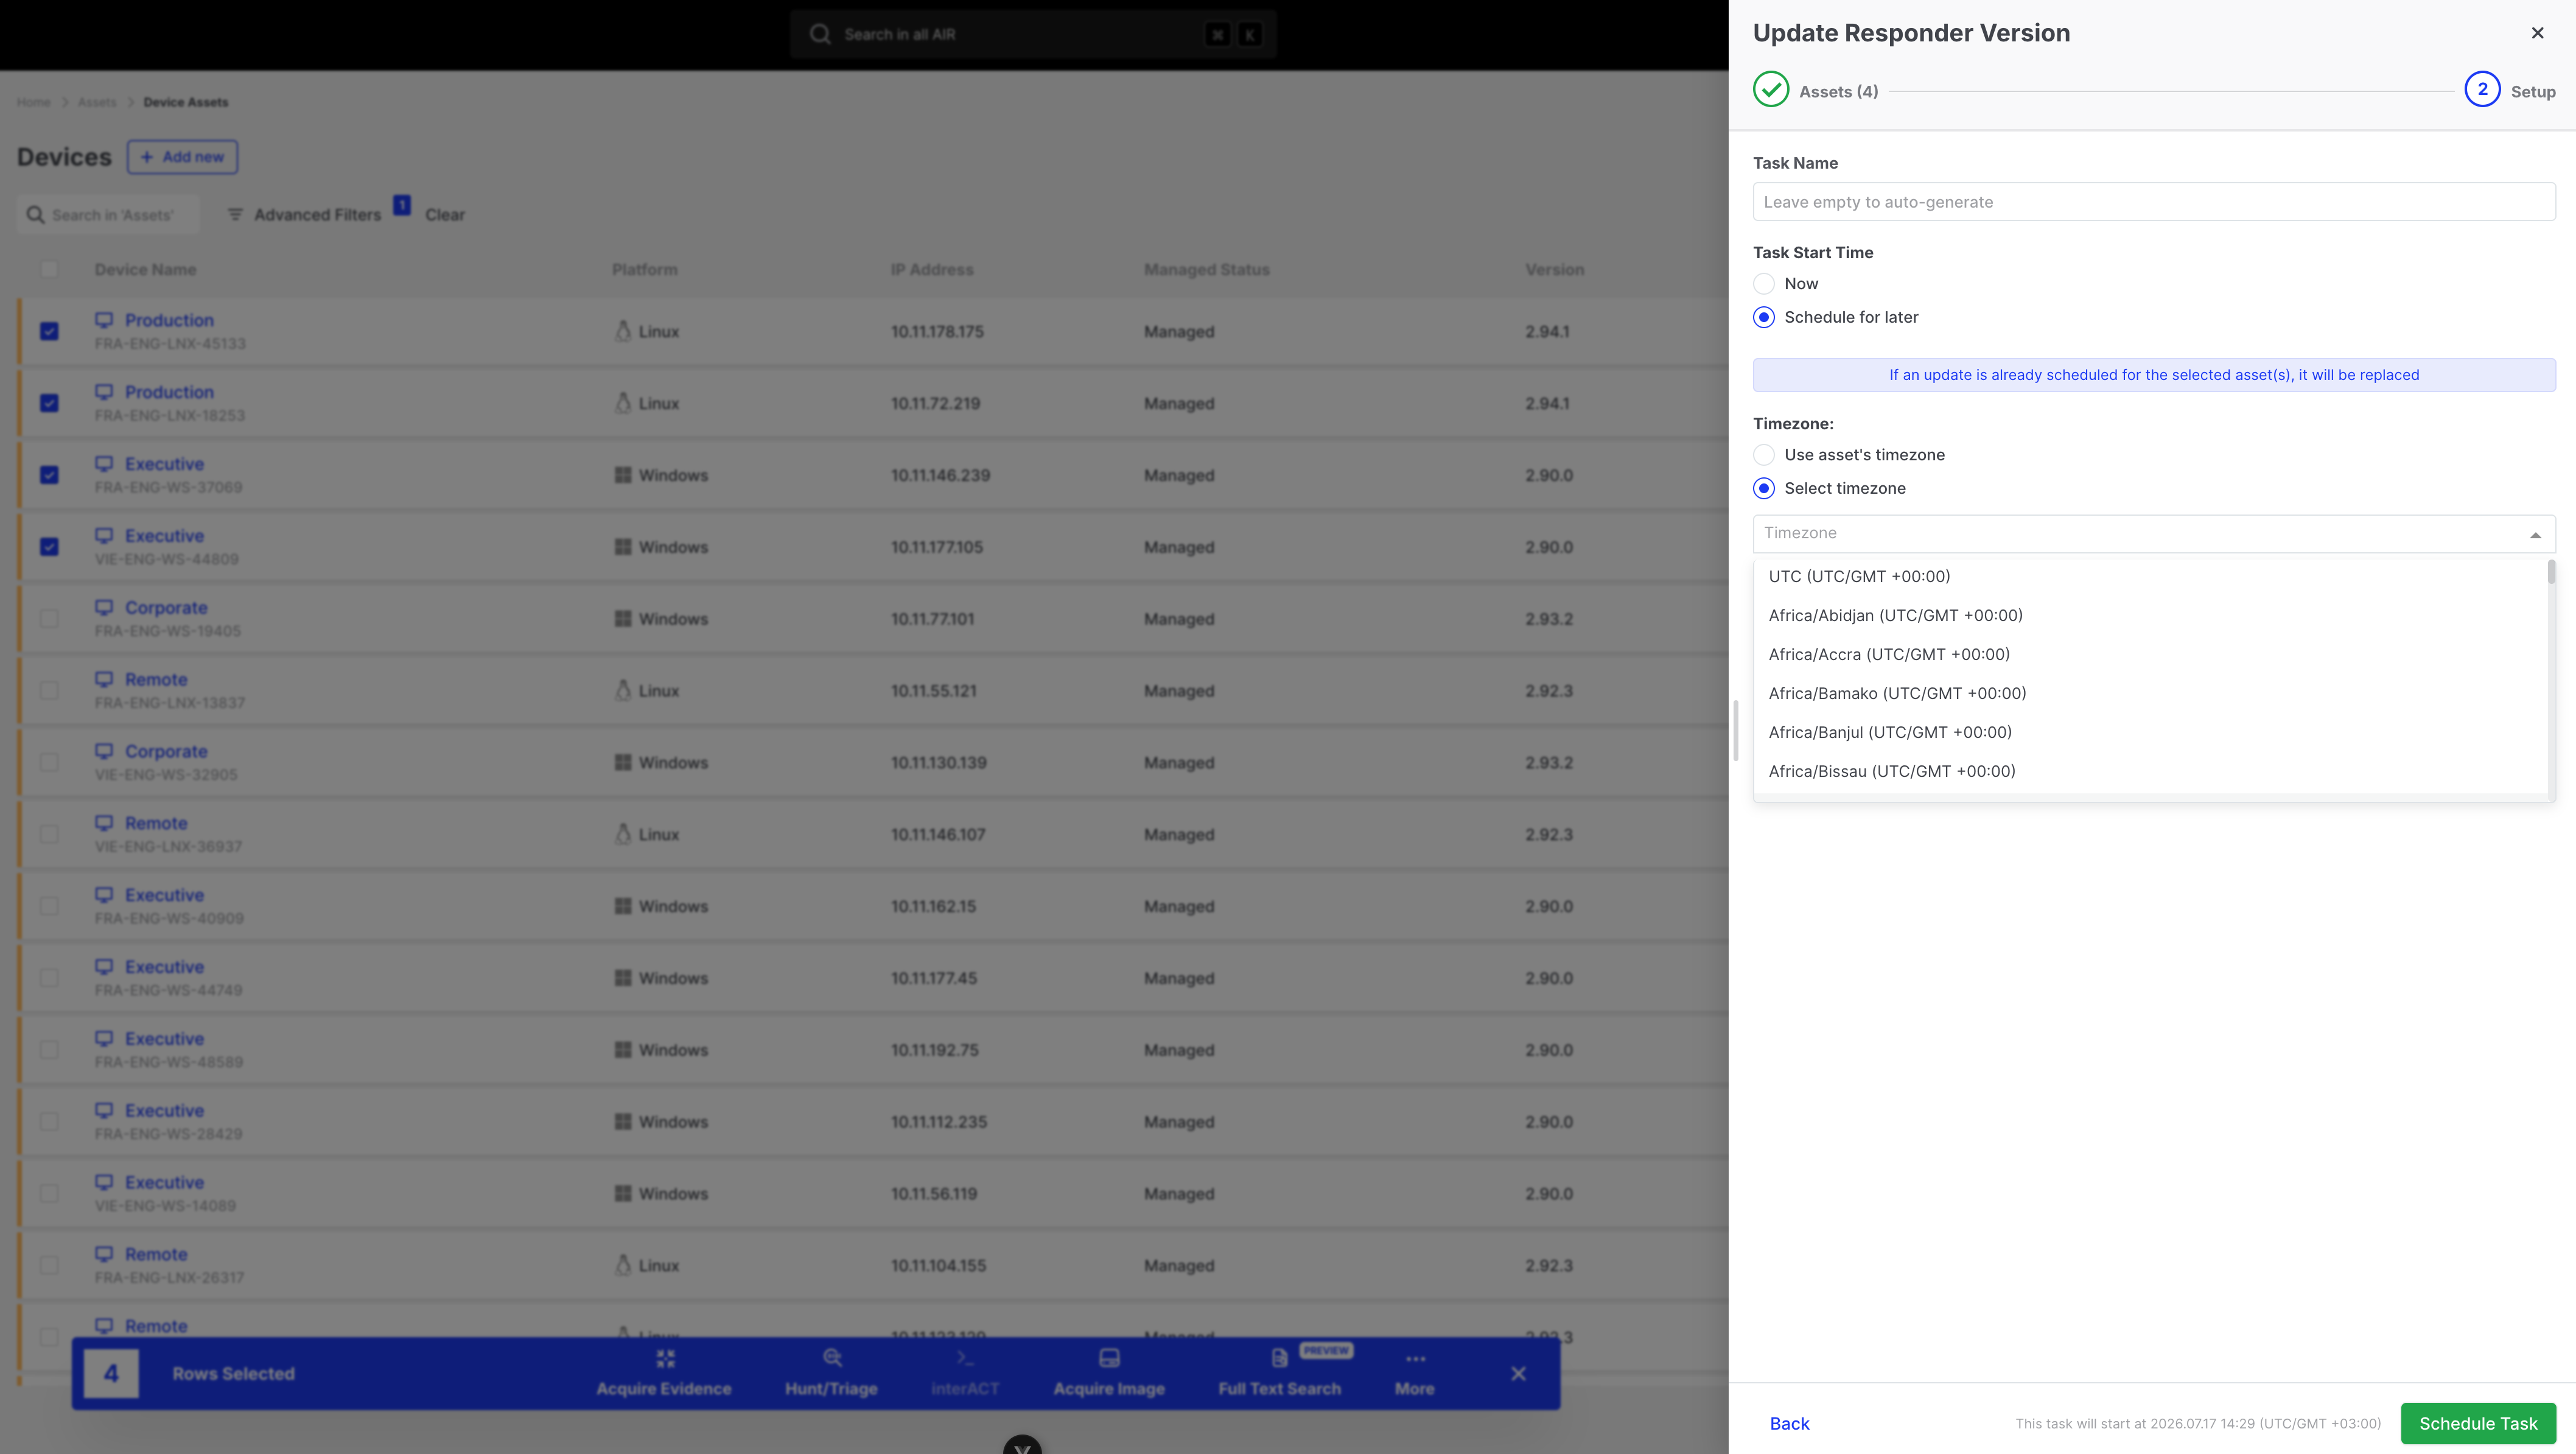 ## Already up to date
If an asset is already running the Console's current Responder version:
- The **Version update** card shows **Up to date**.
- It does not appear as selectable for a new update task in the drawer.
- Automatic Updates do not issue another version update for that asset.
When the asset is behind the target version, the card uses lifecycle labels such as **Update required** (mandatory / compatibility) or **Update available** (newer version can be installed manually). Those are not the same strings as the Home **Assets Summary** filters **Update Required** and **Update Advised** — see [Responder Updates](../settings/console-settings/assets/responder-updates#version-update-statuses-vs-assets-summary-labels).
## An asset is not updating
1. Open the asset and expand **Version update** — the status and explanation name the blocker.
2. Choose **View update history** (or open the **Version Updates** tab) if the card shows a failure or retry.
3. Use **Update now** to bypass windows and the automatic attempt limit when you need an immediate install.
Full status and history references: [Responder Update Status](../settings/console-settings/assets/responder-update-status) and [Responder Update History](../settings/console-settings/assets/responder-update-history).
## Related articles
- **[Responder Updates](../settings/console-settings/assets/responder-updates)** — Automatic Updates, Default policy, custom policies, exclusions, precedence
- [Responder Update Status](../settings/console-settings/assets/responder-update-status) — why an asset is updating, waiting, scheduled, failed, or excluded
- [Responder Update History](../settings/console-settings/assets/responder-update-history) — past update attempts and failure diagnosis
- [Assets (Console Settings)](../settings/console-settings/assets) — Asset Settings overview
- [Post-Deployment Configuration Guide](../self-hosted/setup/post-deployment-configuration-guide) — self-hosted setup checklist
---
# Is there a way to move an asset from one Organization or Case to another?
> Source: https://kb.binalyze.ai/air/faqs/is-there-a-way-to-move-an-asset-from-one-organization-or-case-to-another.html
**Moving an asset from one Organization to another is prohibited.**
Organization assignment is performed on the installation of the AIR responder process, and assets are directly bonded to the associated Organization. So there is no way to directly move an asset from one Organization to another. If you want to move an asset from one Organization, you must uninstall the responder from the asset, and then you must create a new responder deployment package and must select the Organization you want.
**Moving an asset directly from one Case to another is not a valid action.**
Actually, assets are not directly attached to Cases. They attach to a Case via a Task. When the Tasks of the assets are added to the Cases, the assets appear in the Case. An asset can be included in more than one Case. When you add the asset's Tasks to different Cases, the asset appears in those Cases. You can add Tasks to a Case or send a completed Task to other Cases with the "Send to case" action.
If you remove all the Tasks of the asset from the Case, the asset will be removed. You can directly remove the asset from the Case. This way, all its Tasks will be removed from the Case. Then you can add Tasks in interest to any Case you want.
---
# Anything missing?
> Source: https://kb.binalyze.ai/air/faqs/roadmap.html
::::note
**Your ideas are important**
Something missing? Tell us about it by clicking the link below!
[Give your Binalyze AIR feedback](https://binalyze.com/products/air/feedback)
::::
---
# Self-Hosted Setup
> Source: https://kb.binalyze.ai/air/self-hosted/setup/index.html
This section covers the complete installation and setup process for self-hosted AIR deployments.
## Installation Process
Follow these steps in order for a successful AIR self-hosted installation:
1. **[Pre-Installation Requirements](pre-installation)** - Review system requirements, network configuration, and preparation steps
2. **[Installation Guide](installation)** - Complete Docker-based installation instructions for supported Linux distributions
## Additional Configuration
After installation, you may need to configure:
- **[Security Settings](security/)** - SSL enforcement, access control, and security hardening
- **[Post-Deployment Configuration](post-deployment-configuration-guide/)** - Initial setup and configuration tasks
## Support
If you encounter issues during installation, see the troubleshooting section or contact support.
---
# Console Hardware Requirements
> Source: https://kb.binalyze.ai/air/self-hosted/setup/console-hardware-requirements.html
:::note
**Quick Tip**
Resource Planning
It is not possible to estimate resource requirements based solely on the number of deployed Responders. The determining factors are the type and volume of evidence collected, which can vary significantly between deployments. For instance, 1,000 Responders may generate 5 TB of evidence data, while 10,000 Responders could generate as little as 100 GB. Because of this variability, Responder count is not a reliable sizing metric.
We recommend proceeding with the installation using the suggested hardware values provided in the deployment guide, rather than attempting to calculate requirements based on the number of Responders.
As a general guideline, if you plan to deploy 20,000 or more Responders, allocate approximately double the recommended values to ensure optimal performance and scalability.
Learn more about the [deployment models](installation.md#deployment-models) for AIR.
:::
### Minimum Requirements
Below are the minimum hardware requirements for AIR components:
### Single Tier Deployment - Server (Console & DB)
## Already up to date
If an asset is already running the Console's current Responder version:
- The **Version update** card shows **Up to date**.
- It does not appear as selectable for a new update task in the drawer.
- Automatic Updates do not issue another version update for that asset.
When the asset is behind the target version, the card uses lifecycle labels such as **Update required** (mandatory / compatibility) or **Update available** (newer version can be installed manually). Those are not the same strings as the Home **Assets Summary** filters **Update Required** and **Update Advised** — see [Responder Updates](../settings/console-settings/assets/responder-updates#version-update-statuses-vs-assets-summary-labels).
## An asset is not updating
1. Open the asset and expand **Version update** — the status and explanation name the blocker.
2. Choose **View update history** (or open the **Version Updates** tab) if the card shows a failure or retry.
3. Use **Update now** to bypass windows and the automatic attempt limit when you need an immediate install.
Full status and history references: [Responder Update Status](../settings/console-settings/assets/responder-update-status) and [Responder Update History](../settings/console-settings/assets/responder-update-history).
## Related articles
- **[Responder Updates](../settings/console-settings/assets/responder-updates)** — Automatic Updates, Default policy, custom policies, exclusions, precedence
- [Responder Update Status](../settings/console-settings/assets/responder-update-status) — why an asset is updating, waiting, scheduled, failed, or excluded
- [Responder Update History](../settings/console-settings/assets/responder-update-history) — past update attempts and failure diagnosis
- [Assets (Console Settings)](../settings/console-settings/assets) — Asset Settings overview
- [Post-Deployment Configuration Guide](../self-hosted/setup/post-deployment-configuration-guide) — self-hosted setup checklist
---
# Is there a way to move an asset from one Organization or Case to another?
> Source: https://kb.binalyze.ai/air/faqs/is-there-a-way-to-move-an-asset-from-one-organization-or-case-to-another.html
**Moving an asset from one Organization to another is prohibited.**
Organization assignment is performed on the installation of the AIR responder process, and assets are directly bonded to the associated Organization. So there is no way to directly move an asset from one Organization to another. If you want to move an asset from one Organization, you must uninstall the responder from the asset, and then you must create a new responder deployment package and must select the Organization you want.
**Moving an asset directly from one Case to another is not a valid action.**
Actually, assets are not directly attached to Cases. They attach to a Case via a Task. When the Tasks of the assets are added to the Cases, the assets appear in the Case. An asset can be included in more than one Case. When you add the asset's Tasks to different Cases, the asset appears in those Cases. You can add Tasks to a Case or send a completed Task to other Cases with the "Send to case" action.
If you remove all the Tasks of the asset from the Case, the asset will be removed. You can directly remove the asset from the Case. This way, all its Tasks will be removed from the Case. Then you can add Tasks in interest to any Case you want.
---
# Anything missing?
> Source: https://kb.binalyze.ai/air/faqs/roadmap.html
::::note
**Your ideas are important**
Something missing? Tell us about it by clicking the link below!
[Give your Binalyze AIR feedback](https://binalyze.com/products/air/feedback)
::::
---
# Self-Hosted Setup
> Source: https://kb.binalyze.ai/air/self-hosted/setup/index.html
This section covers the complete installation and setup process for self-hosted AIR deployments.
## Installation Process
Follow these steps in order for a successful AIR self-hosted installation:
1. **[Pre-Installation Requirements](pre-installation)** - Review system requirements, network configuration, and preparation steps
2. **[Installation Guide](installation)** - Complete Docker-based installation instructions for supported Linux distributions
## Additional Configuration
After installation, you may need to configure:
- **[Security Settings](security/)** - SSL enforcement, access control, and security hardening
- **[Post-Deployment Configuration](post-deployment-configuration-guide/)** - Initial setup and configuration tasks
## Support
If you encounter issues during installation, see the troubleshooting section or contact support.
---
# Console Hardware Requirements
> Source: https://kb.binalyze.ai/air/self-hosted/setup/console-hardware-requirements.html
:::note
**Quick Tip**
Resource Planning
It is not possible to estimate resource requirements based solely on the number of deployed Responders. The determining factors are the type and volume of evidence collected, which can vary significantly between deployments. For instance, 1,000 Responders may generate 5 TB of evidence data, while 10,000 Responders could generate as little as 100 GB. Because of this variability, Responder count is not a reliable sizing metric.
We recommend proceeding with the installation using the suggested hardware values provided in the deployment guide, rather than attempting to calculate requirements based on the number of Responders.
As a general guideline, if you plan to deploy 20,000 or more Responders, allocate approximately double the recommended values to ensure optimal performance and scalability.
Learn more about the [deployment models](installation.md#deployment-models) for AIR.
:::
### Minimum Requirements
Below are the minimum hardware requirements for AIR components:
### Single Tier Deployment - Server (Console & DB)
 Check/Configure your Organization settings in the Main Menu.