Investigation Hub – Data Usage Statistics Dashboard
The Investigation Hub Disk Usage Statistics Dashboard empowers users to manage Investigation Hub data storage effectively by providing detailed and user-friendly insights into disk usage. This feature simplifies data analysis through visual elements like pie charts and summaries and enables users to focus on relevant data using customizable filters. Additionally, the ability to generate PDF reports makes sharing and documenting disk usage information seamless, enhancing operational efficiency and decision-making.
Why This Feature Matters
Section titled “Why This Feature Matters”Challenges:
- Lack of Visibility: Users struggle to understand how disk space is utilized across cases, organizations, and evidence categories.
- Complex Data Presentation: Existing tools make it difficult to analyze or visualize disk usage.
- No Reporting Tools: There is no simple way to generate and share reports, limiting collaboration and record-keeping.
How This Dashboard Solves These Problems:
- Clear Visualization: Pie charts and summaries make it easy to understand disk usage at a glance.
- Customizable Filters: Users can filter data by organization, investigation type, platform, evidence type, and category.
- Report Generation: Generate PDF reports or export data as CSV files directly from the dashboard.
Key Features
Section titled “Key Features”Access Control
- This feature is accessible exclusively to Global Admins via the AIR console:
- Navigate to Settings > Investigation Hub Disk Usage.
What’s Included
- The first nine disk usage categories are displayed in charts. The remaining categories are grouped together and can be viewed by using the scrolling arrow, as shown in the screenshots of the Disk Usage Per Organization pie chart below:
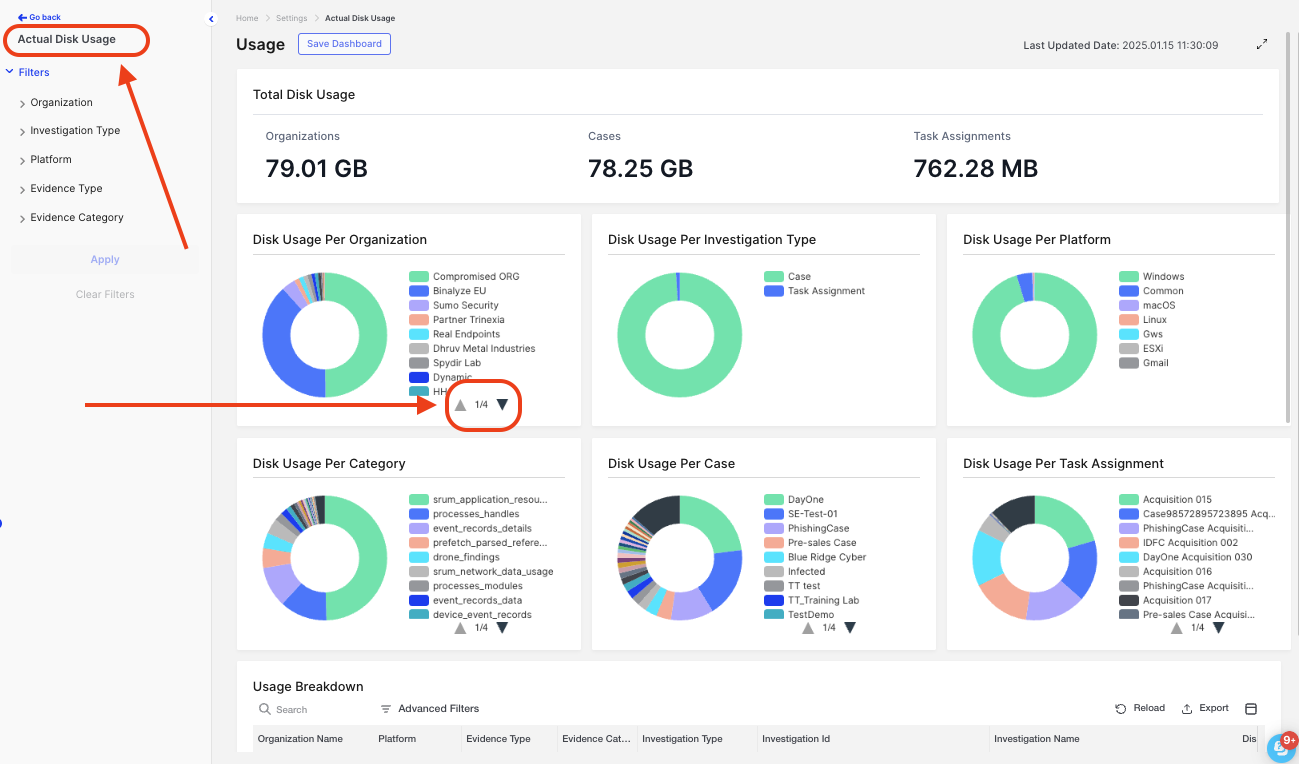
Investigation Hub – Data Usage Statistics Dashboard
- The usage summary window at the top of the page provides an overview of total disk usage, categorized by Organizations, Cases, and Task Assignments, all at a glance.
- Detailed breakdowns are shown by:
- Organization
- Case
- Platform
- Evidence Type
- Evidence Category
Data Views
Section titled “Data Views”- Actual Disk Usage View:
- Real-time insights into current disk usage.
- Historical Insights View:
- Track trends and changes in disk usage over time.
- Configure widgets to display tailored insights.
- Filters in the secondary menu:
- Organization
- Investigation Type
- Platform
- Evidence Type
- Evidence Category
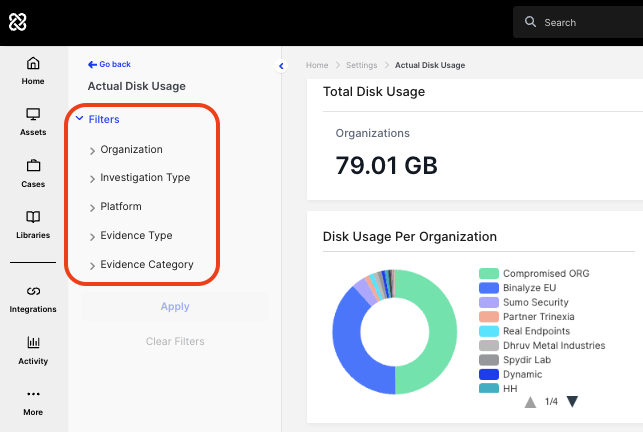
Investigation Hub – Data Usage Statistics Dashboard: Filters
Advanced Table View
Section titled “Advanced Table View”- Sortable and exportable tables for deeper analysis.
- Filters and advanced sorting for granular insights.
Exporting Reports
Section titled “Exporting Reports”- Users can generate PDF reports for record-keeping and sharing.
- CSV exports are available for custom data analysis.
Data Usage Dashboard – Hierarchical Sunburst View
Section titled “Data Usage Dashboard – Hierarchical Sunburst View”Understanding data usage in complex environments can be challenging, especially with large datasets. The Hierarchical Sunburst View in the Data Usage Dashboard offers an intuitive and interactive visualization that helps identify key usage patterns, trends, and anomalies at a glance.
Please see this short overview of the Hierarchical Sunburst View.
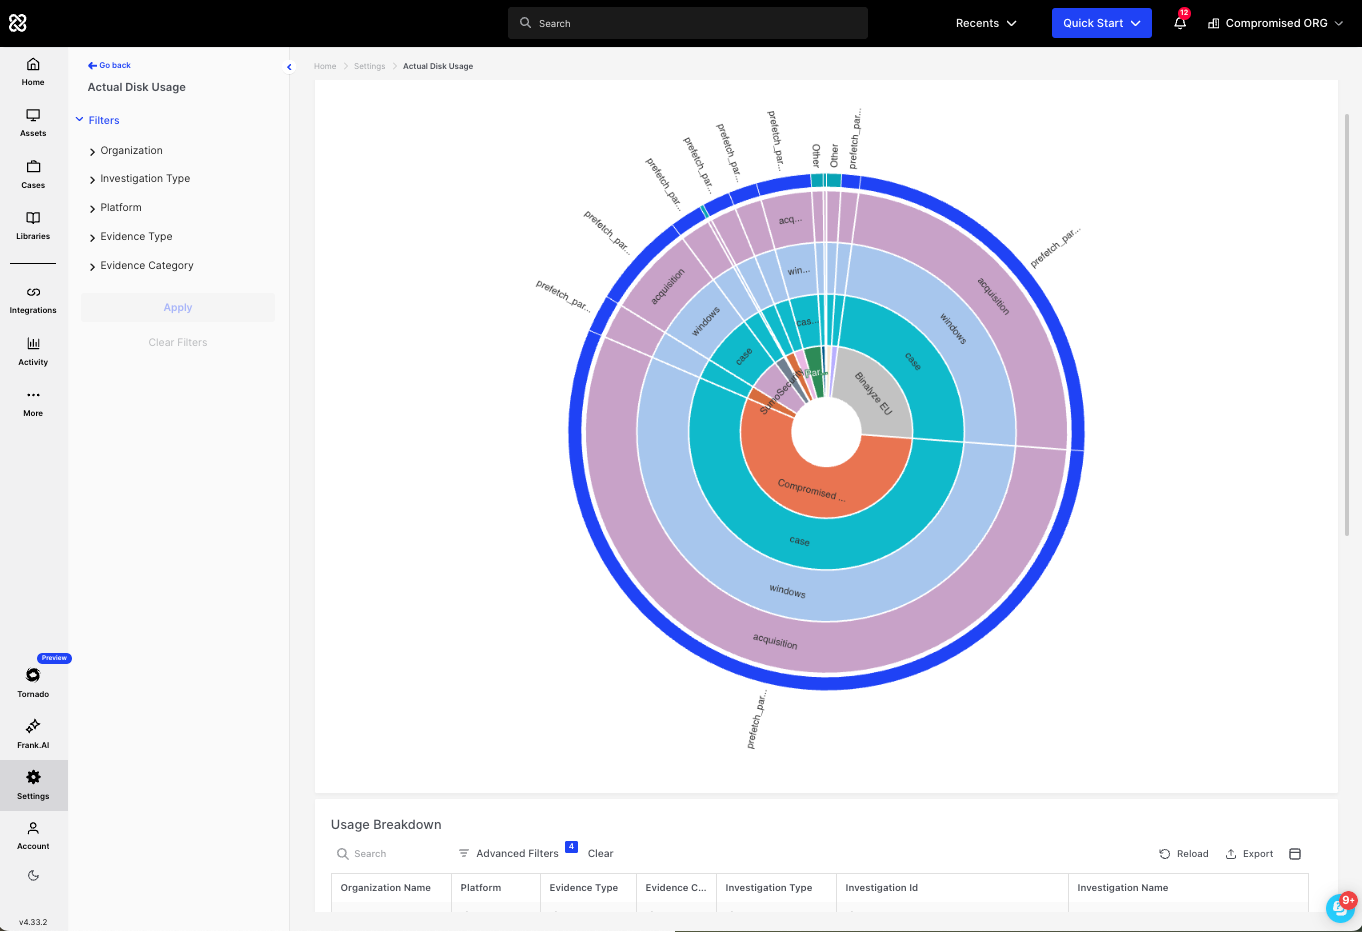
Investigation Hub – Data Usage Statistics Dashboard: Hierarchical Sunburst View
Key Benefits
Section titled “Key Benefits”- Visual Hierarchy – Easily navigate and understand data relationships compared to traditional tables or charts.
- Interactive Exploration – Click on segments to drill down into deeper data layers for more detailed insights.
- Seamless Filtering – The Sunburst View integrates with global filters, ensuring a consistent analysis experience.
- Custom Dashboards – Save customized Sunburst views for quick access and continuous monitoring.
Where to Find It?
Section titled “Where to Find It?”The Sunburst View is available under:
Settings > Actual Disk Usage > Hierarchical View tab on the Actual Usage page.
Historical Insights Feature
Section titled “Historical Insights Feature”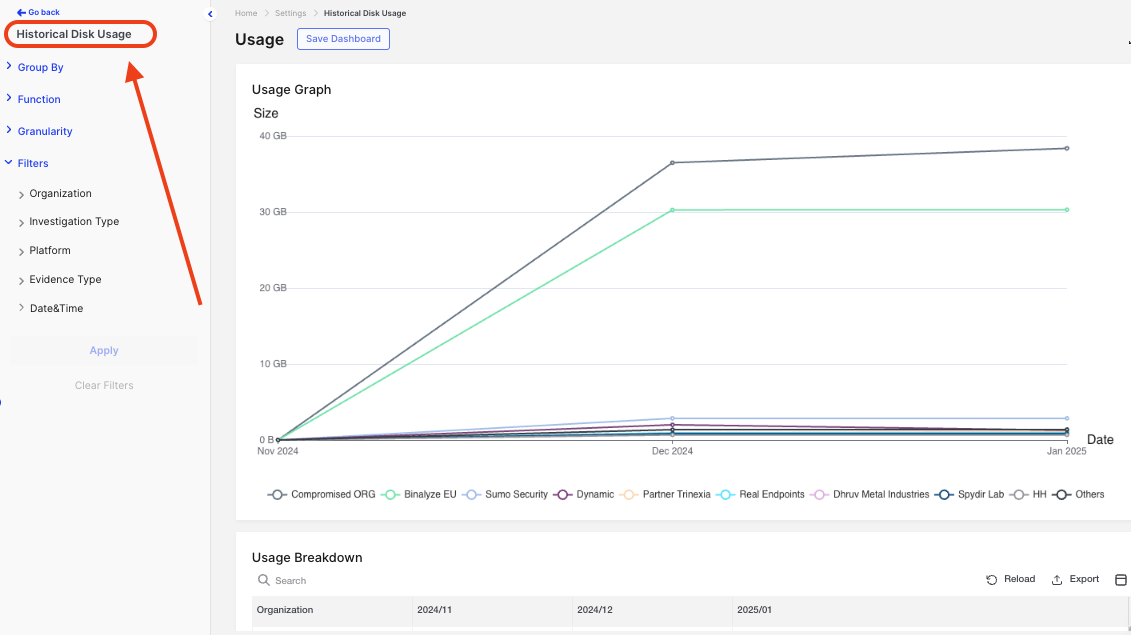
Investigation Hub – Data Usage Statistics Dashboard: Historical Disk Usage
Overview
Section titled “Overview”The historical view allows administrators and investigators to analyze disk usage trends efficiently. The dashboard includes customizable widgets and granular time-based analytics to help identify patterns and optimize storage usage.
Key Functionalities:
Section titled “Key Functionalities:”- Customizable Widgets:
- Group by: None, Organization, Investigation Type, Platform, Evidence Type, Evidence Category.
- Function: Metrics such as average or maximum values.
- Granularity: Hourly, daily, monthly, or yearly intervals.
- Filters: Date/time, investigation type, and more.
- Saved Dashboards:
- Save and manage customized dashboards.
- Dashboards are listed with details like name, user, save date, last update, and applied filters.
- Prevent duplicate or empty dashboard names.
- Data Management:
- Disable unavailable dates in the date and time picker.
- Reload or export data directly from table views.
- Default Settings:
- Reset widgets to default configurations.
Restrictions and Considerations
Section titled “Restrictions and Considerations”- Access: This feature is only available to Global Admins.
- Non-Clickable Charts: The line charts in the dashboard are for display purposes only.
- Limited Categories: Only the top nine disk usage categories are displayed; all others are grouped under the label “Others.”
User Guidance
Section titled “User Guidance”- Accessing the Dashboard:
- Go to Settings > Investigation Hub Disk Usage.
- Choose between Actual Disk Usage or Historical Disk Usage views.
- Filtering Options:
- Organization
- Investigation Type
- Platform
- Evidence Type
- Evidence Category
- Visual Representation:
- Pie charts for quick overviews.
- Detailed tables for in-depth analysis.
- Exporting and Reporting:
- Generate PDF reports for sharing and record-keeping.
- Export CSV files for custom data handling.
This feature provides administrators and investigators with powerful tools to monitor and optimize disk usage, ensuring a streamlined and efficient investigation process.