Timeline
The Timeline in AIR 5.0+ has been completely redesigned and embedded directly into the Investigation Hub, providing investigators with a powerful, unified view of all timestamped evidence. This enhancement eliminates context switching, accelerates analysis, and enhances collaboration.
Key Timeline Features
Section titled “Key Timeline Features”- Automatic Event Generation
Every piece of evidence with a timestamp automatically generates a timeline event. There are no longer restrictions based on asset type or data source. - Integrated in the Investigation Hub
The Timeline is now a core part of the Investigation Hub, rather than a separate feature. Global filters, case filters, and advanced filters work seamlessly across all views. - Advanced Filtering
Analysts can apply both global filters (date ranges, assets, evidence types) and evidence-specific filters (e.g., IP addresses, paths, user IDs). This allows precise targeting of relevant events without visual clutter. - Relative & Nearby Time Filtering
From any timestamp in evidence or findings, analysts can quickly pivot to surrounding events (e.g., “5 minutes before and after”), making causality and event sequencing clearer. - Interactive Timeline Bar
A zoomable timeline bar with density maps highlights periods of activity. Analysts can navigate quickly, change granularity (hour, day, month, year), and toggle findings/flags overlays. - Timeline Table Enhancements
A redesigned event table with infinite scrolling and expandable details lets analysts flag, annotate, or promote events to findings. All actions are synchronized across the platform. - Collaboration Features
Notes, flags, and findings applied in the Timeline are reflected across the entire Investigation Hub, supporting team-based workflows and ensuring consistent visibility. - Export Capability
Timeline tables can be exported to CSV with optional evidence metadata in JSON, enabling reporting, compliance, and cross-platform analysis.
Using the Timeline
Section titled “Using the Timeline”The Timeline is embedded directly within the Investigation Hub, providing analysts with a complete, interactive view of all timestamped evidence, unrestricted by asset type or data source. This walkthrough will guide you through using the new Timeline effectively in your investigations.
Accessing the Timeline
Section titled “Accessing the Timeline”- Open any case in the Investigation Hub.
- Select the Timeline tab from the secondary.
- The Timeline view loads automatically with:
- Timeline bar (overview of events, zoomable).
- Timeline table (detailed events with metadata).
- No filters, Findings, or Flags will be applied in this initial view.
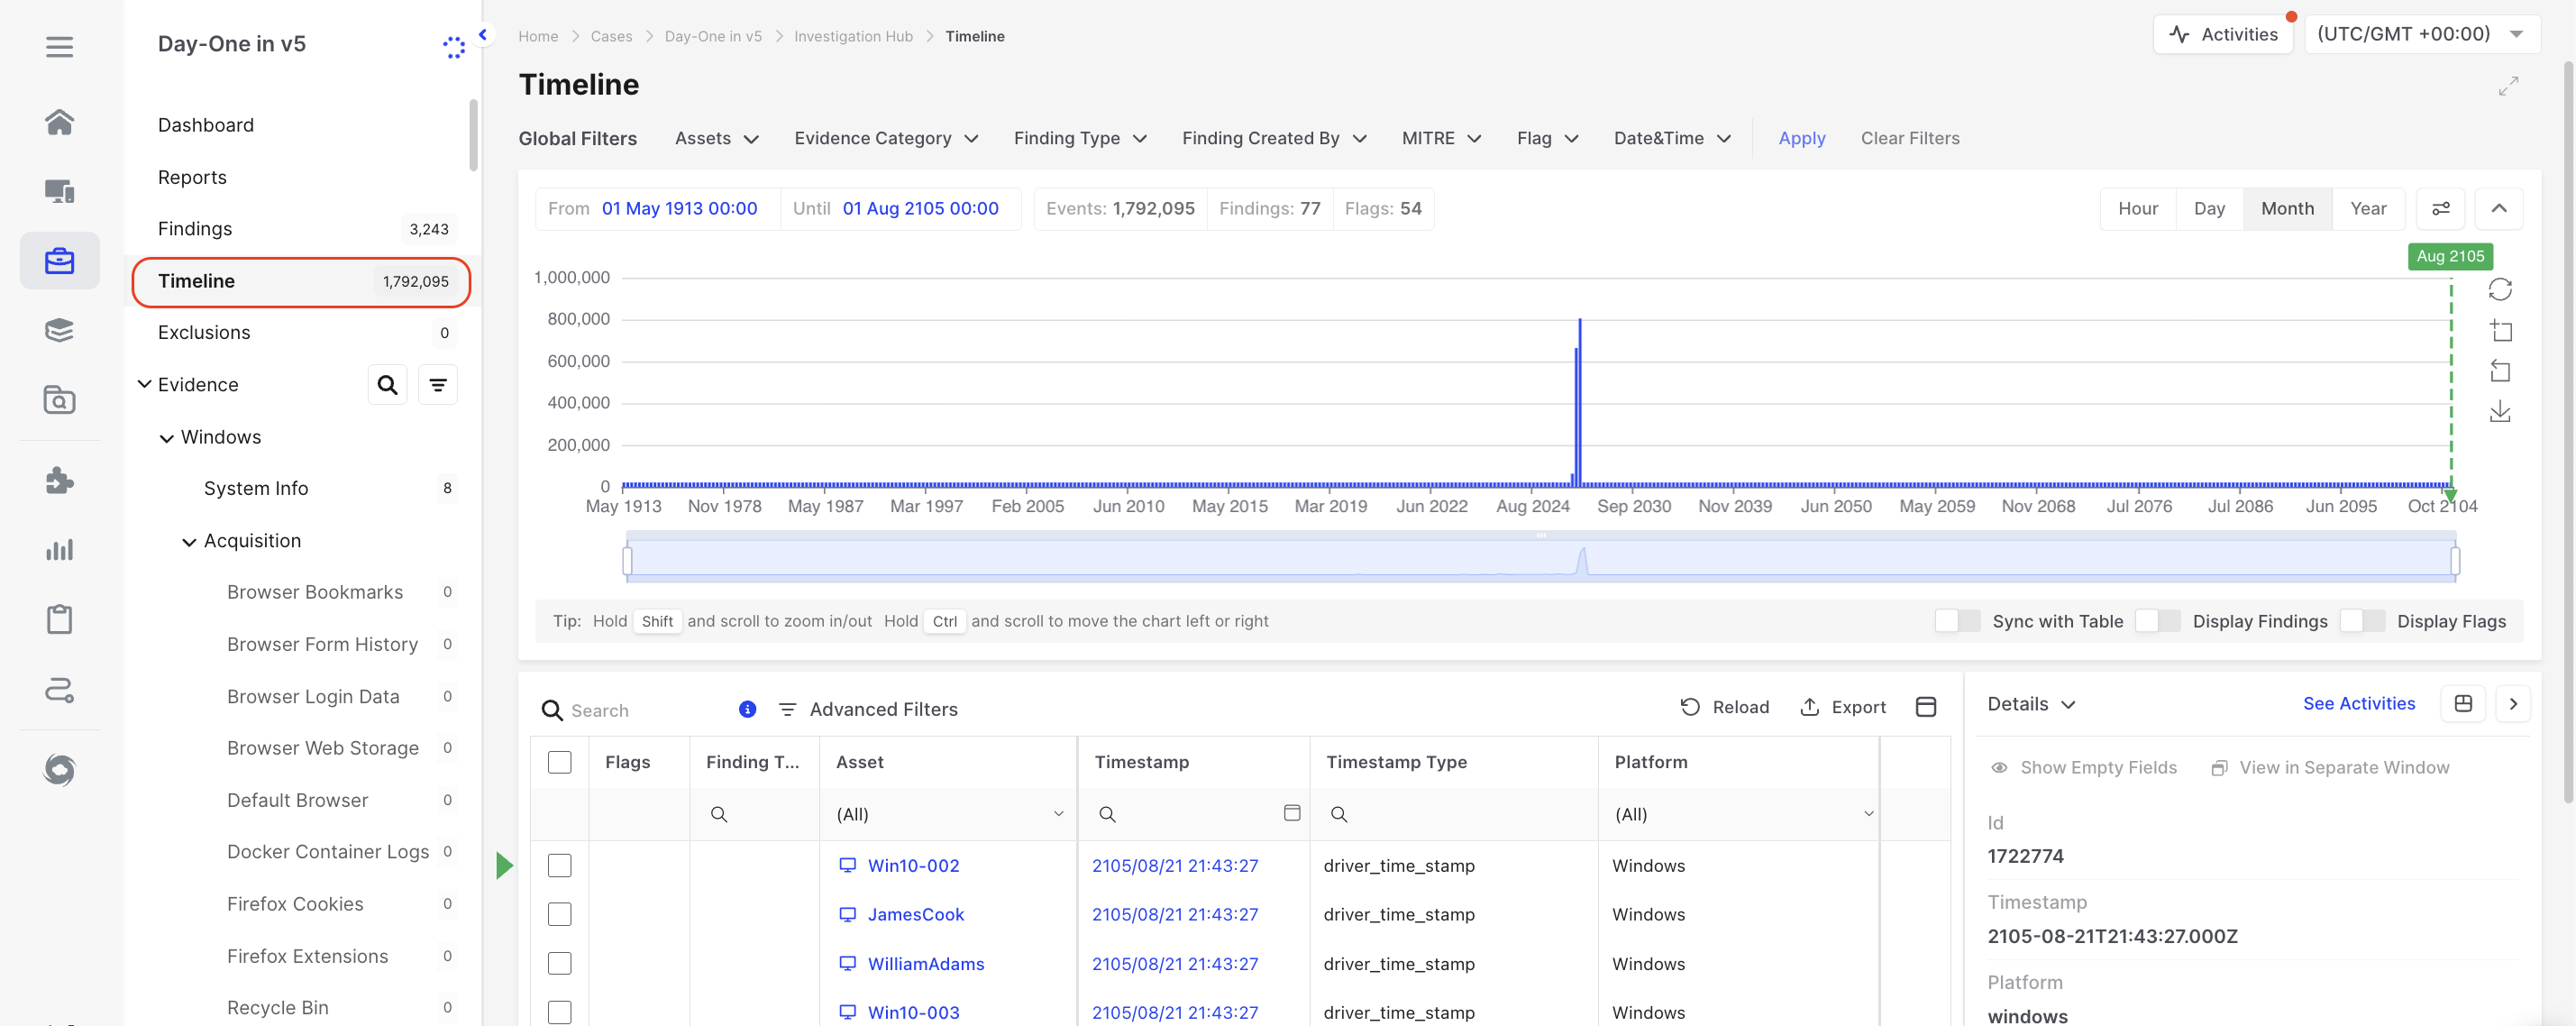
Timeline: Initial view
Navigating the Timeline
Section titled “Navigating the Timeline”- Zooming: The timeline supports several zoom options for flexible navigation:
- Zoom buttons – Switch between Year, Month, Day, or Hour views.
- Drag-to-zoom – When the zoom button (located to the right of the chart) is active, drag and drop across the chart to define the exact area to focus on.
- Shift + scroll – Hold Shift while scrolling to zoom in or out with finer control.
- Mini-map – Compress or expand the visible area in the mini-map to quickly adjust the level of detail. This provides immediate visibility into data density across the timeline, helping analysts effectively explore large time spans and reduce visual fatigue.
- Cursor sync: Clicking on the bar updates the table; the first row always matches your selected point.
Timeline Enrichment Options
Section titled “Timeline Enrichment Options”Below the timeline chart, three toggle switches allow you to customize and enrich the view:
- Sync with Table – Ensures the evidence table reflects only the focused time range when zooming, panning, or changing dates on the timeline bar.
- Display Findings – Adds a dedicated chart that highlights findings separately from other events (area 2 in screenshot below).
- Display Flags – Displays flag icons directly on the main timeline chart (area 1 below), indicating the location of flagged items.
These options help analysts quickly correlate evidence, findings, and flagged events within the same timeline context.
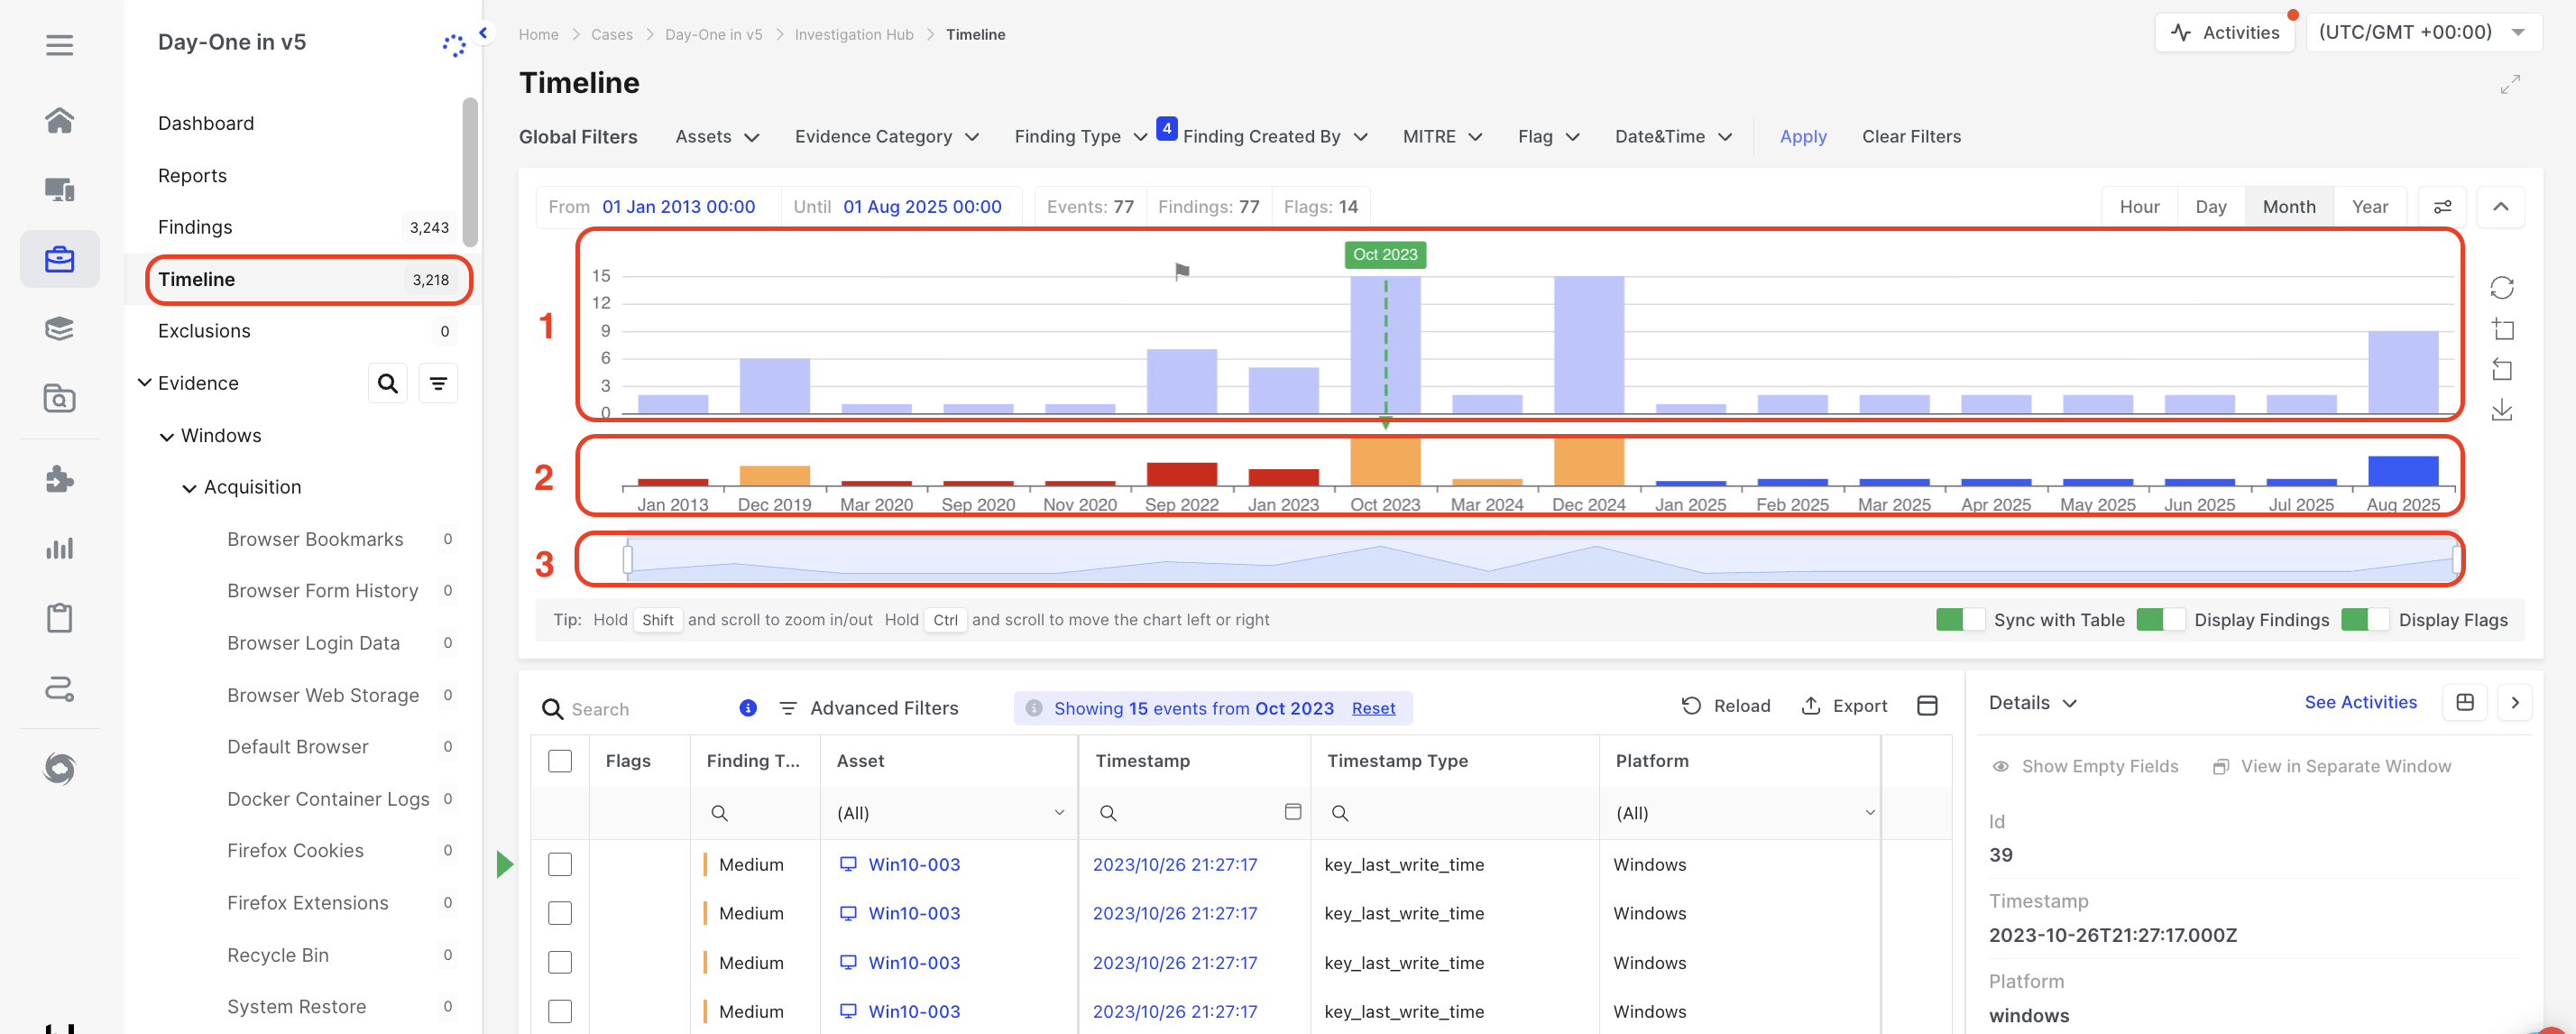
Timeline: Enrichment options (1-Timeline, 2-Findings, 3-Mini-map)
Applying Filters
Section titled “Applying Filters”- Global filters (e.g., Assets, Evidence Category, Finding Type) apply to the entire Investigation Hub, including the Timeline.
- Timeline bar filters refine the visual display via zoom functions.
- Advanced filters apply at the table level, including evidence-specific fields (e.g., IP addresses, file paths, user IDs). Constructing filters, whether basic or complex, is straightforward, as shown below:
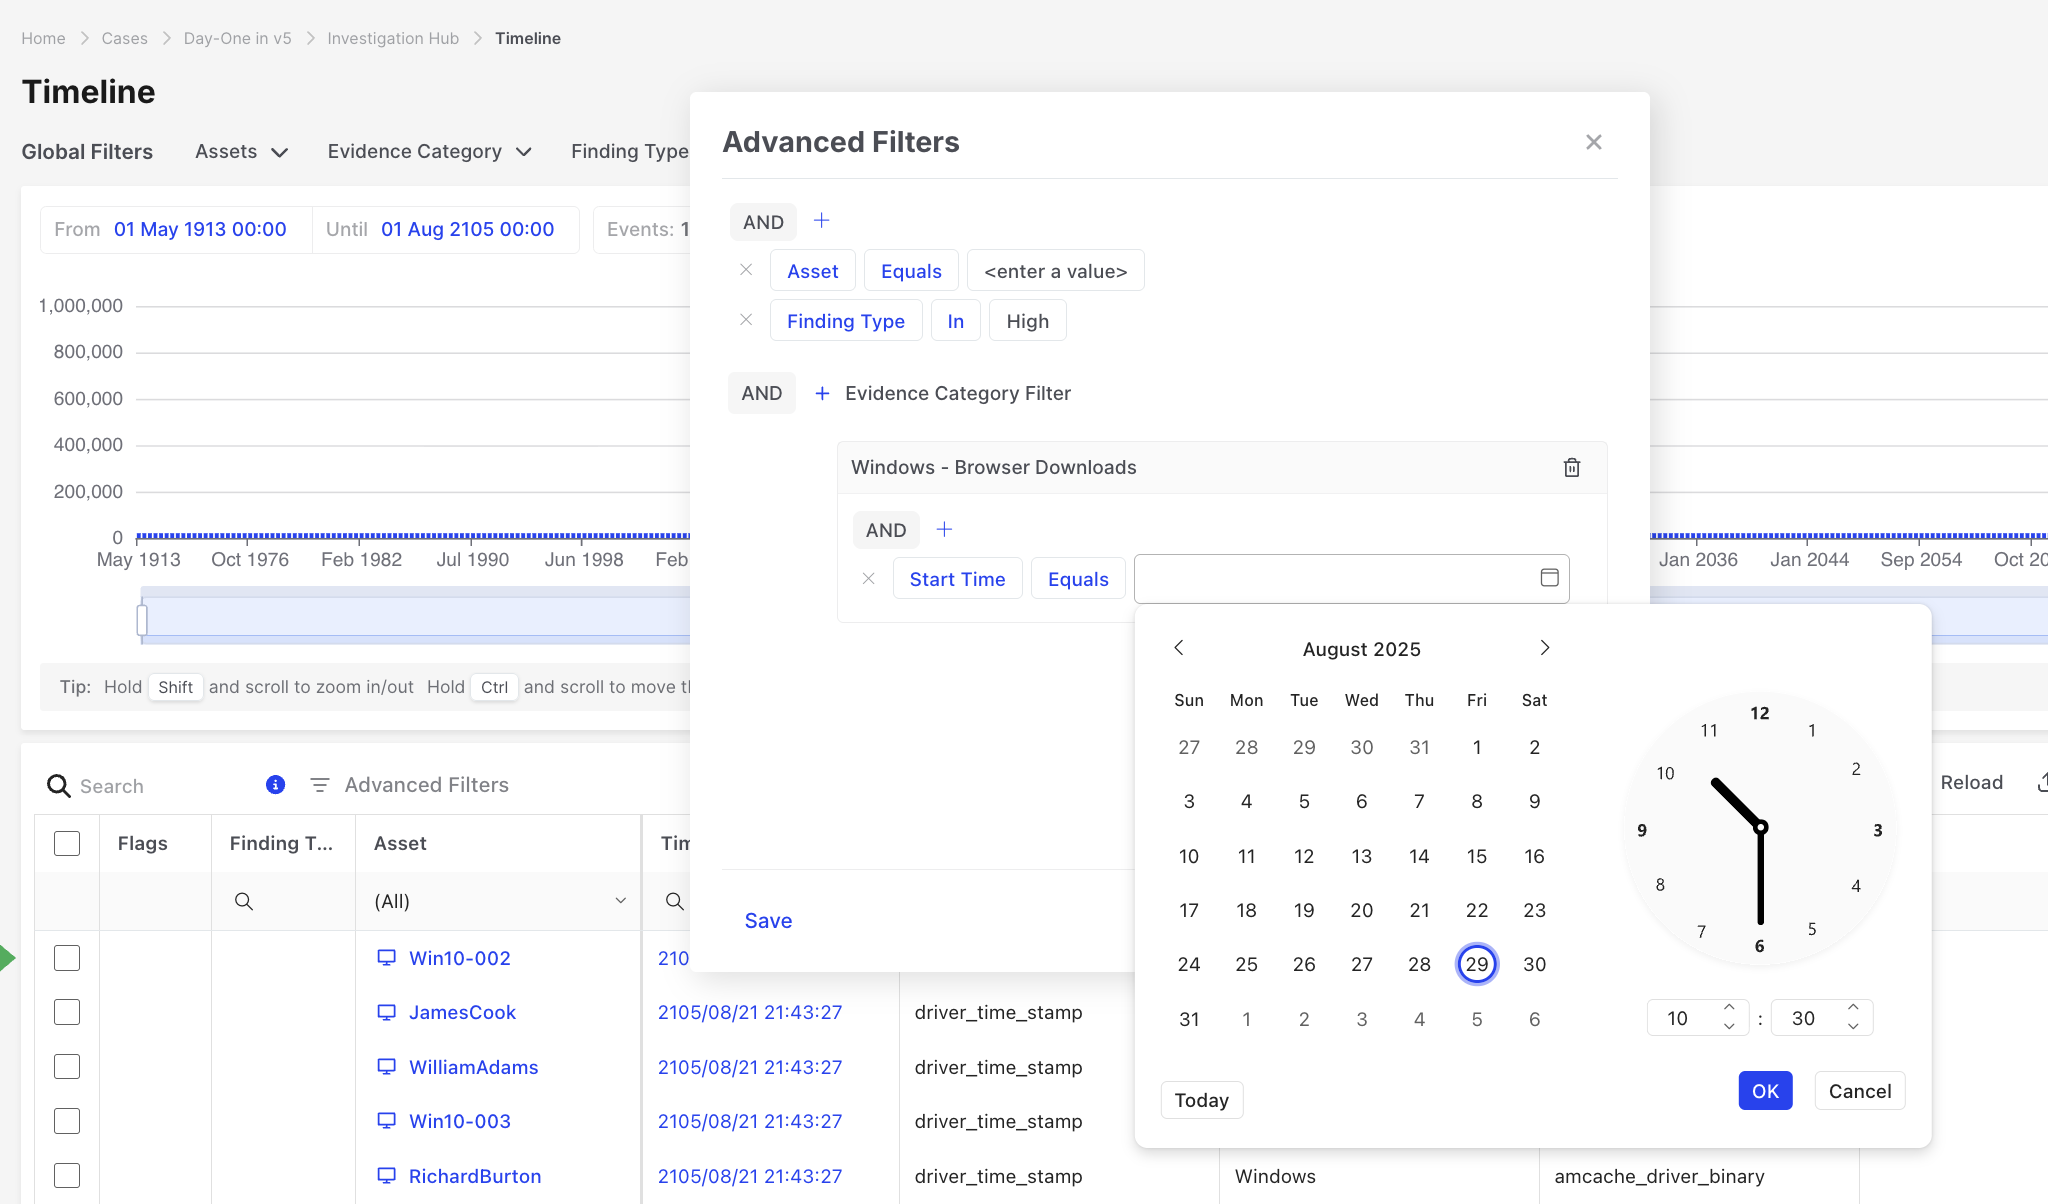
Timeline: Constructing advanced filters
Using Relative Time Filtering
Section titled “Using Relative Time Filtering”Clicking on a timestamp opens the Filter by Time dialog, which provides quick and precise options to refine the investigation window:
- Quick Filters: Instantly narrow results to events that occurred before, after, or at the selected timestamp.
- Nearby (+/-): Define a time window around the selected timestamp (e.g., ±1 second, ±5 minutes, ±7 days). This helps capture surrounding activity that may be contextually relevant to the investigation.
- Custom Range Preview: The dialog automatically displays the calculated “from” and “to” time boundaries based on your selection.
- Result Options:
- Show results in evidence table – keeps the filtered evidence within the current table view for immediate analysis.
- Navigate to the Timeline – pivots the same filtered view into the Timeline for a broader chronological context.
Use Case Example:
If an analyst identifies a suspicious process execution at 15:43:36, they can quickly pull in all related evidence from one second before to one second after. This makes it easy to uncover precursor events or immediate follow-on activity without manually building time-based filters.
This relative filtering approach complements absolute time filters, providing flexibility for both precision pivoting and contextual timeline exploration.
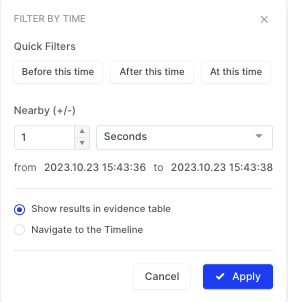
Timeline: Relative Time Filtering
Timeline search box
Section titled “Timeline search box”The search box in the Timeline evidence tables allows analysts to quickly refine results using keywords, exact phrases, exclusions, and logical operators. You can combine multiple terms with ‘OR', and exclude terms with a leading minus sign (e.g., -anonymous), or search for exact matches using quotation marks (e.g., "logon failure"). This advanced search capability enables more precise filtering of evidence, allowing investigators to surface only the most relevant events within large datasets.
Timeline Preferences Panel
Section titled “Timeline Preferences Panel”The timeline bar includes several layout and display options to help analysts tailor the view to their investigation. You can switch between bar and line chart modes, show or hide empty ranges to create a more compact timeline, and toggle the cursor for precise navigation. These preferences make it easier to adapt the visualization for complex investigations or when working with large volumes of evidence.
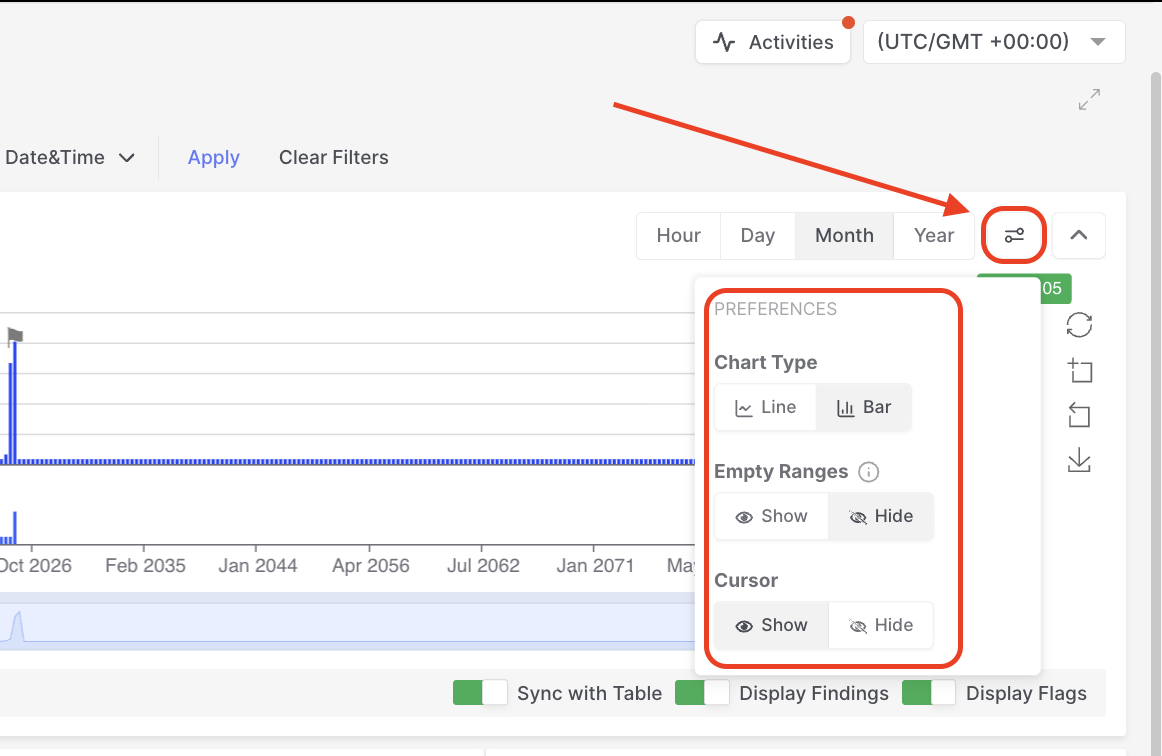
Timeline: Preferences Panel
Show Timeline Events
Section titled “Show Timeline Events”- Within the Investigation Hub, selecting an evidence item in the evidence table opens the Details panel. Here, the Show Timeline Events option reveals all timestamps associated with that item. For example, if the artifact includes a Last Modified, Start Time, and End Time, each of these values will be displayed in this view, and these additional timestamps can themselves be subjected to further relative timestamp filtering.
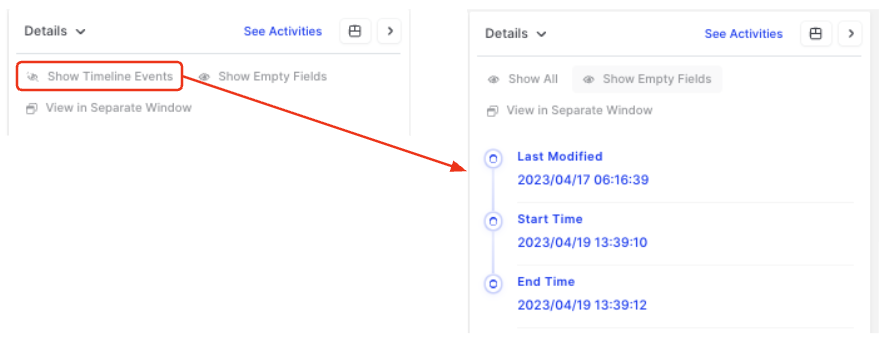
Timeline: Show Timeline Events
Flags, Findings, and Collaboration
Section titled “Flags, Findings, and Collaboration”- Use the toggle controls in the Timeline bar to show or hide flagged events and findings.
- Flag or annotate events directly in the table; all changes synchronize across the Investigation Hub.
- Findings promoted from Timeline events automatically appear in the Findings view for team visibility.
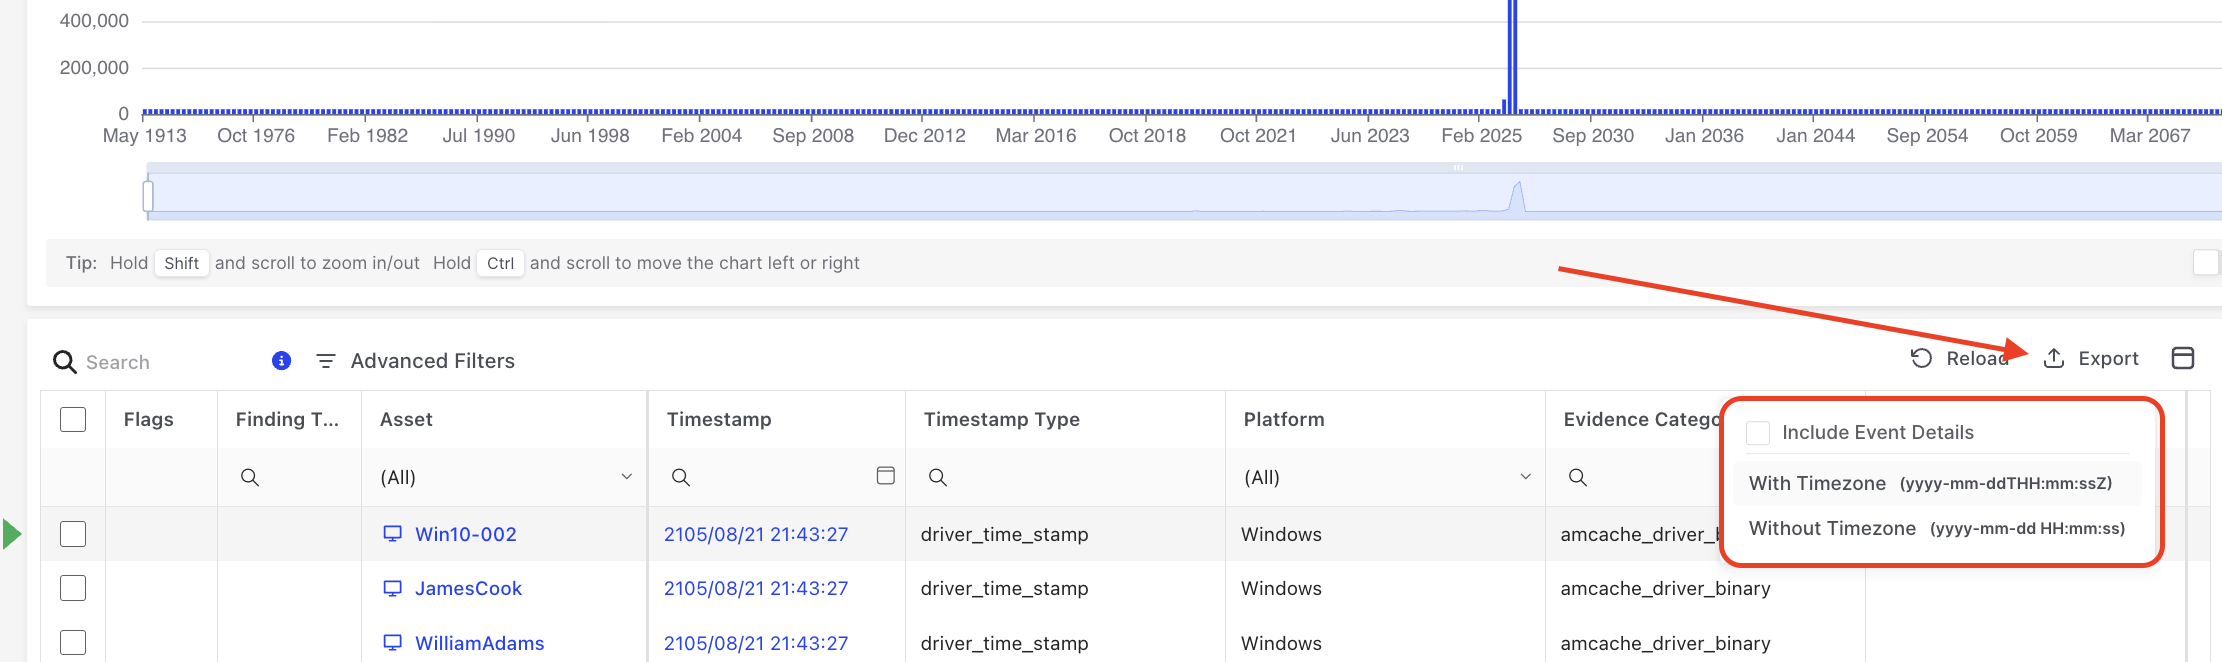
Exporting Timeline Data
Section titled “Exporting Timeline Data”- Select Export from the Timeline table.
- Choose CSV export with UTC or local time.
- Optionally include detailed evidence metadata in JSON format.
- Use exports for compliance reporting or importing into external systems.
Timeline: Export options
Timeline (pre version 5.0)
Section titled “Timeline (pre version 5.0)”One-Click Timeline Creation for Swift Collaboration
Section titled “One-Click Timeline Creation for Swift Collaboration”The traditional way of creating timelines is collecting evidence, parsing it, and combining the results using CSV files. Time is a critical factor in investigations, and with the ‘One-click’ Timeline creation feature, investigators can initiate and collaborate on timelines with just a click. This not only expedites the process but also facilitates remote and multi-user collaboration within a single timeline.
AIR comes to the rescue to solve this problem. You can easily create timelines for multiple assets in parallel and view the results on a collaborative, web-based user interface, where you can tag/flag each piece of evidence.
Timelines can be created from a single asset and can be easily enriched using additional evidence, such as:
- Additional Assets
- CSV Files
- Milestones
- Off-Network Acquisitions
All flagged/tagged evidence is listed in the “Flagged” section, making it easy to create reports before finalizing an investigation.
Building ‘Super-Timelines’ on the Fly
Section titled “Building ‘Super-Timelines’ on the Fly”Flexibility is at the core of effective investigations. With Timeline Analysis, investigators can add more assets at any time to an existing timeline, creating what we like to call ‘super-timelines.’ This dynamic approach enables the consolidation of diverse assets into a comprehensive timeline for a holistic view of the investigation.
Existing and new Timelines can be created by selecting “Timelines” from the Main Menu.
To create a new Timeline, select the “+Add New” button at the top of the page.
The New “Timeline” then gives you the option to ‘Create with selected assets’ or ‘Create an empty timeline and add evidence later’
You can now search for and select the assets desired for the Timeline.
Having selected the assets to include in the Timeline, you now have to define the task by:
- Giving the Timeline a name.
- Allocating it to a Case.
- Selecting a Timezone
- Providing a description (Optional)
Seamless Integration of Offline Assets and CSV Datasets
Section titled “Seamless Integration of Offline Assets and CSV Datasets”Timeline Analysis goes a step further by allowing the import of offline asset acquisitions or CSV datasets into the same timeline. This ensures that investigators can amalgamate a wide range of data sources, enriching the investigative process.
AIR now presents you with three options for adding data to your new Timeline:
- Add an asset
- Add an off-network asset
- Import a CSV file
.png)
Timeline: Select data type to add (Legacy)
Behind the Scenes: Trimmed-Down Evidence Acquisition
Section titled “Behind the Scenes: Trimmed-Down Evidence Acquisition”While Timeline Analysis presents a user-friendly interface, it is supported by a powerful evidence acquisition mechanism behind the scenes. This mechanism selectively includes ‘timestamped evidence,’ ensuring a concise and relevant timeline. By default, this includes:
- All evidence with a timestamp property
- Browsing history
- AMCache
- SRUM data
Precision Flagging for Enhanced Evidence Management
Section titled “Precision Flagging for Enhanced Evidence Management”Timeline Analysis introduces the concept of multiple flags for evidence items. Investigators can flag items to highlight their significance, and all flagged items are conveniently listed in the ‘Flagged Evidence’ section. This section can be filtered, providing a focused view of critical evidence.
Enrich Timelines with Manually Inserted ‘Milestones’
Section titled “Enrich Timelines with Manually Inserted ‘Milestones’”Significant events often mark investigations, and Timeline Analysis acknowledges this by allowing investigators to manually insert ‘milestones’. These milestones serve as markers for noteworthy occurrences during the investigation.
In conclusion, Timeline Analysis is not just a feature; it’s a comprehensive solution for investigators seeking precision, flexibility, and collaboration in their digital investigations. With ‘One-click’ Timeline creation, the ability to build ‘super-timelines,’ integration of diverse data sources, manual milestones, streamlined reporting, and precise flagging, investigators can confidently navigate the complexities of digital evidence.