

Resource Limits
AIR Responders run on production endpoints, so evidence collection must not disrupt the workloads running on them. Resource Limits cap how much of an asset’s resources the Responder may consume while executing tasks such as evidence acquisitions, Hunt/Triage scans, disk imaging, and interACT sessions.
- Limits apply while a task runs. An idle Responder consumes negligible resources and does not need throttling. See Responder Architecture Overview and Performance Analysis for measured footprints.
- Limits are enforced on the asset itself. The Responder applies each limit at the operating-system level while the task runs.
Where to configure
Section titled “Where to configure”Resource Limits are part of Policies:
- Go to Settings > Policies, create or edit a policy, and open the Resource Limits section.
- Assign the policy to the organizations it should govern. When several policies match an asset, they merge in priority order, and the read-only Default Policy fills in any value left unset, so every task runs with a complete resource configuration.
Operators can also bypass policy values for a single task by choosing Use Custom Options under Show Advanced Options when creating the task. This requires the Override Policy privilege. Task types expose only the limits that are relevant to them; for example, disk imaging tasks expose bandwidth and disk I/O priority rather than CPU limits.
When Policies are disabled
Section titled “When Policies are disabled”Policies can be turned off for the whole Console under Settings > Policies. With Policies disabled, task creation no longer offers the policy-based option, and operators configure each task through Use Custom Options instead.
Disabling Policies does not remove Resource Limits, and it does not make them unlimited. The Console still sends its product defaults to the Responder with every task, so tasks continue to run with a complete resource configuration. At a minimum, these defaults still apply:
- CPU Limit: 50%
- Memory Limit: 4 GiB, on the task types that support it
- Max Execution Time: 7 days
A limit is only unlimited when you set it to 0 yourself in custom options, and only for the settings where the product treats 0 as unlimited. Turning Policies off is not the same as entering 0, and it is not the same as leaving a limit out of the task.
See Policies (Console Settings) for the Console-wide enable and disable behavior.
Available limits
Section titled “Available limits”| Setting | Unit and range | Default | When the limit is reached |
|---|---|---|---|
| CPU Limit | Percent of the asset’s total CPU capacity, 1-100 | 50% | The task is throttled and takes longer; it does not fail |
| CPU Core Limit | Logical core count, 0-64 (0 = unlimited) | Unlimited | Task work is confined to fewer cores; the task takes longer |
| Memory Limit | GiB or MiB, minimum 512 MiB (0 = unlimited) | 4 GiB | The operating system terminates the task’s processes and the task is reported as failed, protecting the asset |
| Bandwidth | KiB/s, MiB/s, or GiB/s (0 = unlimited) | Unlimited | Evidence transfers wait for available bandwidth; nothing fails |
| Disk Space | Free space to preserve on the collection volume, in KiB, MiB, or GiB | Not set | Collection stops; evidence collected so far is still uploaded, and the task reports the disk-space condition |
| Disk I/O Priority | Lowest / Low / Medium / High | Medium | No threshold to reach; this setting adjusts I/O scheduling priority |
| Process Priority | Low / Medium / High | Medium | No threshold to reach; this setting adjusts CPU scheduling priority of the Responder’s collection work |
| Max Execution Time | Days, hours, or minutes (0 = unlimited) | 7 days | The Responder cancels the task; it is reported as Cancelled with a reason naming the limit, and the next queued task starts |
How each limit works
Section titled “How each limit works”CPU Limit
Section titled “CPU Limit”The CPU limit is a percentage of the asset’s total CPU capacity across all logical cores. On an 8-core asset, a 50% limit allows the task to use up to four cores’ worth of CPU time, spread across all cores.
The Responder applies the limit to the entire task, including the collection engine and any analysis child processes. A lower limit also reduces how much work the task attempts in parallel.
When the limit is reached, the task runs slower. A CPU limit never causes a task to fail.
CPU Core Limit
Section titled “CPU Core Limit”The CPU core limit restricts how many logical cores a task may use, independently of the CPU percentage. On Windows and Linux, the task is confined to the allowed number of cores. On macOS and AIX, the same limit is applied as the equivalent share of the asset’s total CPU capacity.
A value of 0 means unlimited. Like the CPU limit, the core limit slows work down; it never aborts a task.
Memory Limit
Section titled “Memory Limit”Some customers run Responders on assets where resource isolation is a security and safety requirement. The memory limit gives you a predictable ceiling on how much memory each task may use, so even rare memory spikes are bounded and cannot disrupt business-critical workloads. This is a proactive safety control rather than a fix for a common memory issue.
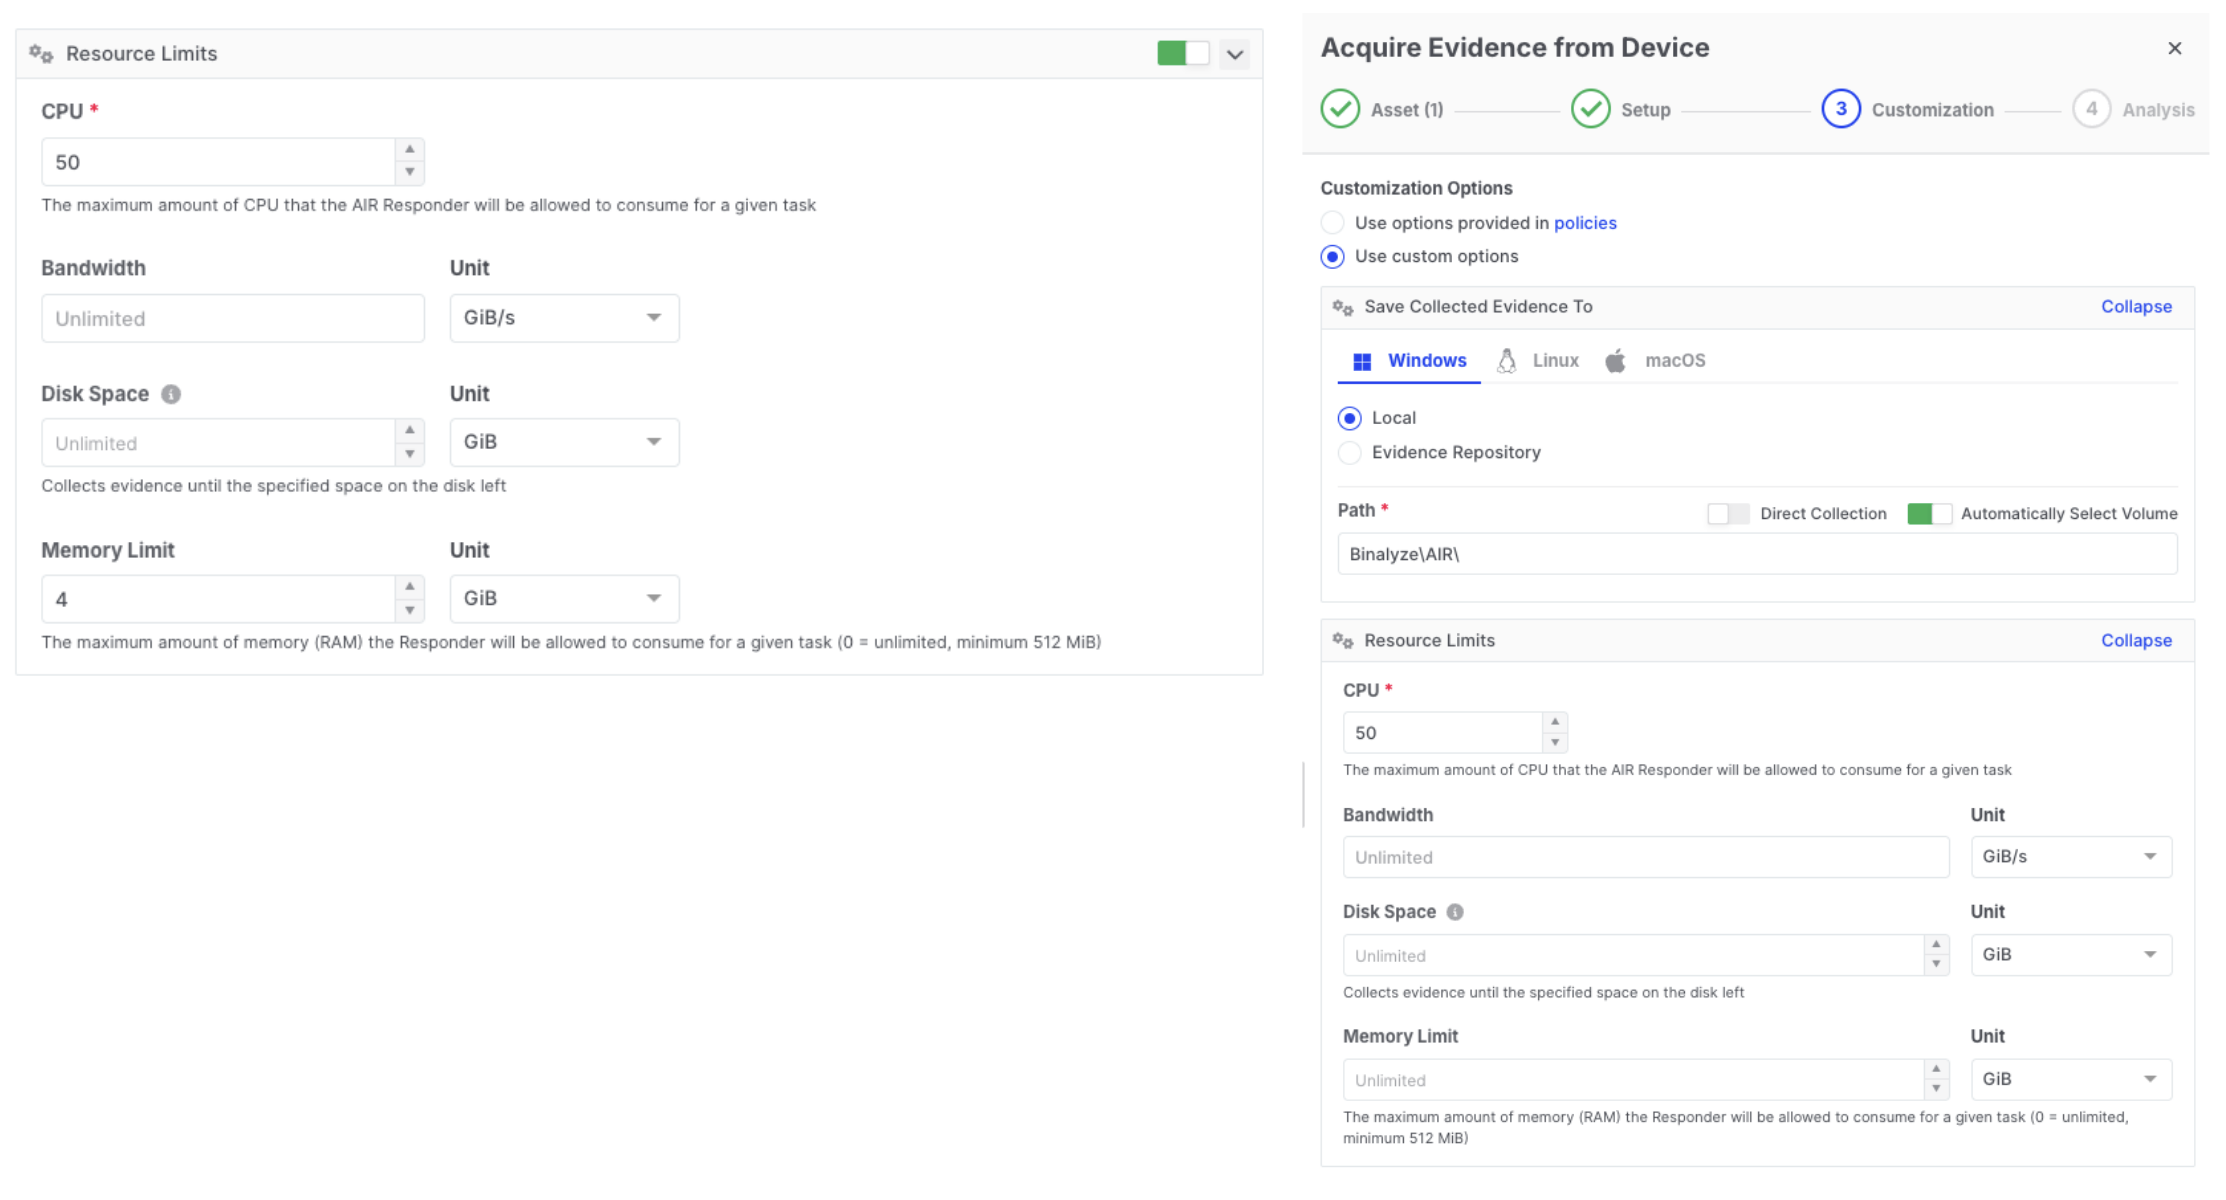
Resource Limits: Memory Limit setting
- The Responder enforces the limit at the operating-system level.
- The limit covers the task’s entire process tree, including collection and analysis child processes.
- If a task exceeds its memory limit, the operating system terminates the limited process tree. The task is reported as failed with a memory-related cause, and the asset is protected from resource exhaustion.
- For interACT, the limit is applied when the session starts; a changed limit takes effect with the next session.
The default is 4 GiB. The minimum enforceable limit is 512 MiB, and 0 means unlimited.
Bandwidth
Section titled “Bandwidth”The bandwidth limit throttles evidence transfers. It applies to:
- Evidence uploads to every repository type (SMB, SFTP, FTPS, Amazon S3, Azure Storage, Google Cloud Storage, and others)
- Disk image streams
- interACT file transfers
- Large content downloads
Routine Responder-to-Console communication (polling, status updates) is lightweight and unaffected. In addition, a Responder uploads to a given evidence repository one file at a time, which prevents a single asset from opening many parallel streams against the same repository.
When the limit is reached, the transfer waits until bandwidth is available. A bandwidth limit never causes a task to fail; it only extends transfer time.
Disk Space
Section titled “Disk Space”The disk space setting reserves an amount of free space that must remain available on the volume hosting the collection directory. The Responder checks free space before collection starts and re-checks it continuously while evidence is being written.
If free space would drop below the reserve:
- Collection stops rather than filling the volume.
- Evidence collected up to that point is still packaged and uploaded.
- The task reports the disk-space condition, either as a failed collection or as partial evidence when only optional content was skipped.
Even when no reserve is configured, the collection engine keeps a built-in minimum safety margin of roughly 100 MB of free space.
Disk I/O Priority
Section titled “Disk I/O Priority”Disk I/O priority controls how the Responder’s disk operations compete with other workloads, using each operating system’s native I/O priority mechanism. It does not cap throughput.
Medium is an explicit, slightly reduced I/O priority on Windows, Linux, and macOS, not a neutral setting: the Responder applies a low I/O priority hint on Windows, best-effort level 5 on Linux, and the passive I/O policy on macOS. AIX has no disk I/O priority mechanism, so the setting has no effect there. Low and Lowest demote further on platforms that expose more steps, and High raises the Responder’s disk operations toward normal or above where the platform allows it. The selected level remains in effect until another task applies a different one.
Process Priority
Section titled “Process Priority”Process priority controls the CPU scheduling priority of everything the Responder runs for a task: the collector processes it starts (the evidence collection engine, analyzers, scanners, and the interACT shell) as well as its own worker threads for compression, upload, scanning, and housekeeping. It does not cap throughput — it decides how the Responder competes with other workloads for CPU time.
- Medium is the default and keeps the Responder’s long-standing behavior: collection work runs one step below normal priority, using the Below Normal priority class and background thread mode on Windows,
nice5 on Linux and macOS, and the Utility QoS class on macOS. - Low demotes further where the operating system offers a lower step: collector processes get
nice10 on Linux and macOS, and the Responder’s own worker threads getnice10 on Linux. On Windows, Low and Medium share the same Below Normal class. - High stops demoting, so work runs at the operating system’s normal priority. The Responder never raises priority above normal.
The selected level remains in effect until another task applies a different one, the same sticky model as Disk I/O Priority.
Process Priority is not a substitute for the CPU limit: CPU Limit caps how much CPU the task may use, while Process Priority decides who wins when CPU is contended.
Max Execution Time
Section titled “Max Execution Time”Max Execution Time bounds how long a single evidence-collection task may run on an asset. Every other limit slows a task down; this one is a time budget. It exists for the rare task that stops making progress, for example one blocked behind an unresponsive network share or a stalled upload, so that it cannot hold the asset’s collection queue indefinitely and delay every task scheduled after it.
- Applies to evidence-collection tasks: acquisitions, Hunt/Triage scans, full-text searches, investigation and baseline acquisitions, and auto-tagging. Disk imaging, interACT sessions, isolation, log retrieval, and Responder updates are not affected. interACT has its own per-session time limit.
- Measured from the moment the task starts running on the asset. Time spent waiting in the queue does not count.
- When the limit is reached, the Responder cancels the task exactly as a manual cancellation would: the task’s processes are stopped, the asset’s collection queue moves on to the next task, and the task is reported to the Console as Cancelled. Unlike a manual cancellation, the task’s details in the Console show the reason: the task exceeded its execution time limit. Whatever the task produced up to that point is handled as it is for any cancelled task.
- The default is 7 days. Set the value in days, hours, or minutes.
0means unlimited; a task with no limit runs until it finishes.
Choose the limit from the longest legitimate task on that asset class, not from the typical one. Full-disk acquisitions on large volumes and broad Hunt/Triage sweeps can legitimately run for hours; a limit shorter than that turns a slow but healthy collection into a cancelled one. The Console warns when the value is below 15 minutes.
Built-in protections
Section titled “Built-in protections”The following protections and safe defaults limit disruption on the asset:
- Evidence-collection tasks run one at a time per asset. Acquisitions, Hunt/Triage scans, full-text searches, and similar collection tasks queue and execute sequentially, so two heavy collections do not run at the same time. Operational task types (disk imaging, interACT sessions, isolation) have their own queues and can run alongside when requested. Because the queue is sequential, a task that never finishes would block every task behind it; Max Execution Time is the policy control for that case.
- Task processes run at reduced CPU and I/O priority by default. The reduction comes from the policy defaults (Process Priority Medium and Disk I/O Priority Medium) and can be tuned, so under the defaults interactive and business workloads take precedence.
- A minimum free-disk safety margin of roughly 100 MB applies to every collection, even with no configured reserve.
Tuning guidance for sensitive environments
Section titled “Tuning guidance for sensitive environments”The defaults are safe starting points for most fleets. Environments with stricter requirements, such as banking systems, critical infrastructure, and healthcare, can use the profiles below as starting points. Validate them on representative assets before rolling them out fleet-wide.
Latency-sensitive, user-facing production systems (branch workstations, terminal servers, trading systems, operator consoles):
- CPU Limit 25-40%, CPU Core Limit 1-2
- Disk I/O Priority Low or Lowest
- Process Priority Low
- Bandwidth capped to a fraction of the site uplink (for example 10-20 MiB/s per asset on a 1 Gbps site)
- Disk Space reserve of at least 10% of the collection volume
- Schedule broad Hunt/Triage sweeps off-peak
Keep the 4 GiB memory default, or lower it toward 2 GiB only after observing typical task memory usage on that asset class.
Shared infrastructure (domain controllers, database servers, virtualization hosts): prioritize storage protection. Disk I/O Priority Lowest and a firm bandwidth cap matter more than the CPU value. Schedule collections off-peak where possible.
Active incident response: raise the CPU limit to 80-100%, leave cores unlimited, set Process Priority High, and remove the bandwidth cap. Use a dedicated response policy or per-task custom options so the change is easy to revert.
Coexisting with EDR and antivirus
Section titled “Coexisting with EDR and antivirus”Resource Limits reduce contention with other security tooling, but they do not replace exclusions:
- Configure your EDR/AV exclusions for the Responder as described in Responder Exception Rules. Real-time scanning of evidence archives as they are written adds load that is outside the Responder’s own accounting.
- Throttled tasks trade a short burst of activity for a longer window of low activity. If your EDR alerts on the Responder’s collection behavior, tune the exclusions rather than removing limits.
Monitoring
Section titled “Monitoring”- Console: each asset’s detail page shows periodic host CPU, RAM, and disk usage reported by the Responder. Task durations and statuses reveal the effect of limits; failure causes explicitly name memory and disk-space conditions, and a task cancelled by Max Execution Time names the limit as its reason.
- Responder logs: the Responder periodically logs its own resource snapshots while a task runs. See Responder Architecture Overview and Performance Analysis for how to read them.
- On the asset: standard OS tools (Task Manager,
htop, Activity Monitor) show the Responder and its task processes, which run under the configured limits and at reduced priority.
Does a 50% CPU limit mean half of one core? No. The percentage refers to the asset’s total CPU capacity across all logical cores. On an 8-core asset, 50% allows up to four cores’ worth of processing, spread across all cores.
What is the difference between CPU Limit and Process Priority? CPU Limit caps how much CPU the task may use, whatever else is happening on the asset. Process Priority does not cap anything; it decides who wins when the CPU is contended. Use CPU Limit to bound the Responder’s share, and Process Priority to control whether other workloads are served first.
Can Process Priority make the Responder starve or hang? No. The lowest available level is one step below normal priority, and there is no idle-only level, so collection keeps progressing even on a busy host — it simply takes longer.
Does the Responder consume resources when no task is running? No meaningful amount. Resource Limits govern task execution; the idle Responder’s footprint is negligible.
We disabled Policies in Settings. Do tasks now run without resource limits? No. Disabling Policies changes where a task’s options come from, not whether limits exist. Tasks are created with Use Custom Options, and the Console still sends its product defaults to the Responder, including a 50% CPU limit and a 7-day Max Execution Time.
On the task types that support it, the 4 GiB memory limit still applies as well.
Does setting Bandwidth or Disk Space to 0 disable protection?
0 means unlimited for both settings. For disk space, the collection engine still preserves its built-in minimum free-space margin of roughly 100 MB.
Can a resource limit make my task fail? CPU, core, and bandwidth limits never fail a task; they slow it down. The disk-space reserve stops a collection that would exhaust the volume, and the evidence collected up to that point is still uploaded.
Max Execution Time does not fail a task either; a task that exceeds it is cancelled and reported as Cancelled with the limit as the reason.
The memory limit is the one deliberate exception: a task that exceeds it is terminated by the operating system and reported as failed. This protects the asset from memory exhaustion.
How do I tell a task cancelled by Max Execution Time from one an operator cancelled? Both show as Cancelled. Open the task’s details on the assignment: a task stopped by the limit shows a reason stating that it exceeded its execution time limit, while a manual cancellation shows no such reason.
Does Max Execution Time apply to disk imaging or interACT? No. It governs the evidence-collection queue only. Disk imaging runs on its own queue, and interACT sessions have their own per-session time limit.
Can several heavy tasks run at the same time on one asset? Evidence-collection tasks queue and run one at a time. Disk imaging, interACT, and isolation use separate queues, so an imaging task can run alongside an acquisition if you start both. Plan bandwidth and disk I/O priority accordingly.
Are limits enforced identically on every operating system? Tasks stay within their limits on every supported platform. The Responder uses each platform’s native controls; platform-specific notes are called out in the relevant sections above.
Will a disk imaging task saturate my storage or network? Imaging tasks honor the Bandwidth limit on the image stream and the Disk I/O Priority setting. Set both when imaging assets attached to shared storage.
Will a YARA Hunt/Triage scan spike CPU? The CPU limit applies to scans as well, so a limited scan runs shallower and longer instead of spiking. Narrow the scan scope with Hunt path patterns to reduce total work.