

Terminology
Acquisition Profile
Section titled “Acquisition Profile”A collection of evidence types, application artifacts, network captures, and custom content items grouped into reusable sets known as Acquisition Profiles. While several profiles are provided out-of-the-box, users can also create and customize their own, adding them to the Acquisition Profile Library, accessible via the Main Menu.
AIR Console
Section titled “AIR Console”The AIR Console is a web-based management interface that enables users to efficiently manage assets, assign tasks, and oversee the entire investigation lifecycle. From evidence acquisition to in-depth analysis, report generation, and case management, all activities are streamlined through the Investigation Hub. Users can also personalize their experience by switching between light and dark modes via the main menu, enhancing usability and visual comfort.
Asset and Asset Status
Section titled “Asset and Asset Status”In AIR, an asset is defined as any entity—whether a device, system, cloud account, or forensic image—on which AIR can perform evidence collection, task execution, and forensic analysis. Assets are the foundational elements crucial for responding to and hunting cyber threats.
Asset Categories
Section titled “Asset Categories”The Asset section in AIR organizes assets into three distinct categories, each with its own tree view, filters, and tailored data grid columns:
Devices
Physical or virtual machines that AIR can task directly. This category includes:
- Computers — Traditional endpoints such as workstations and servers running Windows, macOS, Linux, Chrome, IBM AIX, or ESXi
- Cloud Devices — Virtual machines hosted on cloud platforms (Amazon AWS, Microsoft Azure, Google Cloud Platform) with deployed responders
Devices are the systems that receive tasking assignments through a deployed responder. Stale Asset Policies evaluate Devices, including Cloud Devices.
Disk Images
Imported forensic images (RAW, E01, VMDK, VHD/X) mounted for analysis via the File Explorer. Disk images represent evidence sets captured from systems—either by AIR or third-party tools—that can be browsed, searched, and analyzed without requiring a live connection. Disk Images are out of scope for Stale Asset Policies.
Cloud
Cloud accounts and tenants integrated for cloud evidence gathering, such as Microsoft 365 or Google Workspace. Unlike Cloud Devices (which are VMs with responders), the Cloud category represents account-level access for collecting cloud-native evidence like emails, files, and audit logs. These accounts do not run a responder and are not evaluated by Stale Asset Policies.
Managed Status
Section titled “Managed Status”Managed Status is the column, filter, and API field that describes an asset’s relationship with the AIR console. It is derived from two facts only: whether a responder is installed on the asset, and whether the console holds evidence for it.
- Managed: A responder is installed on the asset. The asset can be online, offline, or Unreachable and still remain Managed.
- Unmanaged: No responder is installed and the console holds no evidence for the asset. A typical example is a computer discovered through an Active Directory or Cloud Account scan that never received a responder.
- Off-Network: No responder is installed, but the console holds evidence for the asset — collected through an Off-Network acquisition, an Off-Network Hunt/Triage task, or imported evidence. Investigation of the existing data is possible, and additional data can be manually imported as required.
Unreachable and other asset states
Section titled “Unreachable and other asset states”The Assets Summary window on the home page can also report the asset as:
- Unreachable: The asset has not checked in for longer than its unreachable threshold. AIR compares the asset’s Last Seen value with the threshold from the Stale Asset Policy that owns it — the first matching enabled custom policy, or the Default policy when no custom policy claims the asset. Until someone changes it, the Default policy uses 30 days. Unreachable clears as soon as the asset checks in again, an asset with no Last Seen value is never shown as Unreachable, and crossing the threshold does not remove the asset by itself.
- Update Required: The responder on the asset requires an update to function correctly.
- Update Advised: The responder is still functional, but for full functionality, an update is recommended.
- Isolated: The asset is currently isolated from the network, except for communication with the AIR console. An isolated Managed device that becomes Unreachable still counts as Managed.
Asset Management - Using Persistent Saved Filters
Section titled “Asset Management - Using Persistent Saved Filters”Persistent Saved Filters enable users to create and store custom asset filters, making it easier to locate and manage assets without having to reapply filter conditions in each session.
Filters that use Managed Status follow the same rules as the column. Filtering for Managed returns every asset with a responder installed, including devices that are currently Unreachable. Filtering for Unmanaged no longer returns silent devices that still have a responder installed.
A Case
Section titled “A Case”In AIR, a Case — can often be thought of simply as an ‘investigation’ — as it is where all related activity and evidence are grouped together. By collecting acquisitions, DRONE findings, timelines, interACT sessions and hunt results within a single case, AIR automatically builds a unified view of all of that activity in the Investigation Hub. This case-based approach gives investigators a clear, consolidated picture of their entire investigation in one place — the single pane of glass.
Evidence Item
Section titled “Evidence Item”In AIR, evidence refers to any data collected from an asset during acquisition or triage that supports forensic investigation and incident response. This may include system metadata, logs, configuration information, user-activity traces, or other information useful in reconstructing events.
AIR organizes all collectible data into evidence items, each of which belongs to one of the defined evidence categories in the acquisition profile. An evidence item represents a specific data source with a clear description of what it contains and why it is relevant for investigation.
The current evidence categories are:
1. System - Core operating system information, including system configuration, environment details, and fundamental OS state.
2. Memory - Volatile memory sources such as RAM snapshots, memory sections, and other data that reflect live system state at the time of acquisition.
3. Network - Network-related evidence including connections, configurations, interface details, and network activity indicators.
4. Event Logs - Structured logs generated by the operating system that record authentication events, system changes, service activity, and other audit information.
5. Disk & File System - File system metadata, mount points, directory information, file activity indicators, and other disk-level sources that reflect how data is organized and accessed.
6. Applications - Evidence produced by installed or active applications, including logs, caches, configuration files, usage traces, and other application-specific data sources.
7. Custom Content - Items defined directly by the user based on file paths or directories of interest. This allows investigators to collect additional files or folders that fall outside the standard evidence set.
8. osquery - Items collected by executing osquery queries on the asset. These provide structured, table-driven insights into system and application state using the osquery framework.
Evidence Repository
Section titled “Evidence Repository”A remote location for saving evidence collected as a result of an AIR tasking. These include:
- SMB
- SFTP
- FTPS
- Amazon S3
- S3 Compatible
- Azure Blob
- Google Cloud Storage (GCS)
- Box
- Network Shares
To create a New Repository, go to Settings in the Main Menu and select Evidence Repositories from the secondary Menu. From the window ‘New Repository’ complete the mandatory fields and select the type of repository you wish to add.
Read more details about Evidence Repositories here.
Organizations
Section titled “Organizations”In AIR, an organization is a structural entity that allows for the separation of assets, users, and cases within a multi-tenant environment. The multi-tenancy capability of AIR enables a single console to manage multiple organizations, each with its own isolated environment. Here’s how it works:
- Asset Management: An asset (e.g., a device or endpoint) can belong to only one organization, ensuring clear boundaries between different organizational environments. However, within that organization, the same asset can be assigned to multiple cases.
- Case Management: Cases could perhaps also be called ‘investigations’ or ‘incidents’, and they are also aligned to a specific organization. Access to cases can be restricted based on user privileges within that organization.
- Global and Organization-Specific Settings: Certain settings, such as policies and evidence repositories, can be configured globally across all organizations or individually for each organization. This flexibility allows administrators to enforce global standards while still providing the ability to customize configurations at the organizational level when required.
- Policies and Evidence Repositories: Policies can be applied either globally or on an organization-by-organization basis. For example, evidence repositories, which store collected data, can be aligned to all organizations (global) or set up uniquely for each organization, allowing for localized data control.
This multi-tenant architecture in AIR enables organizations to operate independently within the same platform, benefiting from both shared resources and isolated environments, depending on their specific needs.
Stale Asset Policies are an exception to the per-organization pattern: they are configured once under Settings > Stale Assets > Policies. A custom policy can target specific organizations through its filter, and any Device that no custom policy claims is governed by the Default policy. These are not acquisition policies — the two are configured and evaluated separately.
Real-Time User Online Status Indicators
Section titled “Real-Time User Online Status Indicators”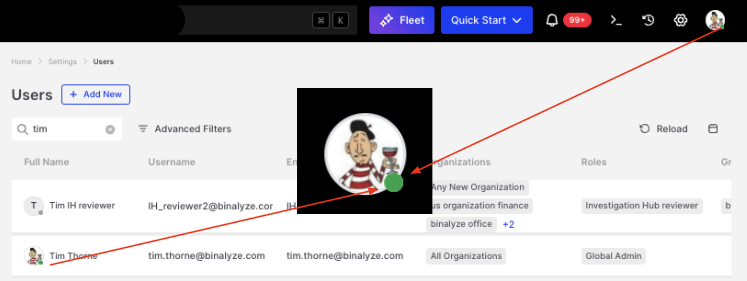
Terminology: Real-Time User Online Status Indicators
User real-time status is shown throughout the AIR via colored dots—green for online, gray for offline—helping teams coordinate more effectively across the platform.
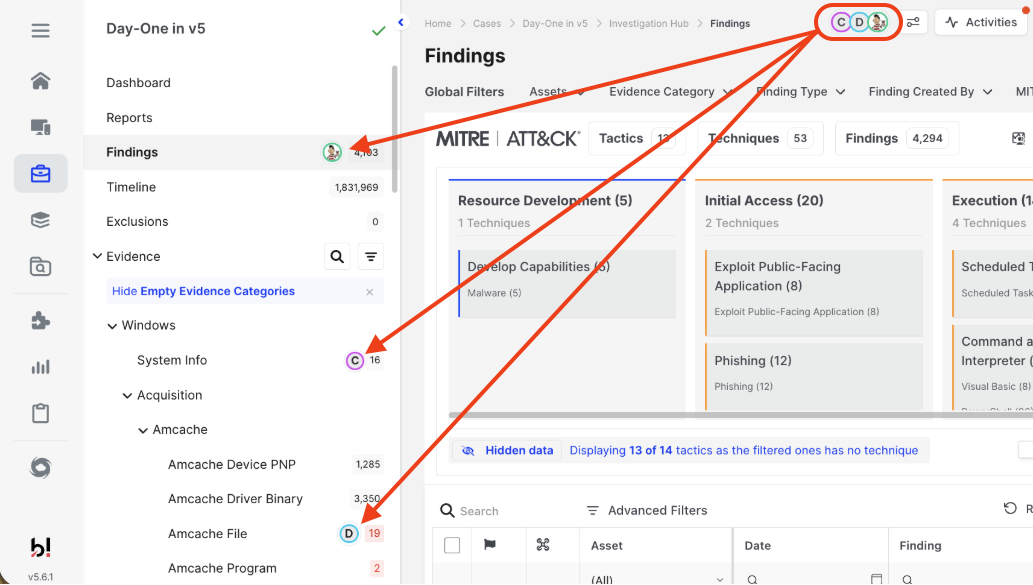
This live collaboration capability extends to the Investigation Hub where investigators can see real-time user presence, track comment updates, and observe evidence flag changes as they happen. These live updates allow multiple investigators to work simultaneously on the same evidence without needing to refresh the view. Every action—whether adding notes, updating findings, or adjusting flags—appears instantly for all connected users, creating a fully synchronized collaborative workspace within the Investigation Hub.
Terminology: Real time user presence in the Investigation Hub
In the Investigation Hub screenshot above, you can see that three users are currently active in this case. Their profile icons indicate not only who is present, but also where each person is working in real time. In this example, one user is viewing the Findings page, another is focused on the System Info evidence, and a third is examining the Amcache File evidence. This provides instant visibility into team activity and helps avoid duplication of effort during collaborative investigations.
Responder
Section titled “Responder”The AIR responder is a compact, cross-platform, zero-dependency, and zero-configuration package that functions as a virtual incident responder, delivering Level 3–4 SOC expertise directly to your assets.
Unlike ‘agents’ that constantly monitor systems and consume significant resources, AIR responders only activate to perform precise, user-defined DFIR tasks on demand. This approach enables the deployment of thousands of virtual responders across your IT ecosystem, ready to execute proactive and reactive incident response activities, such as evidence collection, threat hunting, and forensic-level analysis, as needed.
Binalyze’s approach prioritizes efficient security enhancement, marrying minimal asset impact with maximum readiness and incident response capability.
If a responder stops checking in, the asset can become Unreachable once it passes the threshold of the Stale Asset Policy that owns it. That does not change the asset’s Managed Status — the responder is still installed, so the asset stays Managed. Depending on the policy action, AIR can later purge the console record and optionally uninstall the responder on its next check-in.
Read more here: Responder Deployment
Stale Asset Policy
Section titled “Stale Asset Policy”A Stale Asset Policy is a named rule that decides when a Device is considered stale and what AIR should do about it: do nothing, purge the Device from the console, or purge it and uninstall the responder.
AIR ships with one Default policy, which applies to every Device that no custom policy claims. Until someone changes it, the Default policy uses a 30-day threshold and the Do nothing action. Custom policies are evaluated top to bottom, and the first enabled policy that matches a Device owns it.
Policies are managed under Settings > Stale Assets > Policies. The policy that owns a Device also supplies the threshold AIR compares against the Device’s Last Seen value to decide whether it is Unreachable.
Operations are assigned to the assets by the AIR console, either manually or automatically via a trigger. A task can be assigned to multiple assets, and this is managed through ‘task assignments.’ Each individual assignment, known as a ‘task assignment,’ creates a one-to-one correspondence between the task assigned by the console and the specific asset on which the task assignment is executed, ensuring precise management and tracking across all assigned tasks.
Tasks could be either:
- Manual: Assigned manually by users,
- Scheduled: Created by users to start at a future date. Scheduled tasks can be either one-time or recurring (daily, weekly, or monthly).
- Triggered: Assigned to the assets as a response to a trigger request, which is sent by a SIEM/SOAR/EDR solution.
If a responder does not collect a task assignment within 30 days of the assignment being created, the assignment expires and is not actioned even when the asset reconnects. This 30-day expiry is a task lifetime and is separate from the unreachable threshold set by a Stale Asset Policy.
Triggers (Webhooks)
Section titled “Triggers (Webhooks)”Triggers are the primary extensibility mechanism for AIR to receive alerts from other security suites, such as SIEM, SOAR, and EDRs.
A trigger is the combination of a parser, an acquisition profile, and a destination for saving the collected evidence (either local or remote).
AIR takes this to the next level by allowing the trigger to further automate the post-acquisition analysis by leveraging DRONE and MITRE&CK scanners. In effect, the alert from your security tools can launch AIR into the collection of relevant forensic data, facilitate the analysis of that data, and deliver any DFIR findings into the Intelligence Hub with no analyst intervention required.
Hunt/Triage
Section titled “Hunt/Triage”Hunt/Triage in AIR refers to searching for indicators of compromise, such as file hashes, processes, or malicious domains, across assets at scale. AIR provides built-in YARA, Sigma, and osquery capabilities, enabling analysts to detect anomalies in live systems, memory, and logs. Users can write their own rules or import large rule sets for rapid deployment, all of which are centrally stored and managed in the AIR Libraries to ensure consistency and collaboration across investigations.
A modal is a user interface element that appears as an overlay on top of the main AIR Console interface. Modals temporarily focus user attention on a specific task or workflow, requiring interaction before returning to the main view.
In AIR, modals typically present step-by-step wizards that guide users through multi-stage processes such as:
- Task creation — configuring acquisition, imaging, or hunt/triage tasks
- Scheduled task setup — defining when and how often tasks should run
- Responder deployment — selecting deployment method and configuration options
- Report generation — customizing and exporting investigation reports
Modals ensure that complex workflows are completed in a structured sequence, reducing errors and simplifying the user experience.